march 2018 reservoir storage* · texas water conditions report 1700 n. congress ave., p.o. box...
TRANSCRIPT

Texas
Water
Conditions
Report
1700 N. Congress Ave., P.O. Box 13231, Austin, TX 78711-3231
Telephone (512) 463-7847 Fax (512) 936-0816 1-800-RELAYTX (for the hearing impaired)
www.twdb.texas.gov
March 2018 RESERVOIR STORAGE*
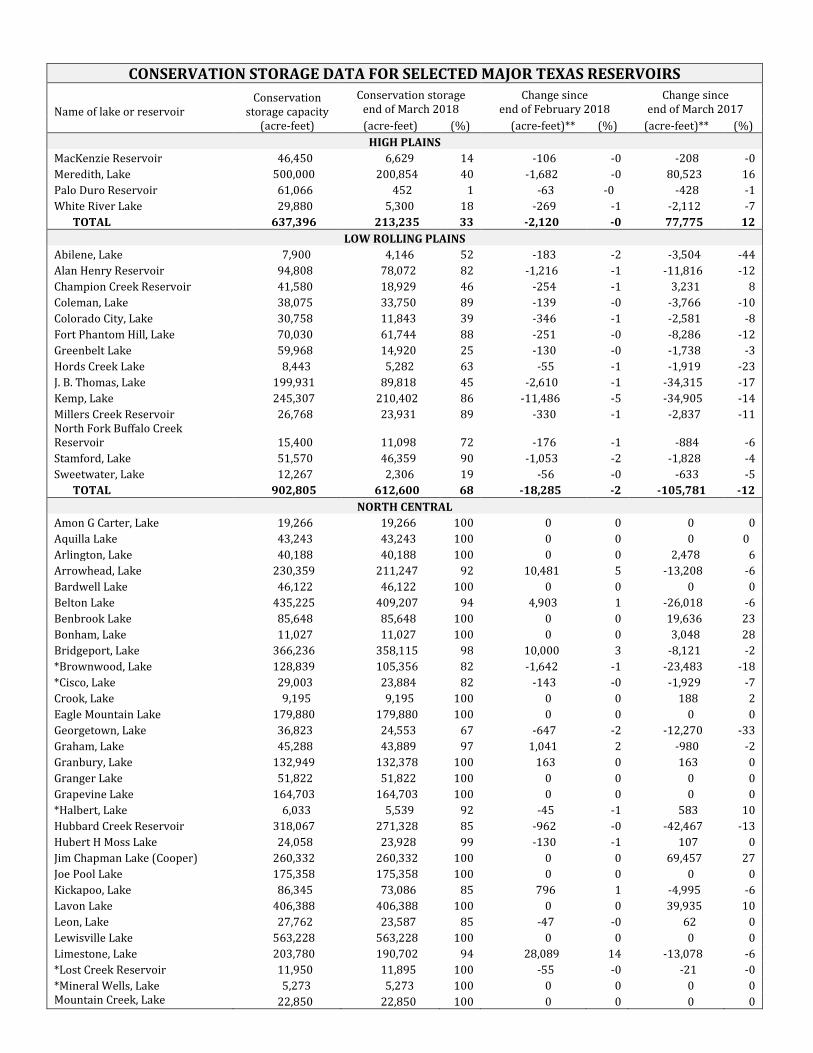
At the end of March 2018, total conservation storage* in 118 of the state’s major water supply reservoirs was 26.99 million acre-feet or 84 percent of total conservation storage capacity. This is approximately 0.08 million acre-feet less than a month ago but 0.1 million acre-feet more than storage at this time last year. Fifty-one (51) reservoirs held 100 percent of conservation storage capacity, primarily in the North Central (29 reservoirs) and East (20 reservoirs) regions. Two reservoirs, Palo Duro (1 percent) and Twin Buttes (7 percent) remained below 10 percent full. Total combined storage was at or above normal (storage ≥70 percent) in the East (100 percent), North Central (97 percent), Upper Coast (91 percent), and South Central (82 percent) regions. The High Plains (33 percent) and Trans-Pecos (30 percent) regions had the lowest percentage of storage. Overall, storage increased in two and decreased in seven regions over the past month.
*Storage is based on end of the month data in 118 major reservoirs that represent 96 percent of the total conservation storage capacity of 188 major water supply reservoirs in Texas plus Elephant Butte reservoir in New Mexico. Major reservoirs are defined as having a conservation storage capacity of 5,000 acre-feet or greater. Only the Texas share of storage in border reservoirs is counted.

MARCH 2018 RESERVOIR CONDITIONS
*Reservoir Storage Index is defined as the percent full of conservation storage capacity.
CONSERVATION STORAGE DATA FOR SELECTED MAJOR TEXAS RESERVOIRS
Name of lake or reservoir
Conservation storage capacity
(acre-feet)
Conservation storage end of March 2018
Change since end of February 2018
Change since end of March 2017
(acre-feet) (%) (acre-feet)** (%) (acre-feet)** (%)
HIGH PLAINS
MacKenzie Reservoir 46,450 6,629 14 -106 -0 -208 -0
Meredith, Lake 500,000 200,854 40 -1,682 -0 80,523 16
Palo Duro Reservoir 61,066 452 1 -63 -0 -428 -1
White River Lake 29,880 5,300 18 -269 -1 -2,112 -7
TOTAL 637,396 213,235 33 -2,120 -0 77,775 12
LOW ROLLING PLAINS
Abilene, Lake 7,900 4,146 52 -183 -2 -3,504 -44
Alan Henry Reservoir 94,808 78,072 82 -1,216 -1 -11,816 -12
Champion Creek Reservoir 41,580 18,929 46 -254 -1 3,231 8
Coleman, Lake 38,075 33,750 89 -139 -0 -3,766 -10
Colorado City, Lake 30,758 11,843 39 -346 -1 -2,581 -8
Fort Phantom Hill, Lake 70,030 61,744 88 -251 -0 -8,286 -12
Greenbelt Lake 59,968 14,920 25 -130 -0 -1,738 -3
Hords Creek Lake 8,443 5,282 63 -55 -1 -1,919 -23
J. B. Thomas, Lake 199,931 89,818 45 -2,610 -1 -34,315 -17
Kemp, Lake 245,307 210,402 86 -11,486 -5 -34,905 -14
Millers Creek Reservoir 26,768 23,931 89 -330 -1 -2,837 -11 North Fork Buffalo Creek Reservoir 15,400 11,098 72 -176 -1 -884 -6
Stamford, Lake 51,570 46,359 90 -1,053 -2 -1,828 -4
Sweetwater, Lake 12,267 2,306 19 -56 -0 -633 -5
TOTAL 902,805 612,600 68 -18,285 -2 -105,781 -12
NORTH CENTRAL
Amon G Carter, Lake 19,266 19,266 100 0 0 0 0
Aquilla Lake 43,243 43,243 100 0 0 0 0
Arlington, Lake 40,188 40,188 100 0 0 2,478 6
Arrowhead, Lake 230,359 211,247 92 10,481 5 -13,208 -6
Bardwell Lake 46,122 46,122 100 0 0 0 0
Belton Lake 435,225 409,207 94 4,903 1 -26,018 -6
Benbrook Lake 85,648 85,648 100 0 0 19,636 23
Bonham, Lake 11,027 11,027 100 0 0 3,048 28
Bridgeport, Lake 366,236 358,115 98 10,000 3 -8,121 -2
*Brownwood, Lake 128,839 105,356 82 -1,642 -1 -23,483 -18
*Cisco, Lake 29,003 23,884 82 -143 -0 -1,929 -7
Crook, Lake 9,195 9,195 100 0 0 188 2
Eagle Mountain Lake 179,880 179,880 100 0 0 0 0
Georgetown, Lake 36,823 24,553 67 -647 -2 -12,270 -33
Graham, Lake 45,288 43,889 97 1,041 2 -980 -2
Granbury, Lake 132,949 132,378 100 163 0 163 0
Granger Lake 51,822 51,822 100 0 0 0 0
Grapevine Lake 164,703 164,703 100 0 0 0 0
*Halbert, Lake 6,033 5,539 92 -45 -1 583 10
Hubbard Creek Reservoir 318,067 271,328 85 -962 -0 -42,467 -13
Hubert H Moss Lake 24,058 23,928 99 -130 -1 107 0
Jim Chapman Lake (Cooper) 260,332 260,332 100 0 0 69,457 27
Joe Pool Lake 175,358 175,358 100 0 0 0 0
Kickapoo, Lake 86,345 73,086 85 796 1 -4,995 -6
Lavon Lake 406,388 406,388 100 0 0 39,935 10
Leon, Lake 27,762 23,587 85 -47 -0 62 0
Lewisville Lake 563,228 563,228 100 0 0 0 0
Limestone, Lake 203,780 190,702 94 28,089 14 -13,078 -6
*Lost Creek Reservoir 11,950 11,895 100 -55 -0 -21 -0
*Mineral Wells, Lake 5,273 5,273 100 0 0 0 0 Mountain Creek, Lake 22,850 22,850 100 0 0 0 0

CONSERVATION STORAGE DATA FOR SELECTED MAJOR TEXAS RESERVOIRS
Name of lake or reservoir
Conservation storage capacity
(acre-feet)
Conservation storage end of March 2018
Change since end of February 2018
Change since end of March 2017
(acre-feet) (%) (acre-feet)** (%) (acre-feet)** (%)
(North Central continued)
Navarro Mills Lake 49,827 48,842 98 5,281 11 -985 -2
New Terrell City Lake 8,583 8,583 100 0 0 43 1
Nocona, Lake (Farmers Crk) 21,444 21,444 100 0 0 0 0
Palo Pinto, Lake 26,766 24,654 92 277 1 64 0
Pat Cleburne, Lake 26,008 26,008 100 0 0 0 0
*Pat Mayse Lake 113,683 113,683 100 0 0 12,938 11
Possum Kingdom Lake 538,139 523,606 97 4,894 1 -12,566 -2
Proctor Lake 54,762 45,724 83 0 0 -8,486 -15
Ray Hubbard, Lake 439,559 438,306 100 -1,253 -0 11,934 3
Ray Roberts, Lake 788,167 788,167 100 0 0 0 0
Richland-Chambers Reservoir 1,087,839 1,085,699 100 50,734 5 -2,140 -0
Squaw Creek, Lake 151,250 150,082 99 -1,168 -1 1,098 1
Stillhouse Hollow Lake 227,771 204,190 90 119 0 -23,581 -10
Tawakoni, Lake 871,685 871,685 100 0 0 107,071 12
Texoma, Lake (Texas) 1,258,113 1,234,041 98 -24,072 -2 74,545 6 Texoma, Lake (Texas & Oklahoma) 2,525,281 2,468,089 98 -151,902 -6 149,090 6
Waco, Lake 189,418 179,281 95 8,321 4 -10,137 -5
Waxahachie, Lake 10,780 10,780 100 0 0 0 0
Weatherford, Lake 17,812 17,780 100 250 1 379 2
Whitney, Lake 553,344 505,896 91 8,592 2 21,859 4
Worth, Lake 33,495 33,495 100 0 0 2,403 7
TOTAL 10,635,685 10,325,163 97 103,777 1 163,526 2
EAST
Athens, Lake 29,503 29,503 100 0 0 0 0
B A Steinhagen Lake 66,961 56,253 84 -6,037 -9 -4,616 -7
Bob Sandlin, Lake 190,822 190,822 100 0 0 0 0
Caddo, Lake 29,898 29,898 100 0 0 0 0
Cedar Creek Reservoir in Trinity 644,686 644,686 100 0 0 981 0
Cherokee, Lake 40,094 40,094 100 0 0 0 0
Conroe, Lake 410,988 410,988 100 0 0 384 0
Cypress Springs, Lake 66,756 66,756 100 0 0 1,191 2
Fork Reservoir, Lake 605,061 601,358 99 -3,703 -1 49,375 8
Houston County Lake 17,113 17,113 100 0 0 0 0
Jacksonville, Lake 25,670 25,670 100 0 0 0 0
*Livingston, Lake 1,785,348 1,785,348 100 0 0 0 0
Martin, Lake 75,726 75,479 100 1,671 2 6,040 8
Monticello, Lake 34,740 30,930 89 -2,264 -7 -3,810 -11
Murvaul, Lake 38,285 38,285 100 0 0 1,971 5
Nacogdoches, Lake 39,522 39,522 100 88 0 1,124 3
O' the Pines, Lake 241,363 241,363 100 0 0 0 0
Palestine, Lake 367,303 367,303 100 0 0 0 0
Sam Rayburn Reservoir 2,857,077 2,857,077 100 0 0 171,331 6
Striker, Lake 16,934 16,934 100 0 0 289 2
*Sulphur Springs, Lake 17,747 16,635 94 -1,112 -6 1,771 10
Toledo Bend Reservoir (Texas) 2,236,450 2,236,450 100 0 0 204,022 9 Toledo Bend Reservoir (Texas & Louisiana) 4,472,900 4,654,872 100 33,244 1 585,917 13
Tyler, Lake 72,073 72,073 100 0 0 0 0
Wright Patman Lake 122,593 122,593 100 0 0 0 0
TOTAL 10,032,713 10,013,133 100 -11,357 -0 430,053 4

CONSERVATION STORAGE DATA FOR SELECTED MAJOR TEXAS RESERVOIRS
Name of lake or reservoir
Conservation storage capacity
(acre-feet)
Conservation storage end of March 2018
Change since end of February 2018
Change since end of March 2017
(acre-feet) (%) (acre-feet)** (%) (acre-feet)** (%)
TRANS-PECOS
Elephant Butte Reservoir (Texas) 852,491 188,431 22 -20,210 -2 54,222 6 Elephant Butte Reservoir (Texas & New Mexico) 1,973,358 436,182 22 -46,782 -2 125,515 6
Red Bluff Reservoir 151,110 111,661 74 -182 -0 -20,965 -14
TOTAL 1,003,601 300,092 30 -20,392 -2 33,257 3
EDWARDS PLATEAU
*Amistad Reservoir (Texas) 1,840,849 1,381,044 75 -8,635 -0 -64,036 -3 *Amistad Reservoir (Texas & Mexico) 3,275,532 2,011,221 61 -7,547 -0 -61,318 -2
Brady Creek Reservoir 28,808 15,893 55 -228 -1 -2,974 -10
Buchanan, Lake 860,607 774,708 90 3,834 0 -42,414 -5
E. V. Spence Reservoir 517,272 62,667 12 -1,011 -0 -7,211 -1
Inks, Lake 13,962 13,066 94 219 2 181 1
Lyndon B Johnson, Lake 115,249 110,453 96 -183 -0 244 0
Marble Falls, Lake 6,901 6,798 99 5 0 0 0
Nasworthy 9,615 8,000 83 -147 -2 436 5
Oak Creek Reservoir 39,210 18,625 48 -310 -1 -4,631 -12
O. C. Fisher Lake 119,445 11,541 10 -99 -0 -5,513 -5
*O. H. Ivie Reservoir 554,340 102,510 18 -2,794 -1 -32,771 -6
Twin Buttes Reservoir 182,454 12,321 7 -176 -0 -12,779 -7
TOTAL 4,288,712 2,517,626 59 -9,525 -0 -171,468 -4
SOUTH CENTRAL
*Austin, Lake 23,972 23,081 96 355 1 416 2
Canyon Lake 378,781 351,757 93 2,973 1 -27,024 -7
*Coleto Creek Reservoir 31,040 27,352 88 -782 -3 -3,547 -11
Medina Lake 254,823 155,352 61 -3,932 -2 -80,619 -32
Somerville Lake 147,104 147,104 100 0 0 0 0
Travis, Lake 1,113,348 893,385 80 -5,843 -1 -219,963 -20
TOTAL 1,949,068 1,598,031 82 -7,229 -0 -330,737 -17
UPPER COAST
Houston, Lake 120,686 120,686 100 0 0 0 0
Texana, Lake 159,566 134,633 84 2,459 2 -23,923 -15
TOTAL 280,252 255,319 91 2,459 1 -23,923 -9
SOUTHERN
Choke Canyon Reservoir 662,820 192,431 29 -3,924 -1 -70,791 -11
Corpus Christi, Lake 256,062 228,427 89 -7,799 -3 -12,797 -5
*Falcon Reservoir (Texas) 1,551,007 733,620 47 -108,251 -7 119,917 8 *Falcon Reservoir (Texas & Mexico) 2,646,817 1,204,577 46 -206,675 -8 421,503 16
TOTAL 2,469,889 1,154,478 47 -119,974 -5 36,329 1
STATEWIDE TOTAL
STATEWIDE TOTAL 32,200,121 26,989,677 84 -82,646 -0 109,031 0 * Conservation volume is used as conservation storage capacity, because the dead storage is unknown. **Monthly and yearly changes do not include reservoirs that did not have data in last month or last year, respectively.
Note: Conservation storage capacity is the space available to store water above the lowest outlet and below the top of conservation pool (some may have seasonal variations), or normal maximum operating level. Conservation storage refers to the volume of water held within the conservation storage space. Not included is any water in flood control storage (above the top of conservation pool or normal maximum operating level) or any water in the dead pool storage. Conservation storage percentage is based on the conservation storage capacity of the reservoir and the conservation storage in the reservoir on date shown. Percent change is given by 100 * (current conservation storage - past conservation storage)/conservation storage capacity.

MARCH 2018 STREAMFLOW CONDITIONS The computed 30-day mean flow status for 29 reporting index stations monitored this month is presented below. Mean flow increased at 16 index stations, decreased at 11 stations, and remained unchanged at two stations.
Streamflow Status Number of Stations
Near or Above Normal (>30%) 21
Abnormally Low (20-30%) 4
Moderately Low (15-20%) 2
Severely Low (10-15%) 0
Extremely Low (5-10%) 1
Exceptionally Low (<5%) 1 On a regional basis, as shown below, stream flows were exceptionally low in the Trans Pecos region, abnormally low in the Edwards Plateau region, but near or above normal in all other regions. Streamflow in the Lower Valley region is not monitored.
*Streamflow Index is defined as the percentile flow that exceeds a given percent of observed flows.

MARCH 2018 SOIL MOISTURE CONDITIONS
Soil moisture at the end of March 2018 (top image), as compared to soil moisture at the end of February 2018 (bottom image), increased in four climate regions ranging from 6 - 12 percent with the greatest increases in Low Rolling Plains and South Central regions, declined in the Upper Coast region by 8 percent, and remained unchanged in five other climate regions.

March 2018 GROUNDWATER LEVELS IN OBSERVATION WELLS
Water-level measurements were available for all 17 key monitoring wells in the state. Water levels rose in 7 monitoring wells since the beginning of March 2018, ranging from an increase of 0.02 feet in the Victoria County Gulf Coast Aquifer well (#12 on map) to 0.93 feet in the Coryell County Trinity Aquifer well (#5 on map). Water levels declined in 10 monitoring wells, ranging from a decline of 0.21 feet in the Lamb County Ogallala Aquifer well (#2 on map) to 5.24 feet in the Hudspeth County Bone Springs-Victorio Peak Aquifer well (#17 on map). The J-17 well (#8 on map) in San Antonio recorded a water level of 63.51 feet below land surface or 667.49 feet above mean sea level. There are no restrictions currently in place for the San Antonio portion of the Edwards (Balcones Fault Zone) Aquifer, with water levels at 7.49 feet above the Stage I critical management level. *IDs used in this publication on the aquifer map to indicate the monitoring well location (IDs 1 - 17) are different than the TWDB's six- or seven-digit state well identification number.

Monitoring Well March February Month Change
Year
Change
Historical Change
First Measured
(1) Hansford 0354301 159.34 158.99 -0.35 -1.40 -89.22 1951
(2) Lamb 1053602 148.52 148.31 -0.21 -1.25 -120.35 1951
(3) Martin 2739903 143.91 143.19 -0.72 -0.83 -39.02 1964
(4) Dallas 3319101 493.67 493.78 0.11 -0.36 -271.67 1954
(5) Coryell 4035404 520.80 521.73 0.93 -8.16 -228.80 1955
(6) Kendall 6802609 130.46 125.52 -4.94 -23.15 -70.46 1975
(7) Bell 5804816 124.46 124.19 -0.27 -3.53 -0.95 2008
(8) Bexar 6837203 63.51 63.91 0.40 -14.90 -16.87 1932
(9) Smith 3430907 431.22 431.81 0.59 -0.20 -131.22 1977
(10) La Salle 7738103 498.94 497.74 -1.20 -28.74 -245.87 2003
(11) Harris 6514409 191.79 192.43 0.64 0.71 -56.29* 1947**
(12) Victoria 8017502 32.35 32.37 0.02 -0.65 1.65 1958
(13) El Paso 4913301 294.68 294.52 -0.16 0.88 -62.78 1964
(14) Reeves 4644501 165.71 160.56 -5.15 -0.20 -73.62 1952
(15) Pecos 5216802 191.34 186.76 -4.58 -1.01 55.54 1976
(16) Haskell 2135748 46.45 46.60 0.15 -0.41 -3.45 2002
(17) Hudspeth 4807516 144.83 139.59 -5.24 -0.81 -40.91 1966
*Change since the original measurement of 135.5 feet below land surface in 1947 (**measurement not shown on the hydrograph)
MARCH 2018 GROUNDWATER LEVELS IN OBSERVATION WELLS
50
80
110
140
170
1950 1968 1986 2004 2022
Dep
th t
o w
ater
in f
t.
0
40
80
120
160
1950 1968 1986 2004 2022
Dep
th t
o w
ater
in f
t.
100
115
130
145
160
1960 1975 1990 2005 2020
Dep
th t
o w
ater
in f
t.
200
300
400
500
600
1954 1970 1986 2002 2018
Dep
th t
o w
ater
in f
t.
(2) State Well ID 10-53-602 Near Earth, Lamb County
Ogallala Aquifer
(1) State Well ID 03-54-301 Near Spearman, Hansford County
Ogallala Aquifer
(4) State Well ID 33-19-101 Southeast Dallas, Dallas County
Twin Mountains Formation-Trinity Aquifer
(3) State Well ID 27-39-903 Northwest Martin County
Ogallala Aquifer

400
435
470
505
540
1992 1999 2006 2013 2020
Dep
th t
o w
ater
in f
t.
30
70
110
150
190
1974 1986 1998 2010 2022
Dep
th t
o w
ater
in f
t.
100
110
120
130
140
2008 2011 2014 2017 2020
Dep
th t
o w
ater
in f
t.
350
375
400
425
450
1986 1994 2002 2010 2018
Dep
th t
o w
ater
in f
t.
200
290
380
470
560
2002 2006 2010 2014 2018
Dep
th t
o w
ater
in f
t.
180
220
260
300
340
1954 1970 1986 2002 2018
Dep
th t
o w
ater
in f
t.
(5) State Well ID 40-35-404 Gatesville, Coryell County
Hosston Formation-Trinity Aquifer
(6) State Well ID 68-02-609 Waring, Kendall County
Cow Creek Formation-Trinity Aquifer
(7) State Well ID 58-04-816 Near Salado, Bell County
Edwards (Balcones Fault Zone) Aquifer
(9) State Well ID 34-30-907 Red Springs, Smith County
Carrizo-Wilcox Aquifer
(10) State Well ID 77-38-103 Near Cotulla, La Salle County
Carrizo-Wilcox Aquifer
(11) State Well ID 65-14-409 Alief, Harris County
Evangeline Formation-Gulf Coast Aquifer

0
20
40
60
80
1958 1973 1988 2003 2018
Dep
th t
o w
ater
in f
t.
220
240
260
280
300
1966 1979 1992 2005 2018
Dep
th t
o w
ater
in f
t.
70
110
150
190
230
1950 1967 1984 2001 2018
Dep
th t
o w
ater
in f
t.
150
190
230
270
310
1974 1985 1996 2007 2018
Dep
th t
o w
ater
in f
t.
20
30
40
50
60
2002 2006 2010 2014 2018
Dep
th t
o w
ater
in f
t.
95
110
125
140
155
1962 1976 1990 2004 2018
Dep
th t
o w
ater
in f
t.
(12) State Well ID 80-17-502 Near Bloomington, Victoria County Lissie Formation-Gulf Coast Aquifer
(13) State Well ID 49-13-301 El Paso, El Paso County
Hueco-Mesilla Bolson Aquifer
(16) State Well ID 21-35-748 Near O’Brien, Haskell County
Seymour Aquifer
(17) State Well ID 48-07-516 Dell City, Hudspeth County
Bone Spring - Victorio Peak Aquifer
(14) State Well ID 46-44-501 Near Pecos, Reeves County
Pecos Valley Aquifer
(15) State Well ID 52-16-802 Fort Stockton, Pecos County
Edwards-Trinity (Plateau) Aquifer

(8) State Well ID 68-37-203 (J-17)
In San Antonio, Bexar County Edwards (Balcones Fault Zone) Aquifer
HYDROGRAPH OF THE MONTH
611
631
651
671
691
711
7310
20
40
60
80
100
120
1930 1945 1960 1975 1990 2005 2020
Wat
er E
leva
tio
n a
bo
ve M
SL
Dep
th t
o w
ater
in f
t.
611
631
651
671
691
711
7310
20
40
60
80
100
120
2005 2008 2011 2014 2017 2020
Wat
er E
leva
tio
n a
bo
ve M
SL
Dep
th t
o w
ater
in f
t.
0
10
20
30
40
50
60
1975 1985 1995 2005 2015
Dep
th b
elo
w la
nd
su
rfac
e in
fee
t
Well # 4160303, 170 feet deep domestic, eastern San Saba County
The initial measurement in this domestic well was 25 feet below land surface as recorded in 1967 by the driller (not shown). The TWDB has measured this well every year since 1977. The water level has remained relatively stable throughout the period of record with no more than an overall decline of 10 feet in the last 39 years. The lowest water level measurement of 34.8 feet below land surface was recorded in 2014 during drought conditions.
Each month this space features a new hydrograph (marked with the symbol on the map) depicting different aquifers and their conditions in Texas.
The Marble Falls Aquifer is a minor aquifer that is present in several separated outcrops along the northern and eastern flanks of the Llano Uplift region of Central Texas. Groundwater occurs in fractures, solution cavities, and channels in the limestone of the Marble Falls Formation of the Bend Group. Maximum thickness of the formation is 600 feet. Because the limestone beds composing the aquifer are relatively shallow, the aquifer is susceptible to pollution by surface uses and activities. The groundwater contains less than 1,000 milligrams per liter of total dissolved solids. Water from the aquifer is used for municipal, agricultural, and industrial uses, and no significant water-level declines have occurred in wells measured by the TWDB.
The late March water-level measurement in this Edwards (Balcones Fault Zone) Aquifer well, elevation 731 feet above mean sea level, was 63.51 feet below land surface, or 667.49 feet above mean sea level. This was 0.40 feet above last month’s measurement, 14.90 feet below last year's measurement, and 16.87 feet below the initial measurement recorded in 1932.
*** Water levels below the red line indicate periods in which Edwards Aquifer Authority Stage I drought restrictions are in effect. ***
Marble Falls Aquifer