marine use analysis of the pacific north coast … doc fisheries and oceans canada biological...
TRANSCRIPT

Col Doc
Fisheries and Oceans Canada Biological station Liorary
531 Brandy Cove Road St. Andrews, NB Canada EBB 2L9
Marine Use Analysis of the Pacific North Coast Integrated Management Area
S. MacConnachie, J. Hillier, and S. Butterfield
Oceans, Habitat and Enhancement Branch Fisheries and Oceans Canada 4166 Departure Bay Road Nanaimo, BC V9T 4B7 Canada
2007
Canadian Technical Report of Fisheries and Aquatic Sciences 2677
1114p 1 Fineries and Oceans Peches et Oceans Canada Canada
2 8 APR 2008
Cariadir

Canadian Technical Report of Fisheries and Aquatic Sciences
Data reports provide a medium for filing and archiving data compilations where little or no analysis is included. Such compilations commonly will have been prepared in support of other journal publications or reports. The subject matter of data reports reflects the broad interests and policies of the Department of Fisheries and Oceans, namely, fisheries and aquatic sciences.
Data reports are not intended for general distribution and the contents must not be referred to in other publications without prior written authorization from the issuing establishment. The correct citation appears above the abstract of each report. Data reports are abstracted in Aquatic Sciences and Fisheries Abstracts and indexed in the Department's annual index to scientific and technical publications.
Numbers 1 - 25 in this series were issued as Fisheries and Marine Service Data Records. Numbers 26 - 160 were issued as Department of Fisheries and the Environment, Fisheries and Marine Service Data Reports. The current series name was introduced with the publication of report number 161.
Data reports are produced regionally but are numbered nationally. Requests for individual reports will be filled by the issuing establishment listed on the front cover and title page. Out-of-stock reports will be supplied for a fee by commercial agents.
Rapport statistique canadien des sciences halieutiques et aquatiques
Les rapports statistiques servant a classer et a archiver les compilations de donnees pour lesquelles it y a peu ou point d'analyse. Ces compilations auront d'ordinaire etc preparees a l'appui d'autres publications ou rapports. Le sujets des rapports statistiques refletent la vaste gamme des interets et des politiques du ministere des Peches et des Oceans, c'est-à-dire les sciences halieutiques et aquatiques.
Les rapports statistiques ne sont pas destines a une vaste distribution et leur contenu ne doit pas etre mentionne dans une publication sans autorisation &rite prealable de l'etablissement auteur. Le titre exact parait au-dessus du résumé de chaque rapport. Les rapports statistiques sont résumés dans la revue Résumés des sciences aquatiques et halieutiques, et ils sont classes dans l'index annual des publications scientifiques et techniques du Ministere.
Les numeros 1 a 25 de cette serie ont etc publics a titre de releves statistiques, Services des peches et de la mer. Les numeros 26 a 160 ont etc publics a titre de rapports statistiques du Service des peches et de la mer, ministere des Peches et de 1'Environnement. Le nom actuel de la serie a etc etabli lors de la parution du numero 161.
Les rapports statistiques sont produits a l'echelon regional, mais numerotes l'echelon national. Les demandes de rapports seront satisfaites par l'etablissement auteur dont le nom figure sur la couverture et la page du titre. Les rapports epuises seront fournis contre retribution par des agents commerciaux.
Canadian Technical Report of Fisheries and Aquatics Sciences 2677
2007
MARINE USE ANALYSIS OF THE PACIFIC NORTH COAST INTEGRATED MANAGEMENT AREA
by
S. MacConnachie, J. Hillier, and S. Butterfield
Oceans, Habitat and Enhancement Branch Fisheries and Oceans Canada
4166 Departure Bay Road Nanaimo, BC V9T 4B7

© Her Majesty the Queen in Right of Canada 2007 Cat. No. Fs 97-6/2677E ISSN 0706-6457
Correct citation for this publication:
MacConnachie, S., Hillier, J., and Butterfield, S. 2007. Marine Use Analysis for the Pacific North Coast Integrated Management Area. Can. Tech. Rep. Fish. Aquat. Sci 2677: viii+ 188 p.
11
_ ..

Table of Contents
LIST OF FIGURES ............................................................................................................. v LIST OF TABLES ............................................................................................................ vii ABSTRACT ..................................................................................................................... viii INTRODUCTION ............................................................................................................... 1 ACRONYMS ....................................................................................................................... 2 ALTERNATE ENERGY ..................................................................................................... 4
GOVERNANCE ........................................................................................................... 4 WIND ENERGY ........................................................................................................... 5 TIDAL ENERGY .......................................................................................................... 9 WAVE ENERGY ........................................................................................................ 11 HUMAN USE ISSUES ............................................................................................... 13
AQUACULTURE .............................................................................................................. 15 GOVERNANCE ......................................................................................................... 15 FINFISH AQUACULTURE ....................................................................................... 16 SHELLFISH AQUACULTURE ................................................................................. 17 MARINE PLANT AQUACULTURE ........................................................................ 18 ECONOMIC ACTIVITY ............................................................................................ 21 HUMAN USE ISSUES ............................................................................................... 25
COMMERCIAL FISHERIES ............................................................................................ 27 DATA SOURCES ....................................................................................................... 28 FINFISH FISHERIES OVERVIEW ........................................................................... 28 INVERTEBRATE FISHERIES OVERVIEW ............................................................ 49
CONSERVATION AREAS .............................................................................................. 71 CRUISE SHIP INDUSTRY .............................................................................................. 76
INTERNATIONAL CRUISE INDUSTRY ................................................................ 79 CRUISE LINE ACTIVITY ......................................................................................... 80 POCKET CRUISE SHIP ACTIVITY OVERVIEW .................................................. 82 ECONOMIC IMP ACT OF LARGE CRUISE VESSELS .......................................... 86 MARINE USE ISSUES .............................................................................................. 88
DEFENCE AND SECURITY AGENCIES ....................................................................... 90 DEFENCE, SECURITY AND PUBLIC SAFETY RESOURCES ............................ 92 DEFENCE, SECURITY AND PUBLIC SAFETY RESPONSIBILITIES ................ 97 GROWTH PROSPECTS FOR DEFENCE, SAFETY AND PUBLIC SECURITY .. 99
FORESTRY ..................................................................................................................... 100 GOVERNANCE ....................................................................................................... 101 ECONOMIC ACTIVITY .......................................................................................... 102 HUMAN USE ISSUES ............................................................................................. 106 MARINE USE ISSUES ............................................................................................ 108
MINING ........................................................................................................................... 110 GOVERNANCE ....................................................................................................... 111 ECONOMIC ACTIVITY .......................................................................................... 112 ACID ROCK DRAINAGE ....................................................................................... 117 MARINE USE ISSUES ............................................................................................ 119
OIL AND GAS EXPLORATION ................................................................................... 120
111

CURRENT STATUS ................................................................................................ 121 HISTORY OF EXPLORATION & MORATORIUM .............................................. 121 PETROLEUM SYSTEM ASSESSMENTS ............................................................. 122 HUMAN USE ISSUES ............................................................................................. 131
PORTS ............................................................................................................................. 132 GOVERNANCE ....................................................................................................... 132 CANADIAN COAST GUARD STATIONS ASSOCIATED WITH PORTS AND SMALL CRAFT HARBOURS ................................................................................. 140 . ·
RECREATIONAL FISHING .......................................................................................... 147 GOVERNANCE ....................................................................................................... 147 EARLY DAYS AND REGULATIONS ................................................................... 148 SHAPING POLICY .................................................................................................. 148 RECENT CHANGES ............................................................................................... 149 FISHING ACTIVITY ............................................................................................... 149 SPECIES AND CATCH LEVELS ........................................................................... 150 LICENCES AND TYPICAL ANGLERS ................................................................. 153 FACILITIES .............................................................................................................. 153 ECONOMIC VALUE ............................................................................................... 154 MARINE USE ISSUES ............................................................................................ 155
SHIPPING ........................................................................................................................ 157 GOVERNANCE ....................................................................................................... 157 TRANSPORTATION ............................................................................................... 157 FERRIES ................................................................................................................... 157 NAVIGATION .......................................................................................................... 160 AIDS TO NAVIGATION ......................................................................................... 160 HUMAN USE ISSUES ............................................................................................. 172
ACKNOWLEDGEMENTS ............................................................................................. 173 REFERENCES ................................................................................................................ 174
lV

LIST OF FIGURES
Figure 1: Investigative Permits for Alternate Energy Sites ................................................ 6 Figure 2: Canada's Installed Wind Capacity (Canadian Wind Energy Association) ......... 9 Figure 3: Finfish Farms ..................................................................................................... 19 Figure 4: Shellfish Farms .................................................................................................. 20 Figure 5: BC Fanned Shellfish Production 1991 to 2002 (MAFF, 2004) ........................ 23 Figure 6: Shellfish Wholesale Value 2002 (MAFF, 2004) ............................................... 23 Figure 7: Trends in BC's Commercial Landings 1996 to 2005 ........................................ 28 Figure 8: Total Trawl Catch .............................................................................................. 30 Figure 9: Integrated Groundfish Management Areas ....................................................... 31 Figure 10: Cumulative Groundfish Trawl Effort (Hours) from 1996 to 2004 .................. 32 Figure 11: Outside ZN Cumulative Hook and Line Effort (Hours Soaked) from 1993 to
2004 ........................................................................................................................... 34 Figure 12: Groundfish Schedule II Cumulative Hook and Line Effort (Minutes) from
1996 to 2004 ............................................................................................................. 35 Figure 13: ZN Catch in the PNCIMA vs. Coast-wide for 1995 to 2004 .......................... 36 Figure 14: Hook and Line Schedule II catch in the PNCIMA vs. Coast-wide for 1996 to
2004 ........................................................................................................................... 37 Figure 15: Halibut Cumulative Hook and Line Effort from 1991 to 2004 ....................... 38 Figure 16: Sablefish Catch by Trap or Longline 1990 to 2004 ........................................ 39 Figure 17: Sablefish Cumulative Trap Effort (Number of Traps) from 1996 to 2004 ..... 40 Figure 18: Sablefish Cumulative Longline Effort (Number of Hooks) from 1996 to 2004
··································································································································· 41 Figure 19: BC Commercial Salmon Fishery by Species Breakdown 2004 ...................... 44 Figure 20: Salmon Catch in PNCIMA vs. Coast-wide between 1996 and 2005 .............. 44 Figure 21: Major Stock Assessment and Management Areas for Herring ....................... 46 Figure 22: Historical Yearly Average for the Commercial Herring Roe Fishery, for Each
Major Management Region on BC Coast (Data from DFO 2002 Stock Status Reports B6-01 to B6-05) ........................................................................................... 47
Figure 23: Recent Yearly Catch for the Commercial Herring Roe Fishery by Gillnet and Seine .......................................................................................................................... 47
Figure 24: Landed Weight of Commercial Invertebrates Averaged from 1995 to 2000 .. 50 Figure 25: Landed Value of Commercial Invertebrates Averaged from 1995 to 2000 .... 50 Figure 26: Geoduck Cumulative Dive Effort (Hours) from 2000 to 2005 ....................... 52 Figure 27: Geoduck Catch (Metric Tonnes) in the PNCIMA vs. Coast-wide from 1978 to
2004 ........................................................................................................................... 53 Figure 28: Horse Clam Catch (Metric Tonnes) in the PNCIMA vs. Coast-wide from 1980
to 2004 ...................................................................................................................... 53 Figure 29: Opal Squid Catch in PNCIMA vs. Coast-wide from 1982 to 2003 ................ 54 Figure 30: Shrimp Trawl Management Areas .................................................................. 56 Figure 31: Shrimp Trawl Catch in PNCIMA and Coast-wide Total from Logbooks ...... 57 Figure 32: Shrimp Trawl Cumulative Effort (Hours Towed) from 1996 to 2004 ............ 58 Figure 33: Prawn Catch in PNCIMA and Coast-wide Total from Logbooks ................... 59 Figure 34: Prawn Cumulative Trap Effort (Hours Soaked) from 2001 to 2004 ............... 60 Figure 3 5: Crab Management Areas ................................................................................. 62 Figure 36: Dungeness Crab Catch in PNCIMA vs. Coast-wide Total ............................. 63
v

Figure 37: Crab Cumulative Trap Effort (Days Soaked) from 2000 to 2004 ................... 64 Figure 38 Red Sea Urchin Catch in PNCIMA and Coast-wide Total .............................. 66 Figure 39: Green Sea Urchin Catch in PNCIMA and Coast-wide Total .......................... 66 Figure 40: Red Urchin Cumulative Dive Effort (Hours) from 1997 to 2003 ................... 67 Figure 41: Green Urchin Cumulative Dive Effort (Hours) from 2000 to 2005 ................ 68 Figure 42: Sea Cucumber Catch in PNCIMA and Coast-wide Total ............................... 69 Figure 43: Sea Cucumber Cumulative Dive Effort (Hours) from 2000-2005 .................. 70 Figure 44: Areas of Marine Protection and Protected Areas in the PNCIMA .................. 75 Figure 45 Cruise Routes .................................................................................................... 78 Figure 46: Northland Cruise Ship Terminal and Facilities (PRP A, 2005) ....................... 84 Figure 47: Marine Traffic and Communications Service Contingency Framework ........ 93 Figure 48: BC Provincial Emergency Program Areas ...................................................... 97 Figure 49:BCO Oil Spill Response Reference .................................................................. 99 Figure 50: Ministry of Forests Regions .......................................................................... 103 Figure 51: Tree Farm Licences and Timber Supply Areas in the PNCIMA .................. 104 Figure 52: Projected Allowable Annual Cut Source: BC Outreach Network BC Coast
Report 2003 ............................................................................................................. 105 Figure 53: Pulp Mills of BC 2004 ................................................................................... 109 Figure 54: Active Mines ................................................................................................. 114 Figure 55: Former Mines ................................................................................................ 115 Figure 56: Assessed Industrial Mineral Value ................................................................ 116 Figure 57: Assessed Metals Value .................................................................................. 117 Figure 58: Location ofthe Queen Charlotte Basin, Offshore BC with Seismic Reflection
Data Collected In and On and Off-shore Well Locations ....................................... 120 Figure 59: Offshore Petroleum Tenure (Offshore Oil and Gas) ..................................... 123 Figure 60: Estimates of Hydrocarbon in Place in the Region of the QCB (Hannigan,
2001) ....................................................................................................................... 124 Figure 61: Current Market Value Evaluation for Hydrocarbon Potential of the QCB
(Whiticar, 2004) ...................................................................................................... 125 Figure 62: Comparison of BC Onshore and Offshore Resource Potentials (Both Proven
and Unproven) and Economic Valuation (Including All Four BC Offshore Basins)
································································································································· 126 Figure 63: Comparison ofBC and Jeanne d'Arc Offshore Petroleum Projections ........ 126 Figure 64: Generated Hydrocarbon (Rohr and Dietrich, 1992) ...................................... 128 Figure 65: Notional Timeline According to Shell Canada (Trollope, 2002) .................. 130 Figure 66: Comparison of Estimated Duration from the Year of Issue of Exploratory
Licenses to First Production of Hydrocarbon in the QSB ...................................... 130 Figure 67: TC Operated Ports of BC's Central and Northern Coast and their
Classification into Canada Port Authorities, RegionaVLocal and Remote Port in 2003 ......................................................................................................................... 137
Figure 68 Small Craft Harbours in the PNCIMA Area and their 2003 Status within the DFO Small Craft Harbour Divestiture of Management Process ............................ 138
Figure 69: Employment Needs and Skills for Prince Rupert Container Port Development and Operation .......................................................................................................... 144
Figure 70: Port ofKitimat. .............................................................................................. 145 Figure 71: Major Recreational Fishing Areas within PNCIMA ..................................... 150
vii

Figure 72: Catch by Species 2003 to 2005 -North and Central Coast.. ......................... 151 Figure 73: Ten Year Trend for Salmon- North and Central Coast ................................ 152 Figure 74: Ten Year Trend for Other Species- North and Central Coast ...................... 152 Figure 75: Fishing Lodges within PNCIMA .................................................................. 154 Figure 76: BC Ferries Inside Passage and Queen Charlotte Islands Route (BC Ferries) 159 Figure 77: BC Ferries Discovery Coast Route (BC Ferries) .......................................... 159 Figure 78: Summary of Million Tonnes of Cargo Handled and Port Revenue in Pacific
Region (Mitchell, 2003) .......................................................................................... 163 Figure 79: Vessel Traffic Density for all Ships in 2003 as Reported by MCTS ............ 165 Figure 80: Summer Tanker Vessel Traffic in 2003 ........................................................ 166 Figure 81: Winter Tanker Vessel Traffic in 2003 ........................................................... 167 Figure 82: Summer Fishing Industry Vessel Traffic in 2003 ......................................... 168 Figure 83: Winter Fishing Industry Vessel Traffic in 2003 ............................................ 169 Figure 84: Summer Passenger Vessel Traffic in 2003 .................................................... 170 Figure 85: Winter Passenger Vessel Traffic in 2003 ...................................................... 171
LIST OF TABLES
Table 1: Saltwater Finfish Aquaculture Companies Holding Licences (MAFF, 2004) ... 17 Table 2: 2005 Companies Holding Freshwater Finfish Hatchery/Grow out Licences
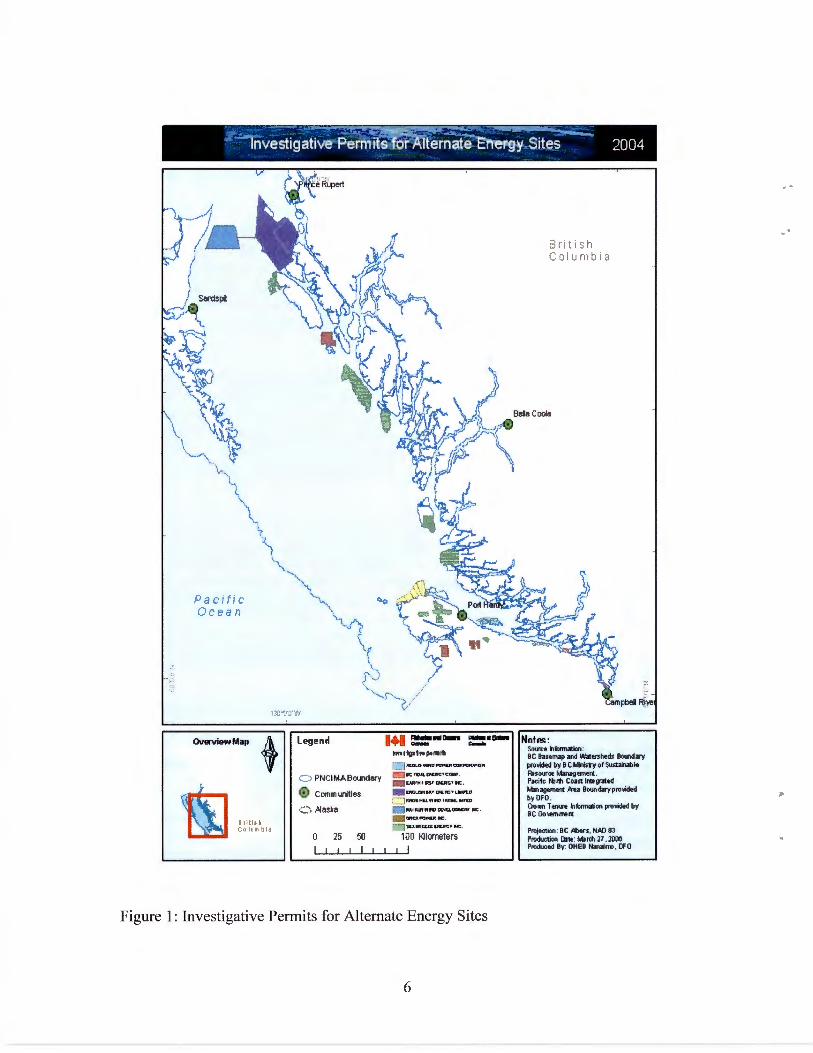
(MAFF, 2004) ........................................................................................................... 22 Table 3: Shellfish Harvests and Values, 2002 (MAFF, 2004) .......................................... 24 Table 4: 95 Percent of Groundfish Species from the Trawl Fishery ................................ 29 Table 5: Species ofPacific Salmon Targeted in the Pacific Commercial Fisheries ......... 42 Table 6: Historical Catch (Tonnes) of Pacific Sardine by Statistical Area in the
Experimental Fishery since 1995 Based on Validated Landings .............................. 49 Table 7: List of Commercially Caught Invertebrate Species in BC in 1997 .................... 49 Table 8: Numbers of Vessels and Passengers Traveling from Vancouver or Seattle to
Alaska in 2004 .......................................................................................................... 81 Table 9: Numbers ofPassengers Expected by Month to Prince Rupert (PRPA, 2005) ... 84 Table 10: Economic Impact of Cruise Activity in BC and Canada (BREA, 2004) .......... 86 Table 11: Base and Two High Level Tour and Retail Expenditures Projections
(McDowell Group Inc, 2004) ................................................................................... 87 Table 12: Regulatory and Legislative Responsibilities .................................................... 90 Table 13: Canada's Pacific Fleet ...................................................................................... 94 Table 14: Characteristics of Active Mines (BCMEM, 2004) ......................................... 110 Table 15: Main Uses of Commodities Produced at Mines (BCMEM, 2003) ................. 118 Table 16: Exploration and Deposit Appraisal Expenditures by Province and Territory
2001 to 2004 (NRCAN, 2004) ................................................................................ 119 Table 17: TC ports Divestiture Progress ......................................................................... 135 Table 18: Divestiture Process from TC to Local Interest ............................................... 135 Table 19: Acts that Regulate the Operation of Canada Port Authorities, Regional/Local
Ports, Remote Ports and Small Craft Harbours ...................................................... 140 Table 20: Regional, Local and Remote Ports and Small Craft Harbour Usage .............. 142
vii

ABSTRACT
MacConnachie, S., Hiller, J., and Butterfield, S. 2007. Marine Use Analysis for the Pacific North Coast Integrated Management Area. Can. Tech. Rep. Fish. Aquat. Sci 2677: viii+ 188 p.
This report provides an overview of various human activities in the Pacific North Coast Integrated Management Area (PNCIMA). The PNCIMA is one of several Large Ocean Management Areas created for ecosystem based management of human use in marine areas by Fisheries and Oceans Canada. The PNCIMA includes the Pacific coast ofBritish Columbia from the Canada-Alaska border to Brooks Peninsula on Vancouver Island and Quadra Island and Bute Inlet. The Marine Use Analysis (MUA) is intended to introduce interested stakeholders to current data, references, general trends and spatial representations pertaining to human activities within the PNCIMA marine environment. Alternate energy, aquaculture, commercial fisheries, recreational fisheries, conservation areas, cruise industry, shipping and transportation, ports, defence and security, mining, oil and gas exploration and forestry are reviewed in this report.
RESUME
MacConnachie, S., Hiller, J., and Butterfield, S. 2007. Marine Use Analysis for the Pacific North Coast Integrated Management Area. Can. Tech. Rep. Fish. Aquat. Sci 2677: viii+ 188 p.
Nous faisons un survol des diverses activites humaines menees dans la zone de gestion integree de la cote nord du Pacifique (ZGICNP). La ZGICNP est l'une de plusieurs zones etendues de gestion des oceans (ZEGO) creees aux fins de la gestion ecosystemique, par Peches et Oceans Canada, des activites humaines menees en milieu marin. Elle comprend la cote de la Colombie-Britannique, depuis la frontiere canado-alaskienne jusqu'a la peninsule Brooks, dans l'ile de Vancouver, et de la, jusqu'a l'ile Quadra et l'inlet Bute. L'analyse de !'utilisation du milieu marin (AUM) vise a offrir aux interesses des donnees recentes, des references, des tendances generales et des illustrations spatiales des activites humaines menees dans le milieu marin de la ZGICNP. Nous couvrons dans notre rapport les autres sources d'energie, !'aquaculture, les peches commerciales, les peches recreatives, les aires de conservation, l'industrie des croisieres, la navigation et le transport maritimes, les ports, la defense et la securite, !'exploitation miniere, la prospection petroliere et gaziere, ainsi que la foresterie.
vm
..

INTRODUCTION
As part of the background materials for the recently proposed Pacific North Coast Integrated Management Area (PNCIMA), Fisheries and Oceans Canada (DFO) is preparing a comprehensive Ecosystem Overview and Assessment Report (EOAR). The PNCIMA is a large area consisting of the inshore waters of the sea, adjoining estuarine and freshwater habitats, as well as coastal lands and forests within British Columbia's (BC) Central and North Coast and the Queen Charlotte Islands. The Marine Use Analysis (MUA) is part of the EOAR compendium of work.
The MUA is intended to introduce interested stakeholders to current data (2004-2005), references and matters pertaining to human activities within the PNCIMA marine environment. Water and land resource uses directly affecting or occurring in, on or near the inshore marine and coastal waters ofPNCIMA are included in this MUA.
Although historical information is used to assist in predicting future trends, the materials within the MUA chapters are considered to be pictures in time (snapshots of the current state of the activities within their respective ecosystems). As such it draws upon or references existing DFO (and other government departments), First Nations, and/or public domain information, academic, non-government organizations (NGO), local communities, stakeholder, etc. relevant to management of the area to review the data/information available and provide key references, general trends and spatial representations of the activities.

ACRONYMS
AMD Acid Mining Drainage ARD Acid Rock Drainage BCMEM BC Ministry of Energy and Mines .. BCO Burrard Clean Operations CBSA Canada Border Services Agency CEAA Canadian Environmental Assessment Act CCG Canadian Coast Guard CCGA Canadian Coast Guard Auxiliary CFIA Canadian Food Inspection Agency CHS Canadian Hydrographic Service CPUE Catch Per Unit Effort CSA Canadian Standards Association CSPA Critical Species Protection Area CSSP Canadian Shellfish Sanitation Program cws Canadian Wildlife Service DFAM Defined Forest Area Management DFO Fisheries and Oceans Canada EAO Environmental Assessment Office EBM Ecosystem Based Management EMA Environmental Management Act EC Environment Canada EOAR Ecosystem Overview and Assessment Report FDP Forest Development Plan FPC Forest Practices Code GPS Global Positioning System GSC Geological Survey of Canada HIAB Herring Industry Advisory Board IBA Important Bird Area IBP International Biological Program IHHPC Integrated Herring Harvest Planning Committee ILMB Integrated Land Management Bureau IMO International Marine Organization IQ Individual Quota ITQ Individual Transfer Quota IVQ Individual Vessel Quota JRCC Joint Rescue Coordination Centre .. . LRMP Land and Resource Management Plan MBS Migratory Bird Sanctuaries .. MCTS Marine Communications and Traffic Services MNS Marine Navigation Services MOU Memoranda of Understanding MPA Marine Protected Area MUA Marine Use Analysis MWA Marine Wildlife Area NGOs Non-government Organizations
2

NMCA NORAD NOTMAR NWA NWCA OCAD owe PEP PFMA PNCIMA POEA PSARC PSC QCB RCA RCMP REET SAR SARA SO LAS TAC TC TSA TSB UNCLOS WMA
National Marine Conservation Area North American Aerospace Defence Command Notices to Mariners National Wildlife Area North West Cruise Ship Association Office of the Commissioner for Aquaculture Development Oscillating Water Column Provincial Emergency Program Pacific Fishery Management Area Pacific North Coast Integrated Management Area Pacific Offshore Energy Association Pacific Science Advice and Review Committee Pacific Salmon Commission Queen Charlotte Basin Rockfish Conservation Areas Royal Canadian Mounted Police Regional Environmental Emergency Team Search and Rescue Species at Risk Act Convention on the Safety of Life at Sea Total Allowable Catch Transport Canada Timber Supply Areas Transportation Safety Board of Canada United Nations Convention of the Law of the Sea Wildlife Management Area
3

ALTERNATE ENERGY
This section focuses on commercial activities related to wind, wave and tidal energies, as these are the most relevant to the PNCIMA. This section presents background information for each type of these alternate energy projects, followed by a brief status update on projects or proposals in BC. Since many of these technologies are relatively new, the economic information included here is preliminary and, in some cases, estimates are not available.
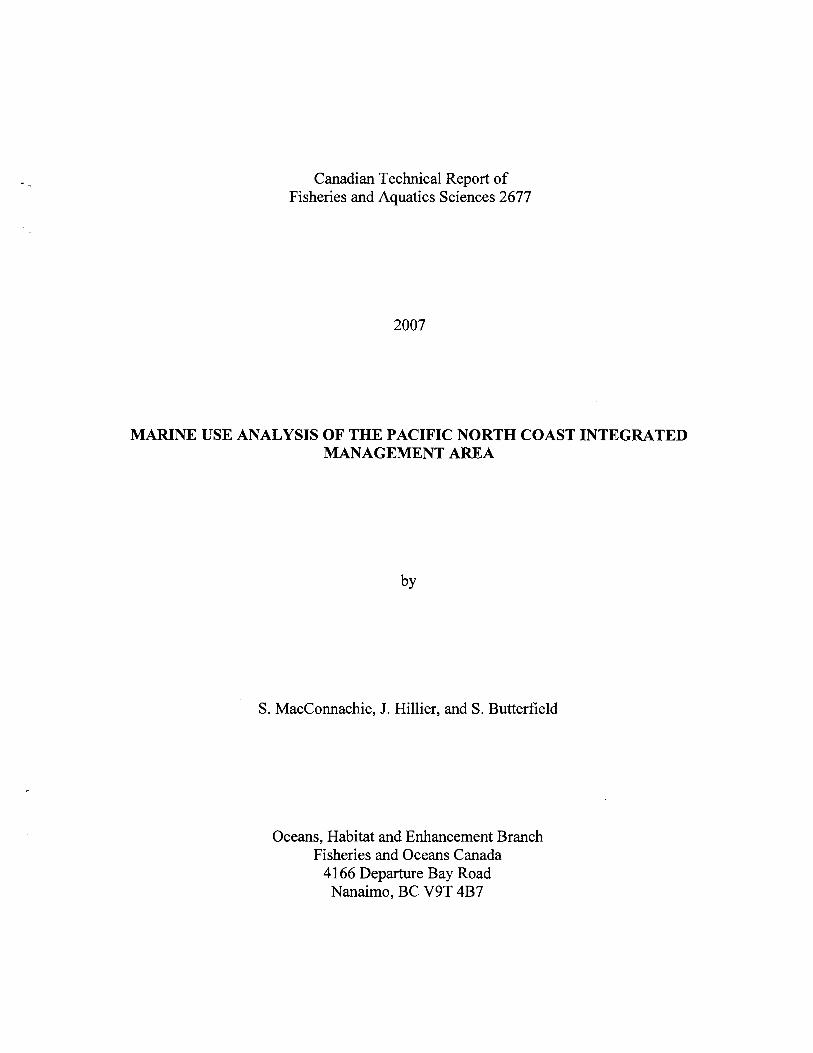
The BC Ministry of Energy, Mines and Resources defines alternate energy as "all energy sources and energy technologies that minimize environmental impacts relative to conventional hydrocarbon resources and technology". Presently, BC Hydro must import power in order to meet the needs of BC; however, it has stated that it plans to increase production capacity over the next decade to meet future demands. To meet this demand, BC Hydro has committed to acquiring 50 percent of its future needs from "green" power sources. In support of this goal, BC Hydro's new policies favour the production of energy from alternate energy projects (Green and Alternative Energy Division, 2001). Examples of alternate energy sources include: wind energy, small hydro-electric, biomass, wave, tidal, pumped storage and miscellaneous (e.g. solar, resource smart opportunities). Although some of these possibilities have not yet been developed, there are several proposals in process in BC and it is likely that this sector will expand in the near future (Figure 1 ).
GOVERNANCE Various alternative energy projects will require different regulatory reviews
depending on their size, type and location. Ifthe project is proposed on crown land, then a land tenure is required. In this case, an application for crown land tenure must be submitted to the Integrated Land Management Bureau (ILMB), a crown corporation, under the authority of BC's Land Act. The ILMB does not have specific policies for alternate energy projects, with the exception of wind power. The ILMB is in the process of developing a Wind Power on Crown Land policy, including tenure type and pricing. Investigative permits for alternate energy projects are normally required and these are issued by BC Ministry of Energy, Mines and Resources.
An accord signed by the provincial government and the federal government allows for a harmonized review if an assessment is triggered under either federal or provincial legislation. This lends itself to a more timely review by all agencies, and considers applicable legislation, both federal and provincial. The level of the assessment is determined by the amount of energy that the project, upon completion, will produce and if any part of the power project will harmfully alter fish or fish habitat.
If the proposed project will produce 500kW or more, and has the potential to harmfully alter fish or fish habitat, DFO's Major Projects Review Unit, along with the Environmental Assessment Office (EAO), will work together to complete a comprehensive environmental assessment. If the project is larger than 200MW in size, a comprehensive environmental assessment under the Canadian Environmental Assessment Act would be initiated and, again, the DFO and EAO would work together to complete
4

-.
the assessment. If the effects of the proposal are uncertain, and/or there are substantial public concerns, then the project may be referred to a panel review which would examine the project's potential environmental effects from a broader public policy perspective. If less than 500kW are to be produced by the project, a smaller screening level assessment will be conducted at an area office by DFO staff with unlikely involvement by the EAO, but local involvement by provincial ministry staff.
The EAO coordinates the assessment and reports to the Minister of Environment. Environmental, economic, social, heritage and health effects are all considered in the assessment process. The intent of the process is to identify any foreseeable adverse impacts throughout the life cycle of a project, including construction, start-up, operation, and abandonment phases as well as to determine ways to eliminate, minimize or mitigate those impacts. The provincial assessment process results in recommendations to either grant or refuse an Environmental Assessment Certificate.
The primary federal Acts that apply to in-water and intertidal components of these energy developments are the Fisheries Act and the Navigable Waters Protection Act. A federal assessment may result in the creation of a legal agreement between DFO and the project developers in the form of an Authorization for the Harmful Alteration, Disruption or Destruction of Fish or Fish Habitat under section 35(2) of the Fisheries Act, as well as approvals under section 5(1) or section 10 of the Navigable Waters Protection Act.
WIND ENERGY Wind energy is a form of solar energy produced by uneven heating of the Earth's
surface. Wind turbines function like windmills, where the wind causes blades to spin, creating motion that turns a generator to produce electricity. The minimum annual average wind speed required is approximately 7.0 metres per second or about 25 kilometres per hour. Wind energy is the fastest growing power sector worldwide, most notably in the United States (US), Denmark, Germany, Spain and Great Britain. Global production of wind electricity amounts to four times all the power produced in BC. Canada's wind turbines are located primarily in Alberta (Pincher Creek), Saskatchewan, and in the Gaspe region of Quebec.
Wind resources are typically best along coastlines, on top of exposed hills and in areas that are not heavily forested. Most wind turbine installations are land-based and are generally not practical in urban installations or in heavily forested areas. BC's geography presents some special challenges since some potential sites are in remote mountainous locations that are far from the transmission grid and difficult to access.
Other types of wind energy development involve offshore projects which take place on large, open areas of ocean. The advantage of these areas is that the winds are usually stronger and less turbulent. Other requirements for offshore wind projects include: close proximity to the power grid, relatively shallow water depth and suitable seabed substrate. Although still relatively new, there are some offshore wind developments in Europe; these projects typically include a series of large capacity wind turbines installed to the ocean floor.
5
Pacific Ocean
130'\l'O'W
OvUJVH>w Map
Hrtllt' CQ If r1l bta
Legend
0 PNCIMABot.rldery
0 Communities
·:.:.) ,Ajaska
0 25 50 I
... ~--=·-mutglhtptnnltl
- VR' Hf ~' UC.RCill fC ,
. UCliVU••·" DC.IIIC1' LNI"E.CI
c:JtW:~•HU."fC fMMlt~trtD . NI'..,..,.. .. "'CE.YU.~ I'C .
-~POnUIIC.
100 Kilometers
1 I
Figure 1: Investigative Permits for Alternate Energy Sites
6
British Columbia
Nnfl!!:: Sourct hformatton: 9C 9asemap and Watersheds 9oln:tary proWled by 9 C lotinisty of Sustoinoble Resouroe Managemert . Pacilc t+J rfl Coast lnle gnlled Mlnogement !'rea 9oundaryprollided by DFO . crown Tenure lnformalion pro\lided by 9CGo~ment
Projection: 9C J'lbors, HAD 93 Production one: t.lin:h 27. 200G Produced 9y: OHE9 IQnaifT'I). OFO
..

·.
Status At the beginning of 2004, worldwide wind-generated electricity capacity exceeded
39,000 MW and future projections expect it to reach 95,000 MW by 2008 and 194,000 MW by 2013. In February 2004, Canada's installed wind energy capacity was 327 MW (Figure 2).
In 2002, BC Hydro conducted an assessment of wind energy potential in BC (Green and Alternative Energy Division, 2002). This study found that three areas of BC appear to offer the best potential for wind development: the North-West Coast, the North-East and the South-Central Interior. Average wind speed in these regions varies from approximately 10 kmlh to 25 kmlh.
The top 10 (land-based) wind sites in BC are estimated to have a total potential installed capacity of 730 MW, with the sites ranging from 24 to 133 MW of installed capacity respectively. These 10 sites have a total energy production potential of 1600 GWh with production costs ranging from six to twelve cents per kWh. The 1 0 sites are Mount Hays, Ridley Island, Mount W artenbe, Pingle Creek Ridge, Aasen, Bear Mountain, Sugar Loaf Mountain, and ridge south of Ashcroft, ridge near Kingsvale and Monte Ridge.
Offshore wind development around Vancouver Island was also assessed, specifically for the northern end and west coast of Vancouver Island. Five potential sites were identified and two of the sites were recommended for further investigation: Ucluelet and Hecate Strait. A 50 MW development at each of these two sites was estimated to have energy production costs of nine cents per kWh. As of December 2004, there were four project proposals in BC.
The Holberg Wind project on the northwest coast of Vancouver Island, near Holberg, is the only wind project that has had a contract with BC Hydro, proposing to produce 58.5 MW using 45 turbines. The project is 50 percent owned by Stothert Power Corp of Vancouver and 50 percent by Global Renewable Energy Partners which, in turn, is owned by Vestas, the world's leading wind turbine business. In July 2005, Stothert cancelled its agreement with BC Hydro after determining that the site would not produce sufficient wind, especially in light of substantial increases in the costs of materials . Furthermore, the site may have been unsuitable because it was situated on the side of a steep mountain which would have resulted in the creation of a substantial amount of wind turbulence.
The Sea Breeze Energy Knob Hill project, also on the north of Vancouver Island, has been granted approval ; however, construction of this project is dependent on a power purchase agreement. Until the Knob Hill project signs a contract with BC Hydro, or another customer, it will not be built. The project is proposed to produce 450 MW with 150 turbines. Sea Breeze Power Corp has a large presence in BC, with six other sites proposed in BC for a total potential of 2,845 MW but, to date, it has no actual projects on the ground.
Nomis Power Corp submitted a new application for the Nahwitti Wind Power project, again, on the north of Vancouver Island. Starting at 50 MW and growing to 400 MW, the project expects to begin with 25 turbines. This project is still undergoing review by the BC EOA.
7

The Nai Kun Wind Farm proposed for Hecate Strait is the only offshore wind project that falls within the PNCIMA boundaries. It is a large-scale proposal, with an estimated 140 to 235 turbines (700 MW), located between Haida Gwaii and Prince Rupert. Hecate Strait is a prime location for BC' s first wind farm with strong and consistent wind, a shallow, gravel seabed and easy access to existing transmission lines. The proponent recently announced an agreement with the Council of the Haida Nation, which brings the Haida into the project as an equity participant. BC was chosen as a site because its North Coast, like the North Sea region in Europe, has good manufacturing infrastructure and a skilled labour force. If the US $1.1 billion Nai Kun project proceeds as planned, it would increase current Canadian capacity by 230%, be the first offshore wind power farm in North America and be the first purchaser of western Canadian wind turbine component manufacturing. This project is currently at the environmental assessment stage.
Economic Activity
Factors enabling project feasibility are: wind resources, reasonable grid access, high energy demand, a credit-worthy buyer and the federal government's Wind Power Production Incentive Program under Natural Resources Canada.
Despite Fortis Bank, the World Energy Council and the Petroleum Economist all stating that BC has the best wind energy potential in the world, wind energy is still largely undeveloped in BC. BC Hydro began its wind monitoring program in April 2000, erecting wind monitoring equipment at a number of locations throughout BC. Since then, all of these wind monitoring stations have been decommissioned, or operation has been assumed by private parties.
The jobs associated with the development of the wind energy sector in BC would include construction, manufacturing and maintenance, and these are anticipated to provide direct economic benefits to several areas, such as Vancouver Island and Prince Rupert, as well as creating significant investment in these communities. Remote communities can also benefit through integration of wind with existing generation facilities. It has been estimated that if wind turbines were manufactured in BC, their manufacturing and installation would create six jobs per MW, so each 100 MW project would produce 600 full-time jobs. Furthermore, for each direct job created, an additional job would be created in associated sectors, as operations and maintenance create another one to five jobs per five MW. In the US it has been estimated that wind energy creates 27 percent more jobs per kilowatt hour than coal-fired power, and 66 percent more jobs than natural gas-fired power. A 100 MW installation will typically generate around $850,000 in local purchases.
The Nai Kun project estimates that this development would result in 1500 to 2500 direct person years of construction employment. In addition, 42 permanent maintenance jobs would be established.
8

Figure 2: Canada's Installed Wind Capacity (Canadian Wind Energy Association)
Despite its considerable wind energy potential, current conditions in BC have resulted in limited wind energy development. The commitment by BC Hydro to develop renewable energies at the rate of 10 percent additional capacity per year would merely increase wind energy by tens of MW by 2011. This is a very small number compared to the expansion of wind energy in other areas of the world with more developed wind energy industries.
TIDAL ENERGY Tidal current energy is derived from the fast flowing water currents resulting from
tidal cycles, the energy of which can be harnessed using turbines. This energy source is independent of weather and climate change and follows the predictable relationship of the lunar orbit that is known many years in advance.
Several factors, such as the gravitational pull of the moon and monthly and annual lunar cycles can influence the speed of water movement resulting from tides and vary the strength of these currents. Another factor that affects the magnitude of tidal currents is the presence of narrow passages. In the open ocean tides are small; however, as tidal waves enter coastal waters, they slow down and increase in height as they are reflected in coastal basins. Narrow and shallow constrictions produce the fastest and most powerful movements of current, despite a loss of energy due to friction. In BC, some of the highest velocity tidal current flows occur through the passages between the Strait of Georgia and Johnstone Strait.
There are two generic ways of extracting energy from tidal flows. The first involves placing a barrage across an estuary with a large tidal range to create a static head and
9

operate a low head water turbine. The second method involves converting the kinetic energy of tidal currents to mechanical energy using different types of turbines, and doing so without interrupting the natural tidal flow. However, estuaries are amongst the world's most productive and sensitive ecosystems and flooding these systems by installing barrages can cause serious environmental impacts. Therefore this approach is often less favourable.
Based on the present and probable future technology available for tidal current extraction, it is believed that 2.0 rnls is the minimum current that can be considered for power generation. In terms of the technology, there are at least four types of tidal-energy systems being developed, all variations of wind turbines . Field testing and cost will ultimately decide which one is optimal.
Status
Although none exist at this time, it has been estimated that there are about 55 potential sites suitable for tidal/current extraction in BC. The resource assessment identified 55 sites with current speeds over two m/s, which would yield a gross annual energy potential on the order of 20 000 GWh. Selection of sites that are most feasible for development yielded 12 sites with a total energy production of 2700 GWh per year. A large site in Discovery Passage (800 MW, 1400 GWh per year), yielded a cost of 11 cents per kWh. A smaller site at Race Passage ( 43 MW, 76 GWh per year) yielded a cost of 25 cents per kWh. It is expected that the number and capacity of potential tidal current sites could increase as the application of technology to the resource becomes more advanced. As technology is developed and the resource better modeled, costs are expected to decrease due to increased efficiency and a larger amount of exploitable power.
Canada's first free-stream tidal power project has been built at the Race Rocks Ecological Reserve, located 10 nautical miles southwest of Victoria (www.racerocks.com). The project is a result of the partnership between Lester B. Pearson College of the Pacific, EnCana Corporation and Clean Current Power Systems Inc. The multi-year demonstration project involves the installation, operation and monitoring of a 65kW freestream tidal turbine generator in the water near Race Rocks. Clean Current is a private BC-based company that designs and licenses technology that efficiently converts the energy of tidal currents into electricity. Clean Current's proprietary technology consists of a horizontal-axis ducted turbine with a direct-drive variable speed permanent magnet generator. The turbine generator is equally efficient in both directions as the tidal currents reverse twice each day.
In the PNCIMA region, both north and central Vancouver Island have been identified as having good tidal energy potential, despite ceratin areas in the central coast (Perceval Narrows to Clement Rapids) and the north coast (Zanardi Rapids to Hidden Inlet) appearing to have lower tidal energy potential. Overall, the most promising site for tidal energy development is Discovery Passage, as some of the highest-velocity tidal current flows occur through the passages between the Strait of Georgia and Johnstone Strait. The tidal range is moderate (5m) in this area, but because the tides from the Pacific through Johnstone Strait are roughly 180 degrees out of phase with the tides entering the Strait of Georgia from the southern end ofVancouver Island, the tidal velocities are very high.
10

A new company, Canoe Pass, has plans to install vertical-axis turbines in the area between Maude and Quadra Islands near Campbell River. This company has numerous sites with investigative permits along the coast and has begun discussions with New Energy of Calgary for a demonstration project at Seymour Narrows. However, the currents are extremely strong at Seymour Narrows such that advances in technology will be required before such an installation can proceed.
Economic Activity
Present tidal current energy generation costs, using existing technology, appear to be competitive with other green energy sources, at $0.11 per kWh for a large site (800 MW capacity, 1400 GWh/yr) and $0.25 per kWh for a small site (43 MW capacity, 76 GWh/yr). These costs assume a conservative capacity factor of 20 percent and a maximum current speed of3.5 m/s.
Tidal energy is further behind than both ocean wave energy and wind energy development, given that there is currently no government funding in Canada for its development. The future is not certain and detailed economic predictions are not available.
In general, the development of a BC tidal energy sector could create significant investment in remote communities. The jobs associated with the tidal energy industry in BC would include design, construction, manufacturing and maintenance. For example, the capital costs associated with developing a Discovery Pass site based on existing technology would be on the order of $1,040 million including an interconnection cost of $40 million. Annual power generation from this site is estimated to be 1,390 GWh/yr at a cost of$0.11 kWh.
WAVE ENERGY Waves contain significant amounts of energy, particularly large waves and ocean
swell. Wave energy is, in reality, a stored and concentrated form of solar energy, with the wind as the intermediary. Wave energy research was pursued intensively during the 1970s and early 1980s, especially in the United Kingdom. Interest in it was then revived in the mid 1990s as one of the options to reduce fossil fuel dependency and address global warming. During the last 30 years, a large number of devices such as the nodding duck, the Osprey, tethered buoys, bottom standing oscillating water columns, overspilling systems, floating bags, articulated rafts, submerged pressure chambers, and many others have been tried with varying degrees of success. Although a wide variety of wave energy systems have been proposed, only a few full-sized prototypes have been built and deployed in open coastal waters. The greatest wave energy resource is in the midlatitudes, between 40 and 60 degrees north and south, where winds blow most consistently; in contrast, more tropical areas often experience long periods of calm weather in between severe storms.
There are two basic types of wave technology: fixed onshore and floating offshore. Until very recently, most research and development focused on fixed devices onshore or in shallow waters, which either stand on the sea bottom or are attached to a rocky cliff (OREG, 2004). Shoreline devices have the advantage of easier maintenance and installation, and do not require deep-water moorings and long underwater electrical
11

cables. The less energetic wave climate at the shoreline can be partly compensated for by natural wave energy concentration due to refraction and/or diffraction. The typical first generation device is the oscillating water column (OWC).
The OWC device comprises a partly submerged concrete or steel structure, open below the water surface, inside which air is trapped above the water free surface. The oscillating motion of the internal free surface produced by the incident waves forces the air to flow through a turbine that drives an electrical generator. Full sized OWC prototypes were built and tested under real sea conditions in several countries including Norway, Japan, India, Portugal and the United Kingdom. In all these cases, the concrete structure was fixed, either bottom-standing or built on rocky sloping wall. The installed power capacity of these OWC prototypes ranges from 60 to 500 kW. Smaller shoreline OWC prototypes were built in !slay, United Kingdom (about 1990), and recently in China. The so-called Mighty Whale, built in Japan a few years ago, is a floating version ofthe owe.
There has also been increasing interest in tapping the vast potential of the offshore resource, with a variety of floating devices being developed. Offshore devices, sometimes classified as third generation devices, are basically floating or fully submerged oscillating bodies. They exploit the more powerful wave regimes available in deep water, typically at a depth greater than 40m. Offshore wave energy converters are generally more complex compared to first generation systems. This greater complexity, together with additional problems associated with mooring, access for maintenance and the need for long underwater electrical cables, have hindered their development. It is only recently that some systems have reached, or have even come close to reaching, the full-scale demonstration stage.
In the last ten years or so, most of the research and development activity in harnessing wave energy has occurred in Europe. This is largely due to the financial support and coordination provided by the European Commission and to the positive attitude adopted by some European national governments. However, the development from concept to commercial stage has been found to be a difficult, slow and expensive process. This is because for almost every system, optimal wave energy absorption involves some kind of resonance, which means that proper testing of pilot plants in the open sea requires fullsized structures. The high costs of constructing, deploying, maintaining and testing large prototypes under sometimes very harsh environmental conditions has stalled the development of wave energy systems; in most cases, such operations were possible only with substantial financial support from governments.
Status
The National Energy Board of Canada forecasts that tidal developments in BC, Nova Scotia and New Brunswick could produce approximately 21,000 MW by 2025. It is difficult to forecast accurately, however, since the efficiency of energy capture remains to be proven and large-scale ocean energy plants, with distribution networks, have yet to be developed.
The coasts of mainland BC and Vancouver Island have the potential to supply a major portion of the ocean energy resource. A preliminary assessment of wave energy on the
12

west coast of Vancouver Island indicates an average near-shore power level of 3 3 kW/metre ofwave front, and a total incident wave power of ~8.25 GW.
In 2001, Phase 1 of the Green Energy Study of BC was completed for BC Hydro. It stated that 8.25 GW of wave power is incident on western Vancouver Island, and identified Winter Harbour and Ucluelet as particularly suitable sites for installations, each with a potential of 200 MW. The study estimated that by 2010, Vancouver Island could have 75 MW of installed wave capacity, generating 156 GWhrs/year and, by 2020, this could increase to approximately 225 MW generating 468 GWhrs/year. All of it would be at a cost of less than seven cents!kWhr.
In June of 2001, BC Hydro announced a 20 MW Vancouver Island Green Energy Demonstration Program, which included a wave energy component. About a year later, Ocean Power Delivery of the UK and Energetech of Australia were selected to develop demonstration projects of 2 MW each. However, in April 2003, BC Hydro pulled out of these projects claiming that the success oftheir more recent call for Private Green Power Proposals eliminated their need to be involved in funding demonstration projects. Since then, no significant activity on developing wave energy has occurred in BC.
HUMAN USE ISSUES The presence of offshore power generation plants in narrow and well-used
waterways would be a concern for all marine traffic, including barges, cruise liners, recreational anglers and commercial fishing vessels. Much of this concern would be allayed if the entire structure could be at levels in the water column that would not interfere with the largest vessels using these water ways. For configurations where support structures are above the ocean surface, such as wind power turbines, it may be necessary to deny access to all vessels over the full extent of the power farm.
This would also have implications to ship traffic in open ocean areas. Given that ships/boats are vulnerable to storm conditions and do lose power from time to time, the fully submerged option clearly has some advantages. These factors would need to be taken into account in the technology election/design stage of any proposed project. These potential conflicts within navigable waters are significant and, at this time, it is not clear how these issues could be resolved. Concerns have been voiced over offshore wind turbine generation with respect to the potential loss of access to lucrative fisheries resources. Since the turbine blades would be required to be a minimum of 60 m in length, there is also potential for impacts to aerial navigation, as well as vessel traffic; concerns regarding impacts to marine avian populations have also been raised.
Both commercial and recreational fishing may be impossible over the area of the power farm, regardless of whether it was submerged or not. Other issues include potential direct damage to fish and marine mammals from structures such as underwater turbines.
Onshore facilities could have impacts to users in the area in the form of changes to waterfront access, impacts to aerial navigation and perceived negative visual impact.
13

Technical, political and institutional barriers lie in the path of ocean energy development. In order to develop competitive, high performance ocean energy systems for global energy markets, the following issues will have to be addressed:
• high initial costs and risk during initial deployment; • unknown reliability (withstanding a hostile environment); • intermittent production and power quality issues; and • complex interconnection issues for distributed generation.
BC's energy policy identifies clean energy targets, but the only mechanism currently in place are the policy objectives of BC Hydro. A more specific policy on alternate energy development may be developed in the near future, recognizing the differences in longterm roles expected of the renewable energy choices and the different implementation stages faced by each of them.
Many alternate energy proposals have recognized the PNCIMA area as being an ideal location in terms of accessing energy and benefiting local economy. However, until these new technologies have advanced further, the economic, social and environmental consequences will remain largely uncertain.
14
..
..

AQUACULTURE
Aquaculture is the production of farmed fish or marine plants in an aquatic environment or human-made container of water for commercial purposes, which include the cultivation of shellfish on, in or under the foreshore or in water.
After Norway, Chile, and the United Kingdom, BC is the fourth largest farmed salmon producer in the world, and the second largest shellfish producer in Canada. Aquaculture activity in BC is divided into finfish (primarily salmon), shellfish, and marine plant aquaculture. Finfish aquaculture is further divided into freshwater and marine finfish. Freshwater finfish aquaculture occurs primarily on private land and encompasses commercial enterprises such as salmon and trout hatcheries, trout farms and fee-fishing operations. Most marine finfish sites are located on Crown tenured foreshore within the PNCIMA. Most shellfish culture sites are located in southern BC waters, where more suitable conditions exist. Large brown kelp species are the plants most harvested in BC waters and they are harvested mostly in support of the spawn on kelp fishery.
GOVERNANCE
Responsibility for finfish and shellfish aquaculture in Canada is shared between federal and provincial governments. The Government of Canada and the Government of BC signed a memorandum of understanding that identifies the roles of the agencies of the respective crowns. At the federal level, 17 departments and agencies deliver programs and services to the industry (see below). The Government of Canada is responsible for research, technology transfer, training and development, the regulatory framework, environmental sustainability and interaction, product safety and inspection, foreign market intelligence and trade services, access to financing and communications within the aquaculture industry.
Key federal agencies that have a policy or jurisdictional interest in aquaculture: • DFO (Fisheries Act). • Agriculture and Agri-Food Canada (policy and program interest). • Environment Canada (EC) (Canadian Wildlife Service, Species At Risk Act,
Canadian Environmental Assessment Act, Canadian Environmental Protection Act).
• Health Canada (Pest Control Products Act). • Transport Canada (TC) (Navigable Waters Protection Act). • Canadian Food Inspection Agency (CFIA) (Fish Inspection Act, Consumer
Packaging and Labelling Act and the Food and Drugs Act). • Office of the Commissioner for Aquaculture Development (OCAD).
15

The province of BC has the responsibility for the majority of site approvals and for overseeing the industry's day-to-day operations. Furthermore, the provincial government's agencies are responsible for administering its Acts, Regulations and guidelines that pertain to aquaculture operations in BC. The most relevant provincial ministerial and its jurisdictional interests are as follows:
• Aquaculture and Commercial Fisheries Branch (Fisheries and Coastal Resources Act, Fish Inspection Act).
• Ministry of Agriculture and Lands (Farm Practices Protection Act, Code of Practice, Fisheries and Coastal Resources Act).
• Ministry of Tourism, Sports and the Arts (Heritage Conservation Act). • Ministry of Environment (Environmental Management Act, Wildlife Act). • Integrated Land Management Bureau (Land Act, Land Use Policies)
The Fisheries and Coastal Resources Act defines Aquaculture Licence and Lease Regulations. Under the Environmental Management Act the Waste Discharge Regulations regulate the discharge requirements.
The Code of Conduct practice defines mandatory shellfish aquaculture standards for all shellfish farmers. The Code is consistent with provincial and federal acts and sets protocols for silting, waste management, equipment standards, construction standards, use of vessels and marine equipment.
Fish farming licenses for shellfish aquaculture site developments on Crown land in BC are authorized by the Integrated Land Management Bureau. License for private companies are administered through the Ministry of Agriculture and Lands.
DFO, Canadian Food Inspection Agency (CFIA) and EC jointly administer the Canadian Shellfish Sanitation Program (CSSP). The primary objective of the CSSP is to protect the public from consuming contaminated shellfish by controlling the recreational and commercial harvesting of all shellfish within Canada.
Users wishing to operate marine plant aquaculture operations on Crown land must apply to field offices within the Integrated Land Management Bureau. As well, individuals wishing to harvest kelp or aquatic plants for commercial purposes must hold a valid License to Harvest Marine Plants. These licenses are issued by the BC Ministry of Agriculture and Lands, and specify the species, quota, method of harvest and permitted area of harvest. A person must also hold a provincial license to operate a plant for treating, drying, or otherwise processing kelp or marine plants. This license is required in addition to a limited entry J-license issued by DFO for the commercial spawn-on-kelp industry. Based on current inventories, the BC Ministry of Agriculture and Lands has established that no more than 20 percent of the total biomass of a marine plant bed may be harvested.
FINFISH AQUACULTURE The current BC finfish aquaculture industry has changed markedly, from several
small operations run by local fish farmers in the 1970s and 1980s to larger industry-led companies. As a result of the 1995 provincial moratorium, the majority of recent growth in farmed fish production occurred through increased production rates rather than
16
#

increased tenures. As of 2005, the majority of finfish farm companies in the PNCIMA are owned by two companies, Stolt Sea Farms and Pan Fish Canada Ltd, which collectively account for 60 percent of the farms in the study area (Table 1 and Figure 3). Although aquaculture research continues in relation to other species, production is dominated by Atlantic salmon, followed by Chinook salmon.
Table 1: Saltwater Finfish Aquaculture Companies Holding Licences (MAFF, 2004)
Company Total Sites 622335 BC Ltd 1 Connor Brothers 2 Heritage Aquaculture 10 Nutreco Marine Harvest Canada 13 Pan Fish Canada Limited 20 Seven Hills Aquafarm Ltd 2 SKM Enterprises Ltd 1 Sonora Sea Farm Ltd 1 Stolt Sea Farms 27 Yellow Island Aquaculture (1994 Ltd) 1 622335 BC Ltd 1
SHELLFISH AQUACULTURE Most marine shellfish farms are located on the west coast of Vancouver Island and
in the Georgia Basin, with major concentrations operating in the Baynes Sound, Cortes Island and Okeover Inlet areas. Although the majority of shellfish farming in BC occurs south of the PNCIMA study area, where conditions are more suitable to farmed shellfish species, there are eleven shellfish farms located in PNCIMA, representing 2.4 percent of the provincial total (MAFF, 2003). There are, however, fifteen pilot projects under way on North Coast and Queen Charlotte Islands with the aim to determine the feasibility of shellfish aquaculture in these areas.
The Pacific oyster (Crassostrea gigas), Manila clam (Venerupis philipparum), and Japanese scallop (Patinopecten yessoensis) are the most common commercial shellfish species cultured in BC. Oysters and clams account for the majority of wholesale value, while mussel and scallop culture occur on a much smaller scale (Figure 4). The littleneck clam (Protothaca staminea), blue and Gallo mussel (Mytilus spp.), and most recently, the geoduck (Panopea abrupta) are also farmed in BC (MAFF, 2004).
New shellfish aquaculture species are being explored for their potential in providing both value-added and/or high-value products. The spot prawn (Panda/us platyceras) and giant rock scallop (Crassadoma gigantean), abalone (Haliotis kamtschatkana), giant Californian sea cucumber (Parastichopus californicus) and sea urchins (Strongylocentrotus spp.), are being cultured on an experimental basis. There are also three freshwater license farms experimenting with crayfish (Cherax quadricarinatus).
17

NUUUNEPLANTAQUACULTURE The marine plant industry consists mainly of small-scale operators harvesting less
than 100 tonnes a year. There are approximately 600 species of marine plants in BC's coastal waters, 20 of which are kelp species. Due to their high commercial potential, historic assessments have concentrated mainly on those kelp species harvested in the spawn on kelp fishery, i.e. giant kelp (Macrocystis integrifolia) and bull kelp (Nereocystis luetkeana). The total standing stock of these two species of brown kelp is approximately one million tonnes. All harvesting of marine plants including those above and sea asparagus (Salicornia virginica), brown algae (Laminaria, Alaria, Egregia, and Hedophyllum), and eelgrass (Zostera spp), is done by hand in BC.
18
,

......... ~-::·--~-~-~ Marrne FtsnnFarms ----.-....... use
Pacif i c Ocean
o vetview .M::.p
Figure 3: Finfish Farms
• • • • Pru'Dft Rup rt
Legend
P NCIMA Bound ary • Ex01;ting Fish Farms
1/•~ller eohcd1l f!<:>undao .,. • Propoe<XJ r.Jh 1 rn,.
c::: Alaska
0 I
50 100 I
19
20() Kilom <Jtor:;
I
Analys•s
' .,
81 j I $ t Co I 11 1 b ra
Notes:
source lnlofl ·uon· S..~•nn• ~r> pr.;y,,<J"'117r BC M SRM_
Aquaculture. .Si~s. ~fO'V d t;1 IAn o•t<v ~ A,;Jncu we_ ood ;:md
r-; IJerie.s
Ftop<l <Jn ac Alber• , I·IAD .!1.3 od.Jcbon Dale: Februarf 2 200!•
Pr o:i.lcer.:l B-r OHF9 GIS Un t. CFO

-:;;,...;;::::-·~-..._ Manne · :;nelrflsn-farms............... use
Pacif ic Ocea n
Overview Map
;p l z• t
~ , I , o !• 1 •
Figure 4: Shellfish Farms
PNCIMA BOLll'l' .. !-.!lly • P<Oi)O~d Sllf.! llflsh Fanns
IJV~1crt.l i.C d~ Bourd',zuy • :.: ir.htg .S t\J[] ~fi~h f ;un1$
{_:-:-• 1'.13Sk3
0 50 LL_t
ICO I
20
2~•:J Kilom>:1crs
I
AnalyliiS
f': I t I ~> ~ 1
C (1 I L1 11l b I ~
~~~~ o!~ luf :) fl! l f\ f j. f1
.{!t; OaJS~-:Jp ),,NJ ~·ID l"!'t t:S tlt:"d~ Ovuw.J.:t :r rftt"ltlt.j b,. ac Mtn.~n· « su~:t t"il~ Rl:~ aurcll Mo.n 'r~~l.
?.'l !'; fl ( • • C.o M_f l i 'I~Jl rJr.;d
t ;JI '4 ~., 111 t:lll f A-1~ 1' f't~'t, l fr.-f.;Jr, r.t{m :WJ fll 01 (). A.q.hU'!J tu r~ S r.~ J:'Cfl.,:i!'d b'; 1.' niW,
.!. ~ric.tinlfll', F-:io:t .2rd F GI'U:! I t::;
DrQtt>t~(J i l o:.:: .:.J t~ l"l. t·lo1.[J tl3 Pro-:.ht:-1~ C•;;.:e· r· ~ tnuo:~rt :! ~ , :.\."))!> ?rod!Y.Od B'f OHEE GIS u-, ~ OFO
...
.. ·

. .
'
ECONOMIC ACTIVITY Aquaculture contributes enormously to the BC economy, with more than 3,500
direct and indirect full time year round jobs created through salmon aquaculture alone. Eight First Nations on the coast ofBC are involved in salmon aquaculture (MAFF, 2004) .
Farmed salmon is the province's largest agricultural export crop with annual production of 70,000 to 85,000 tonnes in recent years (Price Waterhouse Coopers, 2003). In 2002, farmed salmon accounted for 95 percent of the provincial aquaculture total while shellfish aquaculture, valued at approximately $15 million, accounted for five percent of the provincial aquaculture total. In 2002, BC' s aquaculture industry generated sales of $330 million, up 12.3 percent from 2001. A significant 32.2 percent increase in the quantity of finfish produced was somewhat offset by falling prices for farmed salmon and outbreaks of disease. Nonetheless, finfish sales totalled $31 0 million, up 13.1 percent from the previous year (Statistics Canada, 2004).
PNCIMA is home to most of the finfish aquaculture sites in the province (Figure 3); of a total 129 sites in the province, 78 are located within the PNCIMA region. Further,of those 78 sites, 68 are located in the Central Coast Land and Resource Management Plan (LRMP) region, and 10 are in the North Coast LRMP region. Within the Central Coast LRMP area, 27 of the marine finfish aquaculture sites are concentrated within the Broughton Archipelago. Other regions within PNCIMA where aquaculture tenures appear in close proximity are: Bute Inlet, Johnstone Strait, and Queen Charlotte Strait (MAFF, 2004).
There are 63 finfish hatchery sites in BC, 23 of which are located in PNCIMA. In association with the hatchery sites, 35 percent ofthe freshwater finfish farm operations in PNCIMA have fish ponds that grow fish ("growouts") from fingerling to market size (MAFF, 2004 and US Department of Agriculture, 1998) (Table 2).
21

Table 2: 2005 Companies Holding Freshwater Finfish Hatchery/Grow out Licences (MAFF, 2004)
Company Hatchery Hatchery Grow-out Total Sites Grow-out
Big Tree Creek Enterprises Ltd 1 1 Gold River Chinook Project 1 1 Grieg Seafood BC Ltd I 1 Homalco Indian Band 1 1 Nor Am Aquaculture Inc 2 2 Nutreco Canada Inc 1 1 Omega Salmon Group Ltd 1 1 Saltstream Engineering Ltd 2 2 Stolt Sea Farm Inc 5 1 6 Yellow Island Aquaculture Ltd 1 1 (1994) No Name Provided 6 6 Big Tree Creek Enterprises Ltd 1 1
BC' s shellfish aquaculture industry provides 800 on site jobs to fish farmers and accounts for five percent of the total volume of aquaculture sales in BC (Statistic Canada 2002). Wholesale, landed and harvest values of farmed shellfish in BC increased steadily from 1993 to 1996 then decreased in 1997 down to around 1995 values. These values have subsequently increased from 1997 to 2002 (Figure 5). Wholesale value of farmed shellfish increased more than two and a half times over five years from approximately 11 million in 1997 to 29 million in 2002 (Figure 6). Of this 29 million, 53 percent came from oyster production, 41 percent from farmed clams, and six percent from scallops and mussels.
22

35
30
25
20
15
10
BC Famled Shellfish Production 1991-2002
Wholesale \I.Jiue ($tTiltions)
0+------,-------r------~----~~----~------~------~-----.------~----~
1993 1994 1995 1996 1997P 1998P 1999P 2000P Year
Figure 5: BC Farmed Shellfish Production 1991 to 2002 (MAFF, 2004)
B C F arn•ed Shellrosh Wholesale Value - 2002 ($29 Millon·}
Farmed Sc;~llop;: & Clher 6'lt
Figure 6: Shellfish Wholesale Value 2002 (MAFF, 2004)
23
F:arrn«t Oarns: 41 'lt
2001P 2002E

Table 3, the 2002 economic activity from shellfish farming in BC, illustrates a total production (in tonnes) and farmgate value (in$ millions) for oyster, clams and scallops.
Table 3: Shellfish Harvests and Values, 2002 (MAFF, 2004) Species Production (* 1 ,000 Tonnes) Farmgate Value($ Millions) Oysters 7.00 7.2 Clams 1.40 7.1 Scallops and Mussels 0.09 0.5 Total 8.70 14.8
The Shellfish Development Initiative launched by Ministry of Agriculture and Lands in 1998 is a working plan to double the amount of Crown land available for shellfish aquaculture to 4,230 hectares within 10 years. Studies indicate that, under this plan, the industry could generate as much as $100 million annually and add 1,100 direct jobs to the economy by 2008.
Canada accounts for 0.13 percent of the world ' s seaweed market and most ofthis harvest comes from the east coast rather than BC (Small, 1999). Most marine plant harvesting in BC is for big kelp (Macrocystis integrefolia) from the spawn-on-kelp fishery. Most spawn-on-kelp fishery licenses are held communally by coastal BC First Nations (Malloch, 2000).
There is potential for BC coastal communities to benefit economically from marine plant aquaculture development of underused marine plants such as red kelp. The greatest economic potential for BC's aquatic plant resources are expansion into North America's and Asia' s edible aquatic plant market. Marine plants like nori (Porphyra spp. ), sea lettuce (Ulva spp.) are considered viable products in both markets. Marine plants may also be collected as feed for other mariculture crops i.e. urchin feed, or for horticultural products such as fertilizer, foliar spray and soil additives. The current value of these small-scale harvest activities has not been measured, as there is little information on the market values of these resources (Malloch, 2000).
Most of BC's aquaculture production value lies within the PNCIMA study area where employment, income and profits are generated; for example, estimated person/years of employment for aquaculture in 2002 were 1,150 for North Vancouver Island (including associated processing, retail and distribution) and 60 on the Central Coast. Additionally, one quarter of the 400 person/years on the west coast of Vancouver Island are deemed part of the PNCIMA area, for a total estimated 1, 300 out of a provincial total of 4,125 or 32 percent (Gustafson, 2004). Although there is little or no current employment in the Queen Charlotte Islands and North Coast areas, there are at least two approvals in place for finfish aquaculture facilities on the North Coast, and 15 experimental shellfish aquaculture sites in their initial stages.
It is likely that all BC aquaculture products will continue to grow in both value and quantity. According to US National Marine Fisheries Service (NMFS) predictions, without growth and technological advancement in aquaculture to supplement the harvest of wild stocks, future global demand for seafood products will exceed supply. Recently, global farmed salmon production exceeded 1,000,000 tonnes. BC Fanned salmon operations account for to six to seven percent of the total current global production.
24
•

..
The United Nations' Food and Agriculture Organization predicts that by the year 2030 more than half of all fish consumed are likely to originate from aquaculture facilities (MAFF, 2004). BC may be a forthcoming competitor for farmed fish production, sales and export on the global market scale if provincial aquaculture production continues to increase. Certain regions within PNCIMA have suitable conditions that may align with future aquaculture expansion, including: suitable natural sites for finfish aquaculture expansion, an established workforce and technology, as well as good access to markets in Asia and the US (Vance, 2004). However, environmental and health regulatory obstacles to industry expansion, particularly for salmon aquaculture in BC, may limit or delay this potential growth (Vance, 2004).
HUMAN USE ISSUES Human activities associated with operations of all aquaculture sites, and expansion
of the aquaculture industry may lead to conflicts with other human activities occurring within the PNCIMA marine environment. For example, physical characteristics (unpolluted water and good oxygen exchange), that constitute preferred sites for aquaculture expansion may also be considered preferred sites for the establishment of marine protected areas (MP As) planned by federal and provincial agencies.
Conflicts may arise from aquaculture operations intercepting the "public's right to navigation and marine safety in navigable waters of the Pacific coast of Canada", outlined in the federal Navigable Waters Protection Act. A survey conducted in the Broughton Archipelago, within PNCIMA boundaries, indicated that salmon farming net cages caused marine tourism operators to find other routes or anchorages within the Broughton, or to divert to other areas along the coast. Aquaculture installations can also hinder the recreation and tourism industry by obstructing public access to beach areas (Vance, 2004).
Other areas of uncertainty for aquaculture development in PNCIMA are First Nations ' cultural, heritage, and land claims rights, including impacts to their food, social and ceremonial fisheries. Any biophysical effects of salmon farming on commercial or sports fishing, marine tourism, or subsistence economies resources may result in significant economic and social impacts. For example, the uptake of antibiotics by clams and other impacts on this resource may be a concern to some First Nations' communities because of their heavy reliance on, and consumption of, these marine resources. Despite a greater general acceptance of shellfish aquaculture activities, private land or home owners may be opposed to aquaculture developments proceeding in their community due to concerns over wastes, odours and aesthetics.
Coastal First Nations have long made use of marine plants for food, medicine, ceremonial purposes and for constructing fishing implements and other technologies that kept their communities healthy. While traditional ways of preparing and using food and technology have changed over time, marine plants are still an integral part of BC coastal First Nations' culture. Any prospective marine plant mariculture development activities within PNCIMA may have to consider First Nations cultural rights to the marine resource prior to expanding culture, harvesting or economic development activities. Prospective marine plant harvesters may have limited access to marine plants where parks and protected
25

areas are established for the enjoyment and recreation of the public and where unique marine species and ecosystems of concern are being protected.
Potential conflicts among marine stakeholders are as follows: • Direct competition with site selection of marine protected areas (MPAs) • Direct competition with recreational, commercial or First Nations fisheries • Conflict with landowners over space, waste, odour and aesthetics • Vessel traffic and safety • Marine tourism operators • Harvesters may seek out aquatic plants in areas designated for MP A or where
harvesting is not permitted • Direct conflict with recreational, commercial or First Nations' fishery resources
26
..

COMMERCIAL FISHERIES
Fisheries of all types have played an important role in shaping the economy and culture of BC. Numerous species of fish and invertebrates are harvested by various gear types. This section provides summaries on commercial fishing activities by species licence type. The focus of this section is on the spatial distribution of each fishery type and how catch levels have changed over recent years. Minor fisheries (e.g. octopus by dive, smelt, perch, tuna, eulachon and scallops) that are considered either experimental or at low levels of effort in the PNCIMA are not covered in this report.
DFO is the lead regulatory agency for marine fisheries within Canadian waters. Fisheries are managed under the authority of the Fisheries Act and the regulations made under the Fisheries Act. Fishery (General) Regulations apply to commercial, recreational and aboriginal communal fishing and related activities across the nation.
These regulations cover: • Variation of closed times, fishing quotas and size and weight limits of fish. • Documents and registrations. • Identification of fishing vessels and fishing gear. • Observers. • Assisting persons engaged in the enforcement or administration of the Act. • Fishing for experimental, scientific, educational or public display purposes. • Fishing in waters other than Canadian waters.
The preliminary 2005 statistics on commercial fisheries in BC report a landed value totalling $325 million. This was a very strong year for most BC fisheries, posting the second highest catch within the past 10 years. Figure 7 represents the cumulative catch and landed dollar value rates across all commercial fisheries in BC.
27

450 000
I 400.000 r-
350.000
300.000 -
; 2;i0.000 1- ,_____
a .ronnn
200.000 ~ 1:1 1-Mded V Oll U\ft {$1JOO'S·) - .. -· I'"
I'" 150 000 - r- - r-- - r- - 1- -
100.000 - I r- - ! ,___ r- - 1- t-
50.000 - ~ :- 1- L !- :- - 1- 1- ~. I I 0 .
1995 1997 1,9'!}1!:1 1999 :?,000 2001 2002 2003 2'00'4 2DDS
Yc· <~r
-
Figure 7: Trends in BC's Commercial Landings 1996 to 2005
DATA SOURCES The marine areas of the Pacific Region have been divided into different segments to
help in the management of the different fisheries. These segments are entitled Pacific Fishery Management Areas (PFMA). These areas are further divided into Sub-areas. By opening and closing these Sub-areas to harvesting, DFO is able to manage harvest rates and efforts on a given stock or species. Sub-area segments are usually delineated by sight lines from known geographic points; as a result, Sub-areas are variable in size and shape, preventing meaningful spatial analysis. To enable the production of maps detailing where fishing effort has taken place, harvest logbook data documenting latitude and longitude co-ordinates has been binned into four or 25 kilometre grids. Between fisheries, the grids all share a common origin, although the effort value varies. To ensure compliance with the Privacy Act and Access to Information Act, those grid cells where two or fewer vessels or licences operated were removed from the maps.
FINFISH FISHERIES OVERVIEW
Groundfish Trawl
There are two types of trawling methods, bottom trawl and mid-water trawl. As the terms suggest, a bottom trawl targets fishes near or at the bottom of the water column, whereas a mid-water trawl targets fishes found above the sea floor or within the pelagic zone. Trawl fishery landings exhibit a high degree of diversity, with roughly 35 species comprising 95 percent of the landings (Table 4). Trawlers harvest species in which total allowable catch (TAC) are set for round fish, flatfish (except halibut), rockfish and elasmobranchs. In addition, non-targeted (by-catch) species (fish, invertebrates and other species) may be caught, retained and landed in this fishery. Tuna and smelt have also been harvested by trawlers but represent a negligible portion of the total species landed.
28
.·
•
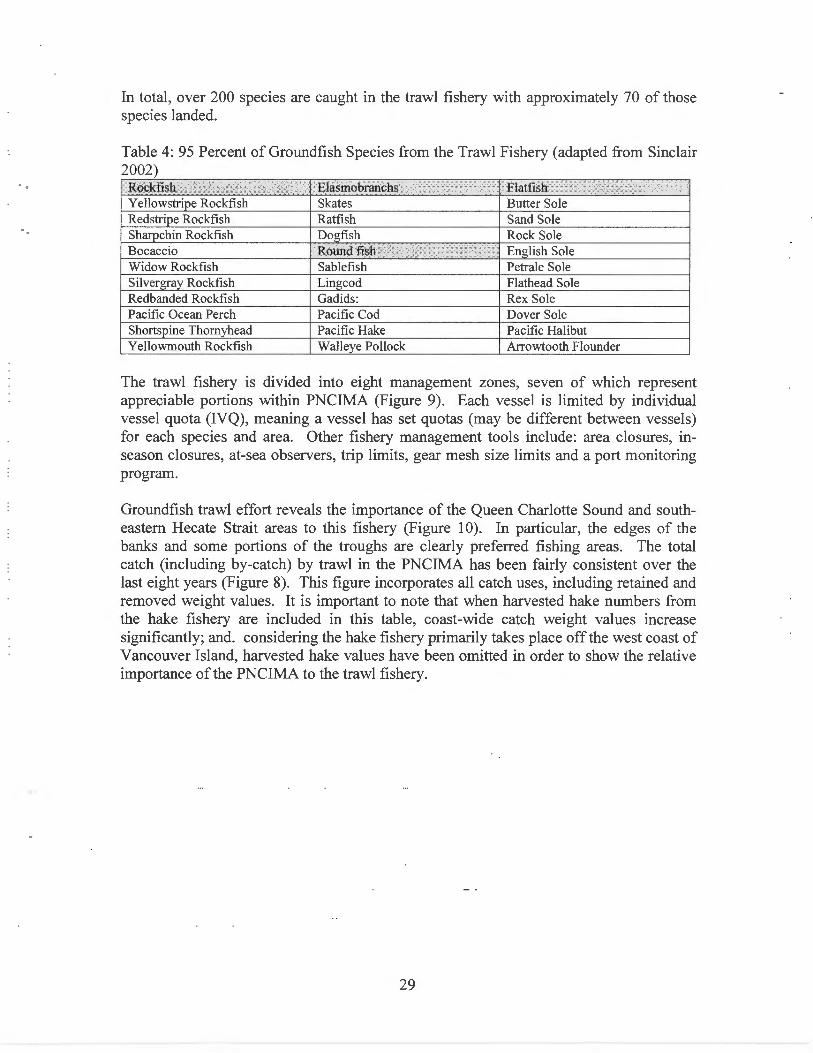
In total, over 200 species are caught in the trawl fishery with approximately 70 of those species landed.
Table 4: 95 Percent of Groundfish Species from the Trawl Fishery (adapted from Sinclair 2002)
Rockfish Elasmobranchs Flatfish Y ellowstripe Rockfish Skates Butter Sole Redstripe Rockfish Ratfish Sand Sole Sharpchin Rockfish Dogfish Rock Sole Bocaccio Round fish English Sole Widow Rockfish Sablefish Petrale Sole Silvergray Rockfish Lingcod Flathead Sole Redbanded Rockfish Gadids: Rex Sole Pacific Ocean Perch Pacific Cod Dover Sole Shortspine Thomyhead Pacific Hake Pacific Halibut Yellowmouth Rockfish Walleye Pollock Arrowtooth Flounder
The trawl fishery is divided into eight management zones, seven of which represent appreciable portions within PNCIMA (Figure 9). Each vessel is limited by individual vessel quota (IVQ), meaning a vessel has set quotas (may be different between vessels) for each species and area. Other fishery management tools include: area closures, inseason closures, at-sea observers, trip limits, gear mesh size limits and a port monitoring program.
Groundfish trawl effort reveals the importance of the Queen Charlotte Sound and southeastern Hecate Strait areas to this fishery (Figure 1 0). In particular, the edges of the banks and some portions of the troughs are clearly preferred fishing areas. The total catch (including by-catch) by trawl in the PNCIMA has been fairly consistent over the last eight years (Figure 8). This figure incorporates all catch uses, including retained and removed weight values. It is important to note that when harvested hake numbers from the hake fishery are included in this table, coast-wide catch weight values increase significantly; and. considering the hake fishery primarily takes place off the west coast of Vancouver Island, harvested hake values have been omitted in order to show the relative importance ofthe PNCIMA to the trawl fishery.
29
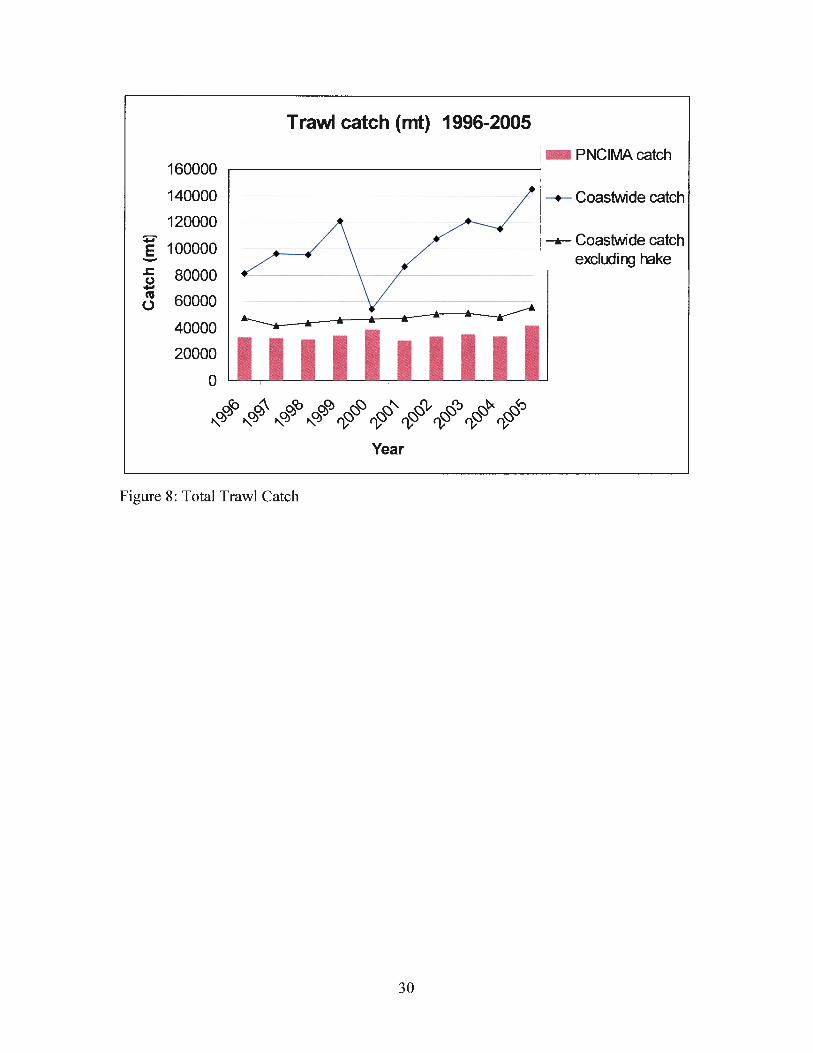
Trawl catch (mt) 1996-2005
160000
140000
120000
e 1ooooo --'= .s cu 0
80000
60000
40000
20000
0
OJOJio OJ~ OJOJco OJOJOJ f;)(0(0 ~::P"' f;::)(00.,- f;)(00:J f;)~ ~~ ~ ~ ~ ~ ~ ~ ~ ~ ~ ~
Year
Figure 8: Total Trawl Catch
30
- PNCIMA catch
_....,_ Coastwide catch excludi hake

..
Pacific Ocean
OVI!ni'iewMap ..
r It It ~ u m bla
-~-~--
legend
0 PNCIMABoundary
• Comm unities
<:> .Alaska
3C
130'1l'O'W ...= ... --·--Groundfish Ma1agement .areas
r::J 3C W 5B
0 3D U 5C
48 50
British Co lum bia
Notes: Swce Information: BC Basemap and Watersheds Boundary FJ'Oiided by 8C MinistryofSusllinEtlle Reoot.rce h4anagem!Jt. Padtc North Coast lriegllled Managem eri .!rea Boundlll'y provided t:¥DFO.
D 5A 5E Projection: BC lllbers, N!IO 83
0 70 140 280 l<l lometers Production Dille: h4arch 7, 2006 I 1 1 I Produced By: OHEB Nanllimo, DFO
~====~==----~
Figure 9: Integrated Groundfish Management Areas
31

__ -- - · cumutati~r:ounofistl=Traw~fcit-.....__, 4 Km
996-2004 (Tow hours) ( 97.71% Data avail anility) Giid cen
6rltH' co I• m Ola
PNCIMABoundary
·- Watersheds Boundary
G) Communities
<:.::-· .!laska
0 35 70
EFFORT_HR S < 1565
15155 - '216
- 1216- 8159
- 8459- 15156
- 15156 - JD!D
14 0 fqlcrreters
I
Brlttsh Col u mbia
wee InfOrmation: C Basemap and Watersheds Bolniary o~de:l by BC Ministry of Sustainttlle eSOtXce M8118gem..-t .
Padic No~h Coast lrtegaled nagemert .-rea Boundary provided
1:>/DFO.
Figure 10: Cumulative Groundfish Trawl Effort (Hours) from 1996 to 2004
32
..
..

Hook and Line, Outside and Inside ZN and Schedule II Fishery
In general, there are two types of hook and line gear used in these fisheries, longline and handline. Typically, the former delivers "iced" fish while the latter delivers live fish to market (Bonnet and Hardy, 2003). Hook and line fishermen target halibut, blackcod, dogfish, lingcod, inshore rockfish (primarily yelloweye, quillback, tiger, and china) and slope rockfish (primarily rougheye, shortraker and redbanded), and generally use squid as bait. Prior to 2005, the hook and line fishery was divided into five management zones but later adopted the eight zones used in the other groundfish fisheries (Figure 9). The hook and line fishery is generally distributed over near shore reef habitats which are unable to be exploited by trawl. Overall, there are 40 species officially landed, making up a lower diversity of species landed than in the trawl fishery. Like the trawl fishery, management techniques include IVQ, area closures, trip and monthly catch limits, at-sea observers and a port monitoring program.
The ZN fishery currently provides four different annual fishing options that licence holders must select prior to fishing. The options differ in the aggregates of targeted rockfish species with the fourth option permitting those vessels with a halibut licence to retain rockfish. The purpose of this option is to help address by-catch of groundfish in both fisheries .
Groundfish hook and line effort shows a clear preference for shallow waters immediately seaward of the mainland inlets.
33
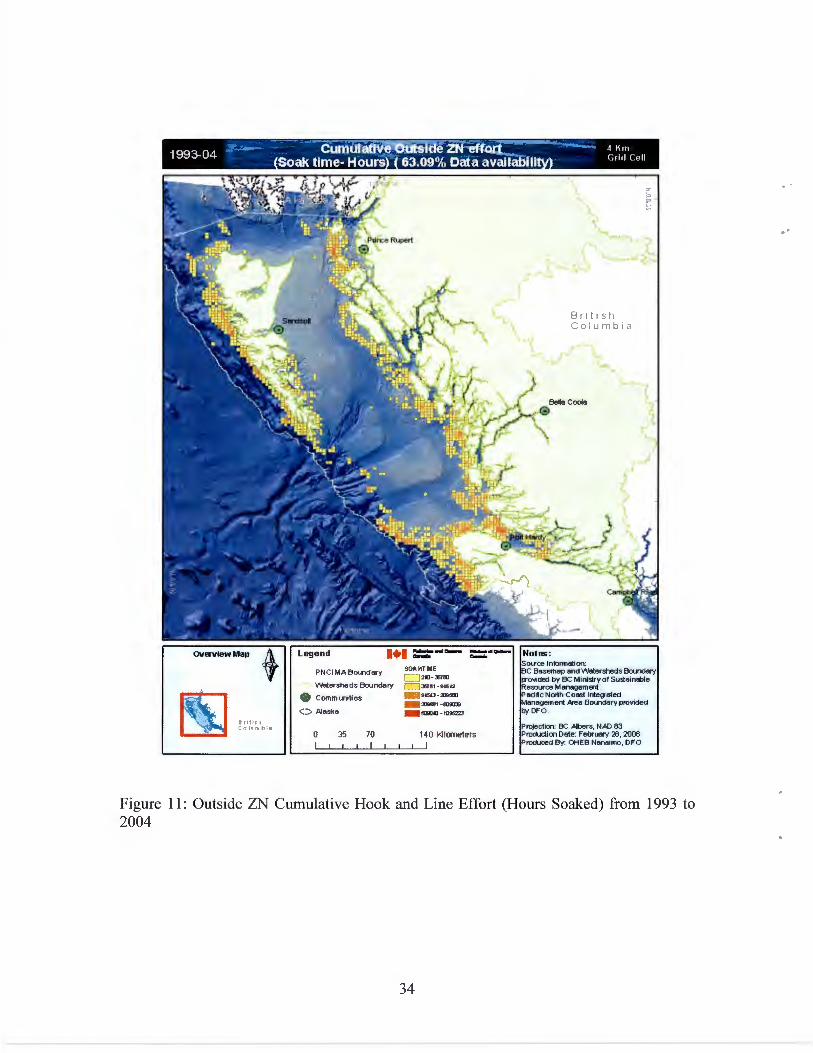
199~04 --- - ·"Cliin~e zN-effo ~- --~-- 1_ ~~~~ Soak time- Hours 63.09% Data availabili (, , ,, ( '"1
8 rill I ~
C•J ! ' lf1l•!a
PNCIMABound"'y
Watersheds Boundary
G> Communiti es
(:;-. Aleska
0 35 70
SOA KT IM E 240-JSfSl
5!1 -~&542
94St:J - Z)g~
-~1-Sl91:m
- s:a::uo -1D9522J
140 l<l lometers
I
8 ri t 1 s h Co l um iJ l a
Scx.rce lnformstlon: C Basemap ond Watersheds Bound"'Y o,;ded by BC Ministryof Susainobl e esoll'ce Managem5'lt . adtc North Coastlnlegated
nag em ent .Aieo Boundory provided DfO.
Figure 11 : Outside ZN Cumulative Hook and Line Effort (Hours Soaked) from 1993 to 2004
34
..

..
-~- Cumulative scliectUiill"Fl'Sfie~Effort--~-- 4 Km 1996-04 (Effort_minutes) (70.90 % Data avalfability) Grid Cell
llllt!t' c\) 1' m t>!a
PNCIMA 80ll'1dary Eff'OII!T_MIN
0 Watersheds Boundary ,.,.. . ..,., • .,11·~
• Communities -~t- snm
-.::) .AJaska - .. ar. m~ea
0 35 70
I 140 Kilometers
I
8 r it 1 s h Columbia
Swce Information: BC Bt~semap ond Wtlterltleds BOIXldtlly FJ'Oiide:l by BC Miniotry of SUstliM:>Ie Resoll'ce Mt~nt~gem«ll . P!ldtcNorth Coasllnlegaled hlaneaemenl ,ore., Bomdarv provided I:>!DfO.
P rejection: BC ,1\jbers, N I'D 83 Production D.,.e: Febrt.lti!Y 211, 2006 Produced By: OH EB Nantlimo, OF 0
Figure 12: Groundfish Schedule II Cumulative Hook and Line Effort (Minutes) from 1996 to 2004
35

As illustrated in Figures 11 and 13, the majority of the ZN hook and line fishery takes place within the PNCIMA while the remainder occurs on the west coast of Vancouver Island; the inside rockfish fishery primarily takes place in the Strait of Georgia.. Figure 13 represents all commercially harvested ZN catch including by-catch.
3000
2500
i 2000 1: 1:
g 1500 ..c::
~ 1000
500
0
Hook and Line Zn Catch (tonnes)
~ ~ ~ ~ ~ ~ ~ ~ ~ -~ ~ ~ ~ ~ ~-~~~ ~ ~ ~·
Year
I PNCIMA Catch J
---- Coastwide Catch
Figure 13: ZN Catch in the PNCIMA vs. Coast-wide for 1995 to 2004
Fishing licences for the Schedule II hook and line fishery represent a fishing privilege given to all commercial vessel-based licence eligibilities. Under this license privilege, vessels are permitted to harvest lingcod, dogfish, sole, flounder, skate and Pacific Cod. Directed trips have been primarily chosen to target lingcod and dogfish although recently there has been more directed effort for skate. The relative catch of Schedule II species in the PNCIMA vs. coast-wide catch is depicted in Figure 14, and represents all catch including by-catch. Distribution of effort in the Schedule II fishery can be seen in Figure 12.
36
. .

..
Hook ard Lire Scredue II Catch
7000
6000 +--------
,/ Iii 5000
........................
• ~ ------------~---. ' c 4000 -;--------! I ~ 3000 - ;---------
0 2000 +----------------------------------------1-------------------------
1 000 - -- --- --------- ---------- ---- -----
1996 1997 1998 1999 2000 2001 2002 2003 2004
Year
- PNCIMA Catch
---- Coastwide Catch
------------~----~--------------~----------------
Figure 14: Hook and Line Schedule II catch in the PNCIMA vs. Coast-wide for 1996 to 2004
Halibut
The halibut fishery dates back to the 1880s with both US and Canadian vessels landing BC stock; however, by 1910, stocks were already showing signs of over fishing. As a result, an international treaty was established and the International Fisheries Commission (later to become the International Pacific Halibut Commission) was formed in 1923. After the 200 nautical mile (NM) jurisdiction was instated in 1977, fishing in Canadian waters was limited to Canadian vessels only and, in 1979, a limited entry system into the halibut fishery was implemented.
During the 1980s, catch per unit effort was low. However, the development of new technologies in the 1990s resulted in catch per unit effort skyrocketing along with landings. As a result of increased landings, an overall total allowable catch (TAC) -based on annual stock assessments - was set and, in 1991 , an individual vessel quota (IVQ) was implemented and is still used today.
Fishing for halibut is conducted by longline gear (either conventional or snap-on) and has annual openings coast wide with the exception of a few small areas (Figure 15). Decreasing the incidence of seabird by-catch has become an important issue in all longline fisheries and it is now mandatory to deploy seabird avoidance mechanisms while setting fishing gear. Rockfish conservation measures, such as closed area strategies, have also been introduced to protect depressed rockfish populations and the by-catch of inshore rockfish.
The majority of halibut (approximately 80 percent) landed in BC is sold fresh to US markets, while the remainder stays within Canada or is shipped overseas. The distribution of fishing effort for halibut varies significantly within BC waters.
37

D 8 ! It I J ~
co 11 mb 13
C) PNCIMABoundary
C• Watersheds Boundory
G) Communities
<:::> .aJaska
0 37.5 75
#Skates
J5 - 1822
11!23-5101
- 5102 - 10915
- tmtT-2D4 - :DJl5- 41J1'29
150 l<l lometers t
B r1 t 1 s il Co lumb ia
Sourc• hfofmaion: BC Bu..m~ ~ W.ers:heds: Boood~ pro\4ded by B C ll.llininy of Sus.tain;ab le Resouroe M~ emenl . P;~ciic tbrtl Co;~st lnlltg..-ed Mln~g<ement Pna Boun dfiYproiMed byOFO . Hll ibut ish wy effort informMion proWled by !PH C
Projection : BC ~rs, NAD 83 Product kin One : r. n:h 17 , 20~ Produced By: OHEB Nanalrro, OFO
Figure 15: Halibut Cumulative Hook and Line Effort from 1991 to 2004
38
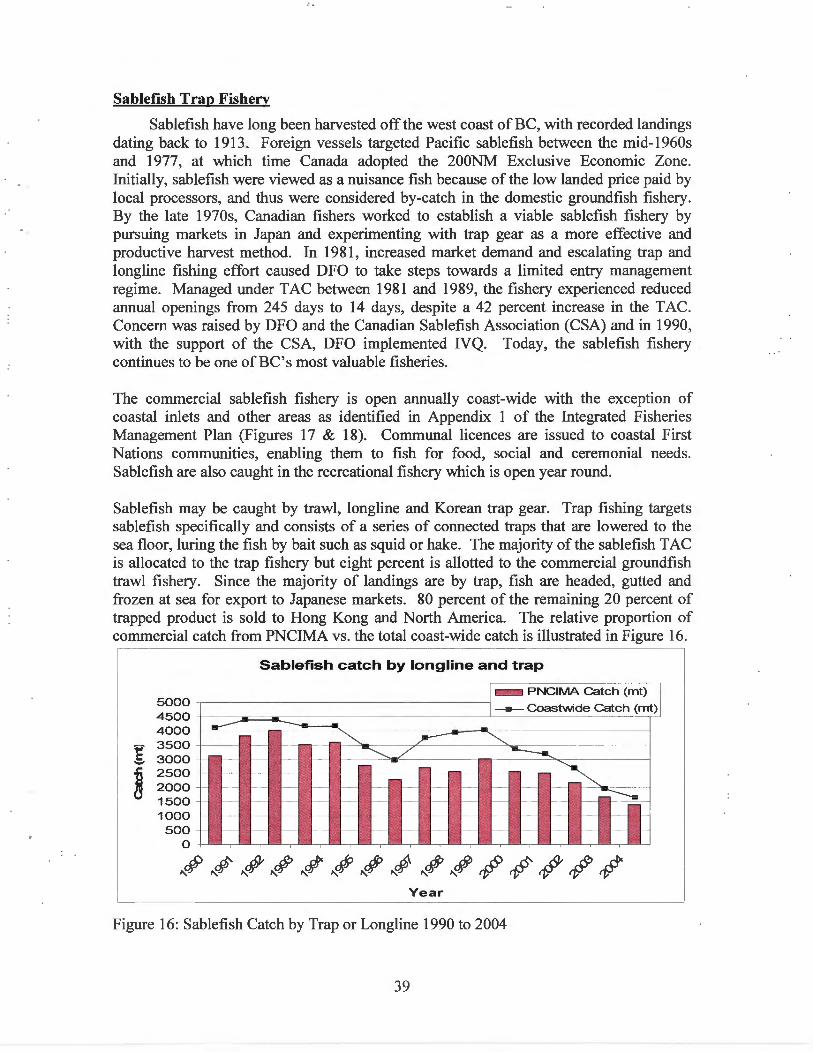
..
Sablefish Trap Fishery
Sablefish have long been harvested off the west coast ofBC, with recorded landings dating back to 1913. Foreign vessels targeted Pacific sablefish between the mid-1960s and 1977, at which time Canada adopted the 200NM Exclusive Economic Zone. Initially, sablefish were viewed as a nuisance fish because ofthe low landed price paid by local processors, and thus were considered by-catch in the domestic groundfish fishery. By the late 1970s, Canadian fishers worked to establish a viable sablefish fishery by pursuing markets in Japan and experimenting with trap gear as a more effective and productive harvest method. In 1981, increased market demand and escalating trap and Iongline fishing effort caused DFO to take steps towards a limited entry management regime. Managed under TAC between 1981 and 1989, the fishery experienced reduced annual openings from 245 days to 14 days, despite a 42 percent increase in the TAC. Concern was raised by DFO and the Canadian Sablefish Association (CSA) and in 1990, with the support of the CSA, DFO implemented IVQ. Today, the sablefish fishery continues to be one ofBC's most valuable fisheries.
The commercial sablefish fishery is open annually coast-wide with the exception of coastal inlets and other areas as identified in Appendix 1 of the Integrated Fisheries Management Plan (Figures 17 & 18). Communal licences are issued to coastal First Nations communities, enabling them to fish for food, social and ceremonial needs. Sablefish are also caught in the recreational fishery which is open year round.
Sablefish may be caught by trawl, longline and Korean trap gear. Trap fishing targets sablefish specifically and consists of a series of connected traps that are lowered to the sea floor, luring the fish by bait such as squid or hake. The majority of the sablefish TAC is allocated to the trap fishery but eight percent is allotted to the commercial groundfish trawl fishery. Since the majority of landings are by trap, fish are headed, gutted and frozen at sea for export to Japanese markets. 80 percent of the remaining 20 percent of trapped product is sold to Hong Kong and North America. The relative proportion of commercial catch from PNCIMA vs. the total coast-wide catch is illustrated in Figure 16.
Sablefis h catch by longline and tra p
5000 4500
1- PNCIMA Catch (mt) .1
J - Coastwide Catch (mt)
4000
~ 3500
...... 3000
~ 2500 2000 1500
-- --~~ - -~-~ ~ .r- ~ ~ - - - ~ ~ / ----...
~ -~ - - - t~ -
=~ = - -
-~~ -~ - - ~- - - - - -
-~ -~ - - - - - - - - t' - - - -1000 ~ - - - - - - - - ff - - - - - - -
500 0
-~ - - - - - - - - 1- - - - - -
Year
Figure 16: Sablefish Catch by Trap or Longline 1990 to 2004
39

Brl tlt ' Co II m 0 13
PN CI MA Boundary
,- Watersheds Boundary
@ Communities
C> !llaska
0 35 70
#traps used
,.,. ...... - --·1t::IIZ . ...... :IDII!O
- :JDil · .,.,,
-·--
140 Kilometers I
Notes :
British Col u mbia
SOU'ce lnb"mation: BC &~emeop ond Woler-ds Boundary rro\oidej by BC Mini.try of Su.t!linable Resource Managemort . Padtc Nollh Coast lntegated Management .&rea Booo!Wy provided ~DFO.
Projection: BC !lJbers, NMl 83 ProdudionDate: February J3, 2006 Produced By: OHEB Nanaimo, DFO
Figure 17: Sablefish Cumulative Trap Effort (Number of Traps) from 1996 to 2004
40
. "
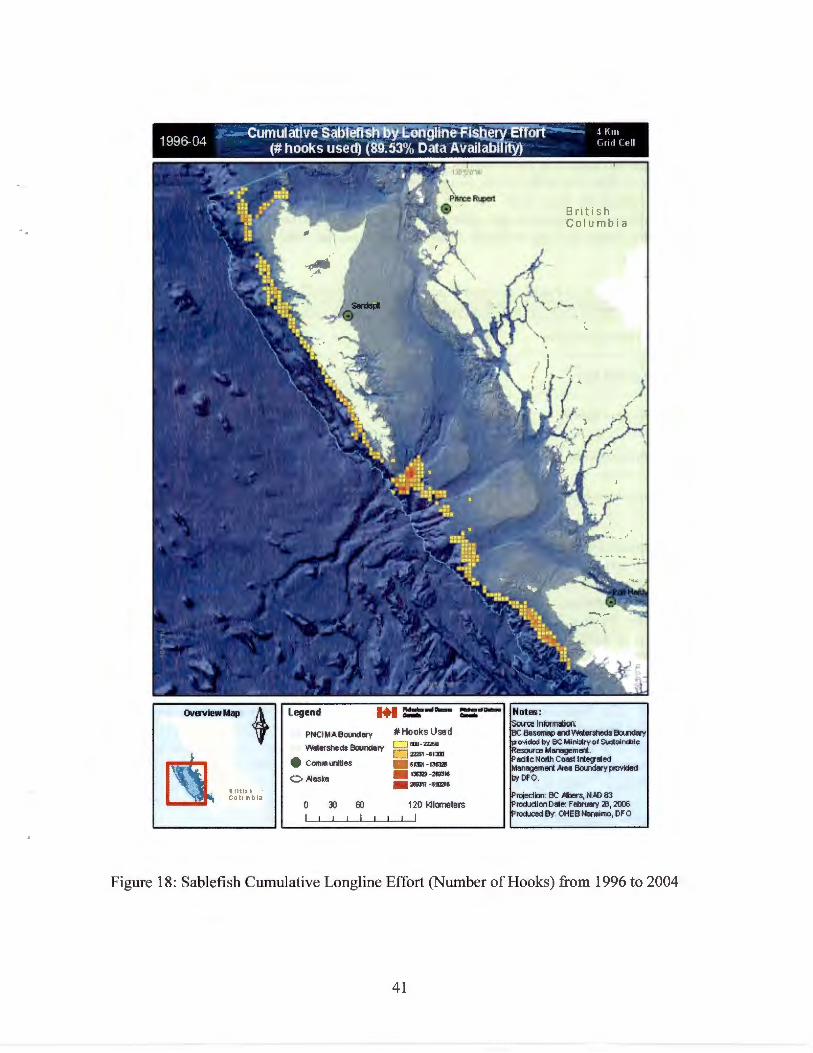
--- cumulatfvesalllefisli bY'i!Qiigllne~isberY Efron --~- 4 ~~~~ 1996-04 (#hooks used) (89.53% Data AvailabliitY) Grod (P.II
B rlt lt ~ Cf.i h m Ol:a
PNCIMABoundary
Watersheds Boundal)'
0 30 60
#Hooks Used tw-7Zl50
22251 -~ 1:11]
- ~1311 -1JQ<!I - 136J20 -26!1316
- 26!1311-5!11216
120 l<llometers I I
Briti s h C o l umbia
Swce lnb'malion: Basemap and Watersheds Bou1dary
0'-Adod by BC Mini::try of SuSaindllc esource Managem!Jt. !Idle North Coast lrte!Jaled
nagem!Jt kea Boundary provided DFO.
Figure 18: Sablefish Cumulative Longline Effort (Number ofHooks) from 1996 to 2004
41

Salmon
Pacific salmon (Table 5) have been intricately linked to the history, economy and culture of Canada's west coast for thousands ofyears. They are also an important part of both diet and culture of First Nations people. Pacific salmon are anadromous, spending a portion of their life in the ocean, returning to fresh water to spawn, after which they die. Their habitat is vast, more or less spanning the entirety of North Pacific Ocean. Depending on the species and individual stock, Pacific salmon distributions may range from the shores of Asia to North America, and from the Artie Ocean to as far south as California.
Table 5: Species of Pacific Salmon Targeted in the Pacific Commercial Fisheries Scientific Name Common Name Ima e
Oncorhynchus gorbuscha Pink, (Humpies)
Oncorhynchus keta Chum, (Dog salmon)
Oncorhynchus kisutch Coho, (Silver salmon)
Oncorhynchus nerka Sockeye, (Red salmon)
Oncorhynchus tshawytscha Chinook (Spring, Tyee, King)
The salmon fishing industry began when Europeans settled on the west coast. By the 1870s, a worldwide demand for canned salmon, particularly sockeye, perpetuated the commercial fishing industry. The fishing industry, including both commercial fishing and fish processing, remains one of the most important industries in the PNCIMA to date. However, its size has declined significantly since the early 1990s, due primarily to declines in salmon stocks. A total of 3,380 people worked in the industry in 2001 , constituting a 17 percent decline and 665 fewer jobs than in 1996. The 1996 Pacific Salmon Revitalization Strategy, known as the Mifflin Plan, featured a licence retirement program for commercial fishing licenses, reducing the size of the Pacific fleet by 20 percent. The fleet was further reduced by changes to regulation and several rounds of voluntary license retirements. The number of commercial salmon licenses dropped from 4,112 in 1996 to 2,557 in 1999, a reduction of 38 percent in three years. While landings of a variety of finfish declined from 1990 to 2002, salmon landings fell most precipitously. Total landings fell from 96,000 tonnes to 33,000 tonnes over this 12 year period, and the landed valued declined from $263 million in 1990 to $33 million in 2001 before rebounding to $57 million in 2002.
Commercial salmon licences are issued for three gear types: troll, seine and gill net. Trolling employs hooks and lines which are suspended from large poles extending from the fishing vessel. Altering the type and arrangement of lures used on lines allows various species to be targeted. Trollers catch approximately 25 percent of the commercial harvest. Seine nets are set from fishing boats with the assistance of a small skiff. Nets are set in a circle around aggregations of fish and the bottom edges are then drawn together into a "purse" to prevent escape of the fish. Seine takes approximately 50
42
. .

..
percent of the commercial catch. Salmon gill nets are rectangular nets that hang in the water and are set from either the stem or bow of the vessel. Fish swim headfirst into the net, entangling their gills in the mesh. Altering mesh size and the way in which nets are suspended in the water allows nets to selectively target certain species and sizes of fish. Gill nets generally fish near coastal rivers and inlets, taking about 25 percent of the commercial catch. Licence conditions and Integrated Fisheries Management Plans lay out allowable gear characteristics such as hook styles, mesh size, net dimensions and the methods by which gear may be used.
In BC, Pacific salmon are managed by DFO with the input from various advisory councils. One such council is the Pacific Salmon Commission (PSC), a body formed by the governments of Canada and the United States to implement the Pacific Salmon Treaty. For example, Fraser sockeye is one of the specific stocks the PSC deals with and information is provided to the Fraser Panel with the aim of coming to a consensus on coordinated management actions. However, DFO maintains its position setting escapement goals and forecasting these stocks. Another advisory body is the Pacific Fisheries Resource Conservation Council (PFRCC), which was created as an independent organization to advise the governments of Canada and BC, as well as the Canadian public, on the conservation and environmental sustainability of Pacific salmon stocks and their freshwater and ocean habitat. Each year, the PFRCC produces a report recommending improvements in salmon stock conservation and assessment, and in habitat protection and restoration.
The breakdown of volume of fish landed by species and respective landed values for 2005 is provided in Figure 19. A comparison of coast-wide catch of all salmon species vs. salmon catch in PNCIMA is provided in Figure 20.
43

Pmk. ·46 1r.
VOlUME
S<x:k!l'€1
4'5 Ch1 oo)~ 8 %
Coh 4%
C hum
3S .~ C
LANDIED VALUE
Socl.eye
12
2005 Salmon Tota~: .26,178 ·tonnes 2.005 Salmon Total: $33 .mi.IUon. ($32 8a9,QOO~
Figure 19: BC Commercial Salmon Fishery by Species Breakdown 2004
PNCIMA vs Coastwide Catch All species all gear types
45000 ~--------------------------,
...
40000
35000
30000
.§.. 25000
.!:
.B 20000 J
15000
10000
5000
I c::J PNCirvlA I l- Coastwide
0 ~~~~~~~~~~~~~~~~~~~~~~~~~
1996 1997 1998 1999 2000 2001 2002 2003 2004 2005
Year
Figure 20: Salmon Catch in PNCIMA vs. Coast-wide between 1996 and 2005
44
'.

..
In addition to the lucrative commercial fishery, there is also a thriving recreational fishery on Canada's Pacific coast, in which Chinook and coho are the primary target species. The recreational fishery is addressed more thoroughly in a subsequent section.
Herring
The commercial herring fishery began in the early 1900s, mainly for bait, but was expanded in the late 1930s to provide a dry salted product. The fishery further expanded as a reduction fishery in the 1940s. This fishery continued to increase through to the 1960s but was not sustainable and over-fishing, combined with unfavourable ocean conditions, caused a massive coast-wide stock collapse. Most fisheries were closed between 1968 and 1971. Stock recovery was facilitated by a combination of favourable environmental conditions and low harvest rates.
There are four types of commercial fisheries that target Pacific herring: roe, spawn-onkelp, special use, and food and bait. These fisheries occur in various regions and at different times of the year. All herring fisheries operate within the overall herring quota for a given year. Plans for each fishery are developed on a yearly basis in consultation with First Nations and industry, where current stock status information and yield recommendations from the Pacific Science Advice and Review Committee (PSARC) are presented. Stakeholder comments and advice from these consultations are brought forward to meetings of the Integrated Herring Harvest Planning Committee (IHHPC) and the Herring Industry Advisory Board (HIAB). All herring fisheries take place in one of five different herring major stock assessment areas: Prince Rupert District (PRD), Queen Charlotte Islands (QCI), Central Coast (CC), West Coast Vancouver Island (WCVI) and Strait of Georgia (SOG) (Figure 21 ).
Roe Herring Fishery
The focus of the roe herring fishery is not the fish itself, but the eggs, such that the opening of the fishery is dependent upon sampling of the fish to determine the timing of acceptable roe quality and yield. After the herring are caught, the roe are stripped from the fish, salted and shipped to Asian markets.
The current roe fishery began in 1972 and this higher value fishery allowed for economic gains with much lower total catch (Figure 22). Since 1998, the fishery has been managed with a variant of the IVQ system. The quota for an area is divided equally among the vessels licensed to fish, but the vessels operate in groups or pools to control the fishing effort. Vessels within a pool fish in tum until the quota is achieved for each pool. This process reduces the intensity of the fishery and allows more time to monitor fishing activity. The result is a reduction in the frequency and amount of catch beyond the target limits. Roe herring is fished by both gill net and seine. The breakdown of catch between the two gear types in both PNCIMA and coast-wide is provided in Figure 23 .
45

--- ···~ ----.. ---- Herring ManagmentAreas---. -
Pacific Ocean
legend
0 PNCIMABoundary
• Communities
·~) Alaska
0 55 110
I
B r 1 t 1 s h ColurnbiCJ
Herling M~~Mgement Neas .. ne~:' W "'C
220 Kilometers
I
OG
Notes : SOllee lntlrmalion: BC Basemep and Watersheds Boundii!Y fro'oide::l by BC h4ini.try of SU!IIIinoble Resoll'ce h48118gement. PadlcNorth Coast lnlegaled Manaqem enl .area Boundary provided 0,. DFO.
P rejection: BC l'lbers, N 110 83 Production Dale: March 7, 2006 Produced By: OHEB N11nllimo, DFO
Figure 21: Major Stock Assessment and Management Areas for Herring
46
..

.. ..c: .B C'G Ui (.) Q)
c Q) c Cl g ~ Q)
> <
140
120
100
80
60
40
20
0
HistoricaiHerring Catch in B C Co as ta I W ate rs
1951-60 1960-70 1971-80 1981-90 1991-00 Year
• SG oW CVI
oQCI
. cc o P RD
Figure 22: Historical Yearly Average for the Commercial Herring Roe Fishery, for Each Major Management Region on BC Coast (Data from DFO 2002 Stock Status Reports B6-0 1 to B6-05)
25000 -
20000
i 1: 1: g .r:. 10000 0
~ 5000
Roe herring catch Gill net and Seine PNCIMA vs. Coastwide
1996 1997 1998 1999 2000 2001 2002 2003
Year
Figure 23: Recent Yearly Catch for the Commercial Herring Roe Fishery by Gillnet and Seine
47

Spawn-on-Kelp Fishery
The spawn-on-kelp (SOK) fishery also targets herring eggs but, in this fishery, the fish mortality rate is significantly less. SOK is harvested in one of two ways; either kelp fronds are suspended in open waters (open ponds) or fish are captured by a seine vessel and placed in an enclosure containing suspended kelp fronds (closed ponds). After spawning, the spawn-covered kelp is harvested, trimmed, brined and packaged for transport to Asian markets and the herring are then released.
The commercial SOK fishery occurs in all areas of the BC coast except the Strait of Georgia. Changing consumer preference in the Japanese market and poor economic conditions have caused a dramatic reduction in the market price paid for herring SOK over the last half decade. The average price has plummeted from $40/lb in 1995, to less than $6/lb in 2004. This has caused the total value of the fishery to decline from approximately $22 M to less than $1 0 M.
Special Use Fishery
The special use herring fishery provides opportunities to utilise herring in alternative ways to the mainstream herring fisheries . Herring are caught for use as commercial sport bait, personal-use commercial bait, food, charity sales, zoo and aquarium food, and commercial bait sales. Herring caught for personal-use commercial bait require a one ton ZX licence. A three ton ZY licence is required if the herring are caught for sale. A limit of five active three ton ZY licences can be designated to a catcher vessel at any given time.
Food and Bait Herring Fishery
Herring caught in this fishery are intended to provide a small quantity of herring to firms wanting to engage in secondary processing of herring food products and to satisfy frozen bait requirements of commercial fishermen. This fishery is conducted by seine only, and takes place exclusively in the Strait of Georgia and southern Johnstone Strait where herring over-winter in relatively shallow inlets and bays in preparation for spawning in the spring. Area 13 is the only PFMA within the bounds of this fishery that falls within the PNCIMA, and 900 tons were allocated to this fishery for the 2005 to 2006 fishing season. Allocation takes place by means of a lottery system, where a maximum harvest of 50 tons for each of 18 eligible applicants is set.
Sardine Fishery
The sardine fishery in the mid-1920s to mid-1940s constituted the largest fishery in BC. In fact, this was the largest commercial fishery in the Western Hemisphere during the first half of the 20th century (Hargreaves, 1994 and Wolf, 1992). The reduction fishery in BC began in 1917 with 70 tonnes being landed. By 1926, the 44,000 tonne level was surpassed and huge harvest numbers were being sustained (average of 40,000 tonnes annually) until a collapsing population yielded a mere 444 tonnes in 1947. Following the 1992 return of sardines to the BC coast, an experimental fishery was initiated in 1995 with the goal of ascertaining the stability and feasibility of a full commercial harvest. Since 2002, a small commercial seine fishery has operated primarily on the west coast of Vancouver Island, harvesting approximately 2000 tonnes per year.
48
..
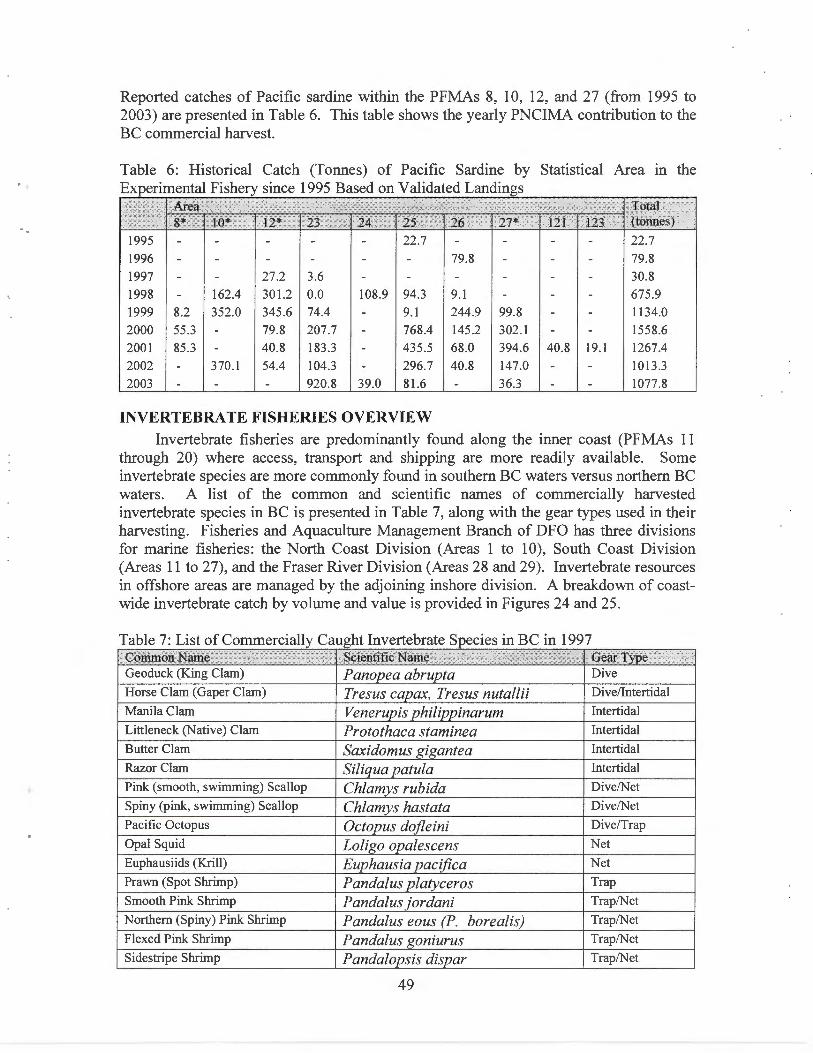
..
Reported catches of Pacific sardine within the PFMAs 8, 10, 12, and 27 (from 1995 to 2003) are presented in Table 6. This table shows the yearly PNCIMA contribution to the BC commercial harvest.
Table 6: Historical Catch (Tonnes) of Pacific Sardine by Statistical Area m the Experimental Fishery since 1995 Based on Validated Landings
Area Total 8* 10* 12* 23 24 25 26 27* 121 123 (tonnes)
1995 - - - - - 22.7 - - - - 22.7
1996 - - - - - - 79.8 - - - 79.8 1997 - - 27.2 3.6 - - - - - - 30.8
1998 - 162.4 301.2 0.0 108.9 94.3 9.1 - - - 675 .9 1999 8.2 352.0 345.6 74.4 - 9.1 244.9 99.8 - - 1134.0
2000 55 .3 - 79.8 207.7 - 768.4 145.2 302.1 - - 1558.6 2001 85.3 - 40.8 183.3 - 435.5 68.0 394.6 40.8 19.1 1267.4
2002 - 370.1 54.4 104.3 - 296.7 40.8 147.0 - - 1013.3
2003 - - - 920.8 39.0 81.6 - 36.3 - - 1077.8
INVERTEBRATE FISHERIES OVERVIEW Invertebrate fisheries are predominantly found along the inner coast (PFMAs 11
through 20) where access, transport and shipping are more readily available. Some invertebrate species are more commonly found in southern BC waters versus northern BC waters. A list of the common and scientific names of commercially harvested invertebrate species in BC is presented in Table 7, along with the gear types used in their harvesting. Fisheries and Aquaculture Management Branch of DFO has three divisions for marine fisheries: the North Coast Division (Areas 1 to 1 0), South Coast Division (Areas 11 to 27), and the Fraser River Division (Areas 28 and 29). Invertebrate resources in offshore areas are managed by the adjoining inshore division. A breakdown of coastwide invertebrate catch by volume and value is provided in Figures 24 and 25.
Table 7: List of Commercially Caught Invertebrate Species in BC in 1997 Common Name ·; Scientific Name i Gear Type Geoduck (King Clam) Panopea abrupta Dive
Horse Clam (Gaper Clam) Tresus capax, Tresus nutallii Dive/Intertidal
Manila Clam Venerupis philippinarum Intertidal
Littleneck (Native) Clam Protothaca staminea Intertidal
Butter Clam Saxidomus gigantea Intertidal
Razor Clam Siliqua patula Intertidal
Pink (smooth, swimming) Scallop Chlamys rubida Dive/Net
Spiny (pink, swimming) Scallop Chlamys hastata Dive/Net
Pacific Octopus Octopus dojleini Dive/Trap
Opal Squid Loligo opalescens Net
Euphausiids (Krill) Euphausia pacifica Net
Prawn (Spot Shrimp) Pandalus platyceras Trap
Smooth Pink Shrimp Panda! us jordani Trap/Net
Northern (Spiny) Pink Shrimp Pandalus eous (P. borealis) Trap/Net
Flexed Pink Shrimp Pandalus goniurus Trap/Net
Sidestripe Shrimp Pandalopsis dispar Trap/Net
49

Common Name Coonstripe Shrimp
Humpback Shrimp
Dungeness Crab
Red Rock Crab
Red (Alaska) King Crab
Golden (Brown) King Crab
Gooseneck Barnacles
Red Sea Urchin
Green Sea Urchin
Giant Pacific Sea Cucumber
Sea
Intertidal Clams
Shrimp
Scientific Name
Panda/us danae Panda/us hypsinotus Cancer magister Cancer productus Paralithodes camtschatica Lithodes aequispina Pollicipes polymerus Strongylocentrotus .franciscanus Strongylocentrotus droebachiensis Parastichopus caftfornicus
Oy!'tersFarmed
Gear Type Trap/Net
Trap/Net
Trap
Trap
Trap
Trap
Intertidal
Dive
Dive
Dive
Figure 24: Landed Weight of Commercial Invertebrates Averaged from 1995 to 2000
Octop Green
Intertidal urchin Clams
Red
Figure 25: Landed Value of Commercial Invertebrates Averaged from 1995 to 2000
Geoduck and Horse Clam Fishery
The commercial dive fishery for geoduck (Panopea abrupta) and horse clams (Tresus capax and T nuttallii) in BC began in 1976. The fishery expanded rapidly until
50
..

'.
1979 when licences were limited and harvest quotas were set for conservation. In 1989, with the support of the commercial industry, a management program with individual quota (IQ) for geoduck was initiated. As part of this initiative, area licensing and a threeyear area rotation period for the fishery were implemented. Geoduck licence quotas were set at 1155 of the annual coast-wide quota, and fishers were required to select one of three licence areas in which to fish. Horse clams are generally harvested incidentally to geoduck but are not included in the quota system.
Geoduck and horse clams are harvested commercially by divers using high pressure water delivered through a nozzle known as a "stinger", which loosens the substrate around the clam and allows the diver to lift the clams out live. Harvested geoducks are quickly shipped to processing plants where they are packed and usually delivered live to Asian markets. First Nations harvests for food, social and ceremonial purposes are limited to the gear specified for shellfish in their communal licence. Commercial gear cannot be used for recreational harvest and, as a result, the recreational fishery is limited to hand digging methods only.
The commercial licence year runs from January 1 to December 31 . The location of the fishery and schedule of openings and closings varies annually. Commercial fishery openings are scheduled to allow for a year-round supply of geoduck to the market. The most recent (2002 to 2004) cumulative geoduck clam effort has been mapped and is illustrated in Figure 26.
Geoducks are one of the most valuable invertebrate fisheries with a peak landed value of $43 million in 1995, and $42 million in 2000. This high value is driven by increasing market prices as a result of lower actual landings in recent years than in the past. In 1987 BC landings peaked at 5203mt (more than double current landings) but with a value of only $6 million (Figure 27).
Due to a lack of stock assessment information, the commercial fishery for horse clams has been limited since 1992 to an incidental fishery only when the geoduck fishery is open (Figure 28). Studies on the productivity of horse clam stocks and preliminary abundance surveys have lead to two pilot fisheries for horse clams at Comox Bar in the Strait of Georgia, and in Lemmens Inlet on the west coast of Vancouver Island. These closely monitored fisheries began in 2003, and were continued in 2004, with the exception of Lemmens Inlet experimental fishery which was not viable due to the number of horse clams available. The Comox Bar fishery occurred again in 2005 with an assigned quota of 20,500 lbs (1 0,000 kg). Surveys to find a new site to continue the experiment on the west coast of Vancouver Island are being considered. Catch and other harvest data will be recorded. The fishery will also provide some insight into the assessments and response by the market.
51
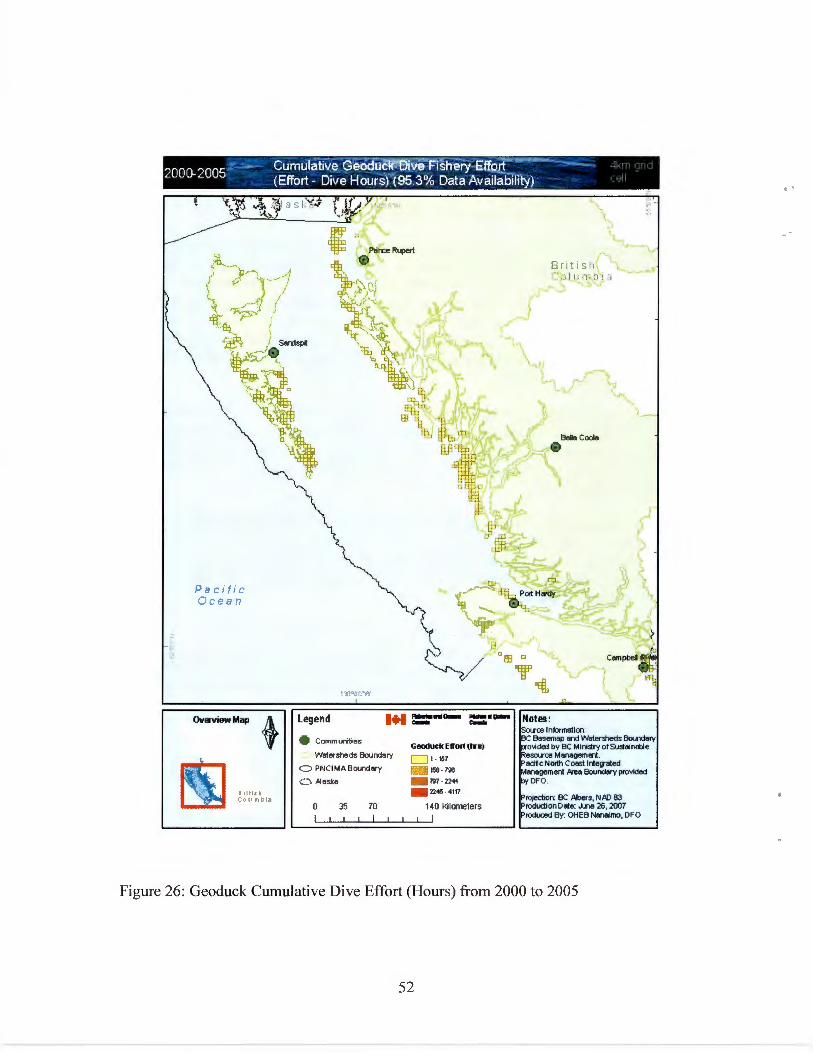
2000-2005 . - Ciiim.ilatlve Geodocl< ~:.:f:ff~-· · ·- ~ (Effort- Dive Hours) '(95.3% Data Avaftabilfty} ·- ·
Pa c if ic Oce a n
Ovi!IView Map t lrltlt;l CO II m D !a
Legend
• Communities
... ----·- .... Wlltersheds Brundory
0 PNCIMABoundory
Geoduck E.-ort (tn)
1- 157
158 · 7gcj
- Nl - 2244 ·.::.:..) .AJaska
0 35 70
- 2246 - 4117
140 Ki lometers
I
B ..... Coola
ce lnl:lrmation: Basemap and Watersheds Boundary
O'Aded by BC Miristry of Sustoinlt>le esouroe Monagement. odftcNorlh Coast lnlegated
gemenl MO Brundory provided DFO.
Figure 26: Geoduck Cumulative Dive Effort (Hours) from 2000 to 2005
52
..

6000
5000
f 4000 +-----"fi 3000 1;j 0 2000
1000
0 - T
<X> 0 1'-- <X> 0) 0)
N ""'" <X> <X>
0) 0)
PNCIMA Geoduck catch (mt)
- - -
- - -
T T I T T
co <X> <X> <X> 0) 0)
0 N 0) 0) 0) 0)
Year
PNCIMA Catch (mt)
----.....- CostaiNide Catch (mt)
""'" co <X> 0 N
0) 0) 0) 0 0 0) 0) 0) 0 0
N N ""'" 0 0 N
Figure 27: Geoduck Catch (Metric Tonnes) in the PNCIMA vs. Coast-wide from 1978 to 2004
Horseclam C a t c h PN C IMA v s. Coas twide
300
250
2 0 0
s ~ 150
PNCIMA Catch
100
Year
Figure 28: Horse Clam Catch (Metric Tonnes) in the PNCIMA vs. Coast-wide from 1980 to 2004
Intertidal Clam Fishery
Most of the north coast is closed to harvesting due to the risk of paralytic shellfish poisoning. The majority of intertidal clam landings are from the inshore waters of the south coast and the west coast of Vancouver Island. Evidence of clams having been historically harvested by First Nations people include clamshells found in middens throughout BC. Early settlers also harvested clams and a small commercial fishery existed before the tum of the century.
53

Today, the commercial clam fishery is relatively small, but widespread in the south coast area. All harvesting is done by hand-digging in intertidal areas, usually at low tide. The fishery is managed by minimum size limits (allowing for a least one spawning year), time and area openings, and to a limited extent, by quotas in selected areas.
Squid Fishery
Opal squid are fished primarily as bait for the sablefish, crab and halibut fisheries . There is an increasing interest in marketing opal squid as a food source but, due to strong Californian and Chinese fisheries, demand for BC product is low. Opal squid are primarily fished with seines in B.C., although the use of dip nets, frame nets and jigs is allowed. Squid are attracted to the vessel at night by bright lights, and a seine is set around the aggregated squid. Historically, landings have been quite variable from year to year and have mainly been sourced from the west coast of Vancouver Island in PFMA 23. In addition, PFMA 2, 6 to 9 and 27 have contributed to landings as well. Landings peaked in 1994 at 118mt, with a landed value of approximately $200,000 (Figure 29). PNCIMA landings have historically been relatively low but increased in 1995, 1997 and 1998 in the north coast areas (PFMAs 1 to 1 0). Although rare, aggregates of squid in BC have been significant enough to support a commercial fishery but it is often difficult to predict their location.
Recreationally, the fishery remains open year-round but is limited to fishermen who use squid for their own consumption. There are permanent closures in marine reserves and parks as well as restricted areas, in order to protect rockfish. The rockfish closure in restricted areas prohibits jig (hook and line) fishing but does allow the use of seine and ring nets.
Opal squid Catch in PNCIMA vs. Coastwide
Year
r PNCIMA Catch I
1- Coastwide Catch j
Figure 29: Opal Squid Catch in PNCIMA vs. Coast-wide from 1982 to 2003
54

Shrimp Fishery
The shrimp fishery is managed using Shrimp Management Areas (SMA) (Figure 30). The SMAs are managed independently with their own opening times, closing times and T AC ceiling. Vessels used in the fishery are generally small tow beam or otter trawl.
Historically, shrimp catches occurred in three major areas: the inshore waters of the Strait of Georgia, the coastal areas off the north coast inlets, and the waters off the lower west coast of Vancouver Island. However, in 1996 shrimp landings increased significantly as fishers expanded their fishing areas to include previously-unexploited areas, including the offshore areas of the central coast. After 1997, the duration of the fishing season was limited, and a catch ceiling was implemented for most areas (Figure 31).
Highly productive areas include the Prince Rupert Shrimp Management Area, Queen Charlotte Sound (QCS) in the north coast and the offshore waters of PFMA 23 on the WCVI (Figure 32). However, since 1998 QCS has been closed due to eulachon by-catch issues. Since 1999 little fishing activity has occurred in the central coast inlets due to market conditions.
Due to the ecological impacts of the trawl fishing industry, there are permanent fishery closures in BC Ecological Reserves and in other areas such as Mcintyre Bay and Cumshewa Inlet to protect other stocks. Fishery delays have occurred to protect crabs during their soft-shell period. The shrimp fishery is also monitored for its by-catch of halibut and eulachon and efforts are underway to ensure the protection of hexactinellid sponge reefs identified in Hecate Strait and Queen Charlotte Sound.
55

__..... ... --~~.....:~ ~~ ... --,.....---~ Shrimp Trawl "Management Areas~~ -
Pacific Ocean
OVavlew Map
'" I I rfl ttl3
1250FF
l:.tO"U'O"!Hf
Legend 1+1 = ... -0 PNCI MA Bot.ndary
@ Communi ties
<.:> Alaska
0 65 130 260 Kilometers I
Figure 30: Shrimp Trawl Management Areas
56
Shrimp Trawl Areas
D ••• c:J .. t::J•• c:J n• c:J to U "''' c.::J tZtO f f ;m
0 1250 ., r.:::J ztoff 8:1"
tX>ff D ZJII tz• G:] D>ff ~-
Q t2101T G:J z••• c:J!t• G::J t' c:::J :zs:•• c=J t x&
.. -· c.:J •• IZ!I n c::J :zlll

PNCIMA Shrimp by Trawl catch (mt)
8000
7000 -1~--------------------~r\~================~--1
6000
~ 5000
..r::::: 4000 (.) -
PNCIMA Catch (mt)
~ 3000 -~~~~~~~~~~-=-.~~~--~~--~~~~~~~~~-!
1000 -
0 1'- ro 0> 0 T""" N C') v lO (!) 1'- ro 0> 0 T""" N C') v ro ro ro 0> 0> 0> 0> 0> 0> 0> 0> 0> 0> 0 0 0 0 0 0> 0> 0> 0> 0> 0> 0> 0> 0> 0> 0> 0> 0> 0 0 0 0 0 T""" T""" T""" T""" T""" T""" T""" T""" T""" T""" T""" T""" T""" N N N N N
Year
Figure 31 : Shrimp Trawl Catch in PNCIMA and Coast-wide Total from Logbooks
Dramatic coast-wide increases in 1995 and 1996 landings were due to a number of factors: changes in the groundfish and salmon fisheries which resulted in an increase in effort on shrimp fishing; the high market price for shrimp during this time, coinciding with a decline in Washington and Oregon fisheries and; abundant stocks available to the BC fishery (Bartosh, 2001). The subsequent decline in 1997 was due to management changes in response to the increased fishing effort the previous two years. Management changes included the implementation of catch ceilings for most areas, the development of industry funded programs to monitor catches and the establishment of a stock assessment program.
57

-- Curhu~ Flsner.Y, n ft-....__ .j Krn 1996-04 (Tow Hours) ( 93:39% Data availab f (;ri.t ( " 11
OVerview Map
llrlttt. l (:u I I 1T1 V13
@ Communities
PN CIMABoundary
Watershe ds Bounda ry
<:~> .AJeske
0 35 70
Bnti s h C olurnb1a
=·- Notes:
TCIW_HOU RS
. "" t21 · :8• ----- Bliii - t:Jiiil
- 13h · ZZO
140 Kilometers
I
Sotrce Information: Basemap and Wateroheds Boundary
o\4ded by BC I>Ainigry of Sugeinoble eSO<Xce Management . adtcNorth Coast lnlegated
gemenl Aree Bound<lry provided DF O.
Figure 32: Shrimp Trawl Cumulative Effort (Hours Towed) from 1996 to 2004
58

Shrimp Trap Fishery
Between 1995 and 1999, north coast area humpback and coonstripe shrimp trap catches ranged from 36.9 to 92.7 tons (Morrison, 2002). The majority came from SMAs 3 to 6 and coincided with higher prawn landings. The humpback shrimp fishery occurs in Prince Rupert Harbour and in Masset Inlet where the prawn fishing is prohibited in order to accommodate a humpback shrimp fishery. Likewise, coonstripe shrimp are fished mainly in the south western portion of Vancouver Island in Sooke Harbour and Sooke Basin in Juan de Fuca Strait.
Prawn Trap Fishery
The commercial prawn trap fishery commenced in 1979 and is the most valuable of the shrimp species commercially harvested. The trap fishery accounts for 98 percent of the total prawn landings, the remaining two percent being shrimp trawl by-catch (Morrison, 2002). The primary market for fresh or frozen shrimp, whole or tailed, is Japan. The market value for prawns peaked in 1997 at over $26 million although a recalculation of these data suggested that the true value was more likely $28.5 to $32.5 million. Figure 33 shows the relative catch rates in PNCIMA vs. coast-wide total. Figure 34 shows the distribution of the prawn fishery in PNCIMA from 2001-2004.
2500
2000 -
Prawn catch (mt) by Year in PNCIMA
PNCIMA Catch (mt)
----- Coastwide Catch (mt)
~ ~ 1500 ---- ------------------------------/~----~-----------1
..c s 1000 -1-------- -----------/---------IU~------------------1
§ 8 8 N N N
Year
Figure 33: Prawn Catch in PNCIMA and Coast-wide Total from Logbooks
59

OVentiew Map
II I lt It ~ Co It m b Ia
;).
Watersheds Boundary
PN CI MA Boundary
G Communities
<::> !'I aska
0 40 80
SOAKHR S ~1 . 1478
1477 . 4284
-418~ · 9878
- 9877 - 19399
- 19400 . 38410
;'
-·.......
160 Ki lometers
Notes:
8 ri tis h Columb i a
SoU'ce I nmmati on BC Basemap ond Watermeds Boundaty p-o..;ded by BC Ministry of SUstainable Resource Management . Pacific North Coast lnte~rated Management !>rea Boundary provided by DFO.
Projection: BC Albers, N AD 83 Production Date: Februaty ;B, 2006
L....:=::::::::::::::::::::::::::::_ _____ _j Produced By: OHEB Nanalmo, DFO
Figure 34: Prawn Cumulative Trap Effort (Hours Soaked) from 2001 to 2004
60

Crab Fishery
The inception of the commercial crab fishery occurred prior to 1900, with the first recorded landings in 1885 (Butler, 1984). The fishery is currently managed under a precautionary regime that includes limited entry licensing, area licensing, trap limits, soak limits, a minimum harvestable size limit, sex restrictions, soft-shell restrictions and gear restrictions. There are a set number of licence eligibilities for this fishery and harvesters are required to select a licensing area for three years at a time (Figure 35).
Crabs are harvested commercially using traps or ring nets. Traps are frames covered with webbing that form an enclosure. Crabs gain access to the enclosure through a tunnel or door, which may be triggered to form a one-way entrance. Ring nets consist of a circular frame holding a bag of web. Crabs are captured in the web bag when they cross the edge of the frame and the frame is lifted. Both traps and ring nets are baited with fish, squid, offal or pellets. Traps can be fished on single lines or on ground lines with multiple traps. Ring nets are fished on single lines only.
The 2003 and 2004 seasons recorded the highest landings on record with over 6000 tonnes per year (Figure 36). In both years the value of the fishery was also the highest on record, $38 and $45 million respectively, despite the fact that the average price per kilogram was not as high as in previous years at $5.40 and $4.97. Very high effort levels in Area A dominated the total overall coast-wide effort in 2003 and 2004 (Figure 37).
61

·---t:"':"*~---.....__ ~-~--....._.. 'l ,r 1 '"-'
1 1 - Crab Management ~reas~-- · . 1 ,
A
OVBView Map
ll l t U k C •) I t m D1a
E
Legend
0 PNCIMABOlXIdary
• Communi ties
<_;, )llaska
0 40 80
Figure 35 : Crab Management Areas
...
rw.. ... a-. __ .,_. - -Crab Management Areas
MJ Ac:J I
- · (2;] 1 CJ •
62
0
160 Ki lometers
I
Notes:
MJ jl
B r 1 t 1 s h Colu mbi a
Sollee Information: BC Basemap and Wateroheds Bomdaly p-<Mded by BC Ministry of SUstoinollle ReSOU'ce l!lanagemS'It . Paa•c Nortn Coastlrteg-EIIed Management l'lea BOllldary provided by DFO.
Projection BC .AI:lers, N.aD 83 Production Date: March 7, 2006 Produced By: OHEB N8118imo, DFO

Dungeness Crab Catch (tonnes) in PNCIMA by Year
BOOO ·.------1 PNCIMA.Catch (mt)
7000 +------1 --+-- Coastwide Catch (mt) ~~~~~~~~~~~-.o~oc-~--J
6000 1-~~~~--JA,..-~~~-----------/
"E sooo ~4000 -~ 3000
1000
0 o)')
~
q; (\J '!) ot o)') o)') o)')
~ ~ ~ ~ "'
.., r- ro o)') 0 0 o)') o)') o)') o)') o)') 0 ~ ~ ~ ~ ~ 0 0
(\J (\J
Year
Figure 36: Dungeness Crab Catch in PNCIMA vs. Coast-wide Total
63
(\J '!) ot 0 0 0 0 0 0 (\J (\J (\J

2000-04 -. -----·· -C m IYJt __ [iJj ry ." ~ I Km
Da s soaked 90.01 % Data availabili · Grul cen
lllltlt . cv J• lr! t• l3
0 Communities
PN CI MA Boundary
Watersheds Bour<lary
{.:) Al aska
0 30 60
SOAK_Oi\YS ., .. - Bl'5 · l!l!l2
- 1£1 · 2!il50.
- 25151 · 4211•
120 l<l lometers
I
Brit isl1 Columbi a
Figure 37: Crab Cumulative Trap Effort (Days Soaked) from 2000 to 2004
64
Sea Urchin Fishery
The red urchin and green urchin fisheries are managed separately, as their distribution and targeted markets are quite different. Both are dive fisheries , but hand rakes are permitted in red sea urchin harvesting while green sea urchin harvesting is limited to hand picking only.
The red sea urchin fishery commenced in the late 1970s and predominated in the south coast areas. In the early 1980s, landings increased throughout the south coast but were outpaced by rapid increases in the late 1980s on the north coast. In 1992, effort levels were stabilized through management actions with north and central coast areas dominating the fishery (Figure 40). The total annual landed value has generally increased throughout the red sea urchin fishery, peaking in 1997 at approximately $14 million and a corresponding catch level of over 12, 000 metric tonnes (Figure 38).
Compared to the red urchin fishery, the green urchin fishery has experienced boom and bust harvesting patterns and is currently in a recovery period. This fishery is being stabilized through active management strategies, including stable effort and landings, increased catch per unit effort (CPUE) and limited quotas. Fewer landings have been recorded during fishing seasons 2000 to 2001 and 2001 to 2002 (Figure 39), primarily due to increased competition from Russia. This has caused prices to drop substantially and, in turn, fishermen have decreased their fishing efforts such that landings are not a depiction of actual green sea urchin abundance. Indeed, a steadily increasing CPUE between 1993 and 2003 indicates that fishers are finding green urchins more easily which, in turn, suggests that the population of green urchins is increasing (or recovering from earlier over-fishing). Presently, the PFMAs open to fishing include Areas 18, 19, and 20 (south coast) and 11, 12 and 13 (southern central coast), which have historically contributed less than 90 percent to the coast-wide effort in BC (Perry, 2001/2002) (Figure 41).
65

14000
12000
10000 -.... E 8000 -~ (J
6000 .... 111 0
4000
2000
0
Red Urchin Catch (mt) in PNCIMA
N C"> '<t l{) (j) (j) (j) (j) (j) (j) (j) (j)
'Year
PNCIMA Catch (mt)
----..-.-- Coastwide catch (mt)
(!) ,.._ CX) (j) (j) (j) (j) (j) (j) ..-- ..-- ..--
Figure 38 Red Sea Urchin Catch in PNCIMA and Coast-wide Total
Green Urchin Catch in PNCIMA
1200 .-------------------------------------------------,
1000
z-800 E ..t:600 (J -111 0400
200
0
PNCIMA Catch (mt)
---+---- Coastwide Catch (mt)
,.._ 00 Ol 0 ..-- N ~ '<t l{) <D ,.._ ex:> Ol 0 ro oo ro m m m m m m m m m m o m m m m m m m m m m m m m o
~ ~ ~ ~ ~ ~ ~ ~ ~ ~ ~ ~ N
Year
..-- N 0 0 0 0 N N
(")
0 0 N
Figure 39: Green Sea Urchin Catch in PNCIMA and Coast-wide Total
66
'<t 0 0 N

200o.
2005 - cumuhatlveREfci trrci11n•DJve Fishery .. £;~---. . ,_, .
(Effort- Dive Hours) (96.3% Data Availab1lfty) ' ·~
Pacif i c Ocean
t:::O"D'O'W
legend 1+11 =-a-. ::::·~ Rellln:hin Effort (ITsl 2000·2005
Communities
<::::> Wlllersheds Boundary
0 PNCIMABoundary
·.:.:.) .AJe.ske
0 35 70
4 - 99
100 - 2<16
- 247 - <114
-<11~ - 9<19
140 Kilometers
I
Notes: Smrce lnformtltion:
Basemap and Wlllersheds Bollldary o>id<d by BC MlnlstryofSustalneble eSQlJ"ce Menaaemont. adftcNorth CoiiiS!Irie~Tated
gem eli .Area Boundary provided DFO.
Figure 40: Red Urchin Cumulative Dive Effort (Hours) from 1997 to 2003
67

--- ·curru.ilat•ve Gn~e'rf tlrcli•A ·D•~FiSheiY:t.~ ~~ , , , 1 1 -~ 2000-2005 (Effort- Dive Hours) (89.3% Data Availability) ' ~'
Pacific Ocean
Overview Map + !lfltl t ' en 1' m bta
1:30.,)'0'\Ui
legend
0 Communities
0 Watersheds Boundary
0 PN CIMABoundary
..:..:..:-. .a.J aska
0 35 70
G<oen ll"chin Ellert [hrs)2000-05
u - .a
- tMi - 3il'
- 2&1 - S'I'4i
Bella Coole
G>
Notes: Lroe Information: Basemap and Watersheds Boundary
o'llded by BC Mini.try of Su.tainoble esot.Wce Managem51t. adft c North Coast lntegated
Management !>rea Boundary provided DFO .
rojedion: BC I'Jbers, NAD 83 140 ~lometers rodudionDate: June 26,2007
1 Produced By OHEB Nanalmo, DF O
~=========-----~
Figure 41: Green Urchin Cumulative Dive Effort (Hours) from 2000 to 2005
68

Sea Cucumber Fishery
The sea cucumber hand-picking dive fishery is small and limited. It began in BC in 1971 , primarily in the southern coastal waters. In 1980, a scientific fishery commenced and markets were established. Concerns were raised, particularly with respect to the lack of knowledge about sea cucumber recruitment and the possibility of localized extinction. Localized extinctions are thought to be caused by fishers frequenting the same site and regularly removing all of the visible adult cucumbers, causing dramatically reduced densities at that site. A small recreational fishery also occurs but, because landings are unrecorded, the exact extent of this fishery is unknown.
The commercial fishery is managed through limited entry licensing, area licensing, a precautionary fixed exploitation rate of 4.2 percent, area quotas and an IQ program. The coast is divided into three categories: approximately 25 percent of the total coastline in non-contiguous areas devoted to the commercial fishery, 25 percent in experimental fisheries and the remaining 50 percent closed to harvesting until these areas are determined to be sustainable.
Up until 1987, harvesting was only permitted along the south coast with the majority of landings occurring in the Strait of Georgia. The north coast was opened for harvest in 1986 but there were no recorded landings until 1987. The central and north coasts (PFMAs 3 tolO) currently support about 80 percent of the fishery, representing the majority of catch weights coast-wide as well as the PNCIMA (Figures 42 and 43).
Sea cucumber catch (mt)
1600
1400
1200
1000
! ~
800
600
400
200
0
.... ~
1\ I~ I PNCUW\ Catch ( rrt) I
I ' - Coastwid (rrt) •
\ \ __/_ -
- - -
-f- \ ,.,---
---- - I - - - - - -
\ ~ - ~- - - - - - - -
! - - - - - - - - - - - - - - - - -
M- - - - - - - - - - - - - - - - - -
11 [!!
Year
Figure 42: Sea Cucumber Catch in PNCIMA and Coast-wide Total
69

--· ·c.:iinuta~-Rsl:l~Eiforr------ cj,,,,,l, 1 2000-2005 (Effort- Dive Hours)'(78.4% Data Availcibilily') ' ~11
Pacific Ocean
OvBView Map t &fl tlt ' C(l l t m bla
1:50"1)'0"\tlo'
legend
0 Communities Sea D.Jcunber Elf at (hrs) 2000·0~
0 Watersheds Boundary 8 · u
0 PNCIMABoundary - .. . ,. - DJ · m
. .:.:_:-., .AJaska -~· · 0
0 35 70 140 Ki lometers
I
Notes: Socrce lnformstim:
Basemap and Watersheds Boundary o\ide:l by BC Miniotry of Suotai n~e escuce Managem!nl . adfic North Coast lntegated
gemenl Ma Boundary provided by DFO .
Projection: BC !lJbers, NAD 83 rodudionDate: June 26,2007 roduced By: OHEB Nanalmo, DFO
Figure 43 : Sea Cucumber Cumulative Dive Effort (Hours) from 2000-2005
70
CONSERVATION AREAS
The PNCIMA encompasses a complex, interconnected array of natural marine habitats. Some of the pristine areas within this region are protected under federal and/or provincial legislation designed to prevent human disturbances. Some areas have legalized conservation status that allows limited activities within their boundaries. There are ten types of federally and provincially managed marine conservation and protection areas within the PNCIMA, including a proposed Marine Wildlife Area (MW A), a proposed National Marine Conservation Areas (NMCA), a National Park, and Rockfish Conservation Areas (RCA), as well as provincial Ecological Reserves, Provincial Parks (including Marine Parks), Conservancies, a Protected Area, Wildlife Management Areas (WMA), and Wildlife Reserves (Figure 44). Municipal and regional parks are primarily established to enhance recreation opportunities and, to a lesser extent, to promote public education about the marine environment.
A marine protection area, or "MPA", refers to an area legally established to protect all or a portion of the sea surface, water column, seabed, and/or associated flora, fauna, recreational, scientific, cultural and historical features, and may include an area established under one or more of the following provincial or federal statutes:
a) a "marine protected area" established under the Oceans Act S.C.1996, c. 31; b) a "national marine conservation area" or "NMCA" established under the
Canada National Marine Conservation Areas Act S.C. 2002, c. 18, and includes an NMCA reserve where there are unresolved Aboriginal rights claims that have been accepted for negotiation by the Government of Canada;
c) a "national park" with marine components established under the Canada National Parks Act S.C. 2000, c. 32, and includes a national park reserve where there are unresolved Aboriginal rights claims that have been accepted for negotiation by the Government of Canada;
d) a protected marine area (known as a marine wildlife area) or "wildlife area" (known as a National Wildlife Area) established under the Canada Wildlife Act R.S.C. 1985, c. W-9;
e) a "migratory bird sanctuary" established in the marine environment under the Canada Migratory Birds Convention Act,1994 S.C. 1994, c.22;
f) a "provincial park", "recreation area", or "conservancy" established in a marine environment under the Park Act {RSBC 1996) c. 344 or the Protected Areas of British Columbia Act [SBC 2000) c. 17;
g) an "ecological reserve" established in a marine environment under the Ecological Reserve Act {RSBC 1996) c. 103 or the Protected Areas of British Columbia Act [SBC 2000) c.17;
h) a "protected area" or "conservation study area" established in a marine environment under the Environment and Land Use Act [RSBC 1996) c. 117;
i) a "land reserve" or "notation of interest" established over Crown land and water in a marine environment under the Land Act [RSBC 1996] c. 245;
j) a "wildlife management area" established in the marine environment under the Wildlife Act [RSBC 1996] c. 488.
71

MP As are integral components of ecosystem-based management and sustainable development of human activity in the PNCIMA. They include but are not limited to: unique coastal inlets, bays or channels; representative marine areas; boat havens with important anchorages; marine-oriented wilderness areas; cultural heritage features; critical spawning locations and estuaries; species-specific harvesting refugia; foraging areas for seabird colonies; summer feeding and nursery grounds for whales; offshore sea mounts or hydrothermal vents; and a host of other special marine environments and features.
Several RCAs were implemented by DFO within the inland waters of Johnstone Strait and the Strait of Georgia at sites where scientific assessments discovered the most apparent stock declines. Twenty percent of rockfish habitat is planned for RCA protection on the west coast of Vancouver Island, central coast, north coast and Queen Charlotte Islands.
Located in the offshore area from the PNCIMA, Canada's first MPA under the Oceans Act is the Endeavour Hydrothermal Vents located 250 km southwest of Victoria. The Bowie Seamount Pilot Protected Area, 180 km west of the Queen Charlotte Region, is being considered as the next Oceans Act MP A in the Pacific Region. These two unique ecosystems are important sites for conservation and protection of marine biodiversity. At Endeavour Hydrothermal Sea Vents, the organisms that form the basis of the biological food webs are very unusual in that they are able to harness the chemical energy present in sulphur-rich geothermal seafloor emissions, while primary producers in most other food webs use direct sunlight as an energy source. Recent scientific study at these offshore hot vents has uncovered 22 new families and 100 new genera of species. The Bowie Seamount has been identified as an area of interest for migratory birds by the CWS of EC and the seamount itself is a CWS confirmed area of importance to marine and coastal birds mandated by Canada's Migratory Birds Convention Act.
Canada's network of National Wildlife Areas (NWA), MWA and Migratory Bird Sanctuaries (MBS) are essential habitat for migratory birds and other wildlife species. A MWA is a NW A that reaches beyond the 12 nautical mile territorial sea limit out to the 200 nautical mile exclusive economic zone limit. There are no NWA or MBS located in the PNCIMA at this time; however, the Scott Islands Archipelago has been proposed for MW A designation and may be the first MW A to be established in Canada. The Scott Islands are also a globally Important Bird Area (IBA) recognized by Bird Life International, the Canadian Nature Federation and Bird Studies Canada which coordinates the Canadian IBA program. The Scott Islands are located 46 km in a north westerly direction from Cape Scott at the northwest tip of Vancouver Island. More than two million seabirds nest on the islands every year, which includes 55 percent of the world's population of Cassin's Auklets, seven percent of the world's population of Rhinoceros Auklets, and two percent of the world's population of Tufted Puffins. The three outermost islands and a one kilometre buffer of marine area (Beresford, Sartine and Triangle islands) are currently protected as BC ecological reserves. The two innermost islands (Lanz and Cox islands) and a one kilometre buffer of marine area are designated a Class A Provincial Park. These five separate provincial protected areas comprise the Scott Islands.
72

The purpose of a NMCA is to conserve and protect a network of 29 examples of diverse marine environments in the coastal zones of Canada's Atlantic, Arctic and Pacific Oceans and the Great Lakes. NMCAs combine ecologically sustainable use with smaller zones of high protection within submerged lands, the water above them, and any species found there. They may also include wetlands, estuaries, islands and other coastal lands. NMCAs are managed by Parks Canada in a manner that aims to protect the physical and biological characteristics of the greater ecosystem as well as sites with unique cultural, archaeological or historical values. Marine uses such as fishing and shipping are permitted but limited or excluded in zones representing sensitive features such as nesting areas, spawning beds, whale calving areas and cultural sites. Ocean dumping, undersea mining and oil and gas exploration and development are not permitted in an NMCA (Dunsmuir, 2004).
Federal-provincial agreements in BC have been proposed for two areas representing three of the remaining 28 examples of marine regions under consideration for NMCA designation: Gwaii Haanas and the proposed southern Strait of Georgia region. The proposed Gwaii Haanas NMCA is located in the southern portion of Haida Gwaii (Queen Charlotte Islands) in the PNCIMA. It consists of the southern end of Moresby Island and associated islands in Southern Haida Gwaii. Gwaii Haanas includes 147,000 ha of land, 340,000 ha of marine area and 1,700 km of shoreline (Gueret, 2004).
The purpose of Canada's National Parks is to protect natural environments that are representative of Canada's natural heritage. Parks Canada manages human use of national parks to maintain their ecological integrity while providing opportunities for public understanding, appreciation and enjoyment. Gwaii Haanas National Park Reserve is the only national park in the PNCIMA and has no official marine designation.
BC Parks' mission statement is: "to protect representative and special natural places within the province's Protected Areas System for world-class conservation, outdoor recreation, education and scientific study". There are twenty-nine BC marine provincial parks that were established in the PNCIMA between 1914-1997 encompassing 306,917.2 hectares (45,406.5 ha of marine area, 261, 510.7 ha ofland area). One of these parks has class R provincial park designation; the other twenty-eight are class A provincial parks.
Class A provincial parks are areas designated for the preservation of their natural environments for the inspiration, use and enjoyment of the public. The 1995 Park Act amendments increased flexibility for accommodating grazing, hay cutting and other uses that existed at the time the park was established. Resource extraction activities such as commercial logging, mining, hydro electric development are prohibited in Class A Provincial Parks. Other activities that use or disturb natural resources, like commercial recreation (guided sport fishing, for example) require a Park Use Permit. Park use permits are not issued with respect to an interest in land or natural resources unless the Minister deems it is necessary to preserve or maintain the recreational values of the park involved. Class A parks can be designated by either order in council under the Park Act or by inclusion in a schedule to the protected areas.
73

The Park Act was amended in 2006 to introduce the conservancy designation to implement government's land use decisions for the Central Coast and North Coast. This new protected area designation was intended to recognize the global significance of specific areas on the Central Coast and North Coast, to recognize the importance of these areas to First Nations and to allow a wider range of low impact, compatible economic opportunities to be permitted than possible in a Class A park
Conservancies are set aside (a) for the protection and maintenance of their biological diversity and natural
environments, (b) for the preservation and maintenance of social, ceremonial and cultural uses of first
nations, (c) for protection and maintenance of their recreational values, and (d) to ensure that development or use of their natural resources occurs in a sustainable
manner consistent with the purposes of paragraphs (a), (b), and (c)."
The purpose of provincial protected areas is to protect representative examples of biological diversity, recreational and cultural heritage areas, as well as special natural, cultural heritage and recreational features. The provincial protected area in the PNCIMA is called the Huchsduwachsdu Nuyem Jees/Kitlope Heritage Conservancy and is located in the Queen Charlottes/North Coast Mainland region.
BC's provincial ecological reserves originated from Canada's decade-long research commitment to the International Biological Program (IBP), the mandate of which is to establish a system of representative terrestrial and aquatic ecosystems around the world. Canada completed approximately 1000 check-sheets of biologically important sites between 1964 and 197 4 placing the country alongside Australia and the US in leading efforts with the IBP. Many sites were identified in BC, which subsequently became the foundation ofthe Province's ecological reserves system. Ecological reserves are Crown lands selected to preserve ecosystem integrity, maintain biological diversity and protect genetic diversity by:
• Protecting rare and endangered plants and animals in their natural habitat. • Preserving unique, rare or outstanding botanical, zoological or geological
phenomena. • Perpetuating important genetic resources. • Enabling scientific research and education associated with natural environments.
Twenty six ecological reserves were established in the PNCIMA between 1971 and 1991 totalling 39,865.3 hectares of land (including upland) and water (including foreshore and offshore) (BCWLAP, 2001).
A WMA is an area where conservation and management of wildlife, fish and their habitats is the priority, but other uses may be permitted. Reef Island, Limestone Islands, Skedan Islands and Cluxewe WMAs are located within the PNCIMA.
Provincially designated wildlife reserves are designed to protect important estuarine or foreshore habitat. Wildlife reserves within the PNCIMA are: Beaver Cove (Kokish Estuary), Campbell River Estuary, Cluxewe River Estuary and Kingcome River Estuary
74

in the Johnstone Strait/Queen Charlotte Strait regions, as well as Shelden's Bay, Skidegate Inlet, Watun River Foreshore, Kumdis Bay, Naden Harbour in the Queen Charlottes/North Coast Mainland region.
Br l tlt • co 11 m 013
2005 RockfiSh
0 Watersheds Bound~ry Conservation Areas
0 37.5 75
E223 BC PrctectedAreas
Gwau Haanas NM CA
150 Kilometers I
Sotrce hbmaion: BC Basem3p , Wlttrst...:d BooodaryS. p<OIO<Iod lfOI Spro-dby BCMinistry of Sustainable: A!souf'tlt WINigtmt:nr . Paoiic N:uf'l Coast lnb! ped l'lt4inagement .Anla Boood.-y iiOd RCAI: pro~byOFO. N.ICA BoundoryproUded by Parks Canada
Projection: BC ~bers:, HAD 83 Production Dole: Mord\29 , 200G Produced By: OHEB N.naifT'O , Cf'O
Figure 44: Areas of Marine Protection and Protected Areas in the PNCIMA
75

CRUISE SHIP INDUSTRY
Cruise ship activity in the PNCIMA is comprised of two main segments. The first segment is made up of large vessel cruise ships that travel through the region, some of which make port of call stops in Prince Rupert, while the second segment includes smaller ships of the pocket cruise industry, which make stops at many ports in the region. The Discovery Coast passage cruise operated by BC ferries between Port Hardy and Bella Coola has been included in the second segment. Each segment is described in detail with the extent and frequency of activities highlighted. Future development plans of the large vessel and pocket cruise industry are described where possible. Although there was little explicit information available from secondary sources, this report indicates existing or potential conflicts the cruise industry may have with other user groups.
The cruise industry in BC is estimated to be worth approximately $500 million to the economy. In the PNCIMA, the cruise industry contributes to the marine use as its members travel open waters and visit port facilities, as well as to the overall human use of land tour attractions. It is difficult to accurately predict the outlook for the cruise industry in the PNCIMA due to the volatile and changeable nature of the tourism industry. It seems that cruise ship activity in the waters of the PNCIMA and the number of ships making port of call stops at communities in the PNCIMA will continue to increase.
While over 300 large cruise vessels pass through the PNCIMA along the Inside Passage Marine Highway en route to Alaska (Figure 45), only 49 of those vessels, carrying 94,206 passengers, would have stopped at the Prince Rupert Northland terminal in the 2005 season. The remaining vessels do not stop in the PNCIMA area, and may travel directly from Vancouver to Alaska, or make a port of call stop in one of the southern BC ports (Victoria, Nanaimo or Campbell River). The main ports of call for the pocket cruise vessels are Prince Rupert and Alert Bay. Bella Coola and Port Hardy are the northern and southern terminus, respectively, for the Discovery Coast Passage cruise.
Prince Rupert attracts over 100,000 cruise ship passengers per season, and hopes to host 250,000 passengers per year within 10 years. The city is aiming for steady increases in vessel and passenger numbers during this time. Currently, the communities of Port Hardy and Sointula are also actively attempting to attract pocket cruise ships. Although the Central Coast Land and Resource Management Plan and the North Coast Land and Resource Management Plan both identify marine cruising as an activity for potential tourism development, the pocket cruise industry outlook for the region is less clear.
Most analyses predict economic benefits to communities from passengers engaging in shore excursions or purchasing retail items, with estimates of per passenger dollars spent at ports of call ranging from $40 to $139. The Prince Rupert Port Authority expected passenger spending in the local economy to surpass $4 million for the 2006 season. Forecasts of passenger spending on tours and attractions in Prince Rupert in 10 years are between 24 and 36 million dollars.
76

Although the cruise industry is well positioned to provide economic benefits to local economies, environmental and social impacts have to be acknowledged and managed to minimize negative outcomes. Environmental issues include the dredging, construction and installation of harbour facilities, while social impacts tend to be more speculative (as little research has been completed on social impacts of cruise activity in the PNCIMA), but may include increasing land values, challenges of large influxes of tourists into communities, and balancing the seasonality of the cruise industry with long-term employment needs. There are also potential conflicts with other industries. One example is the need to maintain scenic corridors of forest stands along the coast and the potential economic impact to forestry activities. Both the environmental and social impacts of the cruise industry and its continued development in the PNCIMA area need to be monitored and managed in relation to other existing or potential marine and human uses.
The PNCIMA area encompasses parts of three "units" that are designated and used by Tourism BC, North Vancouver Island (Mount Waddington Regional District), the central coast, and the north coast (part of northern BC) unit. Until the 1980s, tourism was a relatively minor component ofthe economy of northern Vancouver Island. The paving of Highway 19 from Campbell River to Port Hardy, and the relocation of the BC Ferries Inside Passage terminal to Port Hardy in 1979 has helped the tourism industry grow in the region. Despite growth in the number of travelers (particularly drawn to the BC Ferries Inside Passage to Prince Rupert and Bella Coola, wildlife viewing and outdoor adventure), the region attracts less than two percent of the total visitors to Vancouver Island. Tourism opportunities for the area include ecotourism and developing the region as a destination for a range of outdoor activities, as well as cultural tourism focusing on First Nations (Penfold, 2004). It seems that these types of shore and marine-based activities are consistent with shore excursions that may attract pocket cruise passengers. Future development plans appear to highlight both pocket cruise and large vessel cruise as areas for development in the PNCIMA.
Tourism activity in the central coast area is a significant and growing component of the central coast economy (mainly during the summer tourist season from June to September). Annual two way traffic into the Bella Coola Valley by land, air and water transportation is estimated to be approximately 30,000, with more than half of these trips during the summer season. The Discovery Coast BC Ferry acts as a cruise route taking passengers to various coastal communities on the central coast including Port Hardy, Bella Bella, Ocean Falls, McLoughin Bay, Shearwater, Klemtu, and Bella Bella. This route is estimated to carry 8,000 passengers to the Central Coast each year.
Tourism service providers in the north coast area have always promoted the excellent sport fishing within its coastal areas, as well as prime wildlife viewing opportunities. Sport fishing lodges are located throughout the north coast area within many mainland and Queen Charlotte Island inlets and bays. Additionally, prior to the development ofthe fledgling cruise ship tourism, Prince Rupert marketed itself as the Gateway to Alaska This was due to the location of the Alaskan Ferry dock within its civic boundaries.
77

Pacific Ocean
Overview Map
Figure 45 Cruise Routes
Legend 1+1
• PNCIMA Boundary • Communities
Watersheds Boundary - Cruise_routes
C";"· Alaska
0 I
50 100
I
78
200 Kilometers
I
r
·, v
\
I \
" '
(
Notes:
British Columbia
J i
Source Information :
'J'.J
"'
8C Basemap and Watersheds Bounda provided by BC Ministry of Sustainat>e Resource Management. Pacific North Coast Integrated Management Area Boundary provided by DFO.
Projection: 8C Albers. NAD 83 Production Date: February 25. 2005 Produced By: OHEB GIS Unit. DFO

INTERNATIONAL CRUISE INDUSTRY The passenger totals for the international cruise ship industry have grown by
approximately eight percent per year since 1980 (Cruise Line International Association (CLIA), 2005). In 2004, 10.5 million people took a cruise and this total is predicted to reach 11 million people in 2005. In 2004, North American passengers taking a cruise increased by 11 percent to approximate 8.8 million passengers and 62 new ships were introduced to the North American market. The CLIA predicts that cruise activity worldwide will continue to grow; however, overall growth was expected to level off in 2005 with fewer vessels scheduled to be introduced to the North American Market (CLIA, 2005). The North West Cruise Ship Association (NWCA) indicated that the cruise industry is stable, and that the number of passengers of large cruise vessels on the west coast is increasing, but that the number of ships sailing remains constant.
Trends in the Cruise Industry
Trends within the cruise industry are reflective of wider global trends in the tourism industry. These include changing demographic patterns of travelers and increasing demand for individualistic products catered to knowledgeable, quality conscious consumers. The following trends are outlined for the global cruise industry and, where appropriate, any specific relationship to, or opportunity for, cruise ship tourism is highlighted.
The trends have been compiled from a recent Cruise BC Association conference, and have been corroborated by interviews with representatives form the NWCA and the Prince Rupert Port Authority. Not only are these trends significant to understanding the spatial patterns and future directions of cruise travel in the PNCIMA, the trends (particularly those associated with the demographic changes) are significant to identifying the types of land based shore excursions that can be developed near to the cruise ports of call.
Aging Demographics
The key markets for tourism in BC (Prescott-Allen, 2003), the rest of Canada, US and Europe have, and will continue to have, aging populations (CIT, 2004). In BC, the 45 to 65 age cohort is expected to increase by almost 65 percent from 970,000 to 1,512,000. The cruise ship industry is expecting increasing numbers of active retired travelers to book tours. These consumers are looking for less stress in their travel while experiencing customized tours (Pearce, 2005). In addition, the cruise industry is witnessing greater numbers of families and multi-generational groups traveling. The shore based activities for the 45 to 65 age demographic will be essential to accommodating the whole family's needs.
Diversifying Cruise Products
The various types of cruise products that are being offered are expanding and diversifying. Different types of vessels are increasingly being used, including sail powered cruising, smaller ships and cruise yachts. These products are being developed in a range of prices, from those catering to low cost cruising, to luxurious high-end ships.
79

The expanded customer market for cruise products is driving the development of both onboard amenities (CLIA, 2005) (in some cases into floating mega communities), as well as customized packaging of tours for shore excursions. In addition, there is a trend towards different ways of paying for cruises, such as "cruise share" programs (Pearce, 2005).
Market Opportunities for BC and the PNCIMA
Coastal communities involved or aspiring to become active in the cruise industry in the PNCIMA are positioned to take advantage of the identified trends in the cruise industry. The Pacific coast of Canada is recognized as one of the newest and desired destinations for cruising (Pearce, 2005). According to a survey conducted in Vancouver and Seattle, nearly 50 percent of the overall target market is "very interested" or "quite interested" in a BC cruise. These passengers desire to experience the scenic beauty of the province's coast, wildlife and small communities (Wirtz, 2005).
The opportunity for developing BC-only cruises (to date, large vessel cruise ships have only stopped in BC as a port of call and sailed the Inside Passage Marine Highway en route to Alaska), has been highlighted at a recent Cruise BC Association conference (Wirtz, 2005). Member port authorities, of which Prince Rupert is one, are actively focusing on developing cruise products within BC that emphasize the unique characteristics ofBC's history, First Nations' culture and scenic marine environments.
Additional opportunities for the PNCIMA include pocket cruises (see section on pocket cruises), increasing port calls for Seattle to Alaska cruises, or San Francisco to Alaska cruises, and repositioning cruises in the shoulder seasons (April and October) (Wirtz, 2005). An identified reluctance of some American travelers to cross the border (and one of the identified challenges for the BC cruise industry), may encourage port calls for large vessels in the PNCIMA (Pearce, 2005).
Challenges to Cruise Development in the PNCIMA
Despite the favourable market opportunities for cruising in BC, there are a number of challenges to the development of the cruise industry. Collectively, these challenges include increasing oil prices, a lack of confidence, unwillingness to travel or to cross borders, and struggling economies in other source markets (Pearce, 2005). In addition, coastal communities must develop the necessary tourism excursions, tours and infrastructure that are necessary to attract pocket cruise travelers. Prince Rupert's ability to benefit from the cruise industry will ultimately depend on growth within the overall cruise market, the congestion in other ports and the strength of competition from other new or existing ports of call.
CRUISE LINE ACTIVITY
Summary of BC Cruise Activity
Cruise activity in BC is seasonal, with the majority of sailings taking place in the summer months between May and September; the shoulder months of April and October see reduced cruise activity. In the PNCIMA, large cruise vessels did not make a port of call stop in Prince Rupert in April 2005, and only one ship was scheduled to stop in October.
80

The NWCA estimates that approximately 800,000 people visit Alaska on a large vessel cruise ship in one year. Nearly all of the cruise activity of large ships in BC passes through the PNCIMA. The Port of Vancouver expects to see approximately 600,000 passengers per year, while the Port of Seattle expects to see 350,000 to 375,000 passengers. These passenger numbers translate into at least 300 sailings of large cruise ship vessels north through the PNCIMA (note: the inclusion of return trips doubles these sailings). The sailing route of large vessels is typically along the Inside Passage Marine Highway; figure 45 illustrates these routes, all of which pass through the PNCIMA.
Table 8 illustrates the number of large vessel cruise ships that embarked from the Port of Vancouver and the Port of Seattle in 2004; sailings from Vancouver decreased by seven percent while sailings from Seattle increased.
Table 8: Numbers of Vessels and Passengers Traveling from Vancouver or Seattle to Alaska in 2004
~~~~--~--~~
Prince Rupert's ability to capture cruise visitation has been enhanced by the increasing use of Seattle as an originating point for Alaskan cruises. The Passenger Services Act of 1886 stipulates that vessels not owned by US citizens, built by US shipyards and staffed by US citizens cannot transport passengers between US ports. As most cruise vessels are foreign flagged and owned, cruises from a US port to Alaska must stop at a BC port. The Passenger Services Act of 1886 represents a business protection measure that can also be claimed to ensure efficiency, environmental protection, safety and national security in the maritime industry (Dobson, 2002). Although the Port of Vancouver has received considerable benefit as a result of the Passenger Services Act of 1886, the increasing use of Seattle as an embarking port for Alaskan cruises is enhancing the potential for cruise port of call stops in northern BC. Prince Rupert competes with Vancouver, Victoria and increasingly Nanaimo and Campbell River for these port calls.
Of the estimated 300+ ships that pass through the PNCIMA en route to Alaska, Prince Rupert received approximately 49 large vessel cruise ships at its Northland Cruise Terminal in 2005. Of those port of call stops, 33 involved passengers disembarking, for a total of 64,202 passenger visits (PRP A, 2005). Prince Rupert is actively attempting to attract large cruise vessels so as to either complement, or provide an alternative to, ports of call in Alaska.
History of the Cruise Industry
The development of the cruise industry in communities within the PNCIMA has occurred recently and is in part due to the strong and relatively stable market product of the Vancouver/Seattle to Alaska cruise route. Prior to the development of Prince Rupert's Northland Cruise terminal, several pocket cruise ships and the occasional large cruise vessel stopped in Prince Rupert.
81

Apart from the growing marine usage of the PNCIMA by large vessel marine cruise ships en route to Alaska, there was not significant cruise activity until 2004. Pocket cruise vessels have been docking at the Atlin terminal in Prince Rupert since 1998. Large vessels have anchored in the harbour, while passengers are tendered to shore. Data from the Prince Rupert Port Authority show that cruise vessel traffic declined between 1994 and 1997, but has steadily climbed since then. The 2004 season was a significant year in the northern BC cruise ship industry due to the opening of the Northland Cruise Terminal in Prince Rupert, which accommodates large vessel cruise ships of approximately 2000 passengers. During the last 15 to 20 years, in addition to Prince Rupert, pocket cruise companies have scheduled visits to the communities of Alert Bay and Telegraph Cove. Pocket cruise ships continue to berth at the Atlin terminal in Prince Rupert
BC Ferries launched the cruise-like Discovery Coast Passage route in the summer of 1996. Until March 22, 2006 the Queen of the North vessel provided ferry service between Port Hardy and Prince Rupert; however, due to her untimely sinking, the Queen of Prince Rupert has taken over this run. During the summer months, the Queen of Chiliwack makes stops at coastal ports along the central coast on its way to Bella Coola. It is estimated that the Discovery Coast BC Ferry carries 8,000 passengers each year to the Central Coast (Prescott-Allen, 2003). The Discovery Coast Passage ferry seems to be the only mid-sized marine vessel conducting cruise-like expeditions along the Central Coast and, while the Discovery Coast passage tour is not considered a conventional cruise, it nonetheless represents tourist traffic to coastal communities.
POCKET CRUISE SHIP ACTIVITY OVERVIEW
Smaller marine cruising products, typically referred to as pocket cruises, encompass a range of vessels from small boats carrying a dozen or less passengers, to large ocean going ships that carry hundreds of tourists (CPC, 2000). Typically, pocket cruise passengers are more adventurous, physically fit and younger than typical luxury cruise passengers, and are often curious about other cultures, histories and want to appreciate the natural world (Murphy, 2005). In addition, pocket cruises are best marketed to travelers seeking the adventure cruise or yacht-like luxury cruise. The market for a pocket cruise has been identified as well traveled individuals within a mid to high income bracket (CPC, 2000). These trends are significant to marine use for two main reasons:
• These trends provide direction for the development of shore based excursions in or near communities wishing to attract pocket cruise ships.
• The economic benefit of fewer passengers desiring shore excursions of higher value to a local economy will be the same as would be gained from passengers of larger cruise ships but likely with proportionately fewer negative environmental or social impacts. The pocket cruise visitor profile reveals potential benefits for smaller coastal communities along the central and northern west coast.
Pocket Cruise Segments
There are a number of segments of the pocket cruise industry, many of which occur in the PNCIMA. The "Northwest Pocket Cruise" segment represents operators based in Alaska or Washington who travel through Canadian waters en route to US based ports. These pocket cruises may stop in BC waters, often en-route to Alaska, during the shoulder season months of April, May, September and October as vessels reposition. The "Regional Pocket Cruise" departs from within the BC coastal waters region and, in some
82

cases (particularly with small vessels), are contained within the PNCIMA. Circle pocket tours with stopovers in communities are similar to the Discovery Coast Passage cruise that is run by BC Ferries. Although this report does not explicitly consider the following small vessel cruising segments, they are acknowledged as marine uses in the study area:
• The adventure or ecotourism marine cruising that typically takes place with smaller sailing or motor yachts (some activity of this form takes place in and around the Queen Charlotte Islands and the Central Coast).
• Kayak touring on a live-aboard vessel that transports passengers and kayaks to destinations (CPC, 2000).
Pocket Cruise Companies
Cruise BC identified many of these following companies as major pocket cruise companies in the study area. In some instances, discrepancies were discovered, and are noted:
• Lindblad Expeditions: visits Alert Bay and Prince Rupert. • Clipper Cruise Line: visits Alert Bay, possibly Telegraph Cove. • American West Steamboat Company: these tours do not appear to stop at any
communities in the PNCIMA, and only pass through the Inside Passage en route to Alaska.
• Cruise West: usually does not make stops at any ports in the PNCIMA, however, the Spirit of Oceans made a port of call stop in Prince Rupert in the 2005 season.
The following additional pocket cruise companies have been identified: • Natures Best Pacific Wilderness Tours: conducts three to five day tours on the
MV Lasqueti (a 54 foot cruise vessel), that depart from Campbell River and makes port of call stops in Alert Bay and Port McNeil.
• Bluewater Adventures: conducts excursions on the Central Coast (departs from Bella Bella), Queen Charlottes (departs from Sandspit), and North Vancouver Island (departs from Port Hardy or Port McNeil).
Case Study: Prince Rupert
A cruise market forecast conducted by the Canadian Coast Guard (CCG) in March 2001 predicted that the number of cruise passengers visiting Prince Rupert would grow from 40,000 in 2001 to over 200,000 within a ten year period.
Partners in collaboration with the City of Prince Rupert and the Prince Rupert Port Authority have invested over nine million dollars to develop its Northland Cruise Terminal, which opened in May 2004 (Figure 46). An additional $3 million improvement to the associated uplands was completed at the end of April 2005. These improvements included improved roads, walkways, parking, public plazas and tour bus loading areas (Constantineau, 2005).
83

r--~ ..__.
I @
Figure 46: N01ihland Cruise Ship Terminal and Facilities (PRPA, 2005)
Table 9: Numbers ofPassengers Expected by Month to Prince Rupert (PRPA, 2005) Month Passenger Pocket Cruise Major Cruise Number of Vessel 2004 Numbers Numbers Numbers Stops With No
Passenger Disembarkation
May 4637 837 (9) 3800 (2)
June 26424 1024(4) 25400(13) 5 (10000)
July 21562 162 (4) 21400 (II) 4 (8000)
August 23538 138 (3) 23400(12) 5 (1 0000)
September 16045 445 (7) 15600 (8) 2 (2004)
October 2000 2000 (1)
TOTAL 94206 30000
Total estimated disembarking passengers: 64206
The number of passenger arrivals in 2005 represents a 50 percent increase over the number of passengers in 2004. The companies responsible for the large vessel arrivals are the: Norwegian Cruise Line (Norwegian Spirit and Norwegian Dream) and Celebrity Cruises (Mercury).
The pocket cruise companies that made port of call stops in the 2005 season were: • Lindblad Expeditions Cruises (Sea Lion and Sea Bird) • Cruise West (Spirit of Oceanus) • American Safari Cruises (Safari Escape and Safari Quest) • Glacier Bay Cruiseline (Executive Explorer) • Clipper Cruises (Yaletown Clipper) • Radison Seven Seas Mariner (Seven Seas Mariner) .
84
Shore Excursions for Passengers in Prince Rupert
Shore excursions for passengers focus on showcasing the scenic beauty of BC, providing experiences of aboriginal cultures and learning about the history of the community. The shore excursions include sport fishing adventures, wildlife viewing expeditions, hiking excursions, exploration of ancient aboriginal village sites, jet boat tours and guided tours at the Museum of Northern BC. The North Coast Explorer train excursion up the rugged Skeena River Valley or a similar type of activity may also continue (Stevenson, 2004). The North Pacific Cannery Museum is a National Historic Site and it is the main tourism attraction in Port Edward, 20 km outside of Prince Rupert (CPC, 2000).
The Prince Rupert Port Authority estimates that 10,000 passengers in the 2004 cruise season spent $600,000 on shore excursion activities. These figures translate into approximately 30 percent of the passengers taking shore excursions (Keller, 2005). In 2005, the shore excursion program grew with a record 53 percent of passengers on tour from a single ship visit during an August visit and over 21 ,000 passengers participating in tours during the Cruise ship season (PRP A, 2005).
Case Study: Discovery Coast Passage Cruise
The Discovery Coast is the southern section of the Inside Passage that stretches from Port Hardy to Prince Rupert, through the protected waters of BC' s central and northern coastline. During the summer months (June to September), the Queen of Chiliwack makes stops at coastal ports along the Central Coast on its way to Bella Coola. Estimates are that the Discovery Coast BC Ferry carries 8,000 tourists each year (mid June to mid September) between Port Hardy and the Central Coast (CIT, 2004).
The Discovery Coast Passage cruise (of which there a number of different options and packages) has scheduled stops in the communities of McLoughin Bay, Shearwater (Denny Island), Ocean Falls, and Klemtu. Many of the packaged cruises only allow for one or two hours in each port, limiting the possibility of passengers engaging in shoreline attractions and, thus, possibly limiting the direct economic benefits accrued to the local communities. However, the cruises include options for tourists to stay at communities for a longer time, and resume their journey on a later ferry passage.
BC Ferry reports indicate that the Discovery Coast Passage ferry service (Route 40) has experienced annual operating losses of between $1 and $2 million dollars (Grant Thornton, 2002). An economic impact assessment of the Discovery Coast Passage service indicates that the most significant economic benefit to the communities of Port Hardy and Bella Coola is in the form of passenger spending on accommodation, food and other services or products. These passengers generate about 11,556 visitor days in the region annually and the $809,514 they spend supports approximately 10 full time tourism employment positions, or about 2.8 percent of total tourism employment in Bella Coola and Port Hardy (Grant Thornton, 2002).
Since departure and arrival times in both Bella Coola and Port Hardy are either early in the morning or late at night, BC Ferries Route 40 travel supports over-night stays. However, due to the location of the BC Ferry terminals outside ofthe main city centre in
85

both communities, the number of ferry passengers that enter the main business districts is limited (Grant Thornton, 2002).
Case Study: Port Hardy
Port Hardy is a community of 4,575 residents on the north-eastern comer of Vancouver Island which acts as the southern terminus for the Discovery Coast Passage Cruise. Estimates based on analyses of the 2000 and 2001 seasons indicate that the total annual ferry passenger spending is $374,196, with 4,3 01 tourism visitor days by ferry passengers. The same report estimates that four full time positions are generated as a result of the service (Thornton, 2002).
Tourism representatives are interested in attracting pocket cruise vessels but, as of yet, have had little success. However, according to the 2002 to 2007 Strategic Plan for Port Hardy the Regional District of Mount Waddington, together with the Tourism Committee, aim to actively promote Port Hardy Tourism. One of these initiatives involves attracting large vessel cruise ship and pocket cruise stopovers (DPH, 2002).
Case Study: Alert Bay and Telegraph Cove
Alert Bay and Telegraph Cove are communities on north-eastern Vancouver Island with resident populations of 643 and 401 people respectively. Alert Bay is located on Cormorant Island, and is accessed by a ferry from Port McNeil.
Alert Bay receives visits from a number of pocket cruise ships. The main attraction for these cruise passengers is the U'mista Cultural Centre, which highlights First Nations Culture. Telegraph Cove receives visits from a couple of pocket cruise ships, including Lindblad Expeditions, and Clipper Cruises. Both Alert Bay and Telegraph Cove are recognized as having unique shore excursions that attract pocket cruise ships (Murphy, 2005).
ECONOMIC IMPACT OF LARGE CRUISE VESSELS
The International Council of Cruise Lines estimates the total global economic impact of the cruise industry to be approximately 23 billion dollars (US) per year (CLIA, 2005). A report prepared by the Business Research and Economic Advisors (BREA) on the value of cruise vessels to the Canadian economy estimated that the total economic impact of the cruise ship industry in BC in 2003 to be over one billion dollars. Table 3 illustrates both the direct and total economic impacts of the cruise industry in Canada and BC.
Table 10: Economic Impact of Cruise Activity in BC and Canada (BREA, 2004) Direct Economic Impacts Canada BC
Cruise Industry Direct Spending (millions) $965 $660
Employment 8696 6013
Wages and Salaries (millions) $294 $197
Total Economic Impacts Canada ;: BC ········ .....
Total Output (billions) $1 ,851 $1 ,241
Employment 14922 10400
Wages and Salaries (millions) $539 $374
86

Three general sources of economic revenue are identified: • Spending by cruise passengers on goods and services associated with the cruise
including pre and post vacation spending and travel to point of embarkation. • Expenditures by cruise lines for operations, port services at embarkation or port of
call sites, and capital expenditures for equipment or facilities . • Shore side employment for excursion activities or land transportation.
It is expected that the above three types of economic revenue are consistent with the types of revenue generated for the Prince Rupert economy from large vessel ships making port of call stops. One study estimated the per passenger expenditures in BC during 2003 to be $139.00, on average (BREA, 2004). However, the sources of economic revenue for large cruise vessels arriving in Prince Rupert may be misleading due to the fact that Prince Rupert is only a port of call stop and not a port of embarkation or disembarkation. Ports of embarkation or disembarkation have higher per passenger economic impacts because of lodging expenses.
An opportunities assessment for the Prince Rupert Port Authority identified both base level and high level scenarios for shoreline tours, attractions and retail expenditures in its economic impact analysis. The base level scenario predicts the average per passenger expenditure to remain flat, while the number of cruise ship passengers and vessels increases. The high level scenario predicts that the average per passenger expenditure will increase over 10 years due to increasing retail and tour opportunities. Table 4 illustrates the Year One 2004 and Year 10 (2014) base level expenditures and the estimated Year 10 high level scenario expenditures.
Table 11: Base and Two High Level Tour and Retail Expenditures Projections (McDowell Group Inc, 2004)
Year 1 Year 10 YearlO 40000 Passengers w 262,500 Passengers
' 262,50Q Passengers ,
Per Total($) Per ·"' Per Jotal($) ,, Person($) ., Persun($),. 11
.,if :person($)
Avg. Per 80 3,200,000 80 21 ,000,000 120 31,500,000 Passenger Expenqitures
Tours and 60 2,400,000 60 15,750,000 75 19,687,500 attractioq,s
Retail 20 800,000 20 15,750,000 45 11 ,812,500
Average Crew 14 560,000 14 3,675,000 20 5,250,000 member expenditures
Total 94 3,760,000 94 24,675,000 140 36,750,000 Passenger/ Crew
The high level scenario reveals an increase of $12 million Canadian dollars in tour and retail expenditures by passenger and crew members. The projected growth is comparable
87

to the changes experienced in the development and evolution of Alaska's Port Ketchikan (McDowell Group Inc, 2004).
Citing differences between disembarking passengers' spending habits, expenditures which return directly to the cruise companies and an inconsistent number of passengers disembarking at port of call stops, other analysts are less optimistic about the projected economic benefits accrued from the cruise industry (Johnson, 2003). The Cruise BC Association estimates per passenger spending at a more modest rate of $40 to $90 for those passengers taking shoreline tours (Wirtz, 2005).
Despite the discrepancies in per passenger average expenditure and the overall economic revenue estimations, it is evident that large vessel cruise ship activity in Prince Rupert is providing significant contributions to the overall local economy. Passenger spending in the local economy by cruise ship passengers in the 2005 season is expected to surpass four million dollars (Keller, 2005). Future development plans, including the attraction of greater numbers of vessels and provision of opportunities for greater per capita spending on shoreline activities, seem to point towards positive economic potential for the large vessel cruise industry in Prince Rupert.
MARINE USE ISSUES Both large vessel cruise and pocket cruise companies have user conflicts with other
marine and land based activities, as listed below; however, explicit information is not available regarding the details of each:
• Seasonality of cruise industry results in employment positions that are not all full time.
• Influx of large numbers of tourists for short durations could lead to congestion, infrastructure overloads and inadequacies.
• Increasing land values could lead to higher taxes for residents. • Need to maintain visual quality of scenic corridors along cruise routes could
conflict with forestry industry interests. • At sea ship sewage disposals may have indirect negative effects on other marine
industries e.g. fishing and aquaculture, and First Nation shellfish and seaweed harvest sites.
The extent to which the cruise industry may impact the fishing industries in the PNCIMA is unclear. However, cruise ships have the potential to disturb wild salmon habitat or aquaculture sites; for example, pocket cruise ships entering small bays or harbours may come into contact with net-pens or fishing boats. Due to the importance of sport fishing to the tourism industry in the area, further research is needed to explicitly identify potential impacts of cruise ships on the fishing industries.
Consultations with coastal community stakeholders in ten Draft Sea Otter Recovery Action Plan workshops identified the cruise industry (particularly large vessel cruise ships) as a source of human threat through oil pollution (Dovetail Consulting Inc, 2004). Some of the attraction for cruise passengers is the scenic beauty of the coastline, so it is important for the cruise industry that the visual quality of shorelines on routes IS
maintained, with the preservation of wildlife viewing opportunities (PLC, 2003).
88

Since the industry is often presented in terms of the economic benefits it generates, little explicit information is provided on the negative social impacts of cruise activity. The seasonality of the cruise industry with large influxes of tourists into communities for a short period of time may put excessive pressure on existing city or town infrastructure. Increasing land values may create challenges for residents of communities. These factors must be balanced through local community consultation and planning.
89

DEFENCE AND SECURITY AGENCIES
Three federal agencies share responsibility for defence, security, and emergency response activities within the marine area of Canada's coasts (Table 12). The Canadian Coast Guard (CCG), a civilian organization, is charged with the mandate of human safety. The Department of National Defence (DND), Canada's military, enforces and protects Canada's maritime sovereignty and fulfills national security mandates. As well, DND provides aid in times of natural disaster. The Royal Canadian Mounted Police (RCMP), a paramilitary organisation, enforces laws in Canada's territorial sea. As well, a number of other federal agencies have an interest in, respond to, and investigate various incidents within the marine area, namely Environment Canada, Department of Fisheries and Oceans, Transport Canada and the Transportation Safety Board of Canada.
In 2003, Canada's Public Safety and Emergency Preparedness Agency was formed, with a mandate encompassing policing, border security and natural disaster emergency preparedness. This agency integrates already existing forces, departments and agencies into a centralized organization to provide a coordinated response in emergency situations.
The Provincial Emergency Program (PEP) works to respond to a variety of situations such as tsunamis, earthquakes and forest fires. It also coordinates responses within freshwater and land based emergency spills. PEP also provides training, planning and public communications about emergency preparedness. Along with federal departments and agencies, a number of provincial agencies, ministries, and associations provide information and work with PEP to improve public safety, coordinate appropriate responses to threats and provide a network of trained professionals and volunteers.
In addition to federal and provincial agencies, the incorporated Port of Prince Rupert has its own security and safety mandate. This includes communications and coordinated enforcement with TC, Canada Customs and Immigration, and the RCMP.
TC Marine Division Port Programs and Responsible for maintaining Divestitures the safety and security of maritime transportation for operators and passengers of Navigable Waters small vessels. Protection Division
Office ofBoating Safety
Divesting regional/local ports to locallybased port operators; oversee/monitor CPA compliance with CMA, implement National Marine Preserve the public right of unimpeded safe navigation; contribute to a secure marine environment. Boat safety awareness, Loss of Life Prevention, partner with policing authorities to enforce Small Vessels Regulations, training and testing for Operator Competency; respond to recreational vessel
Environmental Response The responsibility for planning and policy setting for ER transferred to TC in 2003, but no reporting on the mandate by TC was available at the time of this
90

Federal Department Progr~nBranches Responsibilities Transportation Safety Board Investigates marine, The mission of the TSB is to conduct of Canada pipeline, railway and independent safety investigations and (Independent Federal aviation transportation communicate risks in the transportation
Agency) occurrences. system. The TSB will investigate ifthere is high probability that an investigation will advance Canadian transportation safety, meaning there is significant potential for reducing future risk to persons, property or the environment. Its sole aim is the advancement of transportation safety. It does not assign fault or determine civil or criminal liability.
Canadian Coast Guard Search and Rescue Inshore Rescue Boat program (Port McNeil (Special Operating Agency and Cortes Island), 16 CCG-Auxiliary units status and a sector of in region (non-profit SAR societies manned Fisheries and Oceans by volunteers), and ensure that SAR units Canada). are capable of responding to SAR
emergencies. A national institution, Marine Communications Radio Aids to Marine Navigation and providing services in: and Traffic Services Notices to Shipping. maritime safety, protection Navigation Systems Aids to Navigation (provide, manage and of the marine environment, Branch maintain lighthouses, beacons, buoys, facilitating maritime DGPS, Loran-C); Notice to Mariners. commerce and sustainable Environmental Response Work with Regional Advisory Committee development, support of guidance to improve effectiveness of oil marine scientific excellence; spill response capabilities; work with and support of Canada's Regional Support team to develop and maritime priorities. implement Marine Spill Contingency Plans;
respond to incidents in order of priorities l)Safety ofLife, 2)1ncident Stabilization and 3) Environmental Protection.
CCG Auxiliary Units with varying response capacities and coverage in: Masset, Queen Charlotte, Sandspit, Stewart, Port Simpson, Prince Rupert, Kitimat, Kitkatla, Bella Coola, Klemtu, Ocean Falls, Bella Bella, Port Hardy, Port McNeil, Alter Bay, and Cam~bell River.
Department ofNational Army Assist provincial and territorial authorities Defence/Canadian Forces with natural disasters, including
Earthquakes, floods, storms and forest fires. To protect Canada, Air Force Available for SAR deployment out of Canadian interests and JRCC. values, while contributing to Navy Available for SAR deployment out of international peace and JRCC. security. Joint Rescue Coordination Coordinate SAR to aeronautical and
Centre (Victoria) maritime incidents within Canada and adjacent waters. Practice and work with RCCs in Alaska and Washington. Includes: Air Force, Navy and Coast Guard.
91

Federal Department Programs/Branches Responsibilities Royal Canadian Mounted North Coast Satellite Patrol Vessel Inkster (72 foot, eight man Police Marine Detachment crew) to patrol and respond to enforcement
needs along the Alaskan border and the West Coast Marine Services many coastal islands and inlets; Coastal
Watch community policing; Customs Enforcement; Forest Crimes Section; Immigration Act Enforcement as well as Criminal Code Enforcement in isolated communities.
Public Safety and Canadian Border Service Provides integrated border services that Emergency Preparedness Agency support national security priorities and Canada facilitate the flow of persons and goods
meeting requirements under law. Created in 2003 to ensure Emergency Management Ensure capacity of first responders and coordination across all and National Security emergency personnel; provide fmancial federal departments and assistance when costs exceed regional agencies responsible for resources; training at Canadian Emergency national security and the Preparedness College in Ottawa. safety of Canadians. Policing, Enforcement Enforcement of Canada-US border security,
and Interoperability organized crime, illicit drugs, child exploitation; also operate programs to improve information sharing between enforcement and security agencies.
Community Safety and Implementation of First Nations Policing Partnerships Policy; implementation of the National
Crime Prevention Strategy; delivery of funding programs associated with both policies.
Canadian Security CSIS programs designed to investigate and Intelligence Service report on threats to Canadian security; to
mitigate against terrorism, weapons of mass destruction, espionage, and information security threats.
*Recent transfer of responsibility and reporting.
DEFENCE, SECURITY AND PUBLIC SAFETY RESOURCES
Public Safety and Emergency Preparedness Canada
Canada's Public Safety and Emergency Preparedness Agency, with a mandate that includes policing, border security and natural disaster emergency preparedness was formed in 2003. This agency integrates already existing forces, departments and agencies into a centralized organization to provide a coordinated response in emergency situations.
Canadian Coast Guard
The Search and Rescue (SAR) Program's mission is to "save and protect lives in the maritime environment". Within PNCIMA, this mission is co-delivered by the Canadian Coast Guard Auxiliary (CCGA), in coordination with volunteers and ships of opportunity. The CCGA responds to approximately 25 percent of SAR incidents.
The response portion of the Environmental Response mandate remains with the CCG. The mission of Environmental Response is to "protect the marine environment and
92

related interests through preparedness, prevention, monitoring and responding to marine pollution incidents".
The Marine Traffic and Communications Service (MCTS) "provide communications and traffic services for the marine community and for the benefit of the public at large". This mission is accomplished by providing distress-safety communications and coordination, regulating vessel traffic movements, and screening vessels for Canadian Standards Association (CSA) compliance (Figure 47). Within the PNCIMA, three MCTS centres share responsibility: Prince Rupert traffic, Comox traffic and Tofino traffic. The CSA, the International Marine Organization's (IMO) Convention on the Safety of Life at Sea (SOLAS) and the Radio Communications Act provide the regulatory framework for MCTS.
Mandated to DFO through the Canada Shipping Act, the Aids to Navigation Program "facilitate safe and expeditious movement of maritime traffic". The Waterways Development Program ensures "that commercial shipping channels are designed and maintained by their custodians and operators in the interests of safe navigation; that mariners are provided the necessary information to use the channels in a safe manner; and that the channels are environmentally sustainable". The program is also responsible for bottom monitoring and depth forecasting, in partnership with the Canadian Hydrographic Service (CHS).
MCTS
Vancouver I Prince Rupert
USCG RCC jSafety of life at sea I jBoundary Waters I Southern waters
Victoria I
VTS Seattle Dixon Entrance I Beaufort
I Alleged Pollution J Ops. Centre Juneau
I I All pollUtiOn I
offences or
Environment incidents Casualty
I Marine Safety
I Canada
Duty Officer Area Office
I Marine Pollution I Incidents !Shipping Casualty I Transportation
I SRO or L Safety Board ER Duty Officer
-Prince Rupert I
PEP I -Victoria
Duty Officer
-Vancouver
~ Port Authorities
Vancouver Fraser Port Prince Rupert Nanaimo
p
North Fraser Port Alberni
I J
Superintendent 1 I Some Director of ' Environmental+-~-- Level 4 Incidents -Marine Programs;
Response I and all : '------------' Level 5 Incidents CG Regional i
L-------~1 MCTS lr-----~ l I
Director
Public Affairs
Other Appropriate Authorities
Figure 47: Marine Traffic and Communications Service Contingency Framework
93

Department of National Defence/Canadian Forces
During peacetime, the Canadian Forces are called upon during states of emergency threatening the safety and security of Canadians and Canadian values. As well, the Canadian Navy and Air Force are involved in Search and Rescue efforts, and respond to marine SAR incidents where appropriate.
Maritime Forces Pacific (MARP AC) is responsible for maintaining multi-purpose, combat-capable maritime forces to conduct operations in Canadian waters in support of national objectives primarily in the Pacific Rim Region, but also anywhere in the world. Located in Esquimalt, Vancouver Island, MARPAC is the head-quarters of Canada's Pacific naval fleet (Table 13). MARP AC is responsible for an area of the northeast Pacific Ocean that is larger in size than the provinces of BC and Alberta combined. Since 2005, the Canadian Navy has been regularly patrolling the waters ofPNCIMA.
The domestic area of responsibility covers 1. 7 million km2 of ocean in the north-eastern Pacific. When combined maritime operations are conducted in Canadian waters as part of the defence of North America, the Commander MARP AC exercises control over Canadian and American maritime forces under a Canada/US agreement. At the direction of Canada Command, MARPAC is the Commander of Joint Task Force (Pacific) with operation control over forces deployed in response to a domestic crisis.
Table 13: Canada's Pacific Fleet Canadian Patrol Frigates HMCS Vancouver HMCS Calgary HMCS Regina HMCS Winnipeg HMCS Ottawa Maritime Coastal Defence Vessels HMCS Nanaimo HMCS Yellowknife HMCS Whitehorse Victoria Class Submarine HMCS Victoria
Command and Control Destroyers HMCSHuron HMCS Algonquin 1 Supply Ship HMCS Protecteur
HMCS Saskatoon HMCS Edmonton HMCS Brandon Sail Training Yacht HMCS Oriole
Canada's Pacific Coast Air Force base is situated in Vancouver Island's Comox Valley. The 19 Wing has a rich history, which began with the construction of the air base in 1942 to protect the strategic Pacific coastline from a possible Japanese invasion. Following its postwar closure in 1946, the base was reactivated in 1952 when 407 Squadron arrived. Throughout the 1960s and 1970s, Canadian Forces Base Comox served as the primary air defence base in western Canada and as part of the North American Aerospace Defence Command (NORAD) continental defence structure.
Today, three squadrons operate from this base. Its two operational squadrons fly the Aurora Maritime Patrol Aircraft, cc115 Buffalo SAR Aircraft, and the CH-149 Cormorant Helicopters, while its third squadron provides maintenance and support.
Using five CP-140 Aurora airplanes, the pilots and crews of 407 Maritime Patrol Squadron spend long hours on surveillance missions over the ocean looking for illegal
94
fishing, migration, drug smuggling and pollution in addition to foreign submarines. They can also perform SAR missions using air-droppable survival pods. With six CC 115 Buffalo Aircraft and five CH-149 Cormorant Helicopters, 442 Transport and Rescue Squadron carries out SAR operations in the busiest region in Canada, stretching from the BC/W ashington border to the Arctic, and from the Rocky Mountains to 1 ,200 km out into the Pacific.
In addition to its operational squadrons, the Wing is home to 19 Air Maintenance Squadron and a national training school, the Canadian Forces School of Search and Rescue (CFSSAR). 19 Wing also supports cadet training at the Regional Cadet Gliding School (Pacific) and HMCS Quadra sea cadet camp.
Joint Rescue Coordination Centre
The Joint Rescue Coordination Centre (JRCC) in Victoria is one of three Canadian JRCCs operating 24 hours a day, seven days a week to coordinate the SAR response to aeronautical and maritime incidents within Canada and adjacent waters. The Victoria SAR region is made up of BC, Yukon and the north-east Pacific Ocean. The JRCC is staffed jointly by the Department ofNational Defence and the CCG. Two Marine Rescue Coordinators and two Air Rescue Coordinators, respond to tens of thousands of radio and telephone calls which, in 2002, produced over 2, 700 SAR cases. JRCC Victoria is operationally responsible to the Commander, Maritime Forces Pacific.
West Coast Marine Detachment, Royal Canadian Mounted Police
The Members of the West Coast Marine Detachment (including the North Coast Satellite Marine Detachment), offer a full scale police service and, when able, take full conduct of their investigations in a "Detachment Style" platform. If required, the crew can conduct an investigation in a village, on the water, or can be re-deployed to an emergent situation elsewhere in the Province. RCMP Specialized Sections require continual training to keep the Marine Members current in the various enforcement duties.
Enforcement of the Immigration Act as well as criminal enforcement is commonplace for the Marine Members, particularly in areas North of Vancouver Island. Foreign vessels not reporting into Customs and stopping in the remote areas is a common infraction.
In 1993, a new autonomous RCMP Marine Unit was re-established to cover an area from the top end ofVancouver Island to the Alaska Border. The Higgitt, a 63 foot High Speed Patrol Catamaran, was constructed and posted to Prince Rupert with Four Regular Members. After reviewing the services of the Prince Rupert Marine Unit in 1995, it became evident that it was inadequate for the North Coast and that it was necessary to make changes in the service. In 1996, the newest RCMP Patrol Vessel Inkster (72 feet long) was constructed and moved into Prince Rupert with an additional four Regular Members, for a total of eight. The PV Higgitt was re-deployed to Vancouver Island. With the an addition of a 24 foot Ridged Hulled Inflatable, this eight man unit is better equipped to handle a seven day per week and better serve its client base.
The North Coast Satellite Marine Detachment is also active in other such programs such as Boating Safety and the Coastal Watch Program. Clients in the outlaying areas are
95
encouraged to contact the unit directly if it should have any questions or requests for service.
Transportation Safety Board of Canada
The Transportation Safety Board of Canada (TSB) is an independent agency created by an Act of Parliament (the Canadian Transportation Accident Investigation and Safety Board Act) that came into force on March 29, 1990. The TSB consists of up to five board members, including a chairperson, and has approximately 220 employees. The Head Office is located in Gatineau, Quebec; however, most investigation staff are located in various regional and field offices across Canada where they are better able to respond quickly to transportation occurrences anywhere in the country.
The Canadian Transportation Investigation and Safety Board Act provides the legal framework governing TSB activities. Its mandate is to advance transportation safety in the marine, pipeline, rail and air by:
• Conducting independent investigations, including public inquiries when necessary, into selected transportation occurrences in order to make findings as to their causes and contributing factors.
• Identifying safety deficiencies, as evidenced by transportation occurrences. • Making recommendations designed to eliminate or reduce any such safety
deficiencies. • Reporting publicly on board investigations and on the findings in relation thereto.
As part of its ongoing investigations, the TSB also reviews developments in transportation safety and identifies safety risks that it believes government and the transportation industry should address to reduce injury and loss.
Port Authorities
The Port of Prince Rupert is the only incorporated port in the PNCIMA. Under section 1 08 of the Canada Marine Act, the head of Port Security may board vessels in order to inspect logbooks. Section 109 authorizes the head to board and inspect vessels, vehicles or aircraft (other than living quarters); inspect official documents and logbooks, and have copies made. Often, inspections or enforcement procedures are coordinated with other enforcement agencies, such as DFO Conservation and Protection officers, RCMP and Customs officers, allowing for a broader scope of safety and security issues to be addressed simultaneously.
In the Port of Prince Rupert's jurisdiction, the main safety issue requiring enforcement is the speeding of vessels. This is an onerous regulation to enforce, as each incident must be prosecuted through the court system. This is, in part, the reason for coordinated enforcement efforts such that if a vessel is consistently speeding, boarding by enforcement officers from multiple agencies can cover a wider range of legislative authority for prosecution of infractions.
The Port of Prince Rupert's main security risk is from cruise ship traffic making berth at the Atlin or Northland Terminals. The major security measure to guard against this risk involves providing a complete list of passengers and crew to TC, Customs and Immigration and the Port of Prince Rupert. Additionally, the Port of Prince Rupert has an
96
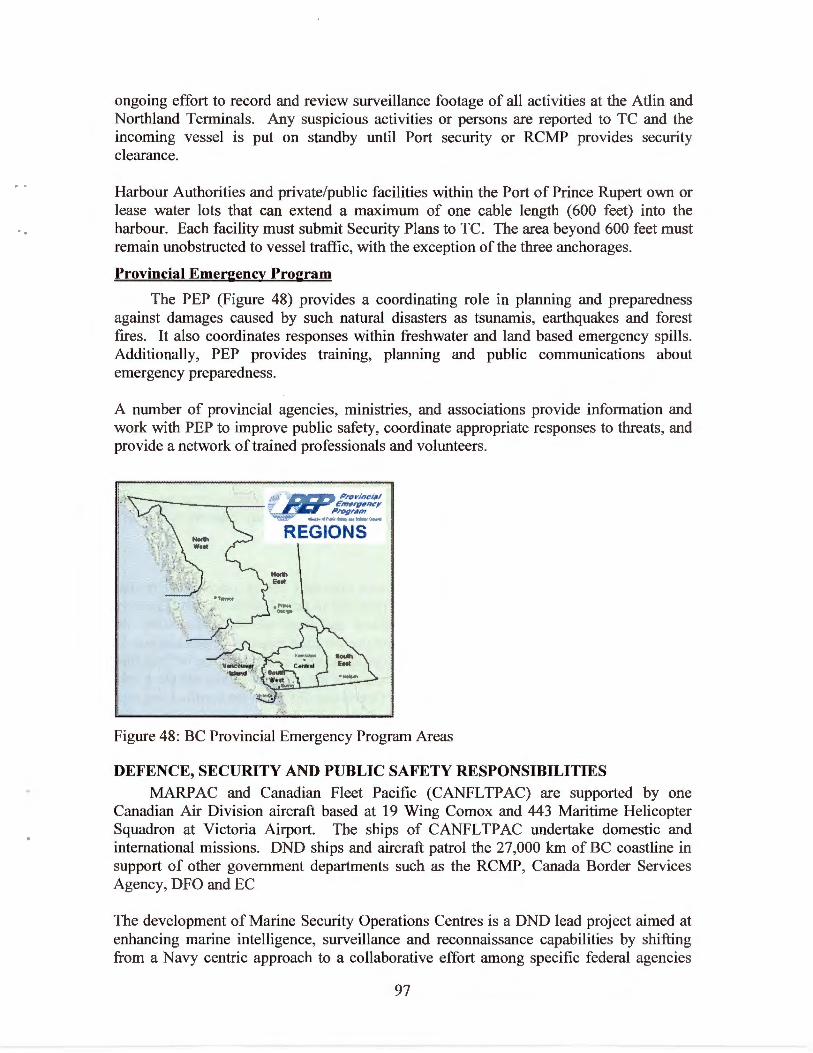
ongoing effort to record and review surveillance footage of all activities at the Atlin and Northland Terminals. Any suspicious activities or persons are reported to TC and the incoming vessel is put on standby until Port security or RCMP provides security clearance.
Harbour Authorities and private/public facilities within the Port of Prince Rupert own or lease water lots that can extend a maximum of one cable length (600 feet) into the harbour. Each facility must submit Security Plans to TC. The area beyond 600 feet must remain unobstructed to vessel traffic, with the exception of the three anchorages.
Provincial Emergency Program
The PEP (Figure 48) provides a coordinating role in planning and preparedness against damages caused by such natural disasters as tsunamis, earthquakes and forest fires. It also coordinates responses within freshwater and land based emergency spills. Additionally, PEP provides training, planning and public communications about emergency preparedness.
A number of provincial agencies, ministries, and associations provide information and work with PEP to improve public safety, coordinate appropriate responses to threats, and provide a network oftrained professionals and volunteers.
REGIONS
Figure 48: BC Provincial Emergency Program Areas
DEFENCE, SECURITY AND PUBLIC SAFETY RESPONSIBILITIES MARP AC and Canadian Fleet Pacific (CANFL TP AC) are supported by one
Canadian Air Division aircraft based at 19 Wing Comox and 443 Maritime Helicopter Squadron at Victoria Airport. The ships of CANFL TP AC undertake domestic and international missions. DND ships and aircraft patrol the 27,000 krn of BC coastline in support of other government departments such as the RCMP, Canada Border Services Agency, DFO and EC
The development of Marine Security Operations Centres is a DND lead project aimed at enhancing marine intelligence, surveillance and reconnaissance capabilities by shifting from a Navy centric approach to a collaborative effort among specific federal agencies
97
with vested interest in marine security. As required, the Maritime Operations Centre (MOC) will transform into a National Marine Security Operations Centre jointly staffed by Canadian Forces and Civil Agencies responsible for national law enforcement. The MOC "Athena" keeps track of all shipping headed for the Pacific approaches to Canada.
Border Security and Customs
The RCMP work in a multi-agency and cross-border Integrated Border Enforcement Team (IBET) that includes Canada' s RCMP and Border Services Agency, as well as US Customs and Border Protection, US Immigration and Customs Enforcement and US Coast Guard. Of the 15 geographic regions identified, the Pacific region makes no mention of the Alaskan border.
In addition to the above, DFO implemented a full-time random aerial surveillance program for the Pacific Coast. The program will operate year-round in a designated patrol area from coastal BC, including the headwaters of the major inlets, out to the 200 nautical mile limit of Canada's exclusive economic zone. The primary function of the aircraft will be to conduct DFO fisheries surveillance patrols and to support maritime security.
Emergency Safetv Response
CCG is mandated to respond to issues of public safety, and is therefore the natural lead agency responding to marine distress situations. In any incident of marine distress human safety concerns outweigh all others. At any point the Joint Task Force may assist in rescue efforts and coordination and DND when warranted may take over the SAR aspect of the event.
Emergency Environmental Response
Ensuring that prevention and preparedness measures are in place on Canadian vessels is the responsibility of TC, while any response to actual spills remains the arena of the CCG. The Marine Oil Spill Preparedness and Response Regime outlines the responsibilities of the private sector to fund and use certified response organizations. In BC' s marine waters, an order to respond is issued if the spill is south of the 60th parallel, if the vessel is under the Canada Shipping Act, and if the order is signed off the by the Commissioner of CCG. In BC, Burrard Clean Operations (BCO) is the certified response agency to respond to marine oil spills although, in the PNCIMA area, BCO contracts this role out to local companies.
BCO has developed eight area reference and resource information plans to maximize efficiencies in oil spill response, and to accelerate the response efforts (Figure 49). Three distinct areas in PNCIMA have been identified by these plans. They include: North Vancouver Island, Prince Rupert and the Queen Charlotte Islands.
98
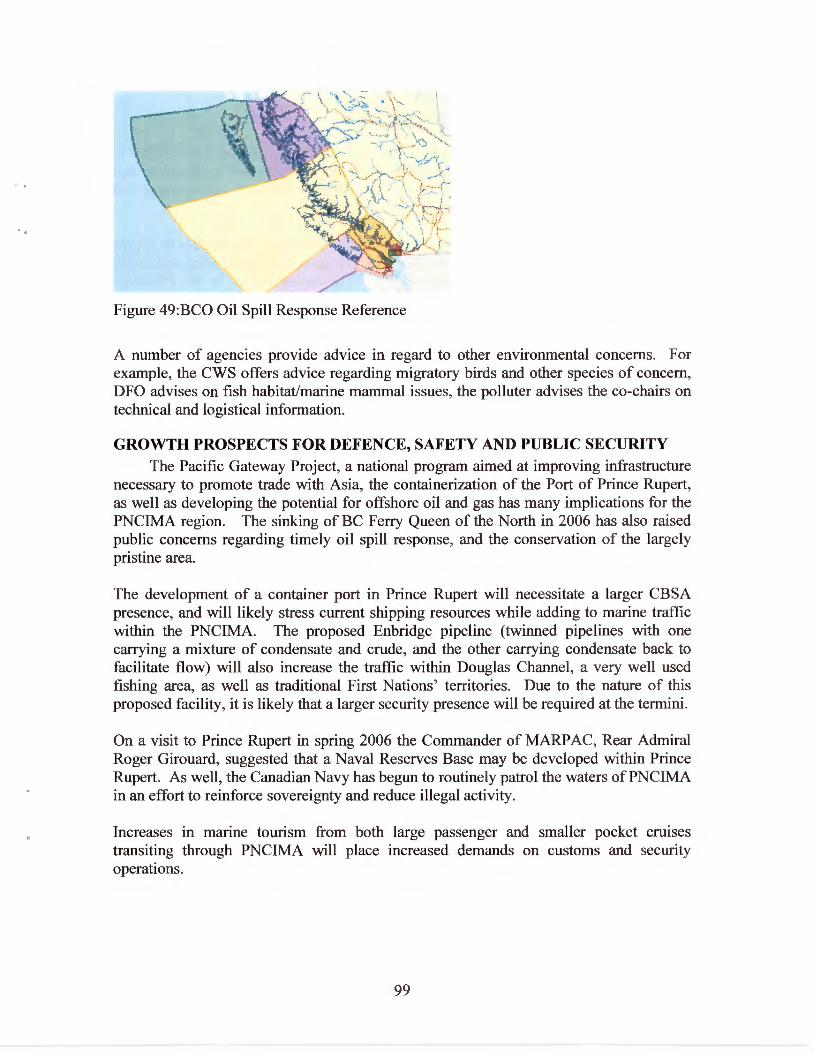
..
Figure 49:BCO Oil Spill Response Reference
A number of agencies provide advice in regard to other environmental concerns. For example, the CWS offers advice regarding migratory birds and other species of concern, DFO advises on fish habitat/marine mammal issues, the polluter advises the co-chairs on technical and logistical information.
GROWTH PROSPECTS FOR DEFENCE, SAFETY AND PUBLIC SECURITY The Pacific Gateway Project, a national program aimed at improving infrastructure
necessary to promote trade with Asia, the containerization of the Port of Prince Rupert, as well as developing the potential for offshore oil and gas has many implications for the PNCIMA region. The sinking of BC Ferry Queen of the North in 2006 has also raised public concerns regarding timely oil spill response, and the conservation of the largely pristine area.
The development of a container port in Prince Rupert will necessitate a larger CBSA presence, and will likely stress current shipping resources while adding to marine traffic within the PNCIMA. The proposed Enbridge pipeline (twinned pipelines with one carrying a mixture of condensate and crude, and the other carrying condensate back to facilitate flow) will also increase the traffic within Douglas Channel, a very well used fishing area, as well as traditional First Nations' territories. Due to the nature of this proposed facility, it is likely that a larger security presence will be required at the termini.
On a visit to Prince Rupert in spring 2006 the Commander of MARP AC, Rear Admiral Roger Girouard, suggested that a Naval Reserves Base may be developed within Prince Rupert. As well, the Canadian Navy has begun to routinely patrol the waters ofPNCIMA in an effort to reinforce sovereignty and reduce illegal activity.
Increases in marine tourism from both large passenger and smaller pocket cruises transiting through PNCIMA will place increased demands on customs and security operations.
99

FORESTRY
BC forests cover 60 million hectares. The forest industry is the lead contributor to BC' s coastal economy and is unique among the world's leading wood producers in that 95 per cent of its land is owned by the Crown. BC's forests are administered and regulated by the provincial government on behalf of BC.
Coastal forests of the PNCIMA are rich in old growth red cedar (Thuja plicata), yellow cedar (Chamaecyparis nootkatensis) and hemlock (Tsuga heterophylla) trees with much of the area untouched due to its inaccessibility. The annual harvest in the PNCIMA 1999/2000 was estimated at 4,000,000 m3
, with an estimated value of approximately $400 million (JM Taylor Ltd, 2002). Within PNCIMA, the forestry industry accounts for about 16 percent oftotal employment (Vance, 2004).
Canada's most biologically diverse forests are found along the BC coast. Less than one third of one percent of the total coast forest is logged annually, and this percentage includes an increasing harvest of second-growth forest, replaced with third-growth forests. The allowable annual cut in the coast region has dropped from 27.8 million cubic metres in 1980, to 20.1 million cubic metres in 2001. It is expected to continue to drop until the middle of this century due to changes in the wood supply, forest practices, and the fact that more land has been set aside to create parks and protect a wide range of forest values (BCON, 2005).
The timber industry has reacted to difficult market conditions by logging the best and most profitable forests first. This "targeted" harvest on high value and accessible cedar may prove costly to future logging operations as companies move into forest stands that are less accessible, with lower timber values, and greater costs of harvest. Since hemlock makes up over 50 percent of the remaining old growth timber on the coast, the implication of this current strategy may be a future forestry industry with a greater focus on hemlock, despite the fact it has lost 50 percent of its value in recent years (Pacific Analytics Inc and Don Harris, 2004).
On April 4, 2001 , the BC government, First Nations, industry, environmentalists, and communities ratified agreements committing all parties to define ecosystem-based management (EBM) as an alternative to current industrial forestry. As part of this agreement the Coast Information Team (CIT) was established with a purpose to provide independent information to support the exploration of EBM for the central and north coasts of the BC mainland and Queen Charlotte Islands using the best available scientific, technical, traditional and local knowledge. The area of study for the CIT encompassed the same areas as the PNCIMA.
The CIT defines EBM as an adaptive approach to managing human activities that seeks to ensure the co-existence of healthy, full functioning ecosystems and healthy human communities. The intent is to maintain those spatial and temporal characteristics of ecosystems such that the component species and ecological processes can be sustained, and human well being supported and improved (CIT, 2004).
100
..
..
The CIT developed a handbook on EBM and its framework has been adopted in the provincial Central Coast Land and Resource Management Plan. Since forestry can impact the marine environment through most of its practices from road building, to the removal of vegetation, to water-based log handling and storage, the implementation of EBM may have significant benefits to the marine near shore ecosystems.
GOVERNANCE
Forest Act and Forest Practices Code
The current timber tenure system was established as a result of the Forest Act. The Forest Act and its associated regulations provided the structure for the tenure system. The Forest Act set out the forms of agreement under which Crown timber could be sold and factors that were considered by the Ministry. As well, the rights and obligations of each form of tenure and the tenure's administration rules were defined.
In 1995, BC consolidated and strengthened its forest policies, regulations and guidelines when it created the Forest Practices Code (FPC). For example, enforceable rules about how timber harvesting operations on Crown land must be planned and conducted were embodied and strengthened in the FPC. In addition, the code set out a range of penalties for failure to meet these rules
In 2004, the FPC evolved into a new Forest and Range Practices Act via a stepped approach. This new act is intended to shift the focus from paperwork to field results, and has been publicized as a "results based" approach to forestry. It is aimed at conserving and protecting forest resources thereby maintaining a high level of environmental protection in a more efficient and effective manner than the previous act (BCON, 2004).
Since the end of2005, BC's Forest and Range Practices Act has been fully implemented. Under this act, forest companies must develop comprehensive forest stewardship plans that outline how they can best achieve objectives set by government for soils, timber, wildlife, water, fish, biodiversity and cultural heritage resources, and are held accountable for their on-the-ground activities. Also, under this new act, the government may require results or strategies for special management of areas of local concern, such as recreation trails, wildlife habitat areas, winter range for animals such as deer and mountain goats, lakeshore management zones, community watersheds, fisheries-sensitive watersheds and scenic vistas.
All activities must be consistent with ex1stmg land use plans. The new regulatory framework for this act specifies requirements to conserve soil, provide sustainable reforestation, protect riparian areas, fish and fish habitat, watersheds, biodiversity and wildlife. It also specifies requirements for the construction, maintenance and deactivation of forest roads (BCON, 2004).
The Ministry of Forests (Figure 50) is developing a policy framework to establish the obligations and opportunities for collaborative forest management within the province's 37 timber supply areas (TSA). Under the Defined Forest Area Management (DFAM), specified licensees and BC Timber Sales (BCTS) will assume a collective responsibility for timber supply analysis and specified forest health activities within each timber supply
101
area. Government will continue to set and enforce the standards. DF AM is also intended to provide a foundation for more advanced stewardship activities such as strategic and tactical level planning, enhanced forest management and certification. Government will still determine the annual allowable cut for each TSA (BCMOF, 2004).
Regulations
The regulations involved with large scale conventional cable logging require a Forest Licence or a Tree Farm Licence (TFL) (Figure 51), which is issued by the Ministry of Forests. The tenure holders submit Forest Development Plans (FDP) to the Ministry of Sustainable Resource Management. These plans deal with all major considerations such as visual quality objectives, terrain stability, water resources, fisheries, wildlife habitat areas and archaeological issues. It is during the FDP process that the proponent provides opportunities for input from government agencies and all public groups, including First Nations. In addition to the FDP, there is also the need for Silvicultural prescriptions, road permits, road use permits, cutting permits and special use permits as required under the Forest Act. Also, road permits involving river crossings require approval from the Ministry of Environment under the Environmental and Land Act as well as from DFO under the Fisheries Act (JM Taylor Ltd, 2002).
In areas where water log handling sites are to be used, each site requires approvals from the ILMB for a Crown Foreshore lease. Before approval, ILMB must initiate an extensive referral process that includes the following agencies and organizations: DFO, Ministry of Environment, Ministry of Forests, TC (Navigable Waters Protection Act), CWS, First Nations, Ministry of Small Business and Economic Development, local municipalities and regional districts. These organizations may provide input, make recommendations, stipulate specific operational conditions or reject the application as proposed.
If a federal agency has a law list trigger, a Canadian Environmental Assessment Act (CEAA) review will be requested. Ministry of Environment may reject or approve applications based on input received through this referral process. Applications for the reactivation of established log handling sites may be submitted directly to DFO. Upon receipt of such an application, DFO initiates a referral process including government agencies and potentially impacted First Nations (Triton Environmental Consultants Ltd, 2001).
ECONOMIC ACTIVITY After the Second World War, BC's commercial forest industry prospered with the
industrial boom and, by the 1980s, resource professionals found it was becoming a challenge to maintain stable harvest levels across the province. On the coast, this was primarily due to the changing wood supply area. Companies had to harvest trees in different areas, often farther from the mills, increasing harvest costs. As well, forest practices and public perceptions changed, leading to more land being set aside to create parks and protect the wide range of forest values (BCON, 2003).
Throughout the 1980s and early 1990s, the overall annual cut began to decline. On the coast, it had reached a peak of 27.8 million cubic metres in 1980 and, by 2001 it had dropped to 20.1 million cubic metres (Figure 52). Based on comprehensive reviews of
102

timber supply, the Ministry of Forests expects that this general trend will likely continue for the next 50 years, at which point the coast allowable annual cut should stabilize at about 17 million cubic metres. This projection is based on the current land allocation and management regimes in place today. If any of these assumptions change in the future, which is reasonable to expect, the projections will change as well (BCON, 2003).
~ --· ~ .... ---,~-......:~ -~~-PNCIMA -- Ministry ofForesf"'!ReQions..____ -- 2004
Pacific Ocean
overv- Map + ~'""" ~Colom b!•
130"0'0''\flo'
l egend ... =---
0
• Co mmunities
·:::: I>Ja ska
D PN CIMABoundary
C MOf_region s
50 100 I
20 0 Ki lometers I
Figure 50: Ministry of Forests Regions
103
Mackenzie
Notes: SOtXC• hform•ion: BC 8uf!map and W:ltf!rsMds ao..-:l ary prow;ed by 9 C t\Mniny of Su:r:taiMb I• RtSOISOI ~~g emwd: , P:aoitc tbff\ Coast lnllegraed Mlnagement .ke• Bouncbryprovided by OFO . M>F Aog;ons pro-.t by Mn istryof For.Jts
Pro;tction: BC .Aib• rs, HAD 83 Production Dlte: Mln::h 28, 200G Produced By: OHEB NanairT'O , DFO
Fort

PNCIMA -·-- ·--- ···~------. --.. .. 2004
Pacif i c Ocean
OVoview Map t
Brltl!l co h m D1a ..._ ..........
j•)(I '\J(l'\Jti
legend
0 PNCI MA Ba<.ndery - Log hancling Tenures
0 Watersheds Boundary D TSA
• Communities - TFL
-~) .AJaska
B r 1 t 1 s h Columbia
~nformation: BC Basemap and Water!heds Ba<.nd!WY rro"'ded by BC Ministry of SustaiM>Ie Resotrce Management . Forestry lnlom\llllon from Ministry of Forests Paciic North Coast lnlegaled Menagemenl Area Boundary provided I:¥Df0 .
0 45 90 180 Kl lometers Projection: BC !ljbers, NIID 83 1 Production Dale: h4erch 31, 2006 '-----------....1 l _ _::::::::::::::::::::::::::::::::::_ _____ _j Produced . OHEB Nsnaimo DFO
Figure 51: Tree Farm Licences and Timber Supply Areas in the PNCIMA
104

..
British Columb ia's allowable annual cut in the coast reg ion has dropped from 27.8 million cubi c metres in 1980 to 20.1 mil lion cubic metr·es .in 2001, and is expected to conti nue to drop until the middle of t his century.
Figure 52: Projected Allowable Annual Cut Source: BC Outreach Network BC Coast Report 2003
The forest sector is the single most important contributor to the BC economy. With 600 mills across the province, BC' s forest industry supports 260,000 direct and indirect jobs in more than 150 communities. It generates one quarter of BC' s provincial economic activity and more than a billion dollars in government revenue to support public services.
The 1990s were devastating to the forest sector as global competition grew and BC' s industry lost its competitive edge. Since 1997, 26 mills have closed, 13,000 forest jobs have disappeared and annual government revenues from forestry have declined by more than $600 million. Total employment in forestry and related wood processing and manufacturing declined from just over 8000 jobs in 1996 to just under 7000 jobs in 2001. However, it still accounts for about 16 percent of total employment in the PNCIMA.
The forest industry has been plagued by high operating costs, changing demands for BC products from traditional export markets, the exhaustion of easily accessible old growth timber and deteriorating capital stock in coastal mills. The long-term future of several larger mills in the PNCIMA, including the pulp mill in Port Alice, the Eurocan sawmill in Kitimat, and Skeena Cellulose in Prince Rupert is in doubt (Figure 53).
During 2001 to 2002, the forestry companies working within the PNCIMA included: • BC Ministry of Forests Small Business Enterprise Program administers the Small
Business Forest Enterprise Program (SBFEP). The SBFEP accounts for 13 percent of BC's annual allowable cut, a volume larger than that of any single company. This government program awards public land to individual contractors in a competitive bid process.
105
• Husby Forest Products is based on Haida Gwaii (Queen Charlotte Islands) and is the largest independent market logging company on the coast.
• International Forest Products (INTERFOR) is a publicly held company and one of the largest in Canada. INTERFOR has 59 logging operations and six sawmills in the coastal region of BC.
• JS Jones Timber Ltd. is a family-owned business based in Boston Bar, BC, and wholly owns Teal Cedar Products and Stag Timber. They have three logging operations in BC.
• Mill and Timber Products Ltd. is based in Surrey, BC. • TimberWest is the largest owner of private forest lands in western Canada.
TimberWest holds two renewable public tree farm licences and operates a sawmill near Campbell River, BC.
• Triumph Timber is based in Terrace, BC. • Western Forest Products (Doman Industries Ltd.) is based in Duncan, BC and is
the second-largest coastal woodland operator in BC. Doman Industries Ltd. operates as Western Forest Products, Western Pulp and Doman Forest Products.
• West Fraser Timber operates eight plants throughout BC's interior and coast. The company also has two US operations in Arkansas and Louisiana.
• Weyerhaeuser is a US owned company and the world' s largest producer of softwood and hardwood lumber. Its operations in BC are one of the province's largest.
HUMAN USE ISSUES The most commonly chosen harvest method is clear cutting because it is cost
effective and suited to the ecology of forest sites with species that thrive in full sunlight such as lodgepole pine (Pinus contorta var. latfolia), which grows mostly in the interior, and coastal Douglas fir (Pseudotsuga menziesii). When used appropriately, clear cutting may be less disruptive because once the site has been re-planted, it is left to grow freely until the new crop is ready to harvest again in 60 to 80 years. Debris such as stumps, branches and fallen trees are left on the forest floor after harvesting to promote biodiversity by providing habitat for plants, animals and insects and by releasing nutrients for soil development. Clear cutting is safer for forest workers and can be the best way to deal with pests or disease (BCON, 2004).
The following are some harvesting methods used within the PNCIMA: • Clear-cut system removes most of the trees from an area, leaving patches of trees
and buffers to protect other forest values. • Patch cut system uses small cuts of less than one hectare. • Shelterwood system harvests trees in stages over a short period of time so the new
forest grows under the shelter of the existing trees. • Retention system leaves up to 80 percent of the trees, individually or in groups.
Once the area that was harvested has been replanted and the trees are large enough to harvest, the trees that were originally left behind can be cut.
• Selection cutting system removes timber as single trees or in small groups at relatively short intervals, repeated indefinitely. This must be done carefully to protect the quality and value of the forest area.
106
. .

Log Handling and Transportation
Water-based log handling is a crucial component of coastal BC logging operations. The remote location of the timber and the mountainous terrain characteristic of the coast region prohibit using more cost effective land-based transportation of logs from harvest sites to sorting and processing centres. There are four different methods used for log dumping: vertical hoist (including cranes), direct to barge, helicopter dumping and skidways (slides). The vertical hoists and direct to barge methods are not commonly used in the north coast, but the helicopter dumping and the skidways are commonly used. Helicopter logging comprises an estimated 20 percent of the logging in the north coast region. The most cost effective and commonly used log dumping method is the skidway. Skidways are typically constructed of metal rails, with slopes ranging from 30 to 75 percent. A small number of skidways in the north coast are comprised of steel runners situated on top of parallel logs positioned on the slope. Logs are typically trucked to the skidway site as bundles, placed on skids, released down the skidway into the ocean and usually stored in booms.
After sufficient numbers of bundled and boomed logs are present, tugboats transport them to the nearest sorting and processing centre; however, over long distances, logs are generally barged instead of being pulled by tugs. Logs are stored on the water at dumping sites, sorting and processing centres. On the north coast storage sites are designed to occur at sufficient depths to prevent grounding of logs at low tide. Most log sorting in the north coast occurs on dry land sorts. Centralized dry land sorts are found in Prince Rupert, Port Edward and Ridley Island. At these the facilities bundles are broken apart, logs are dewatered and then sorted on land. Once sorted, logs can then be transported to mills for processing and export (Triton Environmental Consultants Ltd, 2001). In some cases this means re-bundling logs for further ocean transport.
Forestry activities can effect the aquatic (marine and freshwater) environment in number of ways. These include (Hanson et al., 2003):
• Construction of logging roads can destabilize slopes and increase erosion and sedimentation.
• Creation of barriers, such as stream crossings (bridges and culverts), on forest roads are often inadequately designed, installed and maintained, and can often result in full or partial barriers to both the upstream and downstream migration of anadromous fish.
• Removal of streamside vegetation increases the amount of solar radiation reaching the stream and can result in warmer water temperatures, especially in shallow streams of low velocity. Also, in winter months, the removal of riparian vegetation can result in lower water temperatures, increasing the formation of ice, damaging and delaying the development of incubating eggs.
• Timber harvesting reduces transpiration losses from the landscape and decreases the absorptive capability of the groundcover. This change results in increased surface runoff during high periods of precipitation and decreased base flows during dry periods. Reduced soil strength results in destabilizations of slopes and increased sediment and debris input into streams.
• Water-based log handling and storage has a major environmental concern due to debris fields associated with traditional log dumping and storage. It is expected
107

that pre-existing log dumps will be reactivated in the future but new log dumps would be brought into use at a rate of one per year. Historic practices often resulted in persistent fish and wildlife habitat damage related to site selection and the operational phases of marine based log handling. Current site selection and operational procedures are heavily regulated and seek to minimize environmental impacts in and around the operating areas (Triton Environmental Consultants Ltd, 2001). Additionally, concerns regarding impacts to marine mammal disturbance are emerging on the north coast, as well as concerns regarding anchoring systems and marine mammal entanglement.
Chemicals Associated with Forestry
These include by-products of the pulp and paper industry, pesticides, fire control chemicals, wood preservatives and toxic leachates associated with log booming and storages. All of these chemicals present a risk to aquatic ecosystems in freshwater, brackish and marine areas (Haggarty, 2003). There are three pulp mills within the PNCIMA: Western Pulp Limited Partnership located in Port Alice, Norske Skog Canada at Elk Falls near Campbell River, Eurocan Pulp and Paper Co. in Kitimat.
MARINE USE ISSUES
Marine use activities and issues include: • Conflict of water based log handling site selection with MP A. • Vessel safety issues from log boom, and/or log barge transport through major
shipping channels, and boom breakage and escapement of logs during transport (navigational issues).
• Commercial fishery areas may be active at sites chosen for log handling. • Sunken logs and wood debris cause commercial nets to tear. • Recreational fishery areas may be active at sites chosen for log handling. • First Nations food harvesting (shellfish or seaweed) may be active in areas
ideal for log handling. • Marine tourism operators are impacted by poor aesthetics associated with cut
blocks that are visible from the water and by log handling areas that impact wildlife viewing.
• Marine tour operators may have foreshore licenses in areas where traditional log boom storage occurred.
• Marine mammals may be active in areas chosen for log handling. • Boom storage may be denied in areas due to vegetation shading concerns or
new park status.
108
..

Legend
• Kraft rotms
e Other Mills
e Recently Closed
e l.erco (Tavlo')
.e-c~twynd Pulp
Pop.e & albot (Mackenzie)
Ske~u(Prince Rupert .Abitibi ' (Mackenzie} ... - -· . . . ..•. .. Canf (PG&IC)
" Euroc•m (Kitlmat) ca ... to (No.tthwood)
100 0 ·too Kilometers
Pulp Mills Of BC II( )&hil-tu~ t•f \\;alfr,l....-~ ..-n•J .\b l"tYt«li;..,
source: http:/IWiapwww.gov.bc.ca/epd/epdpalindustrial_waste/forestrylmap_pmills.html (2001 data)
Figure 53: Pulp Mills ofBC 2004
109

MINING
Mining (mineral exploration and mine development) is the process of extracting metallic and non-metallic mineral deposits from the earth. Mining involves pointfocussed, time-limited industrial operations that function as long as the commodity can be extracted at a profit. It involves temporary use of the land until all profitable minerals have been extracted, after which time the site is reclaimed. Smaller shafts and adits (a type of horizontal or nearly horizontal entrance to an underground mining operation), are mined for extraction of high-grade material such as gold or other metals, whereas larger open-pit developments are mined for millions of tonnes of low-grade ore. Ore is a mixture of gangue (waste) from which metals can be extracted for profits (Pinset and Pardoe, 2003).
A mineral deposit goes through six stages prior to becoming a mine: • Initial discovery. • Identification of economically mine-able mineralization. • Engineering to establish technical and economic feasibility. • Environmental assessment and mine certification. • Mine financing. • Mine construction.
Few mineral explorations result in successful mine construction, however the process itself, can make a significant contribution to an area's economy.
Table 14: Characteristics of Active Mines (BCMEM, 2004) Mine Owner Division Type Commodity Myra Falls Boliden Albemi Metal Mine Base Metals:
Anyox Slag Heap Benson Lake
Ts itika Stone
Quinsam Coal
Westrnin Copper (Cu), Zinc (Canada) (Zn), Lead (Pb ),
Cadmium (Cd) Precious Metals:
Tru-Grit Skeena Abrasives Inn. International Nanaimo Marble and Stone Company Ltd. Tsitika Stone Nanaimo Industries
Hillsborough Nanaimo Resources Ltd.
Industrial Mineral Industrial Mineral
Industrial Mineral
Coal Mine
Gold (Au), Silver (A g) Slag, Silica (Si)
Limestone (Ls)
Granite (Gr), Dimension Stone (Ds), Building Stone (Bs) Bituminous Coal (Cl), Sedimentary kaolin clay/ Fireclay(Fc)
Deposit Noranda/ Kuroko massive sulphide CuPb-Zn.
Tailings
Ls
Intrusion-related gold-bearing pyrrhotite veins characteristic of BC's historic gold camps are situated in volcanic arc environments in oceanic or continental margin settings. These sites are attractive mineral exploration targets due to their high profit potential
110
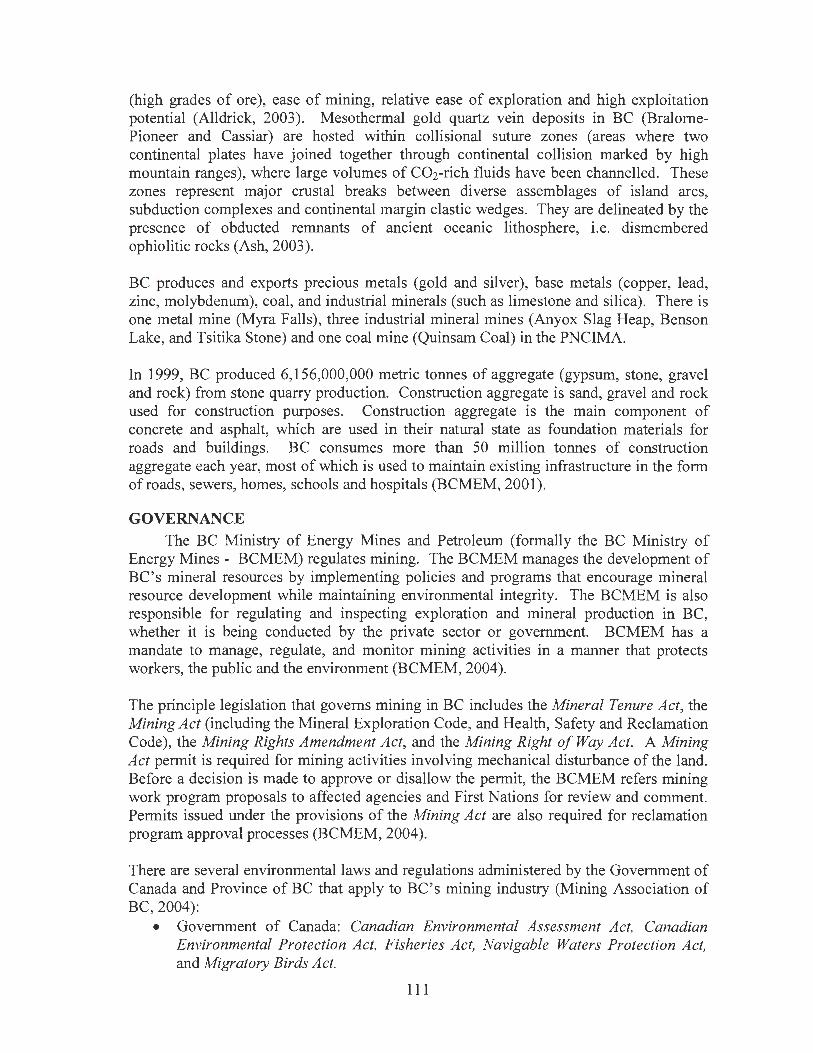
(high grades of ore), ease of mining, relative ease of exploration and high exploitation potential (Alldrick, 2003). Mesothermal gold quartz vein deposits in BC (BralomePioneer and Cassiar) are hosted within collisional suture zones (areas where two continental plates have joined together through continental collision marked by high mountain ranges), where large volumes of C02-rich fluids have been channelled. These zones represent major crustal breaks between diverse assemblages of island arcs, subduction complexes and continental margin clastic wedges. They are delineated by the presence of abducted remnants of ancient oceanic lithosphere, i.e. dismembered ophiolitic rocks (Ash, 2003).
BC produces and exports precious metals (gold and silver), base metals (copper, lead, zinc, molybdenum), coal, and industrial minerals (such as limestone and silica). There is one metal mine (Myra Falls), three industrial mineral mines (Anyox Slag Heap, Benson Lake, and Tsitika Stone) and one coal mine (Quinsam Coal) in the PNCIMA.
In 1999, BC produced 6,156,000,000 metric tonnes of aggregate (gypsum, stone, gravel and rock) from stone quarry production. Construction aggregate is sand, gravel and rock used for construction purposes. Construction aggregate is the main component of concrete and asphalt, which are used in their natural state as foundation materials for roads and buildings. BC consumes more than 50 million tonnes of construction aggregate each year, most of which is used to maintain existing infrastructure in the form of roads, sewers, homes, schools and hospitals (BCMEM, 2001).
GOVERNANCE The BC Ministry of Energy Mines and Petroleum (formally the BC Ministry of
Energy Mines - BCMEM) regulates mining. The BCMEM manages the development of BC's mineral resources by implementing policies and programs that encourage mineral resource development while maintaining environmental integrity. The BCMEM is also responsible for regulating and inspecting exploration and mineral production in BC, whether it is being conducted by the private sector or government. BCMEM has a mandate to manage, regulate, and monitor mining activities in a manner that protects workers, the public and the environment (BCMEM, 2004 ).
The principle legislation that governs mining in BC includes the Mineral Tenure Act, the Mining Act (including the Mineral Exploration Code, and Health, Safety and Reclamation Code), the Mining Rights Amendment Act, and the Mining Right of Way Act. A Mining Act permit is required for mining activities involving mechanical disturbance of the land. Before a decision is made to approve or disallow the permit, the BCMEM refers mining work program proposals to affected agencies and First Nations for review and comment. Permits issued under the provisions of the Mining Act are also required for reclamation program approval processes (BCMEM, 2004).
There are several environmental laws and regulations administered by the Government of Canada and Province of BC that apply to BC's mining industry (Mining Association of BC, 2004):
• Government of Canada: Canadian Environmental Assessment Act, Canadian Environmental Protection Act, Fisheries Act, Navigable Waters Protection Act, and Migratory Birds Act.
111

• Province of BC: Mining Act, Environmental Assessment Act, Environment and Land Use Act, Environment Management Act, Forest Act, Health Act, Waste Management Act, Water Act, Water Protection Act, Wildlife Act, Fisheries Act and The Protection Act
Local governments have the right to decide if and where aggregate extraction and processing may occur. Local governments also manage neighbourhood impacts including safety, noise, dust, traffic and visual aesthetics. This also includes recovery of costs of mitigating negative impacts of extraction and processing on the community, and access to aggregate for community purposes.
ECONOMIC ACTIVITY
In 2002, BC' s coal, mineral and metal mining industry contributed $2.8 billion to the Canadian economy. Mineral exploration and deposit appraisal expenditures in BC have increased over the past four years. Provincial spending increased from $29.1 million in 2001 to $107.3 million in 2004, which was an increase from 5. 7 to 11 percent of all Canadian provinces ' expenditures on mineral exploration and deposit appraisals (Natural Resources Canada, 2004).
The number of mines operating in BC has dropped by more than 50 percent from 30 in 1990, to 12 at the end of 2002 (Figure 55). Over 2000 people were employed in the mining and mineral exploration labour force within PNCIMA in 2001 , down 19 percent from the 1996 census. This trend is reflected in PNCIMA where the closing of Island Copper Mine at Port Hardy left just one metal mine, Myra Falls, operating in the area (Figure 54).
Metal Mines and Reserves
Located at the southernmost tip of the PNCIMA, the Myra Falls Mine produces copper, zinc, lead, gold, silver and cadmium and, as of 1996, has an assessed metal value falling within the $100 million to $1 billion dollar range (BCMEM, 2004).
There are no metal mines operating within the central or northern the PNCIMA. Endako and Huckleberry metal mines in the central coast area, and Eskay Creek, Shast, and Kemess mines in the north coast are, however, within close proximity (25 to 50 km) to the PNCIMA boundary. Economic revenues generated from mining in these neighbouring regions may be contributing to the local economies of nearby communities within PNCIMA.
Ore reserves located near mining camps in the north coast are highest in the Kitsault and Anyox camp areas. Reserves for silver and gold are quite high relative to other mineral deposits assessed in the region and may provide north coast communities with economic prospects from mining activity in the future. A large area of the northeast region within PNCIMA has been assessed at high metal values mostly in the $10 million to $100 million, and $100 million to $1 billion dollar ranges.
11 2

Industrial Mines and Minerals
Industrial mineral values within PNCIMA are highest in the southern PNCIMA, at the north end of Vancouver Island. This is where both the Benson Lake and Tsitika Stone industrial mines are currently active, representing assessments in the $100 million to $1 billion (1996) dollar range occurs (Figure 56).
There is much potential for mining within the PNCIMA. Although the Skeena Mining Region in central PNCIMA near Prince Rupert and Terrace has no active mines, industrial mineral values are assessed in both the $10 million to $100 million and $100 million to $1 billion dollar ranges. Though not currently mined, the Queen Charlotte Islands have several high value industrial mineral value assessments located in the south, and one large area assessed at the lower economic range ($1 million to $1 0 million) in the north (Figure 57).
Anyox Slag Heap is an active industrial mine located at Granby Bay, Portland Inlet within the Skeena Mining Region in northern PNCIMA. Weathering of silica rich slag at this site has produced angular glass fragments that are screened and sorted for use as abrasives and for sandblasting. The particles from Anyox slag heap strip old paint and other oxidized surface coatings better than rounded sand grains. The US military was a primary user of the abrasive, using it regularly for stripping and repainting of a special sonar absorbing coating applied to the hulls of nuclear submarine fleet stationed in Puget Sound. Slag from this site has also been used as an abrasive on shingles. Approximately 20 million tonnes of slag was mined between 1990 and 1998. Continued exploration and development for industrial minerals in the north coast is likely, especially at places like Anyox where excellent economic returns were generated in the past (Marlett, 2002).
Coal Mining and Prospecting
Quinsam Coal mine is located 18 km west of Campbell River, employs about 60 people and produces approximately 300,000 tonnes of clean coal valued at approximately $15 to $18 million a year. Quinsam Coal is exploring the feasibility of extracting methane from its coal reserves on a limited basis and hooking into Vancouver Island's natural gas supply system. This pilot project may serve as an indicator of the potential for a growing coal-bed methane production industry on other parts of Vancouver Island.
Quinsam Coal has been expanding its market with some success. Quinsam Coal is working with the NorskeCanada pulp and paper mill in Elk Falls, where coal is being used as an auxiliary fuel source for its boiler operations on a trial basis. Quinsam Coal has also been meeting alternative energy demands of greenhouses on Vancouver Island and the Lower Mainland by selling coal at a more affordable cost than natural gas.
There are preliminary proposals to build one or more coal-fired power plants to secure a reliable power source on Vancouver Island in order to offset reliance on off-island electric and natural gas sources. Coal-fired power sources are not likely to become widely used over the short term, however, as several regulatory and environmental obstacles would have to be overcome (Vance, 2004).
113

PNCIMA _. ~ . ---~~- --:----·· 2004
P ac ifi c Oc ean
OVBVieWMap
m ..... ,. ~CO I I ffiOia
Figure 54: Active Mines
1~(1"(1'0'W
legend
0 Co mmunities
c:: .Ala ska
D PNC IMA
0 50 100
... Active Mines X Coal
0 lndus lria l loli n.
• Molol
200 Ki lometers
I
114
Br1t1sh Colurnb1a
Myra FaUs
Notes: SCU"Ct hfofm• ion: BC Basem11p .-.d W.ersheds Boundary pro-.ided by B C ~stry of Sustain3ble Rlsouroe: ~tmoent . r.tnoral data pro>idod by B C IAinin-y of EN!rgy ~ tr.1inf:s P.ci•c ~rfl Coilst lnteped ~n~nt Ina Dound.yprovkt.d by OFO .
Projection : BC Albers, HAD 83 Production Dill: Morell 31 2006 Produced By : OHEB Nonoi rm , OFO

..
Pacific Ocean
OVavlew Map
~'""" L.:;JColtmbla
Figure 55: Former Mines
llO"')'O'W
legend
• Communities
c..~ Alaska
D PNCIMA
~ Former Mines
0 50 100
...
115
200 Kilometers I
British Columbia
Myrafals
Notes: So<.n:• hlolmotion: BC Buomoplnd -orshe<ls Boundlrf pro..;dod by 9 C lolinisty of S..sloinoblo Rtsouroo....,.g...- . Mnn <bla pro-d by 9 C Mininy of E'nergy and ~~tints Paciic Nom Coast nopod Min•gomont Ani• Boundarypro..odod byDFO .
Projection: BC Jlfbers, N.AO 83 Production Ill" : lolorm 31 2006 Prodoood By: OHEB Nanaimo , DFO

PNCIMA ··· ·- · A~~rvn~- 2oo4
Pacifi c Ocean
OvlliView Map
~ ... , .. ~Colo mDia
legend
G) Comm11nities
C) .Alaska
D PNCIMA
0 50 100
... --~~ .. Mnenl ValleS c=J .. 111111b •
.. 1-10UIIItu
- 10-100MIIIIa
- 100-11111:11
200 Kilometers
I
Figure 56: Assessed Industrial Mineral Value
116
Notes :
B r 1 t 1 s h Columbia
Sowct hfonn.aion : 9C Basemap and Wal:ersheds Booodary pro\Oided by B C Miniwy of Sustlimoblt Rtswr01: ~..-n.n~ . Mneral do:lt01 pro\OiidQd by 8 C t.Ainirty of fnorgy iiOd Minos Pocilc ~ rfl Co•st lnlo groted Mon_,..m '""• Booodoryp ro\Oidod by OFO .
Projodion : BC Albtrs, NAil 83 Production lll•o: ..-I'd> 31 2008 Productd By: OHEB N31ll1i"", OFO
. -

-~-- ···~~ --....___ PNCIMA -- Assessed melarva1tJe 20o4
Pac1fic Ocean
130"J'O'W
legend
• Communities
C) .Alaska
D PNCIMA
0 50 100
Figure 57: Assessed Metals Value
ACID ROCK DRAINAGE
Aetle811ed Melal Values 0 <1Million
1-1DMIIion
- 1D-100t.llllion
- 1DD- 1Billion
200 Kilometers I I I
Notes:
British Columbia
Source hforJ!mlon : BC Buem~p ~ ..-.ersheds Boundary pro-.tded by !I C lllihSIY 01 $Ust--le Rts:ourc. ~ellMft . lolntrol dol• pro>idod by 8 C r.tinlst"y of &.orgy ond Mints PliCilc fb rl> Cout Inti! gr>ttd t.lon_..,.nt ke3 Boundotypro>idod by OFO .
Projection : BC !>lbtrs, NNJ 83 Production O.te : Mortll 31 2000 Produ<td By: OHEB Nanairro. ~0
Acid rock drainage (ARD), possibly the largest environmental problem facing today' s mining industry, occurs when sulphide minerals in rocks and mine tailings are
117

weathered and exposed to water and air. Once ARD conditions are established, they are difficult and costly to mitigate, can persist in the marine environment for centuries and lead to bioaccumulation of metals in the aquatic food web. The type of copper found at the reclaimed Island Copper Mine, called chalcopyrite, is now known to be insoluble to biota and therefore not bio-available. Myra Falls metal mine, located in Strathcona Provincial Park, was closed from December 2001 to March 2002 due to a need for developing an action plan to solve persistent ARD related problems (Mining Technology, 2003).
The Anyox Slag Heap industrial mine is an acid-generating site monitored by the BC Ministry of Energy, Mines and Petroleum Resources and EC. The acid mining drainage (AMD) effluent would be very expensive and technically challenging to collect and treat and funding is absent to undertake remediation at this active problem site (CCSG Associates, 2001 ).
Table 15: Main Uses of Commodities Produced at Mines (BCMEM, 2003) Mine Name Commodity Produced Main Uses of Commodity
Copper (Cu) Wire and electrical equipment, pipes and tubes, roofing, alloy for brass, bronze and coinage.
Zinc (Zn) Plating or galvanizing for protection against corrosion, alloys, chemicals and medicines.
Lead (Pb) Automobile batteries, ammunition, glass, type metal, tubes or containers and gasoline
Myra Falls (Metal) additives. Cadmium (Cd) Batteries, protective plating and bearing
metals. Gold (Au) Jewellery, international standard for world
finance, electronic circuits, dentistry and coinage.
Silver (Ag) Photographic industry, electrical products, tableware, jewellery, mirrors, coinage and dentistry.
Silica (Si) Source of elemental silicon, steelmaking, flux,
Anyox Slag Heap abrasives, memory chips in computers,
(Industrial Mineral) glassmaking
Slag (Sg) Road bases, asphaltic aggregate, cement and concrete applications and fill.
Limestone (Ls) Cement, source of lime, construction Benson Lake (Industrial aggregate, ornamental stone, soil conditioner,
Mineral) flux, fertilizer, paint, plastics, glass, sewage and water treatment.
Granite (Gr) Decorative building stone, monuments and Tsitika Stone memorials, aggregate in concrete.
(Industrial Mineral) Dimension Stone (Ds) Decorative rock, ashlar and facing rock. Building Stone (Bs) Building construction. Bituminous Coal (CI) Coal and coke (coal liquids, tar and gas) for
Quinsam Coal steelmaking, fuel in power plants and/or steam generation in turbines to produce electricity
Kaolin clay /fireclay (Fe): Traditional ceramic art products; refractory (Many different grades for ceramic products (e.g. crucibles and firebrick);
Quinsam Coal specific applications), and filler and coating pigment in the paper ceramic clay, ball clay, industry; industrial filler applications (e.g. refractory clay (cement rubber, paints, plastics).
118

Mine Name Main Uses of Commodit
Table 16: Exploration and Deposit Appraisal Expenditures by Province and Territory 2001 to 2004 (NRCAN, 2004)
Province I Territory 2001 2002 2003 ~004a $millions % $millions 0/o $millions % ~millions 0/o
Newfoundland and 28.4 5.5 44.2 7.7 23.1 3.4 ~3 .0 3.4
Labrador Nova Scotia 2.8 0.5 3.4 0.6 6.4 0.9 12.2 1.2 New Brunswick 9.5 1.8 3.2 0.6 2.6 0.4 17.4 1.8 Quebec 102.9 20.1 111 .2 19.4 134.0 19.5 173.4 17.7 Ontario 113.6 22.2 139.0 ~4 .2 219.4 32.0 248.2 25.4 Manitoba 28.7 5.6 ~9 . 8 5.2 27.2 4.0 32.6 3.3 Saskatchewan 37.5 7.3 ~1.4 7.2 47.7 6.9 58 .8 6.0 Alberta 4.5 0.9 5.6 1.0 4.9 0.7 ~ .0 0.4 BC 29.1 5.7 39.2 ~.8 62.5 9.1 107.3 11.0 Yukon Territory 7.8 1.5 7.8 1.4 12.7 1.8 25 .6 2.6 Northwest Territories 86.6 16.9 172.7 12.7 53 .6 7.8 110.7 11.3
Nunavut 61.3 12.0 175 .9 13.2 92.7 13.5 155 .8 15.9
Total 512.9 100.0 ~73.4 100.0 686.7 100.0 979.2 100.0
MARINE USE ISSUES There are ARD issues at Quinsam Coal mine located on Quinsam River, which
drains into Campbell River, three kilometres upstream of the Strait of Georgia. Increasing trends of major ions attributed to the mine (such as sulphate, cadmium, magnesium, sodium and strontium) are indicators of water hardness and conductivity, which have been identified at the mouth of Quinsam River since the early 1990s. Biweekly water quality monitoring has been taking place at the site since 1986. Water quality indicators are within safe levels for water uses and sulphate levels upstream near the mine are higher. No effects have yet been observed or recorded; however, the level of sulphate occurring may be harmful to aquatic life (Haggarty, 2003).
ARDis also being monitored at Myra Falls metal mine in PNCIMA in order to develop a mitigation plan. Myra Falls mine discharge is directed to treatment and settling ponds and is discharged to Myra Creek once it has reached regulatory standards. Studies investigating use of a soil cover system that will function as an oxygen entrance barrier, water infiltration barrier, and medium for establishing vegetation cover are underway for the Myra Falls Mines. Measures are in place for monitoring ARD and metal leaching levels in order to mitigate negative environmental health impacts downstream of these sites (Desbarats, 2002, O'Kane, 1997 and P'Kane, 2001).
119

OIL AND GAS EXPLORATION
Petroleum reserves found in BC's offshore waters represent a potentially tremendous energy resource and opportunity for the people of the province. However, the possible incorporation of this resource into the province's inventory of oil and gas has significant challenges, including the safe and economic identification and discovery of viable reserves, as well as efficient production. Another challenge will be the appropriate assessment of the environmental, economic and social implications and responsibilities embedded in such activities.
Figure 58: Location of the Queen Charlotte Basin, Offshore BC with Seismic Reflection Data Collected In and On and Off-shore Well Locations
One of the offshore areas thought to have the best prospective petroleum deposits in BC is the Queen Charlotte Basin (QCB), which underlies Dixon Entrance, Hecate Strait, Queen Charlotte Sound and parts of the Queen Charlotte Islands in a region bound by the Queen Charlotte Fault, the northern tip of Vancouver Island, and the Coast Mountains.
120

The QCB occupies a large shallow marine region, approximately 80,000 km2 (500 km long, 150 to 200 km wide) and lies entirely within the PNCIMA (Figure 58).
CURRENT STATUS Sufficient well, seismic data and outcrop information are available to make a
reasonable initial assessment of the conditions of the Cenozoic sedimentary package in the QCB with respect to petroleum formation. However, considerable structural and sedimentological variability is recorded in the QCB (Rohr and Dietrich, 1992 and Deitrich, 1993), with sediments of similar age showing lateral changes in faces and thickness. With only 1000km of multi-channel seismic data in the public domain (Rohr and Dietrich, 1992), this heterogeneity severely limits the identification and definition of specific exploration plays. For a basin the size of the QCB, in combination with its high level of geologic complexity, this degree of exploration coverage is inadequate. The information base on Mesozoic sediments is even further limited. The lack of well control and poor seismic imaging of the older units, is a serious constraint on their interpretation. Any estimation of petroleum formation and occurrence originating from these older units is significantly less reliable. Uncertainties regarding the nature and occurrence of source rocks, the migration of hydrocarbons through faults and possible trapping of hydrocarbons in fmely layered sediments are still major difficulties in assessing hydrocarbon prospectivity in the QCB.
HISTORY OF EXPLORATION & MORATORIUM Numerous oil, tar and natural gas seeps on the Queen Charlotte Islands triggered
drilling for oil in the region as early as 1913, when the first well was drilled on Graham Island. Between 1949 and 1971, eight additional wells were drilled.
After the first recorded offshore seismic activity in 1958, the Province of BC imposed a moratorium on exploration drilling in the coastal waters between Vancouver Island and Alaska by 1959. However, in 1961 Shell Canada Ltd. began acquiring exploration permits in Hecate Strait and Queen Charlotte Sound, which led the company to conduct offshore seismic surveys between 1963 and 1968, collecting a total of 32,300 km of reflection seismic data (Smith, 2004).
The Province's moratorium was lifted in 1966, and from 1967 to 1969 Shell Canada drilled eight wells in Hecate Strait and Queen Charlotte Sound. Chevron Canada later earned an interest in the Shell offshore area by conducting seismic surveys in 1971 to 1972, during which they collected a total of 6,225 km of reflection seismic data (Smith, 2004) (Figure 59). Offshore exploration along the west coast was halted in 1972 following a federal government decision to not approve new exploration permits and to suspend all work obligations under existing permits.
In 1984 consideration was given to lift the moratorium to allow the petroleum companies holding leases in the region to undertake exploration programs. In April 1986, the West Coast Offshore Exploration Environmental Assessment Panel indicated that offshore oil and gas could proceed under certain conditions, namely an understanding of the drilling environment; use of the best available technology; a requirement for strong, effective regulation; and training, inspections and preparation for emergencies. Specific conditions further stated a requirement for continuing public and First Nations consultation,
121

environmental assessments of drilling programs, area and seasonal constraints on seismic exploration and no drilling within 20km of land during the initial drilling phase. Research requirements further included knowledge of currents, improved weather forecasting, seabed site surveys, bird surveys, baseline coastal inventories and sensitivity mapping. In the event of a spill, research on lethal and sub-lethal impacts of crude oil on salmonids and other species was required, as well as contingency plans, tests and reviews prior to drilling.
In 1987 negotiations between the federal and provincial governments on management of offshore oil and gas activity began. These were based on precedents set in Nova Scotia and Newfoundland and were without prejudice to ownership and jurisdiction. Two elements of the Atlantic and Nova Scotia accords were agreed upon: (1) that revenues should go to the Province as if on land, and (2) that reciprocal legislation would be put in place giving regulatory power to both governments. Negotiations finally foundered for two reasons: (1) the federal government was pressing BC to open land claims, and (2) BC wanted parity with eastern provinces regarding development funding.
However, in the same year, the Geological Survey of Canada (GSC) initiated an intensive study of the QCB and its petroleum potential (Frontier Geoscience Program), which culminated in a report (Woodsworth, 1991) and a number of independent scientific publications (Haggart, 1991 and V elluntini and Bustin, 1991 ). Part of this multidisciplinary basin analysis included the acquisition of 1,200 kilometres of seismic data (Rohr and Dietrich, 1990). Due to technical improvements, this most recent dataset is of significantly better quality than the industrial data acquired 20 years earlier. Furthermore, it is in the public domain and available via the Lithoprobe Seismic Data Archive.
Although negotiations between the federal and provincial governments were re-opened in 1988, they again came to a halt in 1989 when, in response to public concerns about the Nestucca barge spill off Grays Harbour, Washington and the Exxon Valdez spill in Alaska, the province declared that there would be no drilling for the next five years.
Interest was renewed in 1998 when the GSC indicated an oil potential of 10 billion barrels (bbls) and a gas potential of 43 trillion cubic feet (TCF) along the west coast (Hannigan et al., 1998). These are considered very high numbers and suggest that the BC offshore has a potential comparable to the Cook Inlet of Alaska and exceeding the potential ofthe Jean d'Arc basin off the east coast.
PETROLEUM SYSTEM ASSESSMENTS
Probability Scenarios
A 1998 report by the GSC (Hannigan et al., 1998) indicated a petroleum resource potential for the QCB of 9.8 bbls oil and 25.9 TCF gas, in-place (Figure 60). These figures are heavily based on Dietrich's (1995) probabilistic approach to estimate hydrocarbon occurrence, which combined well data with regional geophysical studies and land-based geology. Many variables interact in a complex way to yield estimates of in situ or recoverable oil and gas plus or minus a certain amount depending on initial probability estimates. Estimates are based on the presence of potential source rocks,
122
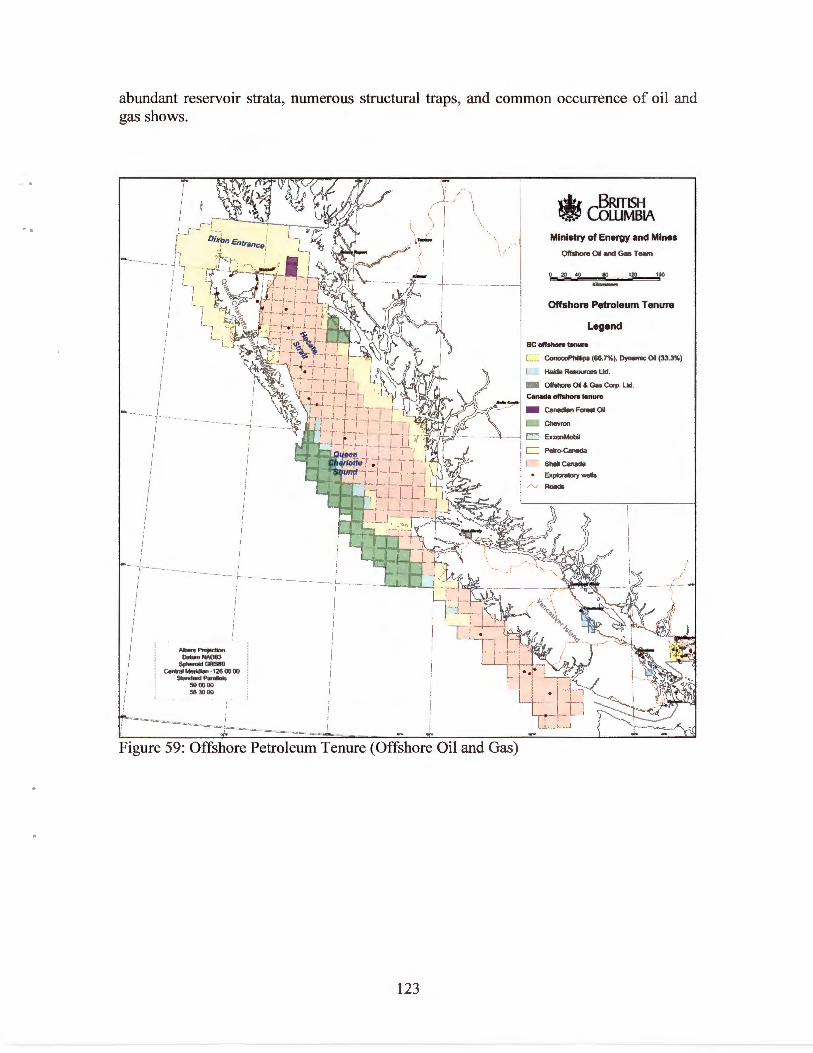
0 •
abundant reservoir strata, numerous structural traps, and common occurrence of oil and gas shows.
i I I
I I
I I !
Albers Prqectlon Datum NAD83
Spher00 GRS80 Central Meridian · 126 00 00
Standard Paralels 500000
i 583000
I I · ~ -·- I I I --====--~=--!...~ I I I I ~~=~=-·-- -
Figure 59: Offshore Petroleum Tenure (Offshore Oil and Gas)
123
V.~l BRITISH • COLUMBIA
Ministry of Energy and Mines
Offshore Oil and Gas T earn
0 20 40 80 120 160
Offshore Petroleum Tenure
Legend
BC offshore tenure
L ConocoPhiiNps (66.7%), Dynamic Oil (33.3%)
Haida Resources Ltd.
Offshore Oi & Gas Corp. Ltd.
C Petro-Canada
~--· Shell Canada
• Explorat()()' wells
Roads
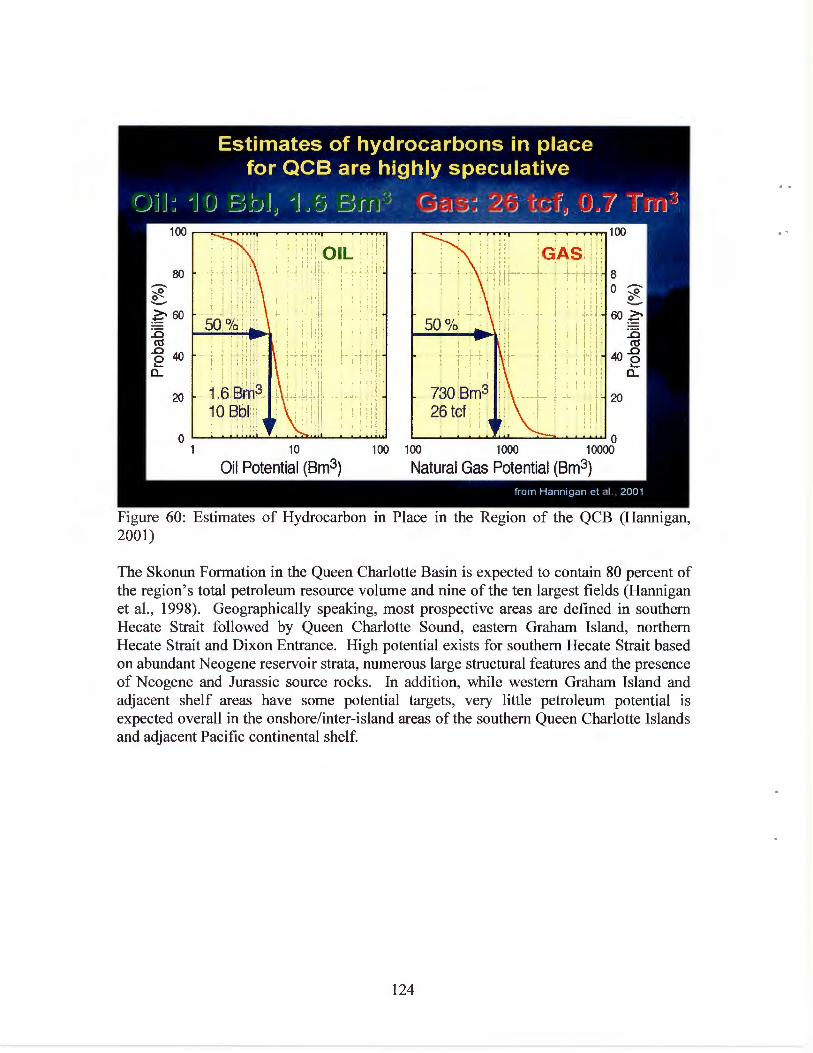
~ : I !
... --l"'- ..4
' ' .. i ~ T -!
l I ! l I 1 :t . ' .
. ; -'·····'-'!: 20 i! ::
Figure 60: Estimates of Hydrocarbon in Place in the Region of the QCB (Hannigan, 2001)
The Skonun Formation in the Queen Charlotte Basin is expected to contain 80 percent of the region's total petroleum resource volume and nine of the ten largest fields (Hannigan et al. , 1998). Geographically speaking, most prospective areas are defined in southern Hecate Strait followed by Queen Charlotte Sound, eastern Graham Island, northern Hecate Strait and Dixon Entrance. High potential exists for southern Hecate Strait based on abundant Neogene reservoir strata, numerous large structural features and the presence of Neogene and Jurassic source rocks. In addition, while western Graham Island and adjacent shelf areas have some potential targets, very little petroleum potential is expected overall in the onshore/inter-island areas of the southern Queen Charlotte Islands and adjacent Pacific continental shelf.
124

Current unproven evaluation at conservative current market value is
If developed over 30 years , annual revenue into B .C. economy
Direct: ca. 3 $8/yr Downstream value added: ca. 6 -15 $8/yr
Figure 61: Current Market Value Evaluation for Hydrocarbon Potential (Whiticar, 2004)
. . . : Using direct current (2005) economic valuation, the indicated petroleum resource potential (Hannigan et al., 2001) translates into approximately $51 billion and $50 billion, respectively (Figure 61). It is, however, important to realize that potential recoverable reserves are lower, possibly 2.5 billion bbl oil and 20 TCF gas.
Figure 62 compares estimated BC onshore reserves of 8.2 billion bbl oil and 73 TCF gas to Hannigan et al. 's 2004 estimations of 9.8 billion bbl oil and 41.8 TCF gas for the four west coast offshore basins. The combined potential direct value for the BC economy of $390 billion is divided into $13 billion per year over a 30 year production period. These estimates indicate that the BC offshore has greater oil and gas potential than the Jeanne d'Arc Basin; however, again, one must not confuse a recoverable reserve with potential resource estimates (Figure 63).
125
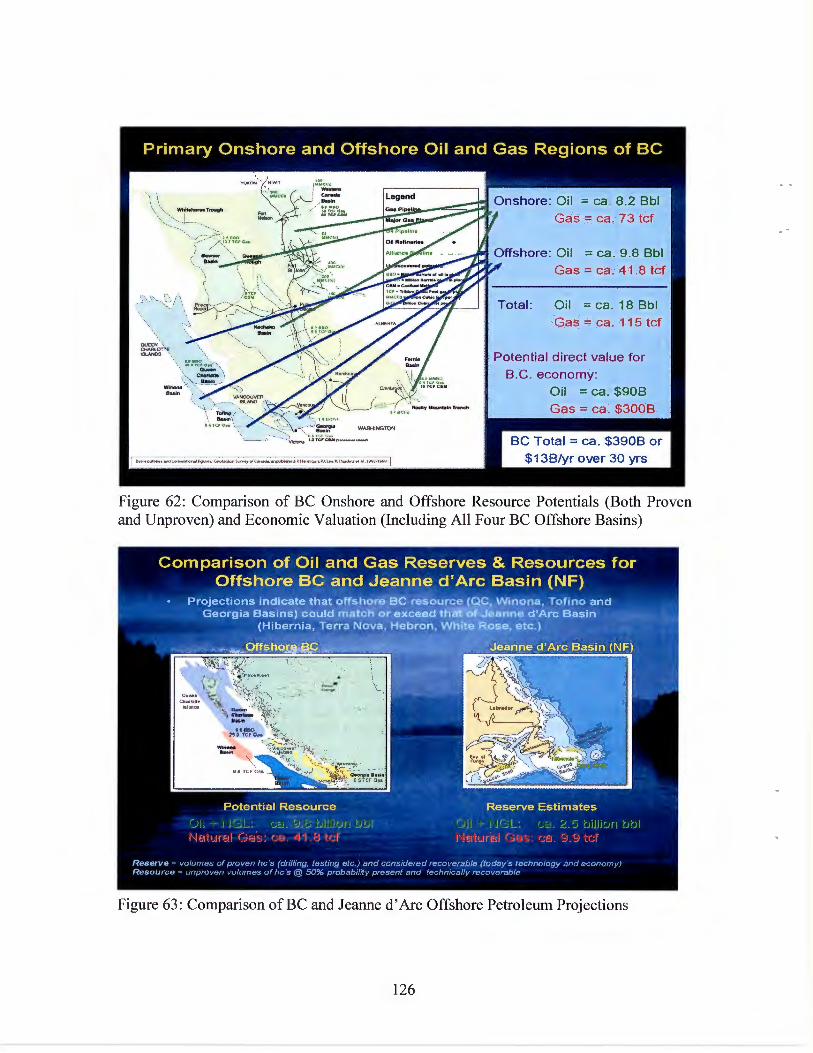
Gas = ca . 73 tcf
Gas= ca . 41 .8 tcf
Total : Oil = ca. 18 8bl Gas= ca . 115 tcf
Potential direct value for 8 .C, economy:
Oil = ca . $908 Gas= ca. $3008
8C Total= ca . $3908 or
Figure 62: Comparison of BC Onshore and Offshore Resource Potentials (Both Proven and Unproven) and Economic Valuation (Including All Four BC Offshore Basins)
Figure 63: Comparison ofBC and Jeanne d'Arc Offshore Petroleum Projections
126
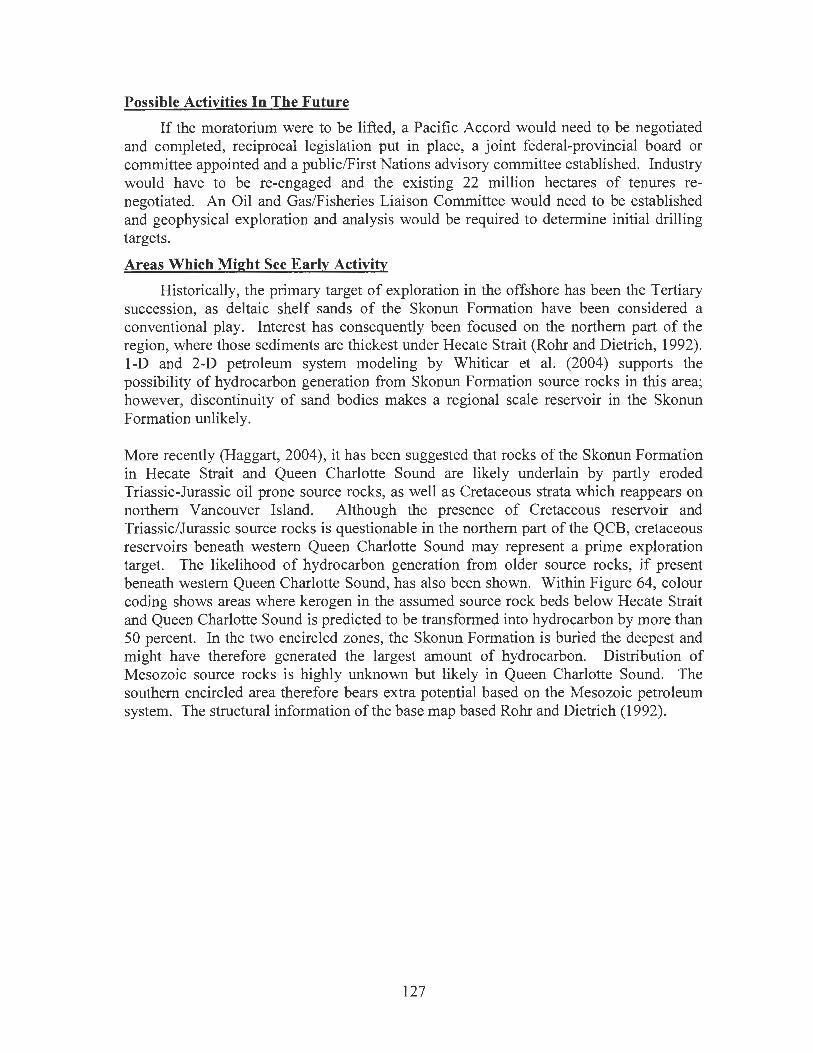
Possible Activities In The Future
If the moratorium were to be lifted, a Pacific Accord would need to be negotiated and completed, reciprocal legislation put in place, a joint federal-provincial board or committee appointed and a public/First Nations advisory committee established. Industry would have to be re-engaged and the existing 22 million hectares of tenures renegotiated. An Oil and Gas/Fisheries Liaison Committee would need to be established and geophysical exploration and analysis would be required to determine initial drilling targets.
Areas Which Might See Early Activity
Historically, the primary target of exploration in the offshore has been the Tertiary succession, as deltaic shelf sands of the Skonun Formation have been considered a conventional play. Interest has consequently been focused on the northern part of the region, where those sediments are thickest under Hecate Strait (Rohr and Dietrich, 1992). 1-D and 2-D petroleum system modeling by Whiticar et al. (2004) supports the possibility of hydrocarbon generation from Skonun Formation source rocks in this area; however, discontinuity of sand bodies makes a regional scale reservoir in the Skonun Formation unlikely.
More recently (Haggart, 2004), it has been suggested that rocks ofthe Skonun Formation in Hecate Strait and Queen Charlotte Sound are likely underlain by partly eroded Triassic-Jurassic oil prone source rocks, as well as Cretaceous strata which reappears on northern Vancouver Island. Although the presence of Cretaceous reservoir and Triassic/Jurassic source rocks is questionable in the northern part of the QCB, cretaceous reservoirs beneath western Queen Charlotte Sound may represent a prime exploration target. The likelihood of hydrocarbon generation from older source rocks, if present beneath western Queen Charlotte Sound, has also been shown. Within Figure 64, colour coding shows areas where kerogen in the assumed source rock beds below Hecate Strait and Queen Charlotte Sound is predicted to be transformed into hydrocarbon by more than 50 percent. In the two encircled zones, the Skonun Formation is buried the deepest and might have therefore generated the largest amount of hydrocarbon. Distribution of Mesozoic source rocks is highly unknown but likely in Queen Charlotte Sound. The southern encircled area therefore bears extra potential based on the Mesozoic petroleum system. The structural information of the base map based Rohr and Dietrich (1992).
127
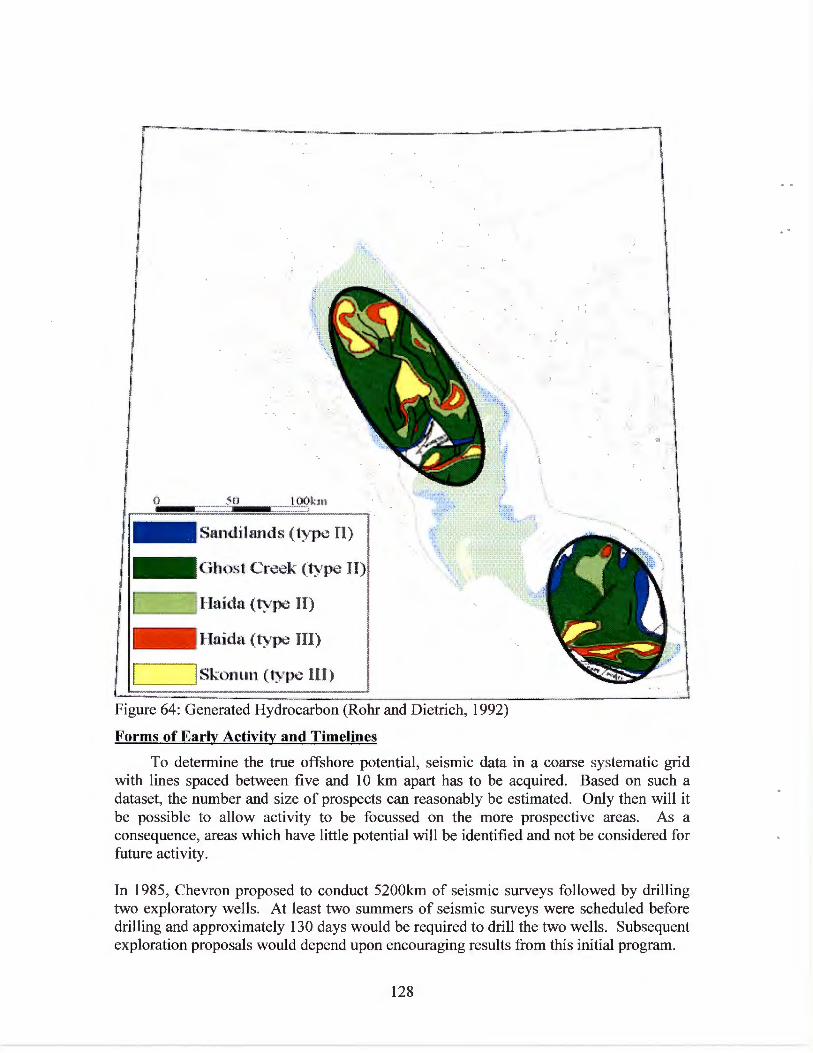
0 _ ___ (J
- Sandilands (type II)
- Ghost Cre ... k (type TI)
'Haida (type II) ._ __ _,
- Haida(type III)
[---~Skonun (type Ill)
Figure 64: Generated Hydrocarbon (Rohr and Dietrich, 1992)
Forms of Early Activity and Timelines
To determine the true offshore potential, seismic data in a coarse systematic grid with lines spaced between five and 10 km apart has to be acquired. Based on such a dataset, the number and size of prospects can reasonably be estimated. Only then will it be possible to allow activity to be focussed on the more prospective areas. As a consequence, areas which have little potential will be identified and not be considered for future activity.
In 1985, Chevron proposed to conduct 5200km of seismic surveys followed by drilling two exploratory wells. At least two summers of seismic surveys were scheduled before drilling and approximately 130 days would be required to drill the two wells. Subsequent exploration proposals would depend upon encouraging results from this initial program.
128

Chevron indicated that if initially encouraged by exploration results, it would extend its program through to a third well and, if the well resulted in discovery, after a period of evaluation a four well delineation program would begin. During early stages of this drilling, a detailed seismic survey would be conducted over the drilled structure to broadly determine the area of the field and to select appropriate delineation and development drilling locations.
The entire delineation program would require one drilling rig on a continuous basis for approximately two-and-a-half years. Studies to determine probable production facilities would begin during the fifth year if the discovery was considered to be commercial. The total time span between initial exploration and production would be on the order of 1 0 to 15 years, even if early results were favourable.
Other Scenarios
Other scenarios have been presented by Shell Canada, estimating 10 to 12 years to pass prior to first production, assuming a gas play (Figure 65) (Trollope, 2002). While those estimates by the two main tenure holders generally agree on an expected time frame, the Pacific Offshore Energy Association (POEA) has published a much more optimistic scenario, predicting the first commercial production to happen within nine years of lifting the moratorium.
However, this assumes that First Nations issues are resolved in the establishment of the West Coast offshore regime. It also assumes that environmental studies are not used to delay the process, but are done as part of an environmental assessment undertaken to clear the way for acceptable approaches to exploration, and that governments will take the lead in this (POEA, 2002).
129

Negotiation of Exploration Licences
• Exploration Licences Term 1 (5 years)
• FIRST PRODUCTION
Exploration Ll cences Term 2 1 (4 years)
-3 - 2 -1 0 1 2 3 4 5 6 7 8 9 10 Years
[--··=:=1
·Baseline Environ. studles ·Establish regulalory framework , royalty regime
• Modem ~gion.>l $eismic prow .. m a~quis~ion .md interprelation (~.f. L"urentian subbuin on East Coa$1)
E.L.'s
* c:::::::::::::::::J
• Oet;oill'd pr<Jspect seismic and lnterpr t tatlon
Discovery
* c::J =J • Explora.tion Orimng • Oe~neal.ion
Oulli.ng
Development Investment
Decision
* r::::::~:::::::::=::::= __ :c= ____ .] +? • CoMiruction
• Regul•tory approval • Oe•elopment planning ______ ........ ·-··--·--·-----·---·-··---·-·----- ----·----------'
Figure 65 : Notional Timeline According to Shell Canada (Trollope, 2002)
Figure 66 compares those estimates with two real life experiences from Canada's east coast, where 32 and 40 years passed by after issuing the first exploration licenses for Hibernia and the Sable offshore area, respectively. However, it has to be noted, that part of the slow development of the east coast was due to low oil/ gas prices during the 1980's.
Chevron
I Shell
0 5 10
Hibernia
15 zo Years
25 30 40
Figure 66: Comparison of Estimated Duration from the Year of Issue of Exploratory Licenses to First Production of Hydrocarbon in the QSB
POEA further expects the overall progression during exploration to consist of bursts of highly capital-intensive activity interspersed with periods of uncertainty. Thus, it is critical that those supplying and servicing the industry are able to ride through the fluctuations in activity and uncertainty of its time scales.
130

Alternatives
Apart from potentially intrusive exploration programs discussed above, several improvements could be made in the interpretation and assessment of petroleum formation and occurrence in the QCB using alternative methods.
In particular, little investigation has been performed on seafloor indicators of seeps, as they are known and characterized in the onshore areas near the Queen Charlotte Islands (Barrie, 1990). Mapping and sampling of petroleum seepages and pock marks in the offshore, in combination with sniffing for thermogenic gas in their vicinity, should be undertaken to improve understanding of the petroleum system. Pockmarks are well known on land and in Hecate Strait (Barrie, 1990), and form overt expressions of hydrocarbons which can provide key information on the character of the petroleum deeper in the basin.
Surface geochemistry using sorbed gas characterization of surficial sediments of Hecate Strait is another non-intrusive method to further characterize the petroleum system. It is a common exploration approach to map the geochemical expression of the subsurface, and to make predictions on the type and maturity of generated hydrocarbons. Such surveys potentially have the additional bonus of providing samples for environmental assessment work in Hecate Strait.
HUMAN USE ISSUES Working petroleum systems are present or have been present in the Queen Charlotte
Basin in the past, as proven by numerous oil, tar and natural gas seeps onshore and oil staining in some of the offshore wells. Whether or not commercial accumulations are present is unknown and any hydrocarbon assessment based on the available data as of today has to be highly speculative.
Based on a current understanding of the geology of the Queen Charlotte Basin, two areas - one in northern Hecate Strait and one in Queen Charlotte Sound - show sufficient burial depth and seem most favourable as the next exploration targets. For the gas-prone Skonun formation based petroleum system, this focus is based on the burial depth of the Neogene source rocks. For the oil-prone petroleum system incorporating Triassic/Jurassic sources and Cretaceous/Neogene reservoirs, the southern area in Queen Charlotte Sound could be the target.
Less uncertainty regarding the geological parameters, in combination with the favour of a gas-based petroleum economy off the west coast, might lead to a focus of interest towards the northern part of Hecate Strait as the next exploration target. As no modem seismic dataset yet exists for this area, extensive seismic campaigns will have to be accounted for prior to any exploration drilling. This, in combination with the many unresolved political, environmental, and ownership questions, will prevent a potential onset of production for at least the next 1 0 to 15 years.
131

PORTS
Ports and harbours in the PNCIMA play a crucial role in linking economic activities to markets that are otherwise inaccessible. They are the termini to vital gateways in the national transportation system. Ports like Prince Rupert, linked to the railway and road system, are essential for transporting both exported and imported goods. In the light of the increasing trade between North America and Asia, the future of Canada Port Authorities such as Prince Rupert is promising.
The Port Authorities, local, regional and remote ports and Small Craft Harbours are also important in sustaining employment, generating local economic activities, providing local people with access to essential re-supply services and assisting with activities related to business or pleasure travel. Marine transportation maintains a competitive edge in transport price efficiency if high volume trade is conducted over long distances, and this exemplifies the future of trade between Canada and China.
Ports are supported by infrastructure settings, such as marine terminals, that are directly related to the type of traffic they handle (e.g. facilities and organizations related to the loading and unloading of vessels berthed at the wharf). Port Authorities operate some of these marine terminals but often they are owned and operated by independent companies renting space from the port authority. These independent companies offer services (e.g. marine gas stations) that are commonly perceived to be connected to the local port authority.
GOVERNANCE
The Changing Nature of the Organizational Structure of the PNCIMA Ports
Previously, all public ports in the PNCIMA area were managed by TC's Marine Sector or Fisheries and Oceans' Small Craft Harbours. Both management systems relied on leases of water lots from the province of BC or, in very few instances, on the outright ownership of land. The Canada Marine Act outline rules and regulations for the operation of all ports under TC management while the Fishing and Recreational Harbours Act and the Federal Real Property and Federal Immovable Act summarize the guiding policies for DFO's operation of Small Craft Harbours.
TC has the overall responsibility for maintaining the safety and security of maritime transportation for operators and passengers of small vessels, large commercial vessels and pleasure craft. All policy and regulatory responsibilities associated with pleasure craft safety, marine navigation services, pollution prevention and response, navigable waters protection, and the transport of dangerous goods were transferred from DFO to TC in December 2003. TC has therefore assumed an integral role in marine security and marine infrastructure. Through the development and administration Acts and Regulations that support and promote marine safety and protect the marine environment, TC and DFO are committed to working with industry, stakeholders and the public to strengthen and encourage compliance with regulations and safe marine practices.
132

To assist with the access of clients and stakeholders to TC, ten TC centres have been established within BC. In the PNCIMA one is located in Prince Rupert and provides the following services within six distinct categories:
• Domestic Shipping: To conduct periodic inspections and certification of ships (hull, machinery, equipment), execute occurrence and pollution investigations (in collaboration with DFO) and prosecutions, monitor whether shipping of dangerous goods regulations are adhered to, monitor non-authorized transport of passengers and provide technical expertise and regulatory information to field surveyors and the marine transportation industry.
• Foreign Shipping: Conduct port warden and port state control inspections, execute occurrence investigations, and conduct inspections to ensure compliance with regulations regarding stowage, segregation and packaging documentation of dangerous goods.
• Occupational Safety: Inspect and certify shore-based and ship-borne cargo handling equipment, maintain regulatory involvement in safety and health issues and execute investigations related to the above.
• Registrar of Ships: Register ships and administer their transfer of ownership and vessel names, register marine mortgages, update the certificate of registry (Blue Books) and provide public information regarding registered vessels.
• Ship Building, Repair, and Maintenance: Provide plans and data approval, inspect hulls, machinery and equipment during construction, modification and repairs of ships, manage tonnage approval and ship registry, offer technical and regulatory advice to industry, manage accreditation of depots and manufacturing plants and complete load line surveys.
• Training and Certification for Seafarers: Provide marine examinations, certifications and training centre accreditation, monitor training and issue seafarer documents and discharge books, open and receive log books (shipping master accreditation) and register candidates for marine examinations.
Port Categorization under Transport Canada and Fisheries and Oceans Canada Management
Under the National Marine Policy implemented under the Canada Marine Act and before the divestiture of ports through TC or DFO, all ports and harbours were classified into four categories (Figure 67).
Canada Port Authorities (TC): Canada Port Authorities are operated under the Canada Marine Act. Ports in this category are traditionally located in larger centres and represent a national and international connection between the marine and the land based modes of transportation. The Port of Prince Rupert represents the only Canada Port Authority in thePNCIMA.
Regional or Local Ports (TC): Regional or local ports service communities commonly connected to a highway or a railway line. Although the port is not an essential gateway to the outside world, it allows for regional distribution of goods from the highway system to other ports.
Remote Ports (TC): Remote ports are generally an essential, if not only, link between isolated community and the outside world.
133

Small Craft Harbours (DFO): The Small Craft Harbours program operates and maintains a national system of harbours providing commercial fishers and recreational boaters with safe and accessible facilities. The mandate of the Small Craft Harbours is to keep harbours critical to the fishing industry open and in good repair. The four main strategies to achieve this mandate are: maintain a network of core harbours; promote the formation of harbour; authorities to ensure local control over management of commercial fishing harbours; dispose of non-essential harbours by transferring all recreational harbours to local communities; reduce the number of derelict and low activity fishing harbours.
Small Craft Harbours is a decentralized program. National coordination is provided by Ottawa while program operation is managed by regional offices. Small Craft Harbours is currently responsible for 1 004 fishing harbours and a remaining 219 recreational harbours. Together these harbours include almost 6000 structures valued at approximately $2.1 billion nationally (PNCIMA value unknown). Small Craft Harbours are often the only federal presence in small coastal communities and provide the most direct and visible link between the communities and the federal government.
Divestiture or Transfer of Ports from Transport Canada to Local Port Authorities and from Fisheries and Oceans Canada to Local Harbour Authorities
In December, 1995 with the announcement ofthe National Marine Policy (National Marine Policy, 1995), the established management scheme under TC and DFO's Small Craft Harbours Program was reorganized. TC moved away from the direct operation of ports, giving local users more say in port services. Typically, TC initiated the divestiture process by cancellation of its interest in the water lot leased from the province and thus made way for local interest groups to re-apply for the same water lot. To facilitate the transfer of responsibilities, TC provided time limited funding through contribution agreements to allow structural improvements to meet the prevailing local needs and to ensure long-term economic viability. For example, the transfer of the Regional/Local Port of Stewart from TC to the District of Stewart in 2002 was assisted by a five year contribution agreement (Harbours and Ports Program) totalling $571,000.
As of October 31, 2005, a total of 462 of the 549 Port Programs and divestiture facilities, across Canada, had been transferred, demolished or terminated. Canada has therewith created a National Ports System made up of independently managed Canada Port Authorities. The authorities are self-sufficient enterprises that are critical to domestic and international trade.
In BC, all former Canada Port Authorities and most of the Regional/Local Ports have undergone the process of divestiture by TC to municipal authorities, societies, local interest groups or other federal ministries such as Fisheries and Oceans Canada. Many of the Remote Ports remain under TC control since they are an extension of the public access grid (Figure 68).
134

Table 17: TC ports Divestiture Progress Regions Original 95- 96- 97- 98- 99- 00- OI- 02- 03- 04- 05- Remaining
Inventory 96 97 98 99 00 01 02 03 04 05 06 Sites Atlantic 262 I4 28 3 7 9 5 7 2 I 2 I 23 Ontario 56 I 8 5 4 2 4 I 2 I2 Pacific I 58 55 3 5 2 I6 30 IO 3 4 I I8 Quebec 73 2 2 9 I I I 34 Total 549 7I 3I I4 I7 I5 32 42 I2 6 8 3 87
Table 18: Divestiture Process from TC to Local Interest Ports Originally Contribution TC Category pre- Ports Divested by Ports Remaining underTC Agreement Divestiture TC underTC Alert Bay yes Regional/Local Local Interest
Port 2000-200I Alice Arm yes Regional/Local Local Interest
Port 200I-2002 Alliford Bay yes Regional/Local Local Interest
Port 200I-2003 Bella Bella N.A. Remote Port TC Bull Harbour no Regional/Local Returned to
Port Province Coal Harbour yes Regional/Local Local Interest
Port 2004-2005 Deep Cove yes Remote Port Local Interest
200I-2002 Hartley Bay N.A. Remote Port TC Jeune Landing yes Remote Port Local Interest
2003-2004 Kelsey Bay yes Regional/Local Local Interest
Port 200I-2002 Kincolith yes Remote Port Local Interest
2000-200I Kingcome Inlet N.A. Remote Port TC Klemtu N.A. Remote Port TC Mas set yes Regional/Local Local Interest
Port 200I-2002 Owen Bay N.A. Remote Port TC Port Clements yes Regional/Local Local Interest
Port 200I-2002 Port Hardy yes Regional/Local Local Interest
Port 2000-200I Port McNeill yes Regional/Local DFO I995-96
Port Port Neville N.A. Remote Port TC Port Simpson no Regional/Local Demolished 2002-
Port 2003 Prince Rupert yes Canada Port
Authority Prince Rupert no Marine Facilities DFO I995-96 (Sourdough Bay) Quatsino N.A. Remote Port TC Queen Charlotte no Regional/Local DFO I995-96 City Port Rivers Inlet N.A. Remote Port TC Sandspit N.A. Remote Port TC
135

Ports Originally Contribution TC Category pre- Ports Divested by Ports Remaining underTC A2reement Divestiture TC underTC Alert Bay yes Regional/Local Local Interest
Port 2000-2001 Alice Arm yes Regional/Local Local Interest
Port 2001-2002 Sointula yes Regional/Local Local Interest
Port 2001-2002 Stewart $571,000/5 years Regional/Local District of Stewart
Port 2002
136
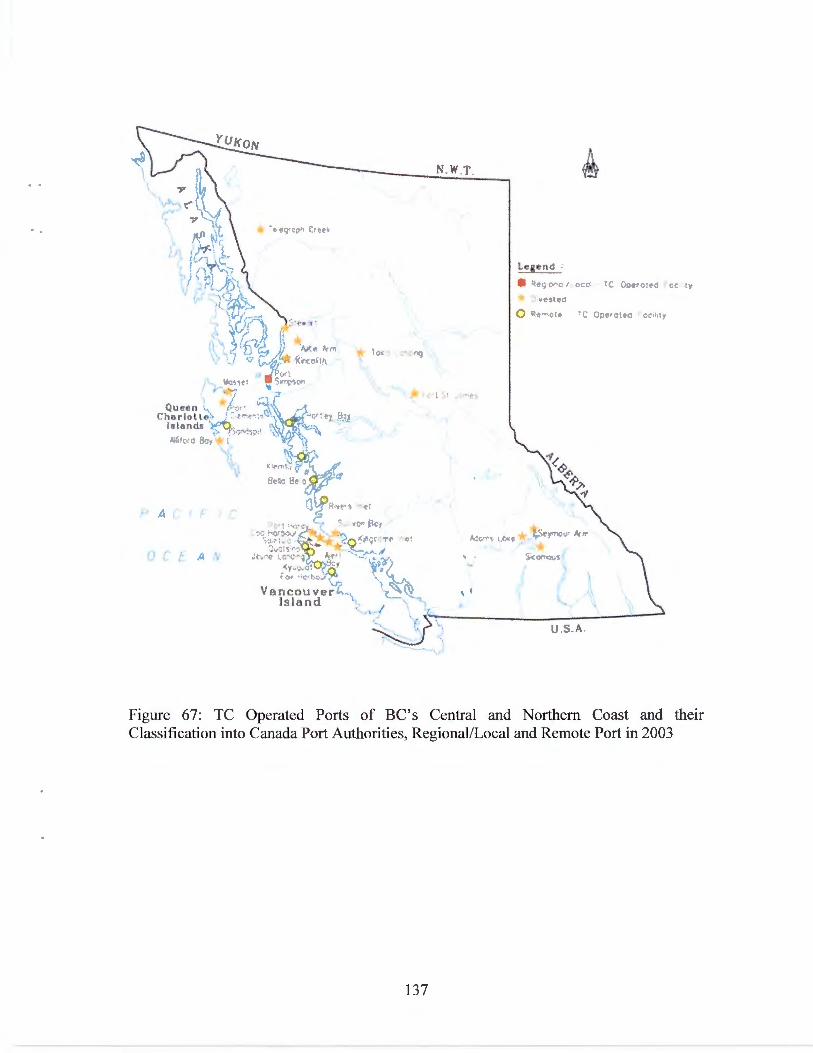
\ (
Queen Charlo l l
[sland ';-
.\'or:: Hot
tJ .4 .
0 (. f. A ,\
, .,_., Eo ,\;f'"l
ir-~(lqr
. W.T.
1r . " .•
- -"' . -· ··vr .. \~~.. \1
·A.v../ \. ' . ' '
' ~ .
l.e end
-i-!!I,.L•~·c I oco T"" Oot~ ... ote-!J • cc t<
_: v~;~ec
Q ;·of!'-Oif" ~C 0~ ~ '0111)C · Ct 1 ·~ ~
u.s.A.
Figure 67: TC Operated Ports of BC's Central and Northern Coast and their Classification into Canada Port Authorities, Regional/Local and Remote Port in 2003
137

, .. "_.i'· ·:· ... ~· -· ~
... . ': ~~··.
... ··. _ .. i
... : ·_ ,: ..... 7.-':- ....
. · . ..: ..... _ ... , '. -~ . . ,. ..
\ ... ("'"' · .. .
~~~~ J - ·
•. : •··•·· f ,. M oro
II ._..r+w.:ur Aurhnrity
::::3 Cf0Atu11Qoo1uy
"::t... ti .. .. ...
_ .. . ·.
Figure 68 Small Craft Harbours in the PNCIMA Area and their 2003 Status within the DFO Small Craft Harbour Divestiture of Management Process
For the DFO guided-divestiture process of Small Craft Harbours, the priontles and processes are similar. All recreational harbours, as well as low-activity and derelict fishing harbours are targeted for divestiture of management. DFO provides the necessary harbour repairs and environmental clean-up associated with transfer by either undertaking this work prior to disposal or by providing a comparable grant to the recipient instead. Harbours are offered, in order of priority, a nominal fee to:
• Other federal departments. • Provinces. • Municipalities. • Local non-profit associations or First Nations. • Through a tendering process to the private sector based on a nominal fee and an
agreement to maintain access and service for a minimum of five years.
138

Municipalities have generally shown the most interest and harbour facilities are demolished only if there is no local interest in them; in other words, transfer or demolition only occurs after the communities concerned have been consulted and agreement is reached.
To-date, 626 recreational harbours and 290 fishing harbours have been divested. Additionally, 219 recreational disposals are in progress. In BC all 65 Recreational Harbours have been, or are in, the process of being divested while many of the Fishing Harbours are still under DFO Small Craft Harbour management.
Within the PNCIMA, and along the rest of Canada's coastline, Ports and Small Craft Harbours have undergone dramatic changes in management and/or ownership. For Canada Port Authorities, local ownership and management seem necessary and will likely create a business environment that attracts external investment as in the case of the Port of Prince Rupert. Local ownership and management of Regional/Local Ports allows the port management to offer services that meet local demands thus establishing economic sustainability. Lasting economic sustainability following divestiture of Remote Ports, especially those connecting coastal First Nations communities to larger centres, remains questionable. Remote communities often experience summer cycles of economical sustainability while they are not profitable during the winter season.
139

Summary of the Regulatory Framework for Ports and Small Craft Harbours
Table 19: Acts that Regulate the Operation of Canada Port Authorities, Regional/Local Ports, Remote Ports and Small Craft Harbours
Fishing and Recreational Controls the use of harbours under the administration of the Small Craft Harbours Act (1985, c. F.
Harbours Directorate ofDFO. 24.) Federal Real Property and
An act that regulates the acquisition, administration and disposition of real Federal Immovable Act (1991, c.50)
property and immovable by the Government of Canada.
Canada Marine Act Making the system of Canadian ports competitive, efficient and
(1998, c.IO) commercially oriented, providing for the establishment of port authorities and the divestiture ofharbours and ports.
Port Authorities As part of the Canada Marine Act, the regulations outline the provisions
Management Regulations (1998,c.IO) and liabilities of Port Authorities following the divestiture process.
Port Authorities As part of the Canada Marine Act, the regulations outline the operations of Operations Regulations Ports by Port Authorities. For Canada Port Authorities (Prince Rupert in (1998, c.10, 2000) the PNCIMA) detailed operations and port limits are provided.
Practices and Procedures Promoting safe and efficient navigation and environmental protection
for Public Ports within the limits of public ports that remain under TC ownership and management
Public Ports and Public As part of the Canada Marine Act, the regulations outline the provisions Port Facilities Regulations and liabilities of Regional/Local Ports that are remaining under TC (1998, c.IO, 2001) ownership and management. Transportation of
Lays out provisions and regulations for the transport of dangerous goods Dangerous Goods Act
and provides defmitions and limits. (1992)
CANADIAN COAST GUARD STATIONS ASSOCIATED WITH PORTS AND SMALL CRAFT HARBOURS
CCG Stations are an integral component of ports and small craft harbours in the PNCIMA. They are part of DFO and are responsible for policies and programs in support of Canada's economic, ecological and scientific interest in the oceans and freshwater; for the conservation and sustainable utilization of Canada's fisheries resources in marine and inland waters; and for safe, effective and environmentally sound marine services, responsive to the needs of Canadians in the global economy (CCG, 2003-2004).
Four Coast Guard Stations are located in the PNCIMA. From south to north the ports of Port Hardy, Bella Bella, Sandspit and Prince Rupert host Canadian Coast Stations that employ roughly 80 to 90 officers and support staff and therefore represent a significant employer in the region. The CCG Stations within the PNCIMA ports offer the following services to assist maritime safety:
• Search and Rescue (SAR) (all stations) coordinate and carry out SAR operations. • Office of Boating Safety (Prince Rupert) promotes marine and boating safety
through distribution of safety information and publications. • Waterways Development (Prince Rupert) ensures that active fishing harbours are
safe and accessible. • Marine Communications and Traffic Services (Prince Rupert) provide
information on marine weather conditions, first response to and coordination of
140

distress calls, regulating vessel traffic movement and screening vessels entering Canadian waters.
• Aids to Navigation (Prince Rupert) deploy and maintain buoys and beacons. • Environmental Response (Prince Rupert) coordinates pollution preparedness
planning, aerial surveillance, environmental education, pollution prevention, monitoring and response.
SMALLER PORTS AND PORTS IN REMOTE COMMUNITIES
Examples and General Tends of Current Economic Activities in Smaller Ports
Logging, fishing and fish processing are the main industries in the Queen Charlotte Islands (Haida Gwaii), with tourism becoming increasingly important. Over the last two years, diversification of seafood processing at the Omega Packing Company Ltd. and C&B Island Fisheries Ltd. processing plants in Masset have led to a resurgence of its economic viability. Dungeness crab mainly from the highly valuable Area A crab fishery, dogfish, tanner crabs and razor clams are only a few of the new products that keep the plants open year round.
The 1970's saw the end of an era in Telegraph Cove, North Vancouver Island, as the lumber mill, salmon saltery and fish storage warehouses gradually yielded to pleasure boaters, kayakers, sport fishermen, whale watchers and vacationers. Today, Telegraph Cove is a starting point to explore the Broughton Archipelago, the famous orca rubbing beaches of Robson Bight and the island studded marine route known as Johnstone Strait. A multi-million dollar development project is planned that will transform Telegraph Cove into a larger destination community in the next few years.
Port McNeill's (North Vancouver Island) logging industry is in a downturn and the mine has been closed. The void left by the commercial fishing sector's downsizing is gradually being filled by the fish farming and tourism industries.
As a result of less activity in the forestry and mining sectors, many of the remote and smaller coastal communities have lost a portion of · their populations and have experienced a change their characters as a result. Salaries in tourism-related industries are lower and, due to the often needed initial capital investment, bear a higher risk. With less disposable income available, many communities lose part of their retail sector, with job losses continuing until new opportunities in the form of fish farming, fish processing, charter businesses or other tourism related undertakings can be realized. These trends also become visible in the services that Ports and Harbours in the PNCIMA are offering.
141

Table 20: Regional, Local and Remote Ports and Small Craft Harbour Usage Usage Boat Main Community Home Communit Future
Numbers Freight dependent on Port of y Plans
POrt -. Visitors Populatio
n Alert Bay C-fishing, 70 winter groceries, survival, Europe, 1400- ?
R-fishing, 475 fish, needs to u.s., 1600 local summer expand Canada (75% transport, F.N.) .. tourists, cruise
Bella C-fishing, 76 winter, fish, fuel, exceptionally U.S.,BC 2500 None Coola R-fishing, 150-175 groceries Interior, (50%
charters, summer Alberta F.N., 50% tugboats mix)
Coal R-fishing, 250 recreation very much, Europe, N/A ? Harbour Live- tenants al items tenants USA,
aboard summer 5 everywher tenants e winter
Kelsey C-fishing, 30-40 fish, quite, very U.S., 1400- ? Bay R-fishing, winter salmon, much Alaska, 1500
tourism 100 crab Canada summer, more during C-fishery
Kitamaat C-fishing, ? charters, local transport
Port Forestry, less than forestry transportation Local 517 None Clements R-fishing 12 workers of forestry
workers
Port R-fishing, very 100,000 very much, Canada, 4500 None Hardy C-fishing, popular pounds of brings U.S.,
charters, summer sea people/ Alaska Coast and winter products tourists to the Guard community
Port R-fishing, very concrete, transportation Europe, 3000 Extend McNeill C-fishing, popular fish, of forestry- Japan, breakwa
forestry, summer forestry fish farm New ter (summer/ and winter and fish workers Zealand, expand winter) farm U.S. harbour
workers Queen C-fishing, very fish plant, locals- France, 3000 lmprovi Charlotte charters popular salmon mooring, Japan ng City R-fishing, summer halibut economy is breakwa
local and winter dependent ter transport expand
parking Sointu1a C-fishing, 140 boats moorage very much, U.S. 800-900 Expand
R-fishing summer only Alaska, wash-(summer) BC house,
ongoing
142

Telegraph R-fishing, 130 slips just not a Cove whale busy in people community
watching, summer, charters few locals
in winter Bella R-fishing, steady- 1.3 dependent for Bella C-fishing tourism million fuel
summer, litres-heating oil
Jeune R-fishing, 12 private very Landing forestry moorage, yacht dependant
crews, C- transient club, Port fishing in summer Alice
Sandspit R-fishing, 84 slips lots of local charters, busy in people economy is crab summer, very fishing, few locals dependent Coast in winter Guard
(C=commerctal, R=recreat10nal, FN=Fust Nat10ns)
Port of Prince Rupert
u.s. 20 no plans summer, 10 winter
U.S., 2000 Fully Alaska, upgrade Prince port, Rupert make
website u.s., 800 Port ? Canada, Alice, Alberta 1500 w/
mill open u.s., 350 None Europe, Canada
The Port of Prince Rupert is a Canada Port Authority and, with the drafting of the National Marine Policy in 1995, its management and ownership has been transferred from TC to the Prince Rupert Port Authority under the direction of a Board of Directors. Following the lowest shipping volume through the Port of Prince Rupert in decades in 2002 to 2003, the Prince Rupert Port Authorities attracted provincial, federal, municipal and private funds to build a cruise ship dock and a container port.
The construction of the Northland Cruise Ship Terminal created 42 fulltime positions and $1 million in payroll taxes. In 2005, its second year of operation, the cruise ship dock presented Prince Rupert to 92,600 visitors who spent an average of $80 per visitor in the area, and generated an estimated $530,000 in sales taxes and 53 fulltime equivalents. The future of the Northland Cruise Ship Terminal promises more economic activity and job creation.
Also in 2005, the Prince Rupert Port Authority, with funding secured from provincial, federal and private sources, initiated the demolition of the existing Fairview Terminal buildings to make way for a cutting edge high volume container port to service the increasing import of Asian goods into North American markets. While the demolition has been completed, the Port Authority is requesting tender for the engineering and electrical construction of the first phase of the new container port. Agreements have already been signed that identify Maher Terminals (the operator of the largest North American container port in New Jersey US) as the operator of the Prince Rupert container handling facility.
During the construction of the first expansion phase, 475 fulltime equivalents and over $5 million in payroll taxes will help to strengthen the local economy. However, once the port is fully operational in 2007, it will initially employ 300 fulltime equivalents to reach its full capacity (Figure 69). By 2015, 2,400 direct and indirectly created fulltime
143
equivalents will have been created while a projected $244 million in payroll costs, $40 million in payroll taxes and $75 million in government taxation will have also been generated. Prince Rupert will finally be able to take advantage of possessing the deepest and northernmost ice-free harbour in North America and its closeness to the Asian markets as Vancouver, the largest container handling port on Canada's west coast, has reached the limits of its capacity. What was once considered to be a large disadvantage (distance to large urban centers), is now compensated for by the availability of space and lack of traffic. Prince Rupert is well connected by rail to centers from Edmonton to Chicago and appears ideal as a put-through facility. Invited by the opportunity to fill the empty containers with goods produced in northern BC, increased manufacturing and raw material shipping to the Asian markets is expected in the future. Based on a container port GAP analysis, the region may be able to provide many of the skilled workers that are needed to fill the new positions.
Job Category/ Job Type # ofjobs Estimated Skill Level Phase 1 Phase 2
Manager Managers & supervisory 20 35 Office Admin!Clerical staff 14 20
Logistics personnel 10 20 Skilled Labour Longshoremen (at terminal) 100 250
Machine drivers/loaders/ general 32 96 Long and short haul truck drivers 8 35 Security personnel (terminal +off-dock) 24 70 Sub-total 164 451
Skilled Trades Mechanics 14 33 Refrigerator journeymen I technicians 10 35 Tugboat/barge crew ~ 46 Sub-total 32 114
Government RCMP : Officers 4 8 Clerical 1 2
Coast Guard 2 6 Customs officers 46 86 Immigration officers 2 6 Pilots Q ~ Sub-total 55 110
Total 295 750
Figure 69: Employment Needs and Skills for Prince Rupert Container Port Development and Operation
144
..

Private Port of Kitimat
The private Port of Kitimat services two major manufacturing plants, the Alcan aluminium smelter and the Eurocan paper mill (Figure 70). Kitimat therefore hosts a unique mix of globally successful industries that represent 11 percent of the Provincial Manufacturing GDP, or $1 billion annually, relying on a labour force of only 5,970.
Ale~ Tt:mlinal -
St~a Ramp Rtvtow Str 1 s T•J!) Whai1 ~ 1
AlcantKume:mo F~rry Wharf -- • ivto•v AM~e l=lRITip
Figure 70: Port ofKitimat
Mf:ll1 i'lt"'.i'i Tr:rrmlnnl
___ RArg nAmp
_.......- Borth 2
- Berth 1
EurncRn Turmit •dl
In 2005 Methanex announced the closure of their Kitimat methanol plant and, at the same time, publicized their plans to use the Methanex Terminal for future methanol and condensate imports.
Alcan is currently using the Alcan Terminal to import petcoke (an industrial fuel , several barges per month), liquid pitch (a binding agent used in the production of aluminium, two vessels per month) and alumina (an aluminium component, two vessels per month), while exporting its final product, aluminium, at a stable rate (two vessels per month) that is not expected to change in the future. Alcan is also assessing the value of the development of a container miniport to take the overflow stemming from the operation of the Prince Rupert Container Port.
Eurocan exports its finished paper product (four vessels per month) and imports woodchips (four barges per month), through the port and is not planning on making changes to the volume of freight that it ships through the Eurocan Terminal.
145

Enbridge Incorporated is the operator of the world's longest liquid crude pipeline system and is proposing to build a pipeline that will use Kitimat as its final destination to transfer port to export crude oil and import condensate. The volume of vessel traffic needed to satisfy Enbridge 's needs has still to be determined in detail. Given that Enbridge ' s construction plans still have to undergo an extensive environmental review, subsequent construction of the pipeline and new terminal may still be four to eight years away.
Galveston LNG, a company backed by European and US investors, recently secured the first $50 million to carry out the environmental review process for a liquefied natural gas (LNG) receiving, degasification and send-out terminal in Emsley Cove, located 15 krn south ofKitimat. The stakeholders in this endeavour have formed Kitimat LNG and have chosen its rather remote location to forego the opposition that LNG ports are commonly subjected to in urban centres (following a massive explosion of LNG in 1941 in Cleveland, USA, LNG was banned from the USA for the following 20 years).
In summary, the Private Port of Kitimat is facing a bright future and increased vessel traffic from 2008 forward, if all of the proposed projects are realized. For now, the shipping volume has been slightly reduced due to the Methanex closure.
Small Craft Harbour of Kitamat
The Kitamaat Small Craft Harbour is divided into two facilities, a commercial fishing harbour located on the doorstep of Kitamaat Village and a recreational and commercial fishing harbour located two kilometres north of the village.
146

..
RECREATIONAL FISIDNG
DFO defines sport fishing as fishing by any means for recreational purposes. This includes angling, assisting in landing a fish and gathering shellfish. Fish that are caught as a result of sport fishing cannot be bought, sold or bartered in Canada. The terms recreational fishing and sport fishing are often used interchangeably, although some "experts" in the industry indicate a preference for "recreational fishery" because it reflects a greater range of activities and experiences.
The recreational fishery is driven by "opportunity and expectation": the opportunity to fish and the expectations of catching something and retaining it to eat. The experience of fishing has almost everything to do with the appeal of recreational fishing. In this respect, the recreational fishery is distinct from the commercial sector, which is fundamentally driven by the economic value of fish landed.
This report provides an overview of BC's recreational fisheries that occur in, on or near the marine or coastal waters of the PNCIMA, sometimes referred to as the tidal water recreational fishery. DFO regulates and manages BC' s tidal water recreational fishing and marine species, while the province deals primarily with the freshwater species. The main species targeted by BC's recreational tidal anglers are Chinook salmon, coho salmon and halibut.
Along the north and central coast of the PNCIMA, almost 80 percent of the recreational catch between 2003 and 2005 was comprised of Chinook and coho salmon. Other key species include rockfish, lingcod and halibut, which are quickly gaining in popularity. Steelhead is an important recreational fish, caught mainly in freshwater rivers and streams. Important summer and winter steelhead fisheries occur on several rivers in BC including the Skeena, Nass, Stikine and Dean rivers.
GOVERNANCE The Fisheries Act is the main piece of legislation that determines how the fishery is
managed. It outlines provisions for protecting fish habitat and authorizes DFO to carry out the day-to-day management of tidal recreational fisheries. The BC Sport Fishing Regulations (1996) identifies closed times, periods when fishing is prohibited, bag limits and size limits for all sport fisheries in BC. The federal legislation also applies to certain anadromous species that live mostly in the sea (tidal water) and breed in fresh (non-tidal) water, for example salmon and steelhead. The province has been given responsibility for regulating fishing for fresh water species, including species such as trout.
The Sport Fishing Advisory Board (SF AB) advises DFO on recreational fishing plans, fishery regulations and areas of concern to the recreational fishing community. The board, in existence since 1964, is broadly based consisting of elected representatives from each regional subcommittee. The north coast subcommittee represents eight local regions and the 15 south coast regions. Non-voting government members and appointed representatives from organizations also sit on the board. The organizations include the Sport Fishing Institute of BC, BC Wildlife Federation, Steelhead Society of BC, BC Federation of Fly Fishers, BC Drift Fishers Federation, Marine Trades Association, BC
147
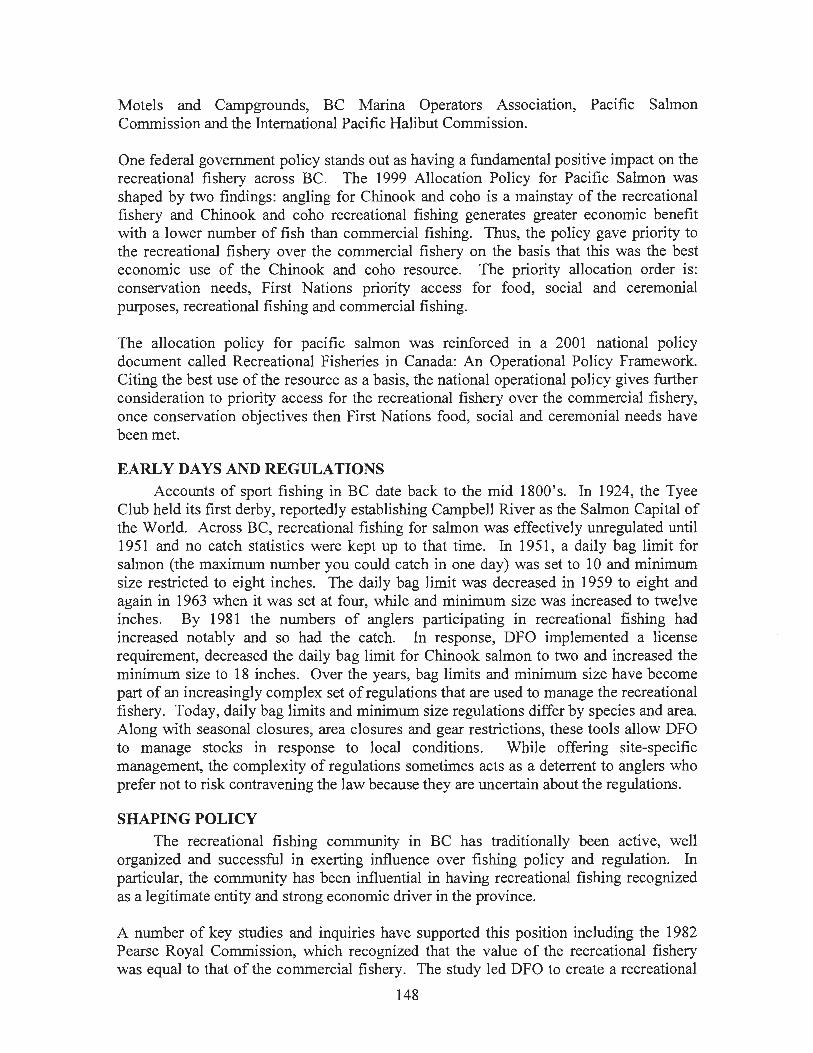
Motels and Campgrounds, BC Marina Operators Association, Pacific Salmon Commission and the International Pacific Halibut Commission.
One federal government policy stands out as having a fundamental positive impact on the recreational fishery across BC. The 1999 Allocation Policy for Pacific Salmon was shaped by two findings: angling for Chinook and coho is a mainstay of the recreational fishery and Chinook and coho recreational fishing generates greater economic benefit with a lower number of fish than commercial fishing. Thus, the policy gave priority to the recreational fishery over the commercial fishery on the basis that this was the best economic use of the Chinook and coho resource. The priority allocation order is: conservation needs, First Nations priority access for food, social and ceremonial purposes, recreational fishing and commercial fishing.
The allocation policy for pacific salmon was reinforced in a 2001 national policy document called Recreational Fisheries in Canada: An Operational Policy Framework. Citing the best use of the resource as a basis, the national operational policy gives further consideration to priority access for the recreational fishery over the commercial fishery, once conservation objectives then First Nations food, social and ceremonial needs have been met.
EARLY DAYS AND REGULATIONS Accounts of sport fishing in BC date back to the mid 1800' s. In 1924, the Tyee
Club held its first derby, reportedly establishing Campbell River as the Salmon Capital of the World. Across BC, recreational fishing for salmon was effectively unregulated until 1951 and no catch statistics were kept up to that time. In 1951 , a daily bag limit for salmon (the maximum number you could catch in one day) was set to 10 and minimum size restricted to eight inches. The daily bag limit was decreased in 1959 to eight and again in 1963 when it was set at four, while and minimum size was increased to twelve inches. By 1981 the numbers of anglers participating in recreational fishing had increased notably and so had the catch. In response, DFO implemented a license requirement, decreased the daily bag limit for Chinook salmon to two and increased the minimum size to 18 inches. Over the years, bag limits and minimum size have become part of an increasingly complex set of regulations that are used to manage the recreational fishery. Today, daily bag limits and minimum size regulations differ by species and area. Along with seasonal closures, area closures and gear restrictions, these tools allow DFO to manage stocks in response to local conditions. While offering site-specific management, the complexity of regulations sometimes acts as a deterrent to anglers who prefer not to risk contravening the law because they are uncertain about the regulations.
SHAPING POLICY The recreational fishing community in BC has traditionally been active, well
organized and successful in exerting influence over fishing policy and regulation. In particular, the community has been influential in having recreational fishing recognized as a legitimate entity and strong economic driver in the province.
A number of key studies and inquiries have supported this position including the 1982 Pearse Royal Commission, which recognized that the value of the recreational fishery was equal to that of the commercial fishery. The study led DFO to create a recreational
148
..
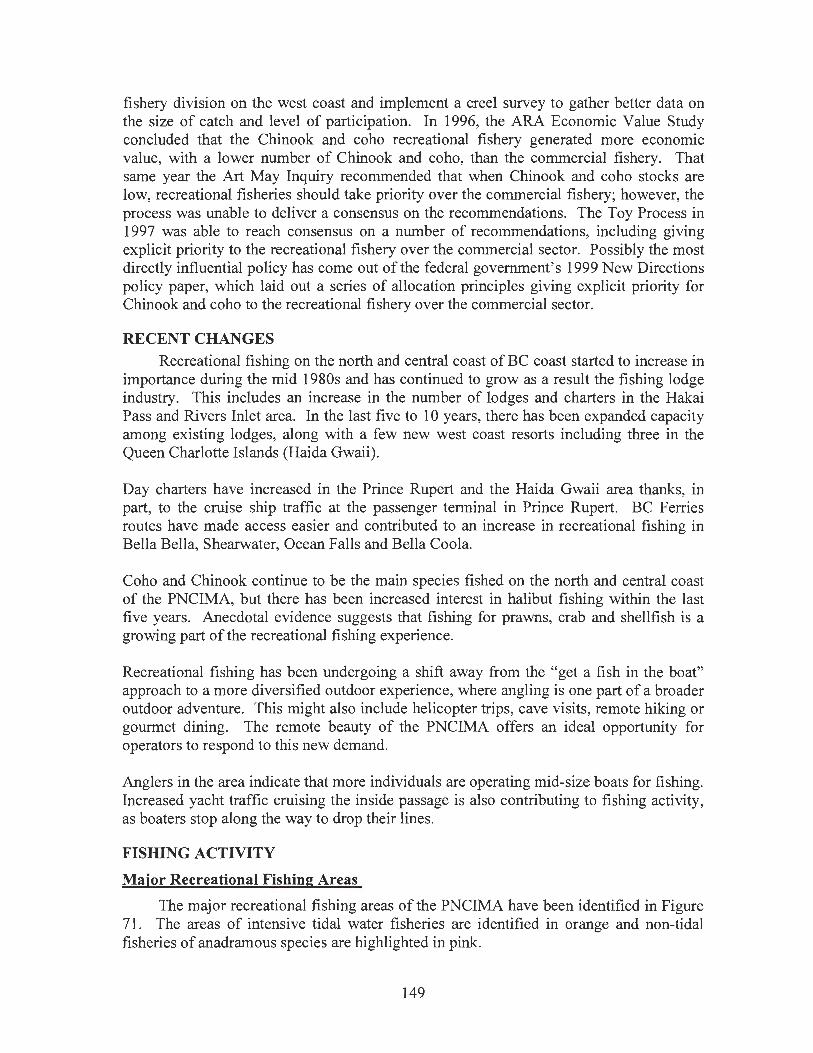
..
fishery division on the west coast and implement a creel survey to gather better data on the size of catch and level of participation. In 1996, the ARA Economic Value Study concluded that the Chinook and coho recreational fishery generated more economic value, with a lower number of Chinook and coho, than the commercial fishery. That same year the Art May Inquiry recommended that when Chinook and coho stocks are low, recreational fisheries should take priority over the commercial fishery; however, the process was unable to deliver a consensus on the recommendations. The Toy Process in 1997 was able to reach consensus on a number of recommendations, including giving explicit priority to the recreational fishery over the commercial sector. Possibly the most directly influential policy has come out of the federal government's 1999 New Directions policy paper, which laid out a series of allocation principles giving explicit priority for Chinook and coho to the recreational fishery over the commercial sector.
RECENT CHANGES Recreational fishing on the north and central coast of BC coast started to increase in
importance during the mid 1980s and has continued to grow as a result the fishing lodge industry. This includes an increase in the number of lodges and charters in the Hakai Pass and Rivers Inlet area. In the last five to 10 years, there has been expanded capacity among existing lodges, along with a few new west coast resorts including three in the Queen Charlotte Islands (Haida Gwaii).
Day charters have increased in the Prince Rupert and the Haida Gwaii area thanks, in part, to the cruise ship traffic at the passenger terminal in Prince Rupert. BC Ferries routes have made access easier and contributed to an increase in recreational fishing in Bella Bella, Shearwater, Ocean Falls and Bella Coola.
Coho and Chinook continue to be the main species fished on the north and central coast of the PNCIMA, but there has been increased interest in halibut fishing within the last five years. Anecdotal evidence suggests that fishing for prawns, crab and shellfish is a growing part of the recreational fishing experience.
Recreational fishing has been undergoing a shift away from the "get a fish in the boat" approach to a more diversified outdoor experience, where angling is one part of a broader outdoor adventure. This might also include helicopter trips, cave visits, remote hiking or gourmet dining. The remote beauty of the PNCIMA offers an ideal opportunity for operators to respond to this new demand.
Anglers in the area indicate that more individuals are operating mid-size boats for fishing. Increased yacht traffic cruising the inside passage is also contributing to fishing activity, as boaters stop along the way to drop their lines.
FISHING ACTIVITY
Major Recreational Fishing Areas
The major recreational fishing areas of the PNCIMA have been identified in Figure 71. The areas of intensive tidal water fisheries are identified in orange and non-tidal fisheries of anadramous species are highlighted in pink.
149

Major Recreational Fi:shing Areas within PNCIMA • .lii.'JI:iii.-_., 2007
N .J ~
} ·
PACiFIC OCEAN
Sal: wa~er 1 tshtng Area
PNCIMA Boundary
·:):1 .. (1(•;.,· . L/.A!\'{:'O(lVn<
i."ii_/l!t.'[)
1 resh w m e r 1 lshl ng Area
I '" "' ., 2 • • · . "'"· ' • ~ • • , ~ •'
Figure 71: Major Recreational Fishing Areas within PNCIMA
SPECIES AND CATCH LEVELS Chinook and coho are the most common recreational species caught in the
PNCIMA. Between 2003 and 2005, coho represented 41 percent of the average catch and Chinook represented 38 percent. Halibut was the third most abundant species fished in the area (Figure 72).
150
..

..
Catch by Species (2003-os average) North and Central Coast {Areas 1- 10}
• chinook +Coho • other Salmon Rockfish • Halibut • Lingcod
. 3%
Figure 72: Catch by Species 2003 to 2005- North and Central Coast
With the exception of a drop from 2004 to 2005, catch of coho, Chinook and halibut has been increasing since 2000. Figures 73 and 74 illustrate the 10 year trends in catch size by species. The gap in the coho line in Figure 73 represents a closure of the coho fishery 1998 for conservation reasons.
151

10-Year Trend for Salmon North Bt Central Coast (Areas 1-10}
- Chinook - Coho Pink, Sockeye & Chum
120,000 ,------------------------------,
0+---.--,.--,---.--.--.---.--.---.---.-~
1995 1996 1997 1998 1999 2000 2001 2002 2003 2004 2005
Figure 73: Ten Year Trend for Salmon- North and Central Coast
10-Year Trend for Other Species North Bt Central Coast (Areas 1-10}
- Rockfish - Halibut lingcod
60,000 ,-------------------------·------,
50,000 +-------------------------------------------:---------1
20,000
~
10,000 --0
A<., OJ~ p,"\ p,fb OJ~ r::>c$> s:>"' s:>'); ~~ ~~ ~<, -..,0) ~ ~ .._,0) ~ 'V ~ ~ ~ ~
Figure 74: Ten Year Trend for Other Species -North and Central Coast
152
..

. .
The catch statistics reveal a shift in the recreational fishery from the south to the north. Within the past 1 0 years, the number of coho and Chinook caught in Georgia Strait dropped from over 200,000 to under 50,000. With the exception of 2005, coho and Chinook catches in north and central coast area have been increasing since 1998 and reached over 200,000 in 2004. There are also regional differences in the level of participation in recreational fishing, also referred to as effort .
Steelhead is a rainbow trout and, like salmon, it migrates from the ocean to freshwater to spawn. The steelhead fishery is an important component of recreational fishing, and offers a winter and summer fishery, reflecting two different migration periods. These feisty fish are typically caught in non-tidal waters and BC's rivers, such as the Skeena, Nass and Lower Dean River, offer excellent steelhead fishing opportunities.
LICENCES AND TYPICAL ANGLERS About 330,000 recreational fishing licences for tidal anglers were issued across the
province in 2004. License sales reached a peak in 1993 when 454,000 were issued. In 2000, approximately three quarters of BC-resident anglers were male with an average age of 41; female anglers were typically around 31 years of age. The number of juvenile licenses has remained relatively steady over the years, despite fluctuations in adult licence sales, and suggests there is a stable source of potential future anglers.
Anecdotal comments reveal some subtle shifts in the market that participates in recreational fishing. Observations suggest that the "baby-boom" anglers are getting older and demanding a higher-end product, reflecting the demographic shift that is underway. An increasing number of women have participated over the past ten years, and more people from east of the Rockies are coming to BC to fish, in particular from Alberta, but also from Ontario and Quebec. One observer suggested that more multi-generational trips are being made. People appear to be looking for a more diversified experience that includes more than angling alone, for example visits to a Haida Village, hikes and other elements of the North Coast experience.
FACILITIES As of 2006, there are 43 fishing lodges in the PNCIMA (Figure 75) that cater to
recreational anglers. They provide a range of services, from basic to full, including equipment rentals, guided fishing excursions, meals and accommodation, as well as other non-fishing activities such as helicopter tours or guided cave visits. They also vary in the quality of meals and accommodation from low-end to luxury.
153
~;.,.... ~ .. ~-........ -,--,., . .,..~-... ~ ;/;~--.. • ~~"""""'~":,;s: •. -~""'"--
2006 Marine Fishmg Lodges ,~ ..... ,_~, PNCIMA
Pac i fic Ocean
a
130"0'0'\lli
... =-- -·--legend
-::-J watersheds Boundary @ Shore Btl sed Lodges
0 PN CIMABound<lt'y @ IA!ssel B8 se d Lodges
·~:\ Alaska
0 40 80 160 Kilometers I I
Figure 75 : Fishing Lodges within PNCIMA
ECONOMIC VALUE
Notes: ce lnformetion:
B<lsemap and WeterS'leds Boundary O'Aded by OC MiniSI'y of Sustaineble eOOU'ce M8MgemiJ"!t. acitc North Coastlntegated
gement Ma Boundary provided DFO.
The recreational fishery is a significant contributor to the provincial economy. In 2002, tidal sport fishing contributed $550 million to the BC economy. Approximately 300,000 anglers participate in recreational fishing in BC every year, spending money on transportation, food, accommodation, guiding services, equipment and supplies. The industry also generates jobs; for instance, in 2003 about 4,300 jobs across the province
154
' .

represented $82 million in wages and salaries. Lodges and charters represent 35 percent of jobs in the industry. In the Queen Charlotte Islands alone, eighteen fishing lodges provided 425 seasonal field jobs and 95 year round jobs in 2002.
An important element that has influenced fisheries management policy, and given priorities to the recreational fishery, is the economic value of this fishery relative to the number of fish caught. Surveys have shown that while there is importance attached to catching and keeping a salmon, anglers are willing to spend considerable amounts of money in the pursuit of the recreational goal. The value of the recreational sector is not based exclusively on the number of fish in the boat.
MARINE USE ISSUES While catch and angler effort have increased in the PNCIMA, there has been a
dramatic decline in the number of salmon caught by recreational anglers in the Georgia Strait region, where the number of boat trips has also declined.
Ocean survival rates are declining, meaning fewer fish are returning to the streams to reproduce. In the Strait of Georgia, numerous restrictions imposed to protect Chinook, coho, rockfish and lingcod are resulting in anglers moving further north to fish. Considering that the recreational fishery is based primarily on the quality of the experience, reduced opportunity and expectation of a catch could have a serious economic impact and possibly threaten the viability of the recreational fishery.
The impact of salmon farms, the majority of which are located in the PNCIMA, on BC's wild salmon is the focus of considerable debate. The scientific research is inconclusive. Some research indicates that farming places wild salmon stocks at risk, while other evidence suggests that salmon farming is environmentally sustainable. Given the increase in the number of applications for new fish farm sites in the north and west, this issue will continue to be a point of conflict. Industry agencies, such as the Sport Fishing Institute of BC, have called for a cautionary approach by regulatory bodies when approving expanded or new salmon farming activities until more definitive scientific evidence about the impacts is available.
Expansion of the recreational fishing lodges in the PNCIMA is likely to continue, but at a much slower pace than occurred in the 1980s and 1990s. A number of factors will contribute to slower growth rate including tenure and access, First Nations access, conservation measures and resource uncertainty.
Public interest in the state of our environment has increased. In addition, government policies and regulations have come under increasing scrutiny by NGOs, including conservation NGOs with an interest in fish management policies and practices. Government has identified and acted upon the need to make decisions using open and accountable public processes so that they reflect society's values. This is realized through greater multi-stakeholder involvement in decision making processes related to management of the ocean's resources. These processes bring together different and often competing interests to work out mutually acceptable solutions. The practice of catch and release is one example of an issue viewed differently, depending on one's interests. Some animal rights organizations consider catch and release a cruel practice while, at the
155
same time, it is used as a mechanism to conserve and protect weak stocks while allowing fishing of more abundant stocks to take place.
Observers of the recreational fishing sector suggest that the sector will continue to diversify, emphasizing "experience-oriented" fishing. The recreational fishery for prawns, crab and other shellfish is expected to grow, as is the use of more efficient boats. No significant change in the profile of a typical angler is expected, but some suggest that changes will reflect the demographic shift underway.
There are other issues that have the potential to impact the sector in significant ways which are not yet fully known. These include, environmental uncertainty with respect to the state of the oceans; ocean survival rates and potential stock declines; the nature of treaty agreements with First Nations; and other environmental stressors including land development, forestry logging practices and harvesting by the commercial sector.
The recreational fishery for salmon represents approximately three percent of the total salmon catch in BC. Despite this relatively small catch, the sector generates significant economic benefits. The three percent figure disguises the fact that a much higher percent of the total Chinook and coho catch in BC comes from the recreational sector. Between 1991 and 1997, Chinook caught by the recreational sector represented 32.5 percent ofthe total commercial and recreational catch; coho represented 15 percent. These figures illustrate the importance of the two species for the viability of the recreational fishery. To ensure this future viability, it will be necessary to achieve conservation objectives while maintaining opportunities to fish with the expectation of a catch.
156
. .

SHIPPING
Marine transportation of goods, services and people throughout the Pacific Northwest has been occurring for over 5,000 years and remains a vital commercial industry in this region today.
Webster's dictionary defines shipping as the transport of cargo between seaports. Vessels used in this industry include tankers, barges, tugboats, bulk carriers and other vessels designed to transport raw materials or finished products. In many cases, these vessels transit the PNCIMA on their voyage to other ports and do not visit any of the area's ports. The exceptions are those vessels that berth at Prince Rupert, where a deep sea port provides world class facilities and is currently in an expansion phase.
GOVERNANCE The governance of marine transportation, shipping and navigation is primarily
performed by the Federal government with further regulation from provincial, municipal and international institutions. There are some overlapping areas of jurisdiction as well as undetermined areas of responsibility, but most of these issues pertain to ownership of the land and sea in harbours and ports. The federal government, for example, is in the process of divesting certain harbours and wharves to local authorities which involves many issues including environmental liability, maintenance responsibility and wharfinger establishment.
TRANSPORTATION The movement of cargo is referred to as shipping while marine transportation, for
the purposes of this document, refers to the movement of people. Transportation modes include ferries, water taxis, commercial and private boats as well as float planes that use the water for take off and landing purposes. Also included in this category are tour boats that may not transport people between destinations, but do transport people throughout the region for the purposes of sightseeing.
FERRIES The primary provider of passenger and vehicle ferry service in the PNCIMA is BC
Ferries, a no-share capital corporation that holds the single issued voting share of BC Ferry Services Inc. The Ferry Corporation was formed by the Province in 1960 and began with 2 ferries. The fleet now consists of 35 vessels serving 26 routes throughout the province.
Some of the other ferry operators in BC, but not limited to the PNCIMA, include: Black Ball Transport Inc., Victoria Express Passenger Ferry, Vancouver Transit, Victoria San Juan Cruises, Washington State Ferries, Alaska Marine Highway, Victoria Clipper, Victoria Harbour Ferry, Nootka Sound Service, Translink, Alberni Marine Transportation, and Fraser River Marine Transportation. There are also numerous smaller carriers that operate in the study area which are water taxi services that provide scheduled service. The following are some of the businesses that offer water taxi services in the PNCIMA: Lax Kw'alaams Ferry Corp (Port Simpson-Prince Rupert), Prince
157

Rupert Water Taxi, Prince Rupert Adventures, Metlakatla Ferry Service Ltd., Catala Charters Water Taxi and SeeQuest Adventures.
BC Ferries services three main routes in the PNCIMA: Route 10 Port Hardy to Prince Rupert (Figure 76); Route 11 Queen Charlotte Islands to Prince Rupert; and Route 40 Discovery Coast Passage (Port Hardy to Mid-Coast) (Figure 77).
There are two vessels currently servicing these routes: Queen of Prince Rupert and the Queen of Chilliwack. These vessels will not comply with proposed TC regulations by 2010 and are nearing the end of their service lives. BC Ferries is undertaking studies to determine the feasibility of using additional or alternate service providers on these routes, which could result in a private sector operator providing passage in the future (BC Ferries, 2004).
BC Ferries Port Hardy- Prince Rupert
Until recently, the Inside Passage route from Port Hardy to Prince Rupert was being serviced by the Queen of the North. This vessel carried up to 700 passengers and had a car capacity of 115 vehicles. This route is now temporarily being serviced by the Queen of Prince Rupert. While this route is a vital transportation link for vehicles and goods (truck cartage), it is also a popular tourist route. To accommodate tourist interest, the route timing is altered to allow daylight sailing during the summer months which allows travellers to view the scenery while transiting the Inside Passage. The summer sailing time is about 15 hours, and is lengthened to a 20 hour sailing in the winter when it also services those mid-coast locations covered by the Discovery Coast Passage route.
The economic impact of this route was assessed for the year 2001 (Grant Thornton LLP, 2002a). While the corporation had an operating loss of $505,000 for the run, there were significant economic benefits to the communities that it served. Benefits accrued to the communities included direct expenditures ($1.87 million largely on fuel), tourist spending ($6.81 million) and direct employment ($1.17 million). Route 10 operations were reported as having provided 125 direct jobs to the Prince Rupert and Port Hardy communities. The operating loss of this route was offset by income and hotel taxes as well as the Provincial tourism revenue of $44 to $55 million that the tourists spent elsewhere in the Province while on vacation.
BC Ferries Queen Charlotte Islands- Prince Rupert
Route 11, Queen Charlotte Islands to Prince Rupert is serviced by the Queen of Prince Rupert which has capacity for 80 cars and 544 passengers and crew. This run was started in 1980 and is both a year-round commuter and summer tourist service. The BC Ferry commissioned study of the economic viability of this route indicated an operating loss of $2.42 million in the summer seasons of 2001 to 2002 (Grant Thronton LLP, 2002b). However, the Province was estimated to have received tourism revenue of $26 million and 111 full time jobs were generated by ferry passenger spending. The ferry operations provided 1.9 direct full time jobs in the Queen Charlotte Islands and 12.3 full time jobs in Prince Rupert. Direct expenditures by the BC Ferries were an estimated $1.3 million in the area serviced by Route 11.
158
..

. .
..
I '• \
P o d H.an .. h · '-- . Figure 76: BC Ferries Inside Passage and Queen Charlotte Islands Route (BC Ferries)
--
2 0
'"I" ' VE F D S ' iU Ln 1" .1\R t--.
Figure 77: BC Ferries Discovery Coast Route (BC Ferries)
BC Ferries Discovery Coast Passage
The Discovery Coast route serves Port Hardy, McLoughlin Bay, Shearwater, Klemtu, Ocean Falls and Bella Coola during the summer months from June to early September. This route provides passenger service for residents, commercial vehicles, and tourists. The Queen of Chilliwack serves this route with the capacity to carry 115 cars and up to 400 passengers and crew. No economic impact assessment of this route was available.
159

NAVIGATION Navigation is the guidance of ships or airplanes from place to place as well as the
act of determining position, location and course to the aircraft or vessels ' destination. Safe navigation is essential to the protection of equipment, personnel and the environment. The CCG, through Marine Navigation Services (MNS), is responsible for navigation on waters throughout Canada. MNS assumes responsibility for navigational aids, including setting up and maintaining aids such as buoys, lighthouses and radio navigation systems. This helps mariners pinpoint their location and avoid hidden dangers, educating and training mariners to use the system, and advising those who wish to set up private aids to navigation.
MNS also provides an integrated waterways management service in support of marine transportation in Canada. This includes providing minimum safety guidelines relating to the safe utilization of commercial waterways, forecasting water levels and providing information on the channel bottom conditions, including any restrictions, in commercial waterways.
The US government maintains a system of satellites that form the global positioning system (GPS) which is available to anyone with a suitable receiver. The CCG provides corrections to this system through the Differential GPS (DGPS) stations that it maintains in Alert Bay and Sandspit. Any mariner that has a DGPS enabled receiver can make use of this system, at no cost, and benefit from an increase in positioning accuracy from 30 metres to 10 metres, 95 percent ofthe time.
AIDS TO NAVIGATION Aids to navigation are physical structures or services that are placed along the coast
to facilitate the safe and expeditious movement of maritime traffic. The responsibility of installing and maintaining the aids to navigation in Canadian waters belongs to the Navigation Systems branch of the CCG. The program supports construction and maintenance of both public and private aids as well as the dissemination of safety information.
Public aids are commonly used by all marine traffic including fixed aids (lighthouses, beacons, lights), floating aids (buoys), and radio-frequency aids such as DGPS and LORAN C (long range navigation), and are used to determine vessel position through onboard receivers.
There are hundreds of lights, buoys and fog signals in the PNCIMA. These are listed, with their position and characteristics (shape, colour, light flash frequency, etc), in a publication entitled List of Lights, Buoys and Fog Signals that is updated annually by the CCG.
Private aids may include buoys for marinas or ports that are maintained by the owners but are regulated by CCG. The role of CCG is that of providing guidelines and assistance for the installation and operation of private aids.
160
..
..

. .
Safety information, disseminated by radio, internet or printed materials, includes notices to mariners (NOTMAR) which advise of navigational hazards (buoys m1ssmg or displaced, debris such as deadheads, lights that are malfunctioning, etc).
The MCTS of the CCG provide a number of services that manage the movements of vessel traffic in a similar manner to air traffic control. The mission of MCTS is: "To provide communications and traffic services for the marine community and for the benefit of the public at large to: ensure safety of life at sea in response to international agreements; protection of the environment through traffic management; efficient movement of shipping; and information for business and the national interest."
International
The international laws that pertain to shipping and transportation are primarily in existence to provide certainty over sovereignty of waters and resources for states along marine coastlines. The International Maritime Organization (IMO) is an agency of the United Nations which is responsible for the safety and security of international shipping and to prevent marine pollution from ships. This mandate is defined by The Convention of the Law of the Sea (UNCLOS) which was established by the United Nations after years of negotiation. Adopted in 1982, and ratified by 166 member states, UNCLOS came into force November 16, 1994. UNCLOS consists of 320 articles and nine annexes, and governs all aspects of ocean space ranging from delimitation, environmental control, marine scientific research, economic and commercial activities, transfer of technology to the settlement of disputes relating to ocean matters.
The IMO does not provide legislation or regulations to achieve its goals but, rather, member states are responsible for implementation. Canada is an active participant in the IMO and has established many regulations and laws to comply with the international standards. Other mechanisms that are used extensively to implement UNCLOS are Memoranda of Understanding (MOU), whereby member states agree to certain goals and objectives and agree to implement internal legislation to enable and enforce the MOU.
Some ofthe features ofUNCLOS that have relevance to the PNCIMA include: • Canada may exercise sovereignty over the territorial sea which is defined as being
12 miles in breadth. • Foreign vessels are allowed "innocent passage" through the territorial sea (e.g.
ships transiting from Seattle to Alaska). • Canada may regulate navigation of ships and aircraft through straits used for
international passage (the Inside Passage, Hecate Strait). • Canada has a 200 nautical mile exclusive economic zone which includes rights to
natural resources and economic activities, as well as marine science research and environmental protection.
• Canada has sovereign rights over the continental shelf (the national area of the seabed) for exploring and exploiting it.
• Canada is bound to prevent and control marine pollution and is liable for damage caused by violation of their international obligations to combat such pollution.
161

Federal
There are numerous federal government acts and regulations that pertain to shipping, transportation and navigation in Canada. These regulations control most aspects of marine transportation from safety to pollution prevention. In addition to those acts specifically regulating shipping, there are laws which are designed to protect the environment from waste discharge, oil spills and a multitude of toxic substances that may be released from ships in coastal waters.
The Canadian Environmental Assessment Act (CEAA) requires an environmental assessment to be undertaken during the early planning stages of a project whenever a federal authority proposes a project, provides financial assistance or land for a project, or issues certain permits, licences, or approvals to enable a project to proceed. Depending on the size and complexity of the project, and its potential for causing significant or uncertain adverse environmental effects, an environmental assessment may take the form of a screening, comprehensive study, mediation or panel review. Responsible authorities undertake screenings and comprehensive studies, but mediations and panel reviews are independent public reviews. Comprehensive studies must be carried out for projects described in the Comprehensive Study List Regulations. Mediations and panel reviews are conducted where significant adverse environmental effects are likely to occur, where there is uncertainty about the significance of environmental effects or where public concerns warrant such an independent process.
The Navigable Waters Protection Act provides for the prohibition to build works in navigable waters, unless the work, its site and plans have been approved by the Minister of Transport on such terms and conditions as he deems fit.
The Oceans Act promotes the understanding of oceans, their processes and ecosystems, in order to foster sustainable development of the oceans and their resources. Section 31 of the Act gives the Minister of Fisheries and Oceans power to implement integrated management of oceans and marine resources, specifically for the management of estuarine, coastal and marine ecosystems. Regulations are being developed at the current time, which could be potentially applied to proposals involving tidal power. The Oceans Act does not trigger the CEAA.
Provincial
BC has regulations for protecting the environment from a variety of resource development impacts, most of which fall under the Environmental Management Act (EMA). The EMA was brought into force in 2004 and replaced the Waste Management Act and the Environment Management Act.
The Provincial regulations enable management and planning processes within the various government agencies that have jurisdiction over the marine and upland environments in thePNCIMA.
ECONOMIC ACTIVITY
Established economic activities occurring within the PNCIMA include fishing, logging and mining, all of which have been carried out in this area for centuries. Currently tourism and recreation are expanding in geographic and economic terms
162
. .

. .
. .
throughout the area. Future economic development could bring oil and gas extraction, wind and tide energy production and sub-sea mining for minerals and coal bed methane.
In addition to the above activities that are directly related to exploitation of the natural features and resources of the area, other important marine transportation features are those associated with shipping infrastructure. The largest of these in the PNCIMA is the deep sea port at Prince Rupert. Here, goods may be imported from offshore, and commodities such as grain, coal, ore and timber are exported to foreign markets .
The marine transport industry includes ports, shipping, and ship building as sources of revenue and employment (Mitchell, 2003). Between 1988 and 2000 revenues and tonnage (Figure 78) from all these sectors increased, while employment from ports and shipping decreased. Decreases in value of the fishing and government services were offset by increases in transportation, tourism, construction and manufacturing.
Pacific Region MarineTransport Industry
105 200
100 190
180
j ~ 95
~ B
170 ! :E
90
~ :e 160 ,_.
85 150
80 140
75 I I I I I I t---1 I I 130
ffP # # PJ" ~# ~ # ~ ~ # ~ ~ .._OJ .._OJ "' .._OJ "' "' .._OJ "' .._OJ .._<t; "' .._OJ
Year
Figure 78: Summary of Million Tonnes of Cargo Handled and Port Revenue in Pacific Region (Mitchell, 2003)
V esse) Traffic
Vessel traffic in the PNCIMA includes a wide range of ship types in the commercial, fishing and recreational fleets. The orderly flow of vessel traffic is assisted by the CCG through the MCTS which controls the movement of large vessels such as freighters, tankers and cruise ships, as well as fishing vessels and some large yachts through congested waterways. With the exception of the Prince Rupert and Kitimat port facilities, the majority of the large vessel traffic in the PNCIMA is mainly transiting the area on its way from Vancouver or Seattle to Alaska or Asia.
A study of ship movements on the BC coast was performed using MCTS data to determine seasonal trends by ship type (Patrick O'Hara, Institute of Ocean Sciences). MCTS of the CCG monitors ship information such as ship identification, type, size, flag state and the last port state. The next port state is documented along with position,
163

direction and speed approximately every four minutes. Ship location and movement (direction and speed) are estimated and documented using the following methods:
• MAN- Manually plotted vessel route (by ship-operator). • MDR - Manual Dead Reckon, operator graphically draws waypoint route for track
to follow. • FDR - Fixed Dead Reckon, vessel automatically assigned to fixed route based on
call to MCTS operator. • ODR - Offshore Dead Reckon, based on 96/24 hour advance reports submitted by
vessels prior to entering Canadian territorial waters. • RDR - Radar tracked vessel, vessel track linked to radar sensor. • AIS - Universal Automatic Identification system, vessel track linked to GPS
position data via AIS services.
The analysis indicated that the majority of vessel traffic on the BC coast is through the Juan de Fuca Strait and the Strait of Georgia (Figure 79). There is, however, significant vessel traffic through the PNCIMA including the Johnstone Strait, Inside Passage and Hecate Strait. A close inspection ofthe maps indicates that over 3000 vessels equivalents (vessels may travel the route more than once) travel the Inside Passage annually. There are also many additional smaller vessels, such as pleasure craft, which are not included in the data set as they usually do not participate in the MCTS except in distress situations.
Tanker vessel traffic, which includes carriers of liquid gas, petroleum products and vegetable oils, tends to transit outside of the PNCIMA (Figures 80 and 81 ). The exceptions to this are those tankers that are bound for Prince Rupert or Kitimat as destination ports and use an established route through Hecate Strait. Most tanker traffic avoids the PNCIMA because of an industry Code of Practice that has established a voluntary tanker exclusion zone of 50 nautical miles from the coast.
Fishing vessels can be found throughout the PCNIMA, regardless of season (Figures 82 and 83). The high concentration of such vessels in the Johnstone Strait is partially due to the salmon fishery that targets the concentration of fish returning to spawn in tributaries to the Strait of Georgia. Similar concentrations of boats are indicated in Dixon Entrance from Porcher Island and north to the Alaskan boarder for the Northern salmon runs (e.g. those destined for the Nass and Skeena rivers). The data also indicates extensive and significant vessel traffic near ports (Prince Rupert, Kitimat, Port Hardy, Port McNeil and Campbell River), as the fish are brought in for processing and the vessels are refuelled, serviced or moored until the next opening.
Passenger ship traffic includes ferries and cruise liners. There is a strong seasonal trend in the data (Figures 84 and 85) with the greatest use occurring in the summer months. While the Inside Passage is used extensively, Queen Charlotte Sound also has significant passenger vessel traffic in the summer months.
164
. .
. .

. . . · ·-·"'commerciai~Shipping ~ ..... - "·~~- Manne
PNCIMA '-- Use Vessel Densit All Shi T es 2003 Analysts
Briti s h Co l umbia
Communities
0 37.5
Vessel Density - All Ship Types {2003) Cell Size - 5km K 5km
0 • 1-25 • 26- 100 • 101 -500
501 · 1000 • 1001- 3000 • 3001 - 12787
75 150 Kilometers
Br i tish Columb i a
Source lnformatton: BC Basemap provided by BC Ministry of S ustainable ResoUI'"ce Management. Pacific North Coast lntegated Management Area Boundary provided by DFO. Corrmercial Shipping data provided by Conodian Coast Guard.
Projection: BC Albers, NAD 83 Production Date: January 20, 2006 Produced By: OHEB GIS Unit. DFO
Figure 79: Vessel Traffic Density for all Ships in 2003 as Reported by MCTS
165

. -comrnercfai~Silipping ~ Manne PNC IMA --· Use Tanker Vessel Densit Summer 2003 Ana1ys1s
Br iti s h Co l u m bi•
0 PNCIMA Boundary
C.":'• Alaska
0 Communities
0 37.5 75
Tanker Vessel Density - Sum mer 200 Cell Si:z.e - 5km x 5km
0 • 1 • 2- 10 • 11 -50 • 51 - 100 • 101 - 553
150 Kik>meters
Figure 80: Summer Tanker Vessel Traffic in 2003
166
British Co lumbia
Source Information: BC Basemap provided b'{ BC Ministry of Sustainable Resource Management. Pacific North Coast Integrated Management Area Boundary provided by DFO. Commercial Shipping data provided b'{ Canadian Coast Guard.
Projection: BC Albers. NAD 83 Production Date: January 20. 2006 Produced By: OHEB GIS Unit, DFO
..

-·· - comme-rciai:Stlipping "~·-., Mar~ne PNCIMA · · -... use
Tanker Vessel Densit Winter 2003 Analysis
Bdll s h C o lu mbl•
Communities
37.5 75
Tanker Vessel Density • Winter 2003 Celt Stze • 5km x 5km
0 • 1 • 2- 10 • 11 -50 • 51- 100 • 101 - 513
150 KUometers
Figure 81 : Winter Tanker Vessel Traffic in 2003
167
..... ,
British Columbia
Sotxce Information: 8C Basemap provided tf,! 8C Ministry ot Sustainable Resol.Xce Management. PaciHc North Coast Integrated Management Area Boundary provided by DFO. Commercial Shipping data provided by Canadian Coast Guard.
Projection: 8C Albers, NAD 83 Production Date: January 20, 2006 Produced By: OHEB GIS Unit, DFO

·· .. ... .. -·--c "om"1iiiffeiali Stfipping ~........____ Manne PNCIMA . • · · • ...___ use
F1shm Vessel Dens1 Summer 2003 Analysis
8 1 ltl s h Co l u mbia
0 PNCIMA Bounda ry
CJ Alaska
0 Commu nities
37.5 75
Fishing Vessel Density - Summer 200 Call Size - Slim • 5km
0 • 1 • 2- 10 • 11 - 50 - 51 - 100 • 101 - 486
150 Kik>meters
Figure 82: Summer Fishing Industry Vessel Traffic in 2003
168
British Columbia
SOurce Information: 8C Basemap provided by BC Ministry of Sustainable ResolKce Management. Pacifi c North Coast Integrated Management Area Boundary provided by DFO . Commercial Shipping data provided by Canadian Coast Guard.
Projection: 8C Albers, NAD 83 Production Date: Janllary 20. 2006 Produced By: OHEB G IS Unil, DFO
..

-.... .-. -- .. ___,..Commerciar.Stltppfng---._ Manne PNCIMA ' .....__ use
Fishin Vessel Densi Winter 2003 Analysts
Br itis h C ot u m bl•
Communities
37.5 75
Fishing Vessel Density- Winter 2003 C•ll Size - 5km x Skm
0 • 1 • 2- 10 • 11 - 50 • 51 - 100 • 101 -636
150 KilometeJs
Figure 83: Winter Fishing Industry Vessel Traffic in 2003
169
British Columbia
SOtJce Information: 8C Basemap provided by BC Ministry of Sustainable Resou-ce Management. Pacific North Coast Integrated Management Area Boundary provided by DFO. Commercial Shipping data provided by Canadian Coast Guard.
Projection: 8C Albers. NAD 83 Production Date: January 20. 2006 Produced By: OHEB GIS Unit. DFO

·, .... "-.CommerciaiYSnipping ------· Manne PNCIMA · ... ··" --.,.,, Use Passen er Vessel Densi Summer 2003 Analysts
Briti sh Co 1um bia
·-¢-· 0 PNCIMA Boundary Passenger Vessel Density- Sum mer 200
Cell Size - 5km )( 5km <:::- Alaska o
0 Communities
37.5
• 1 • 2- ·1Q
• 11 . 50 • 51 - 100 • 101 -564
75 150 Kilometers
Figure 84: Summer Passenger Vessel Traffic in 2003
170
British Colu m bia
Source Information: BC Basemap provided by BC MinistJY of Sustainable Resource Management. Pacific North Coast lnte!;l'ated Management Area Boundary provided by DFO . Commercial Shipping data provided by Canadian Coas.t Guard .
Projection: BC Albers, NAD 83 Production Date: JanuaJY 20, 2006 Produced By: OHEB GIS Unit, DFO
..

PNCIMA -;~:--=~com'!l£!c_ia iTSnij)ping~ ~=~'"e Passen er Vessel Densit Winter 2003 Analysts
52~:0:,~----- --------
I I
I I
I I
I
l,. ... o:N
I
Briti sh Col um bla
\.~ .. r) '-'·; I
-- ----
- i T··- ---~
i 13;l-q'O'W
i I
-L--13trO'O''W
0 PNCIMA Boundary ~=:~~.g~~~=~·;~,?enslty ·Winter 2003
C::> Alaska o
·0 Communities
37.5 75
• 1 • 2- 10 • 11. 50 • 51 - 100 • 101 - 182
150 Kilometers
Figure 85: Winter Passenger Vessel Traffic in 2003
171
12trO'O"W
~--i
British Columbia
Source Information: BC Basemap provided by BC Ministry of Sustainatje Resource Management. Pacific Nonh Coast Integrated Management Area Boundary provided by DFO . Comrnercial Shipping data provided by Canadian Coast Guard .
Projection: BC Albers. NAD 83 Production Date: January 20, 2006 Produced By: OHEB GIS Unit, DFO

HUMAN USE ISSUES Shipping, transportation and navigation in the PNCIMA have the potential to
impact many ecosystem components through the introduction of pollutants, noise and the disruption of ocean and near shore environments. There may also be conflicts between these activities, such as the potential interruption or displacement of fishing activities due to underwater exploration or development of resources. With increasing attention focussed on the PNCIMA for both wilderness recreation and resource extraction, the potential for competing human use is constantly increasing.
Shipping and transportation have the potential to degrade the marine and near shore environment due to many factors including:
• Noise from motors, blasting and sonar. • Garbage, overboard disposal at sea. • Oil spills and air emissions. • Bilge oil, accidental or purposeful release. • Other contaminants and heavy metals from ship repair. • Whale watching resulting in marine mammal disturbance. • Dredging of harbours resulting in habitat loss or disruption. • Development resulting in alienation of foreshore habitat. • Wake impacts on marine vegetation.
172

ACKNOWLEDGEMENTS
The authors would like to thank the following contractors and DFO staff for providing their research services to help create this technical report: Alternate Energy; Karen Barry DFO; Aquaculture, Roxanne Paul University of Victoria; Commercial fisheries, Sean MacConnachie, Stacey Verrin, & Duncan Johannessen DFO; Recreational Fisheries, Deane Strongitharm & Jennifer Hill CitySpaces Consulting; Conservation Areas, Roxanne Paul University of Victoria; Cruise ship Industry, Erin Welk Simon Fraser University; Shipping and transportation, Steve Gormican Gormican Environmental Services; Ports, Elmar Plate FiEdCo Consulting; Defense and Security Erika Rolston Prince Rupert and Joy Hillier DFO; Mining and Minerals Roxanne Paul & Duncan Johannessen University of Victoria; Oil and Gas exploration Torge Shuemann University of Victoria; Forestry, Tammy Norgard Blue Revolution Consulting Group; and Angela Mahoubi True North Consulting for editorial services. Special thanks to Jack Mathias, Melody Farrel, Mark Reagan; Kelly Francis, Bill Shaw, Joy Hillier, Kevin Conley, Glen Rasmussen, Dale Gueret, Denise Zinn, Greg Malette, Joy Hillier, Nicole Pellegrin, Barbara Lucas, Leslie Barton, Norm Olson, Kate Rutherford, Peter Midgley, Dwight McCullough, Aiden Ryan and Dana Haggerty for their help advice, direction, comments and valuable reviews. Any errors or omissions in this report are the responsibility of the authors.
173

REFERENCES
Adams, C. 2004. Personal Communication. Harbours and Ports Program Branch Vancouver, Transport Canada.
Alldrick, D. 2004. Intrusion-Related AU-(AG-CU) Phyrrhotite Veins. BC Ministry of Energy and Mines. Accessed November 30,2004 from www.em.gov. bc.ca/Mining/Geolsurv/MetallicMinerals/depmodeV3-auvein.htm.
Ash, C.H., Reynolds, P.H., and Macdonald, R.W.J. 2004. Mesothermal Gold-Quartz Vein Deposits in BC Oceanic Terranes. BC Ministry of Energy and Mines. Accessed November 30,2004 from www.em.gov.bc.ca/Mining/Geolsurv/MetallicMinerals/depmodel/3-auvein.HTM#O.
BC Environmental Assessment Office. Victoria. Aquaculture Review Final Report (1997).
BC Ferries, 2004. Additional or Alternate Service Providers Plan- First Performance Term. Online document found at: www.bcferries.com/about/More_Information.html#more, Accessed August 22, 2005.
BC Government. 2004. Forestry Revitalizing Our Number-One Sector. Accessed February 4, 2005 from http://www.gov.bc.ca/bcgov/content/docs/forestry.pdf
BC Ministry of Agriculture, Food and Fisheries. 2004. Accessed October 1, 2004 from http:/ /www.agf. gov. bc.ca!fisheries/
BC Ministry of Agriculture, Food and Fisheries. 2004. Aquaculture and Commercial Fisheries Licensing Policy and Procedures Manual. Licensing and Compliance Branch.
BC Ministry of Agriculture, Food and Fisheries. 2004. Finfish Hatchery Sites. Accessed October 14, 2004 from http://www.agf.gov.bc.ca!fisheries/FF _Hatcheries.
BC Ministry of Agriculture, Food and Fisheries. 2004. Harvest of Marine Plants in BC 2004. Accessed October 20, 2004 from http://www .agf. gov. bc.ca!fisheries/ commercial/commercial_ mp.htm.
BC Ministry of Agriculture, Food and Fisheries. 2004. Shellfish Aquaculture. Accessed October 18, 2004 from http://www .agf. gov. bc.ca!fisheries/Shellfish!shellfish _ main.htm
BC Ministry of Agriculture, Food and Fisheries. 2004. Marine Salmon Farm Sites. Accessed October 7, 2004 from http:/ /www.agf.gov .bc.ca!fisheries/MFF _Sites_ Current.htm
174

BC Ministry of Energy and Mines 2004. BC Ministry of Energy and Mines Home Site. Accessed November 24, 2004 from www.em.gov.bc.ca/mining/default.htm.
BC Ministry of Energy and Mines. 2004. BC Mines Directory. Open File 2003-1. BC Ministry of Energy and Mines Home Site. Accessed November 26,2004 from www.em.gov.bc.ca/Mining/Geolsurv/General/minedir/minedir02.pdf.
BC Ministry of Energy and Mines. 2004. BC Mines Directory. Open File Province of BC. Accessed November 26 2004 from www.em.gov.bc.ca/Mining/Geolsurv/General/minedir/minedirOO.pdf.
BC Ministry of Energy and Mines. 2004. Construction Aggregates Resource and Stakeholders. Accessed November 30, 2004 from http:/ /www.em.gov .bc.ca/Mining/MiningStats/55stakeholdconagg.htm.
BC Ministry of Energy and Mines. 2004. MINFILE Capsule Geology and Bibliography. Accessed November 26 2004 from www.em.gov.bc.ca/cf/minfile/search/search.cfm?mode=capbibandminfilno=1 03P+ +257.
BC Ministry of Forests. 2004. Defined Forest Area Management. Accessed February 4, 2005 from http://www.for.gov.bc.calhfp/dfam.
BC Ministry of Forests. The Timber Tenure System (Appendix 1). Accessed February 4, 2005 from http:/ /www.for.gov .bc.ca/hth/timtenlpub.htm.
BC Ministry of Water, Land and Air Protection. 2004. BC Farmed Shellfish Production 1991-2002. Accessed October 18,2004 from http://www.agf.gov.bc.ca/fish_stats/Graphs/FS'fish91-02.gif.
BC Ministry of Water, Land and Air Protection. 2004. BC Farmed Shellfish Wholesale Value 2002. Accessed October 18, 2004 from http://www.agf.gov.bc.ca/fish_stats/Graphs/FS'fish_ W'sale_Share2002.gif.
BC Ministry of Water, Land and Air Protection. 2004. BC Parks Conservation-Ecological Reserves. Province ofBC. Victoria. Queen's Printer.
BC Ministry of Water, Land and Air Protection. 2004. BC Shellfish Aquaculture Code of Practice-Final Submission.
BC Ministry of Water, Land and Air Protection. 2004. Conservation Lands. Province of BC. Victoria. Queen's Printer.
175

BC Ministry of Water, Land and Air Protection. 2004. Deliberations ofthe Scientific Advisory Group on Aquaculture Waste Regulation. Power Point Presentation. Accessed October 6, 2004 from http://wlapwww.gov.bc.ca/epd/epdpa/industrial_ waste/agriculture/sag/feb 13 _ 02 _sa g_present. pdf.
BC Ministry of Water, Land and Air Protection. 2004. Development of Provincial Code of Practice for the BC Shellfish Aquaculture Industry. Accessed October 18, 2004 from http://www.agf.gov.bc.ca/fisheries/Shellfish/cop.htm.
BC Ministry of Water, Land and Air Protection. 2004. Fisheries and Aquaculture Division. Accessed October 4, 2004 from http://www.agf.gov.bc.ca/fisheries/siting_reloc/what.htm.
BC Ministry of Water, Land and Air Protection. 2004. New Species. Province ofBC. Accessed October 1, 2004 from http://www.agf.gov.bc.ca/fisheries/newspecies_marine.htm.
BC Ministry of Water, Land and Air Protection. 2004. Shellfish Aquaculture in BC. Accessed October 18, 2004 from http://www.agf.gov.bc.ca/fish_stats/aquashellfish.htm.
BC Ministry of Water, Land and Air Protection. 2004. Summary of Park and Protected Area Designations. Province of BC. Queen's Printer.
BC Outreach Network. 2004. Accessed February 4, 2005 from http://www.bcforestinformation.com/.
BC Outreach Network. 2004. BC Coast Report. Accessed February 4, 2005 from http://www.bcforestinformation.com/PDFs/FSA-012-E.pdf.
BC Outreach Network. 2004a. BC Forests are a Global Treasure. Accessed February 4, 2005 from http://www.bcforestinformation.com/PDFs/FSA-021-E.pdf.
BC Outreach Network. 2004b. Harvesting Methods in BC. Accessed February 4, 2005 from http://www.bcforestinformation.com/PDFs/FSA-032-E.pdf.
BC Outreach Network. 2004c. Update on BC's Forest and Range Practices Act. Accessed February 4, 2005 from http://www.bcforestinformation.com/PDFs/FSA-024-E.pdf.
BREA 2004. Contribution of the International Cruise industry to the Canadian Economy in 2003.
Barrie, V., Conway, K., Lowe, C., Josenhans, H., and Pickrill, D. (1990). Regional Mapping and Ocean Management of Queen Charlotte Basin. Abstract.
176
..

Bartosh, G. 2001. Fish Stocks ofthe Pacific Coast. Fish Stocks. (23/397). http://www.comm.pac.dfo-mpo.gc.ca/publications/speciesbook/default.html.
Blake, C., and Graydon, L.L.P. 2004. Blakes Bulletin on Environmental Law. Blakes. Environmental Law Group. Vancouver. Blake, Cassels and Graydon LLP. Accessed November 12,2004 from http://www.blakes.com/english/publications/belb/May04/EnvBC0504.pdf
Bonnet, T., and Hardy, S. 2003. Commercial Groundfish Fishery. Fisheries and Oceans Canada. http:/ /pacpbsgfdb/sq 1/BCIT _Presentation/ groundfishPresd2k _ files/frame.htm.
Boutillier, J., and Bond, J.A. 1999. A Progress Report on the Control of Growth and Recruitment Over-fishing in the Shrimp trap Fishery in BC. Canadian Stock Assessment Document (99/202).
BC, Seafood Sector and Tidal Water Recreational Fishing: A Strengths, Weaknesses, Opportunities, and Threats Assessment. http://srmwww.gov.bc.calcr/qcilreports.htm, Accessed September 22, 2005.
Bustin, R.M. 1997. Petroleum Source Rocks, Organic Maturation and Thermal History of the Queen Charlotte Basin, BC. Bulletin of Canadian Petroleum Geology, v. 45(3), p. 255-278.
Bustin, R.M., and Mastalerz, M. 1995. Organic Petrology and Geochemistry of OrganicRich Rocks of the Late Triassic and Early Jurassic Sandilands and Ghost Creek Formations, Queen Charlotte Islands, BC. Marine and Petroleum Geology, v. 12, p. 70-81.
Butler, T.H. 1984. Dungeness Crab. Underwater World. Fisheries and Oceans Canada. 4 p.
CCSG Associates. 2004. Financial Options for the Remediation of Mine Sites: A Preliminary Study. Mining Watch Canada. Ottawa, Ca. Accessed November 26 2004 from www .miningwatch.ca/ documents/financial_ options _paper. pdf.
Cameron, B.E.B., and Tipper, H.W. 1985. Jurassic Stratigraphy of the Queen Charlotte Islands, Queen Charlotte Islands, BC. Geological Survey of Canada. Bulletin, 365, 49pp.
Canadian Coast Guard. 2005. Pacific Coast List of Lights, Buoys and Fog Signals. Hydrographic Chart Distribution Office, Fisheries and Oceans Canada. Available at Canadian Hydrographic Service Chart Dealers. http://www .notmar .gc.ca/ go .document?doc=eng/ services/list/pacific_ coast_ e.
Canadian Coast Guard: Marine Programs National Performance Report for 2003-2004. http://www .ccg -gee. gc.ca/mp-pm/ docs/0 3-04/pr/toc _ e.htm.
177

Canessa, R.R., Conley, K.W., and Smiley, B.D. 2004. Bowie Seamount Pilot Marine Protected Area: An Ecosystem Overview Report. Can. Tech. Rep. Fish. Aquat. Sci. 2461: 26 p. Science Branch. Fisheries and Oceans Canada.
Clover Point Cartographies Ltd. 2004. Forest and Fisheries Tourism Opportunities Study for the North Coast Forest District.
Coast Information Team. 2004. Ecosystem-Based Management Planning Handbook. Accessed February 4, 2005 from http://www.citbc.org/c-ebm-hdbk-fin-22mar04.pdf.
Coast Information Team. 2004. Economic Gain Spatial Analysis Tourism Report.
Constantineau, B. 2004. Prince Rupert Adds More Cruise Ships. The Vancouver Sun, Wednesday May 4, 2005, pp D6.
D.P.H. 2004. District of Port Hardy Strategic Plan 2002-2007.
David Suzuki Foundation. 2004. Canada Rainforest: Status Report. Accessed February 4, 2005 from www.canadianrainforests.org
Dearden, Philip. 2004. Marine Conservation. In: BC, the Pacific Province: Geographical Essays. Ed. By Colin J.B. Wood. Canadian Western Geographical Series: 36. Western Geographical Press.
Department of Justice, Canada. 2004. Navigable Waters Protection Act .. R.S. 1985, c. N-22.
Department of Justice Canada. 2004. c. 18. Canada National Marine Conservation Act. Government of Canada. Accessed November 8, 2004 from http://laws.justice.gc.ca/en/C-7 .3/.
Department of Justice Canada. (1996). c. 31. Ocean's Act. Government of Canada Accessed November 8, 2004 from http://laws.justice.gc.ca/en/0-2.4/.
Department of Justice Canada. (1994). c. 22. Migratory Birds Convention Act. Government of Canada. Accessed November 16, 2004 from http://laws.justice.gc.ca/en/M-7 .01/
Desbarats, A.J. 2004. Temporal Analysis of the Flow Rate and Chemistry of Discharge Waters From 8-Level, Lynx Mine, Myra Falls Operations, Vancouver Island, Canada. Presented at the Denver Annual Meeting of the Geological Society of America, 2002.
178
. .
. -

Dietrich, J.R., Higgs, R., Rohr, K.M., and White, J.M. 1993. The Tertiary Queen Charlotte Basin: A Strike-Slip Basin on the Western Canadian Continental Margin. In: Tectonic Controls and Signatures in Sedimentary Successions, L. Frostick and R. Steel (ed.). Special Publication Number 20, Intenational Association of Sedimentologists, p. 161-169.
Dietrich, J.R. 1995. Petroleum Resource Potential ofthe Queen Charlotte Basin and Environs, West Coast Canada. Bulletin of Canadian Petroleum Geology, v. 43(1), p. 20-34.
Dobson, S. et al. 2004. A Primer on the Canadian Cruise Industry.
Dovetail Consulting Inc. 2004. Input from the Community Workshops on the Draft Sea Otter Recovery Action Plan.
Dunsmuir, Mollie. 28 March 2004. Bill C-1 0: An Act Respecting the National Marine Conservation Areas of Canada. Legislative Summaries. Parliamentary Information and Research Services. Parliamentary Research Branch-Law and Government Division. Library of Parliament Canada.
Enemark, G. 2004. Central Coast Land and Coastal Resource Management Plan SocioEconomic and Environmental/Marine Base Case: Final Report Part 1 SocioEconomic. Economics Branch, Ministry of Employment and Investment. Accessed November 18, 2005 from http://srmwww.gov.bc.ca!cr/resource_mgmtllrmp/cencoastlreports/techrep.htm.
Environment Canada. 2004. Canadian Shellfish Sanitation Program. Accessed October 21, 2004 from http:/ /atlenv.ns.ec.gc.ca!epb/sfish/cssp.html.
EC- CWS. 2004. Habitat Conservation: Environment Canada's Protected Areas Network: Marine Wildlife Areas. Accessed November 12,2004 from http://www.cwsscf.ec.gc.ca/habitatlmwa _ e.cfm.
Fisheries and Oceans Canada. 2001. Results of the Queen Charlotte Sound Shrimp Survey. Shrimp Survey Bulletin. (01-02).
Fisheries and Oceans Canada. 2002. Aquaculture Regulation Provision. BC Regulation 78/2002. O.C. 283/2002. Fisheries Act. (RSBC, 1996). Victoria. Queen's Printer.
Fisheries and Oceans Canada. 2002. Groundfish Hook and Line - Pacific Region. Fisheries Management.
Fisheries and Oceans Canada. 2002. Science Stock Status Report. B6 -01 -B6-05. http://www.dfo-mpo.gc.ca/csas/Csas/englishlstatus/pelagics.htm.
Fisheries and Oceans Canada. 2004. Finfish Aquaculture Waste Control Regulation. BC Regulation 256/2002, O.C. 836/2002. Waste Management Act. Victoria. Queen's Printer.
179

Fisheries and Oceans Canada. 2004. Fisheries Act. Chapter 149. Victoria. Queen's Printer.
Fisheries and Oceans Canada. 2004. Fisheries and Aquaculture Management. Accessed October 14, 2004 from http:/ /www.dfo-mpo.gc.ca/communic/fish _man/index_ e.htm.
Fisheries and Oceans Canada. 2004. Fisheries and Oceans Canada News ReleaseRockfish Conservation Areas Implemented. Accessed November 9, 2004 from www.pac.dfo-mpo.gc.ca.
Fisheries and Oceans Canada. 2004. Maps and Coordinates of Rockfish Conservation Areas (RCAs). Accessed November 10,2004 from www.pac.dfo-mpo.gc.ca
Fisheries and Oceans Canada. 2004. Rockfish/Lingcod Sustainability Strategy 2004/2005 Workshop Presentation. Fisheries and Oceans Canada. Accessed November 9, 2004 from http:/ /www-comm.pac.dfompo.gc.calpages/consultations/fisheriesmgmt/rockfish/Rockfish%20grande%20Fall %202004%20FINAL %20WEB.pdf.
Fisheries and Oceans Canada. 2004. Sustainable Aquaculture Division. Accessed October 1, 2004 from http:/ /www.dfo-mpo.gc.ca/aquaculture/vision _ e.htm.
Fisheries and Oceans Canada. 2004. Toward an Inshore Rockfish Conservation Plan- A Structured for Continued Consultation. Accessed November 9, 2004 from http://www-comm.pac.dfo.mpo.gc.ca/pages/consultations/fisheriesmgmt/ rockfish/ consultation_ discussiondoc _e. pdf.
Fowler, M.G., Snowdon, L.R., Brooks, P.W., and Hamilton, T.S. 1988. Biomarker Characterization and Hydrous Pyrolysis of Bitumen from Tertiary Volcanics, Queen Charlotte Islands, BC. Organic Geochemistry, v. 13, p. 715-725.
Gislason, G.S. and Associates Ltd. 2004. Beach Shellfish Aquaculture in BC-An Economic Profile. Prepared for the Economic Development Branch -BC Ministry of Sustainable Resource Management.
Gislason, G.S. and Associates Ltd. 2004. BC Seafood Sector and Tidal Water Recreational Fishing- A SWOT Assessment.
Gislason, G.S. and Associates Ltd. 2004. BC Seafood Sector and Tidal Water Recreational Fishing: A SWOT Assessment- The Queen Charlotte Islands Fishing Lodge Industry.
Gislason, G.S. and Associates Ltd. 2004. Saltwater Angling in BC- An Economic Profile.
180
Gislason, G.S. and Associates Ltd. 2004. Saltwater Fishing Lodges in BC- An Economic Profile.
Gislason, G.S. and Associates Ltd. 2004. Saltwater Fishing Charters in BC- An Economic Profile.
Gislason and Associates 2004. The Queen Charlotte Islands Fishing Lodge Industry. Unpublished report prepared for BC Ministry of Agriculture, Food and Fisheries Victoria, BC
Government ofBC. 2005. Economic Development. Treaty Negotiation Office. http:/ /www.gov.bc.ca/tno/popt/background _information.htm.
Government of Canada and Province of BC. 1998. Marine Protected Areas: A Strategy for Canada's Pacific Coast. Discussion Paper. Victoria. Queen's Printer.
Grant Thornton, LLP., 2002a. Preliminary Economic Impact Assessment Route 10: Inside Passage Summer Day Cruise. Accessed November 17, 2005 from www.bcferries.com/about/public _ consult/bcf _pubs/docs/publications/Route _1 0 _ EI A_ Report_ Sept_16.pdf.
Grant Thornton, LLP ,. 2002b. Preliminary Economic Impact Assessment Route 11: Prince Rupert to Skidegate Summer Service. Accessed November 17, 2005 from www. bcferries.com/about/public _ consult/bcf _pubs/docs/publications/Route _11_EI A_ Report_ Sept_16.pdf.
Grant Thornton, 2002. Preliminary Economic Impact Assessment Bella Coola and Port Hardy Service, www.bcferries.com/about/public _ consult/bcf _pubs/docs/publications/Route_ 40 _ EI A _Report_May _ 02.pdf.
Green and Alternative Energy Division. 2004. Executive Report on the Green Energy Study for BC. Phase 1: Vancouver Island. Prepared by: Power Supply Engineering. Prepared for BC Hydro. Report No. PSE389. July 2001. 23pp.
Green and Alternative Energy Division. 2004. Executive Report on the Green Energy Study for BC. Phase 2: Mainland. Prepared by BC Hydro. Report No. E44. October 2002. 36pp.
Gueret, D. 2004. Gwaii Haanas Fisheries-Draft Prepared for Fisheries and Oceans Canada-Habitat Enhancement Branch.
Gustafson ,G.S. and Associates Ltd. 2004. BC Seafood Sector and Tidal Water Recreational Fishing: A Strengths, Weaknesses, Opportunities, and Threats Assessment. Prepared for the BC Ministry of Agriculture, Food and Fisheries.
181

Haggart, J. W. 1991. A Synthesis of Cretaceous Stratigraphy, Queen Charlotte Islands, BC. In: Evolution and Hydrocarbon Potential of the Queen Charlotte Basin, BC,. G. J. Woodsworth (ed.), Geological Survey of Canada, Paper 90-10, p. 253-277.
Haggart, J. W. 2004. The Queen Charlotte Basin. Oilweek, December 1, 2003.
Haggart, J.W., Schroder-Adams, C.J., and Mahoney, J.B. 2004. Geology and Paleontology of Queen Charlotte Islands (Haida Gwaii), BC. Academic Geological Field Trip. September 10-16, 2004.
Haggarty, D.R., McCorquodale, B., Johannessen, K.I., Levings, C.D., and Ross, P.S. 2004. Marine Environmental Quality in the Central Coast ofBC, Canada: A Review of Contaminant Sources, Types and Risks. Can. Tech. Rep. Fish. Aquat. Sci.: 2507.
Hamilton, T. S., and Cameron, B.E.B. 1989. Hydrocarbon occurrences on the Western Margin of the Queen Charlotte Basin. Bulletin of Canadian Petroleum Geology, v. 37(4), p. 443-466.
Hannigan, P.K., Dietrich, J.R., Lee, P.J., and Osadetz, K.G. 1998. Petroleum Resource Potential of Sedimentary Basins on the Pacific Margin of Canada. Geological Survey of Canada Open File 3629: 85 pp.
Hannigan, P.K., Dietrich, J.R., Lee, P.J., and Osadetz, K.G. 2004. Petroleum Resource Potential of Sedimentary Basins on the Pacific Margin of Canada. Geological Survey of Canada Bulletin 564, 74 pp.
Hanson, J., Helvey, M., and Strach, R. (ed.). 2004. Non-Fishing Impacts to Essential Fish Habitat and Recommended Conservation Measures. National Marine Fisheries Service (NOAA Fisheries), Version 1. Southwest Region, Long Beach, CA. Accessed January 31, 2005 from http://swr.nmfs.noaa.gov/EFH-NonGear-master. pdf.
Harbo, R., and Wylie, E.S. 2002. Pacific Commercial Fisheries Updates for Invertebrate Resources (1997). In Harbo, Rand Wylie E.S. (eds). Can. Manuscr. Rep. Fish. Aquat. Sci.: 2418.
Hargreaves, N.B., Ware, D.M., and McFarlane, G.A. 1994. Return of the Pacific Sardine Sardinops sagax) to the BC Coast in 1992. Can. J. Fish. Aquat. Sci. 51:460-463.
Hay, D.E., Harbo, R., Southey, K., Clarke, J.R., Parker, G., and McCarter, P.B. 1999. catch composition of BC Shrimp Trawls and Preliminary Estimates of By-catch with Emphasis on Eulachons. Can. Stock Assess. Secretariat Res. Doc. (99/26).
Hickson, C. J. 1992. The Masset Formation on Graham Island, Queen Charlotte Islands, BC. In: Evolution and Hydrocarbon Potential ofthe Queen Charlotte Basin, BC, G. J. Woodsworth (ed.), Geological Survey of Canada, Paper 90-10, p. 305-324.
182
.. '

Hyndman, R.D., and Hamilton, T.S. 1991. Cenozoic Relative Plate Motions along the Northeastern Pacific Margin and Their Association with Queen Charlotte Area Tectonics and Volcanism. In Evolution and Hydrocarbon Potential ofthe Queen Charlotte Basin, BC, G. J. Woodsworth (ed.), Geological Survey of Canada, Paper 90-10, p. 107-126.
JM Taylor Ltd. 2004. Conventional Cable Logging - An Economic Profile. Accessed February 4, 2005 from http://srmwww.gov.bc.ca/rmdlecdev/docs/BBConvLogging.pdf.
Jamieson, G.S., and Lessard, J. 2004. Marine Protected Areas and Fishery Closures in BC. Can. Spec. Pub. Fish. Aquat. Sci. 131 :i-x; 1-414.
Johnson, J. 2003. A Review of: Economic Gain Spatial Analysis- Tourism. Pacific Analytics.
Kearney, P. 1996. The New Penguin Dictionary of Geology. Penguin Group: London, UK.
Keller, L. 2005. Opportunities on the Horizon. Community Futures Prince Rupert. March 23,2005.
Kristiansen, G., and Strongitharm, D. 2006. The Evolution of Recreational Salmon Fisheries in BC: Report to the Pacific Fisheries Resource Conservation Council.
Lien, J. The Conservation Basis for the Regulation of Whale Watching In Canada. Accessed September 22, 2005 from www.dfo-mpo.gc.ca/mammalsmammiferes/J ohn _Lien/Report_ e.htm.
Living Oceans Society. 2004. History of Salmon Farming in BC. Accessed October 15, 2004 from http://www .livingoceans.org/fishfarmslhistory .shtml.
MSRM. 2004. Summary of Current Economic Conditions Haida Gwaii I Queen Charlotte Islands Sustainable Resource Development Branch prepared for: HG/QCI Community Planning Forum November 25, 2004.
McDowell Group, Inc. 2004. Cruise Industry Opportunities Assessment and Gap Analysis.
Marlett, M.L. 2004. Mineral and Energy Resources Analysis Report. North Coast Government Technical Team. Province ofBC.
Malloch, S. 2004. Marine Plant Management and Opportunities in BC. Prepared for BC Fisheries-Sustainable Economic Development Branch.
Matkin, Q.C., Copes, P.M.D., Griffiths, C., and Panek, P. 2004. Economic Gain Spatial Analysis-Fisheries, Ocean Ranching, and Aquaculture-Draft Written for the Coast Information Team (CIT).
183

Mining Association ofBC. 2004. Mining Association Accessed November 26,2004 from www.mining. bc.ca/files/mining_ and_ environment/000026 .html.
Mining Technology. 2004. Myra Falls, Zinc, Copper, Gold and Silver Mine. Accessed November 26,2003 from www.mining-technology.com/projects/myra/.
Ministry of Small Business and Economic Development. 2004. BC Ports Strategy. Government of BC, Access March 2005 from www.gov.bc.ca/sbed/down/bc_ports_strategy_sbed_mar_18_05.pdf.
Mitchell, C. 2004. Ocean Economy- Canada's Ocean Industries: Contribution to the Economy 1988-2000. Prepared for Oceans Sector Department of Fisheries and Oceans.
Morrison, J., Kattikakoski, K., Winther, I., and Boutillier, J. 2002. Prawn Trap Fishery (1996/97).Jn Harbo, Rand Wylie E.S. (eds). Can. Manuscr. Rep. Fish. Aquat. Sci.: 2418.
Murphy, M. 2004. RDMW Regional Harbours Initiative Final Report http://www.rdmw.bc.ca/pdf/2005/Final%20Harbours%20Report%20Revised%202. pdf.
Natural Resources Canada. 2004. BC Mining Facts. Accessed November 26,2004 from http:/ /mmsd 1.mms.nrcan.gc.ca/mmsd/facts/canFact_ e.asp?regionld=9.
Natural Resources Canada. 2004. Mineral Production of Canada, By Province. Accessed November 30,2004 from www.nrcan.gc.ca/mms/efab/mmsd/production/production.htm.
O'Kane, M., Januszewski, S., and Dirom G. 2004. Waste Rock Cover System Field Trials at the Myra Falls Operation- A Summary of Three Years of Performing Monitoring.
O'Kane, M., Mcchaina, D.M., Stoicescu, J., Januszewski, S., Haug, M.D., and Bews, B.E. 1997. Managing for Closure at the Myra Falls Operation-The Design of a Soil Cover System for Long Term Ecological and Physical Stability.
Ocean Renewable Energy Group. 2004 A Proposal for a Collaborative Research and Development Program for Enabling Renewable Ocean Energy Delivery in BC and Canada. 74pp.
Office of the Commissioner for Aquaculture Development. 2003. Regulation and Support for Aquaculture in Canada. Accessed October 1, 2004 from http://ocad-bcda. gc.ca/ eregulationandsupport.html.
184
. '
,

Pacific Analytics Inc. and Don Harris 2004. Revitalizing BCns Coastal Economy: A New Economic Vision for the North and Central Coast and Haida Gwaii. Accessed February 22, 2005 from www.pacificanalytics.ca/reports/Revtl_BCCoast_Rpt.pdf.
Pacific Fisheries Resource Conservation Council. 2003. Advisory: Wild Salmon and Aquaculture in BC.
Pacific Fisheries Resource Conservation Council. 2003. Annual report 2002-2003.
Pacific Fisheries Resource Conservation Council. 2004. Accessed October 7, 2004 from http://www.fish.bc.ca.
Parks Canada. 2004. National Marine Conservation Areas of Canada. Accessed October 8, 2004 from: http://www. pc.gc.ca/progs/amnc-nmca!intro/index _ e.asp
Pearce, S. 2004. Future Trends in Cruise, Cruise BC Conference, April14-15, 2005.
Penfold et al. 2004. A Regional Economic Development Strategy for the Regional District of Mount Waddington. Qu'West Consulting Services.
Perry, I.R., Waddell, B.J., and Zhang, Z. 2001. Assessment of Green Sea Urchin (Strongylocentrotus droebachiensis) Stocks in BC, 2001. Can. Sci. Advisory Secretariat Res. Doc. 2001/37.
Perry, I.R., Zhang, Z., and Harbo, R. 2002. Development of Green Sea Urchin (Strongylocentrotus droebachiensis) Fishery in BC, Canada- Back From the Brink Using a Precautionary Framework. Fish. Res. 55: 253-266.
Pierce Lefebvre Consulting and Stuart Gale and Associates. 2004. Marine Ecotouism Marine Cruising Operators. For Economic Development Branch, BC Ministry of Sustainable Resource Management.
Pinsent, R., and Pardoe, J. 2004. Mineral Resources of the North Coast Region. North Coast LRMP. BC Ministry of Energy and Mines.
Port Seattle. Number of Vessel Calls at Port of Seattle Facilities http://www. portseattle.org/ seaport/statistics/vesselcalls.shtml#type.
Port Vancouver. 2004. Statistics Overview http://www.portvancouver.com/statistics/2004_statistical.html.
Prescott-Allen, R. 2004. CIT EGSA Tourism Interim Report to CCLRMP. Coast Information Team, University ofBC, 23 July 2003.
Pricewaterhouse Coopers. 2003. A Competitive Survey of the BC Salmon Farming Industry. Prepared for BC Ministry of Agriculture, Food and Fisheries as quoted in Eric Vance and Associates and Vann Struth Consulting Group Inc. May 2004.
185

Prince Rupert Port Authority. 2004. The 2005 Prince Rupert Cruise Ship Schedule.
Prince Rupert Port Authority. (2005). The New World Port Community Update: A News Report from the Prince Rupert Port.
Province of BC. 2004. Ecological Reserves Act. (RSBC 1996) Chapter 103. Victoria. Queen's Printer.
Province ofBC. 2004. BC Parks Act (RSBC 1996) Chapter 344. Victoria. Queen's Printer.
Ray, R., and Williams, P. 2004. Potential Spatial and Management Implications of Cruise Ship Passenger Activity on the Development of the North Coast LRMP. Prepared for the Ministry of Sustainable Development. Center for tourism Policy and Research Simon Fraser University.
Rohr, K.M.M., and Dietrich, J. 1990. Deep Seismic Survey of Queen Charlotte Basin, Geological Survey of Canada Open File Report 2258.
Rohr, K.M.M., and Dietrich, J. R. 1992. Strike-Slip Tectonics and Development ofthe Tertiary Queen Charlotte Basin, Offshore Western Canada: Evidence from Seismic Reflection Data. Basin Research, v. 4, p. 1-19.
Shell Canada Ltd. 1968a. Well History Report, Shell Anglo South Coho I-74; Canada Department of Energy, Mines and Resources, Open File.
Shell Canada Ltd. 1968b. Well History Report, Shell Anglo Tyee N-39; Canada Department of Energy, Mines and Resources, Open File.
Shell Canada Ltd. 1968c. Well History Report, Shell Anglo Sockeye B-10; Canada Department of Energy, Mines and Resources, Open File.
Shell Canada Ltd. 1968d. Well History Report, Shell Anglo Sockeye E-66; Canada Department of Energy, Mines and Resources, Open File.
Shell Canada Ltd. 1968e. Well History Report, Shell Anglo Murrelet L-15; Canada Department of Energy, Mines and Resources, Open File.
Shell Canada Ltd. 1968f. Well History Report, Shell Anglo Auklet G-41; Canada Department of Energy, Mines and Resources, Open File.
Shell Canada Ltd. 1968g. Well History Report, Shell Anglo Harlequin D-86; Canada Department of Energy, Mines and Resources, Open File.
Shell Canada Ltd. 1968h. Well History Report, Shell Anglo Osprey D-36; Canada Department of Energy, Mines and Resources, Open File.
186
4 •
•

Sinclair, A. 2002. Groundfish Trawl Fishery in Hecate Strait, Queen Charlotte Sound and West Coast Queen Charlotte Islands. Fisheries and Oceans Canada. http://wwwsci. pac.dfo-mpo.gc.ca/sa-hecate/trawl_ species_ fishery_ distribution_ e.htm
Small Craft Harbours, Fisheries and Oceans Canada 2004. Small Craft Harbours Map, Vancouver Office.
Small, E. 1999. New Crops for Canadian Agriculture. p. 15-20. In: J. Janick (ed) Perspectives on New Crops and New Issues. ASHS Press, Alexandria, VA.
Smyth, R. 2004. BC's Offshore Petroleum. Recent Developments. CSPG Luncheon Talk, November 4, 2004
Snowdon, L.R., Fowler, K.G., Osadetz, K.G., and Obermajer, M. 2004. Organic Geochemical Sources and Shows in the Queen Charlotte Basin and Adjacent Areas ofthe Pacific Margin of Canada. Geological Survey of Canada Open File 4367.
Snowdon, L.R., Fowler, M.G., and Hamilton, T.S. 1988. Sources and seeps: organic geochemical results from the Queen Charlotte Islands. In Some aspects of the petroleum geology of the Queen Charlotte Islands. Canadian Society of Petroleum Geologists, Field Trip Guide, p. 37-43.
Spalding, D., North West Cruise Association. Personal Communication, May 11, 2005.
Statistics Canada. 2004. Aquaculture Facts and Figures. Accessed October 2004 from http://www.statcan.ca/english/survey/business/aqua/facts.htm.
Stevenson, S. 2004. Prince Rupert to Open New Northland Cruise Terminal with Visit by the Norwegian Spirit on Thursday, May 20,2004. Prince Rupert Port: The New World Port.
Suzuki Foundation. 2004. Aquaculture. Accessed October 15, 2004 from http:/ /www.davidsuzuki.org/Oceans/ Aquaculture/ Accessed.
Thompson, R.I., Haggart, J.W., and Lewis, P.D. 1991. Late Triassic Through Early Tertiary evolution of the Queen Charlotte Basin, BC. In: Evolution and Hydrocarbon Potential ofthe Queen Charlotte Basin, BC. G.J. Woodsworth (ed.). Geological Survey of Canada, Paper 90-10, p. 3-29.
Transport Canada. 1995. National Marine Policy, Vancouver Office.
Triton Environmental Consultants Ltd. 2004. An Overview of Water Based Log Handling on the North Coast ofBC. Accessed February 4, 2005 from http:/ /srmwww.gov. bc.ca/ske/lrmp/ncoast/ docs/reports/background/Waterbased _log_ handling_ do. pdf.
Trollope, S. 2002. West Coast Offshore: What Explorers and Producers Need to Move Forward. December 9, 2002.
187

U.S. Department of Agriculture. 1998. Aquaculture Overview PowerPoint Presentation Given at Ladan Swann, Mississippi-Alabama Sea Grant Consortium, Auburn University. National Agricultural Statistics Service. 1998. 1998 Census of Aquaculture, accessed October 14, 2004 http:/ I aquanic.org/images/ slides/ overview. ppt# 1.
Vance, E. and Associates with Vann Struth Consulting Groups. 2004. Ecosystem Overview of the BC Central and North Coast and Queen Charlotte Islands: Human Systems Component Final Report. Fisheries and Oceans Canada.
Victoria Service Centre Ministry of Sustainable Resource Management. 2004. Marine Shellfish and Plant Culture in BC Map. Aquaculture Development Branch. Accessed October 18, 2004 from ftp://gis.luco.gov.bc.ca/pub/coastal/aquaculture
Whitcar, M.J. 2004. BC's Offshore Petroleum: Prospectivity of Queen Charlotte Basin, CSPG Luncheon Talk, November 4, 2004.
Whitcar, M.J. et al. 2004. Analysis of Petroleum Potential in the Queen Charlotte Basin, Phase I and II Reports.
Wirtz, G. 2005a. Cruise BC Creating Cruise Tourism Opportunity for BC's Coastal Communities. BC Tourism Industry Conference, February 24, 2005.
Wirtz, G. 2005b. Overview of Cruise BC Activities. Cruise BC Conference, April14-15 2005. http:/ /www.cruisebc.ca/paconference.html.
Woodsworth, G. J. 1988. Karmutsen Formation and the East Boundary of Wrangellia, Queen Charlotte Basin, BC. In: Current Research Part E, Geological Survey of Canada, Paper 88-1E, p. 209-212.
Woodsworth, G. J. 1991. Neogene to Recent Volcanism along the East Side of Hecate Strait, BC. In Evolution and Hydrocarbon Potential of the Queen Charlotte Basin, BC, G. J. Woodsworth (ed.), Geological Survey of Canada, Paper 90-10, p. 325-335.
Wolf, P. 1992. Recovery ofthe Pacific Sardine and the California Sardine Fishery.
188
4 •
.. .
•