master of commerce in development finance degree alain
TRANSCRIPT

Univers
ity of
Cap
e Tow
n
FOREIGN AID AND ECOOMIC GROWTH IN SOUTH AFRICA
A Dissertation
presented to
Graduate School of Business
University of Cape Town
In partial fulfilment
of the requirements for the
Master of Commerce in Development Finance Degree
Alain Feudjou (FDJALA001)
Supervisors: Prof. NICHOLAS BIEKPE
Dr. WILLIAM G. BRAFU-INSAIDOO

Univers
ity of
Cap
e Tow
n
The copyright of this thesis vests in the author. No quotation from it or information derived from it is to be published without full acknowledgement of the source. The thesis is to be used for private study or non-commercial research purposes only.
Published by the University of Cape Town (UCT) in terms of the non-exclusive license granted to UCT by the author.

Alain Feudjou; FDJALA001 Foreign aid and economic growth in South Africa 1
ABSTRACT
Foreign aid inflows have grown significantly in the post-war period. Many studies have tried to
assess the effectiveness of aid. The role of foreign aid in promoting economic growth has been
the subject of much debate among development specialists, researchers, aid donors as well as
recipients in general and South Africa in particular. In spite of this, there are only few empirical
studies that investigate the relationship between foreign aid and economic growth in South
Africa. This study assesses whether there is any existent relationship between foreign aid and
economic growth in South Africa using descriptive statistics for data that spans from 1994 to
2010.
The result supports the view that there is strong, positive and significant relationship between
foreign aid and economic growth in South Africa. This implies that foreign aid contributes to
economic growth in South Africa.

Alain Feudjou; FDJALA001 Foreign aid and economic growth in South Africa 2
ACKNOWLEDGEMENTS
I would like to express my profound gratitude to my supervisor, Dr. William G. Brafu-Insaidoo
and my co-supervisor Pr. Nicholas Biekpe for their immense contribution in tackling my specific
problems in the course of this work. In a more special way, I owe gratitude to my wife Caroline,
my daughters Wynona and Josepha Feudjou who willingly assisted me morally and emotionally.
These love ones were a constant source of inspiration and encouragement. I acknowledge my
mother Josephine and my sisters Beatrice, Evelyne, Laurette, Michelle and Anita for their
wonderful care and support.

Alain Feudjou; FDJALA001 Foreign aid and economic growth in South Africa 3
TABLE OF CONTENT
ABSTRACT ...............................................................................................................................1
ACKNOWLEDGEMENTS.........................................................................................................2
LIST OF TABLES ......................................................................................................................6
LIST OF FIGURES ....................................................................................................................7
CHAPTER ONE
INTRODUCTION ......................................................................................................................8
1.0 Introduction ...........................................................................................................................8
1.1 The statement of the problem ................................................................................................9
1.2 The purpose of the study .....................................................................................................10
1.3 The significance of the study ...............................................................................................10
1.4 Hypothesis of the study .......................................................................................................10
1.5 Definition of terms ..............................................................................................................10
CHAPTER TWO
LITERATURE REVIEW ..........................................................................................................12
2.0 Introduction .........................................................................................................................12
2.1 The theoretical nexus between aid and economic growth .....................................................12
2.2 Empirical evidence on the nexus between foreign aid and economic growth ........................14
2.3 General summary of literature review ..................................................................................23
CHAPTER THREE
RESEARCH METHODOLOGY...............................................................................................26
3.0 Introduction .........................................................................................................................26
3.1 Background of study area ....................................................................................................26
3.1.1 Economy ..........................................................................................................................28
3.1.2 South Africa latest economic indicators ............................................................................29

Alain Feudjou; FDJALA001 Foreign aid and economic growth in South Africa 4
3.1.3 South Africa economy indicators; five years forecast ........................................................30
3.1.4 Country risk rating............................................................................................................32
3.1.4.1 Sovereign risk ................................................................................................................32
3.1.4.2 Currency risk .................................................................................................................32
3.1.4.3 Banking sector risk ........................................................................................................32
3.1.4.4 Political risk ..................................................................................................................32
3.1.4.5 Economic structure risk .................................................................................................33
3.1.5 South Africa outlook for 2012 – 2016 ...............................................................................33
3.1.5.1 Economic growth; .........................................................................................................33
3.1.5.2 Policy trends ..................................................................................................................34
3.1.5.3 Inflation .........................................................................................................................34
3.1.5.4 Exchange rates...............................................................................................................35
3.1.5.5 External sector ...............................................................................................................35
3.2 Research design and methodology .......................................................................................36
3.3 Research instrumentation.....................................................................................................36
3.4 Variables for data collection and procedure for data analysis ...............................................37
3.4.1 Characteristics of correlation coefficient ...........................................................................38
3.4.2 Scatter Plot and Correlation ..............................................................................................38
CHAPTER FOUR
DATA PRESENTATION AND ANALYSIS ............................................................................40
4.0 Introduction .........................................................................................................................40
4.1 Descriptive analyses ............................................................................................................40
4.1.1 Official Development Assistance (ODA) to South Africa from 1994 to 2010....................40
4.1.2 South Africa Gross Domestic Product (GDP) from 1994 to 2010 ......................................42
4.2 Inference analysis ................................................................................................................46
4.2.1 Introduction ......................................................................................................................46
4.2.2 Hypothesis........................................................................................................................46
CHAPTER FIVE

Alain Feudjou; FDJALA001 Foreign aid and economic growth in South Africa 5
SUMMARY OF FINDING AND RECOMMENDATION ........................................................49
5.0 Introduction .........................................................................................................................49
5.1 Summary of findings ...........................................................................................................49
5.2 Recommendations ...............................................................................................................49
CHAPTER SIX
CONCLUSION .........................................................................................................................52
6.1 Conclusion ..........................................................................................................................52
6.2 Suggestions for further Research .........................................................................................53
REFERENCES .........................................................................................................................54
Alain Feudjou; FDJALA001 Foreign aid and economic growth in South Africa 6
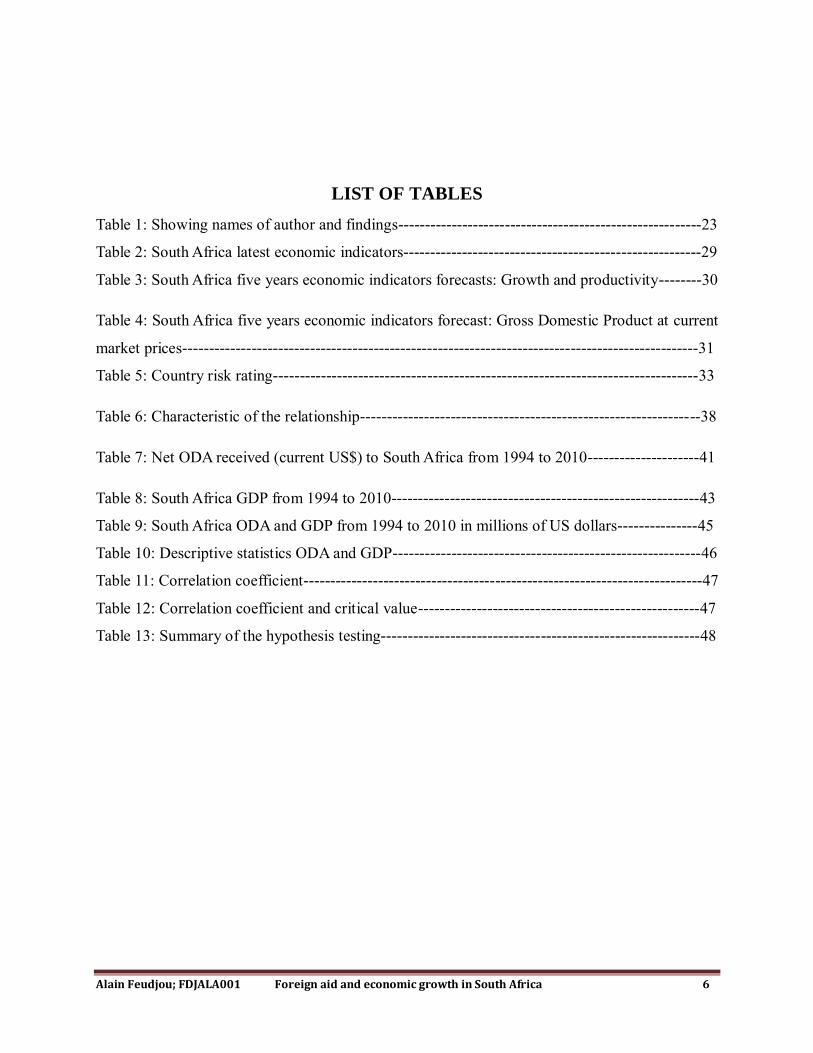
LIST OF TABLES
Table 1: Showing names of author and findings---------------------------------------------------------23
Table 2: South Africa latest economic indicators--------------------------------------------------------29
Table 3: South Africa five years economic indicators forecasts: Growth and productivity--------30
Table 4: South Africa five years economic indicators forecast: Gross Domestic Product at current
market prices-------------------------------------------------------------------------------------------------31
Table 5: Country risk rating--------------------------------------------------------------------------------33
Table 6: Characteristic of the relationship----------------------------------------------------------------38
Table 7: Net ODA received (current US$) to South Africa from 1994 to 2010---------------------41
Table 8: South Africa GDP from 1994 to 2010----------------------------------------------------------43
Table 9: South Africa ODA and GDP from 1994 to 2010 in millions of US dollars---------------45
Table 10: Descriptive statistics ODA and GDP----------------------------------------------------------46
Table 11: Correlation coefficient---------------------------------------------------------------------------47
Table 12: Correlation coefficient and critical value-----------------------------------------------------47
Table 13: Summary of the hypothesis testing------------------------------------------------------------48

Alain Feudjou; FDJALA001 Foreign aid and economic growth in South Africa 7
LIST OF FIGURES
Figure 1: Scatter plot----------------------------------------------------------------------------------------39
Figure 2: Net ODA to SA from 1994 to 2010------------------------------------------------------------42
Figure 3: South Africa GDP from 1994 to 2010 --------------------------------------------------------44

Alain Feudjou; FDJALA001 Foreign aid and economic growth in South Africa 8
CHAPTER ONE
INTRODUCTION
1.0 Introduction
An important objective of most official development assistance to developing countries is the
promotion of economic growth. Over the last half century, foreign aid has emerged as a dominant
strategy for alleviating poverty in the third world. Not coincidentally, during this time period
major international institutions, such as the United Nations, World Bank, and International
Monetary Fund gained prominence in global economic affairs (Ekanayake, 2009). Yet it seems
that sixty years later, the lesser-developed countries (LDCs) of the world continue to suffer from
economic deprivation raising questions of whether foreign aid is a worthwhile and effective
approach to boosting growth and development in recipient economies. Research on the subject
has attempted to draw an empirical connection between foreign aid and economic growth.
Despite these efforts, however, there is no solid consensus among scholars on the actual
effectiveness of foreign aid inflows.
The term “foreign aid” can imply a number of different activities, ranging from humanitarian
support in the wake of natural disasters to military assistance and arms donations (Ouattara,
2003). For the purposes of this analysis, however, I refer to the standard definition of “Official
Development Assistance,” or aid that is aimed at increasing economic growth. Critics of
development assistance cite a variety of reasons why it is a poor strategy for combating global
poverty. Collier and Dollar (2002) argue that it can breed corruption, weaken accountability, and
cause government to become excessively large. Nonetheless, as researchers Hansen and Tarp
(2001) state that it is neither analytically defensible nor empirically credible to argue from the
outset that aid never works. Indeed, a number of studies have shown a positive relationship
between foreign aid and economic growth, especially in countries that have responsible
economic policies regarding trade, inflation, and other macroeconomic concerns (Cameroon,
Nigeria, Senegal…).

Alain Feudjou; FDJALA001 Foreign aid and economic growth in South Africa 9
Since the 1990s, the amount of Foreign Aid to South Africa has been increasing, but there are
controversial arguments on whether this official development assistance translates to economic
growth. This research discusses in a straightforward manner the impact of aid on economic
growth in South Africa.
The rest of the work is organized as follows: Chapter two is the literature review, chapter three
constitute the research methodology, chapter four is the data presentation and analyses, chapter
five summary of findings and recommendations and lastly chapter six conclusions.
1.1 The statement of the problem
Official Development Assistance (ODA) is given to South Africa (SA) by governments of
developed nations, international aid agencies and through multilateral institutions such as the
World Bank. Individuals through development charities such as Action Aid, Caritas, Care
International or Oxfam also give ODA to SA in order to create long-term sustainable economic
growth. The pursuit of long-term sustainable economic growth is associated with concomitant
improvements in foreign aid inflows. However, the link between growth and foreign aid is not
always obvious.
Since its transition to democracy in 1994, South Africa has generally experienced economic
growth; the domestic outlook remains positive, strengths in the domestic economy help to sustain
growth. Household spending remains robust, private-sector investment is gradually rising and
interest rates are low. There are encouraging signs of employment growth in the formal sector.
South Africa’s banks are well capitalized. High levels of corporate saving are expected to enable
increased investment spending as global uncertainty eases and business confidence strengthens.
Fiscal and monetary policies remain supportive of growth. From 1994–2010, South Africa
experienced an average, annualized growth rate of approximately 3.4 percent. This growth also
coincided with the increase of official development assistance to South Africa; conversely, it ’s
argued by Mr. Trevor Manuel, Minister in the Presidency: Planning of SA that as a middle-
income country, South Africa is less dependent on foreign aid. This research therefore aims at
answering the following research question:
Is there any significant relationship between Foreign Aid and Economic Growth in South Africa?

Alain Feudjou; FDJALA001 Foreign aid and economic growth in South Africa 10
1.2 The purpose of the study
The principal purpose of the study is to determine whether there is any existing relationship
between foreign aid inflows on economic growth in South Africa. Descriptive and inferential
analyses is used to analyze the data obtained from a secondary source, namely, the World Bank’s
world development indicators database for 2011.
1.3 The significance of the study
Economic research on foreign aid effectiveness and economic growth frequently becomes a
political football. However, when a result is passed from one source to the next, context is often
stripped away so that what the result means in public discussion is different than what the
original research actually demonstrated. The role of foreign aid in promoting economic growth
has been the subject of much debate among development specialists, researchers, aid donors as
well as recipients in general. There are tons of literature exploring the relationship between aid
and growth; however, there are only few empirical studies that investigate the contributions of
foreign aid to economic growth in South Africa, therefore this is a gap in research. This study
intends to fill the gap in research and to contribute to development finance.
It is hopeful that the findings of this study will raise international awareness and will make the
donor community know the real situation in South Africa.
1.4 Hypothesis of the study
The hypotheses that guide this study are:
• Ho: There is no relationship between foreign aid and economic growth in South Africa.
• H1: There is a relationship between foreign aid and economic growth in South Africa
1.5 Definition of terms
Relationship: The way in which two or more concepts, objects, or people are connected, or the
state of being connected.
Foreign Aid: Also referred to as international aid or overseas aid, (especially in the United
States) is the help, mostly economic, which may be provided to communities or countries in the

Alain Feudjou; FDJALA001 Foreign aid and economic growth in South Africa 11
event of a humanitarian crisis or to achieve a socioeconomic objective. Humanitarian aid is
therefore primarily used for emergency relief, while development aid also known as Official
Development Assistance (ODA) aims to create long-term sustainable economic growth.
This research considers aid as Official development assistance (ODA), defined as government
aid to developing countries designed to promote the economic growth of recipient countries.
Loans and credits for military purposes are excluded. The aid may be provided bilaterally, from
donor to recipient, or it may be channeled through a multilateral development agency such as the
United Nations or the World Bank.
Aid includes grants, "soft" loans, and the provision of technical assistance. Soft loans are those
where the grant element is at least 25%. ODA is usually measured on a net basis, that is, after
subtracting loan repayments from the gross aid flows.
Economic Growth: This is the increase in value of the goods and services produced by an
economy. It is conventionally measured as the percent rate of increase in real gross domestic
product (GDP).
Gross domestic product is the value of all market and some non-market goods and services
produced within a country. As such, it is the most comprehensive measure of a country's
economic output that is generally estimated by statistical agencies.
The GDP per capita (GDP pc) is defined as the GDP of a country divided by its total population
that is the average standard of living especially when expressed in purchasing power parity
(PPP). It is therefore viewed as a rough indicator of a nation's prosperity.
The GDP per employed person is the average labor productivity. It provides a general picture of
a country's productivity and international competitiveness.
The growth rate of real GDP is the percentage change in real GDP from one year to the next.

Alain Feudjou; FDJALA001 Foreign aid and economic growth in South Africa 12
CHAPTER TWO
LITERATURE REVIEW
2.0 Introduction
This chapter reviews the literature related to the study in two main parts;
• The theoretical nexus between aid and economic growth
• The empirical evidence on the nexus between foreign aid and economic growth
2.1 The theoretical nexus between aid and economic growth
The empirical literature on the links between aid and economic growth has been curbed by lack
of clear theoretical model on how aid would influence growth and which could pin down the
empirical specification of the aid growth relationship (Easterly, 2003). The variations noticed in
various aid studies are often occasioned by the peculiarities of their methodologies and choice of
variables. For example Vu Minh Duc (2006) in his investigation of the empirical linkage
between foreign aid and economic growth employed the endogenous growth model while
Burnside and Dollar (2000) and Murphy and Tresp (2006) involving a similar work, employed
the neoclassical growth model despite the peculiarities in various aid related studies, however,
the use of neoclassical growth model has dominated development economics.
Until recently, the two-gap model the origin of which is associated with Mckinnon (1964) and
Chenery and Strout (1966), had been the ‘saving grace’ for theoretical models on aid and growth
for many years.
Although, the model has received a lot of criticisms, it has remained a prototype model for
assessing the effectiveness of aid. In fact, till date, some institutions still apply the two-gap
model in their aid policies and programs. In the words of Easterly (2003), “the financing gap
model in which aid increases investment, which in turn increases economic growth has dubious
theoretical foundations and numerous empirical failings”. Yet no other model of aid and growth
has risen to take its place. The financing gap model continues to be used today in the World
Bank and other institutions making aid policy. In addition, Devarajan, Miller and Swanson
(2002) have acknowledged the criticisms the two-gap model has received, but nevertheless base
Alain Feudjou; FDJALA001 Foreign aid and economic growth in South Africa 13
their projections, formulated for the World Bank, of the future aid requirements to reach the
Millennium goals. They go on by stressing that it is a transparent and flexible framework for
examining, for a large number of countries, the aid requirements of achieving the poverty goal.
Numerous examples of use of the two-gap model by donor agencies can be found in the work of
Easterly (1999, 2001, 2003). Jhigan (2001) summarizes the criticisms against the two-gap model
thus: “the two-gap analysis is based on certain restrictive assumptions which limit its usefulness
in achieving the target growth rate in LDCs. It presupposes that an increase in domestic savings
cannot be utilized as a substitute for the required foreign exchange to maintain investment for the
target growth rate. It further assumes that the country cannot follow export promotion and import
substitution policies. It also assumes structural rigidities and non-substitutability between
different types of goods. Given such rigidities, if the foreign exchange gap is larger than the
saving gap, the domestic saving potential can be used neither to produce capital goods nor
exports. These assumptions are highly unrealistic and have not been supported by empirical
evidence.”
Theoretically, the two-gap model is often considered to be significant in making aid policies
because of the idea that foreign aid fills the gap between the ‘savings gap’ and the “foreign
exchange gap” in order to attain a target rate growth in less developed countries. A savings gap
arises when the domestic savings rate cannot guarantee the investment required to achieve the
target. Similarly, a foreign gap arises if the net export falls short of foreign exchange
requirements.
The foreign aid required to fill the gap is determined by the dominant gap at a given point in
time. If the savings gap is larger than the foreign exchange gap, the economy is said to be in
savings constraint. On the other hand, if the foreign exchange gap is larger than the savings gap,
the economy is in foreign exchange constraint. Foreign aid can help in removing the savings
constraint by the inflow of capital that will equate the difference between the increase in
investment and the increase in savings generated by rising income. If the foreign exchange is
dominant for a country at any given point in time, foreign aid can help in overcoming it. Over the
long period, the required foreign aid will equal the difference between the increase in imports
and exports. The foreign exchange gap will disappear when exports rise to a level that covers the
required imports for the target growth of the economy.

Alain Feudjou; FDJALA001 Foreign aid and economic growth in South Africa 14
Owing to the limitations of the two-gap model, its use in academic literature has become
unpopular. The Neoclassical growth model and the endogenous growth theory have gained
prominence, although the latter seems to be dominant in development economics and in
empirically based research.
2.2 Empirical evidence on the nexus between foreign aid and economic growth
There are three contrasting sides to this debate. One side argues that there is a strong relationship
between aid and economic growth, with even more impact in countries with sound economic and
trade policies. Another side contends that there is no existing relationship between foreign aid
and economic growth and that aid causes corruption, encourages rent-seeking behavior, and
erodes bureaucratic institutions. A third side argues that the relationship between aid and
economic growth could be positive or negative depending on several factors.
To date, there is no consensus among scholars as to the existence of a relationship between
foreign aid and economic growth.
There have been several prominent studies that find a causal link between foreign aid and
economic growth. Papanek (1973), in a cross-country regression analysis of 34 countries,
treating foreign aid, foreign investment, other flows and domestic savings as explanatory
variables, finds that foreign aid has a greater effect on economic growth than the other variables.
He explains that “aid is supposed to be specifically designed to foster growth and, more
importantly, is biased toward countries with a balance-of-payment constraint”. He also finds a
strong negative correlation between foreign aid and domestic savings, which he believes co-
contributed to the growth performance.
Chenery and Carter (1973), following the previous two-gap derived model of Chenery and Strout
(1966) and using data from 50 countries over the period 1960-1970, show that the effects of
Official Development Assistance (ODA) on the development performance of countries under
study are different among certain groups of countries. In five countries, namely Taiwan, Korea,
Iran, Thailand and Kenya, foreign assistance accelerated economic growth whereas in six cases it
retarded growth, that is, India, Colombia, Ghana, Tunisia, Ceylon and Chile.
In a related study, Singh (1985) also finds that foreign aid has a strong positive impact on
economic growth in less developed countries for the periods 1960-1970 and 1970-1980. He
concludes that this is very possible when state intervention is not taken into account. When the

Alain Feudjou; FDJALA001 Foreign aid and economic growth in South Africa 15
state intervention variable is included in the regression, the effect of foreign aid gets statistically
weak. Snyder (1993), taking country size into account, finds a positive and significant
relationship between aid and economic growth. He emphasizes that, “Previous econometric
analysis has not made allowance for the fact that larger countries grow faster, but receive less
aid”. He also claims that donors favor small countries for a number of reasons. Based on the
model developed by Papanek (1972, 1973) and then extended by Mosley and Hudson (2001),
Snyder analyzes the relation between foreign aid inflow and the growth rate of gross domestic
product in 69 developing countries over three periods (the 1960s, 1970s and 1980-1987),
incorporating country size (measured by gross domestic product) in the model. He argues that
when country size is not included, the effects of aid are small and insignificant but when this
factor is taken into account, the coefficient of aid becomes positive and significant.
Fayissa and El-Kaissy (1999) came out with the same conclusion as (Chenery and Strout, 1966),
that overseas development assistance accelerates economic growth by supplementing domestic
capital formation (economic theory of foreign aid). They conducted a study of 77 countries over
sub-periods 1971-1980, 1981-1990 and 1971-1990. The results showed that that foreign aid
positively affects economic growth in developing countries. Using modern economic growth
theories, they pointed out that foreign aid; domestic savings, human capital and export are
positively correlated with economic growth in the studied countries.
Lensink (2001) and Morrissey (2001) posited that uncertainty in aid receipts would influence the
relationship between aid and investment, how recipient governments respond to aid, and will
capture the fact that some countries are especially vulnerable to shocks. When they accounted for
uncertainty (which is negative and significant), they found that aid has a significant positive
effect on growth, largely due to its effect on the volume of investment. The finding that
uncertainty of aid receipts reduces the effectiveness of aid is robust. When the regression was
estimated for the sub-sample of African countries, these findings were weaker than for the full
sample, although the effectiveness of aid appeared.
For instance, the most well-known prominent studies that find a causal link between foreign aid
and economic growth was performed by two researchers for the World Bank, Craig Burnside and
David Dollar (1998). They found that foreign aid enhances economic growth, so long as “good”
fiscal policies are in place. These policies can include maintaining small budget deficits,
controlling inflation, and being open to global trade. Since the Burnside and Dollar (2000) paper,

Alain Feudjou; FDJALA001 Foreign aid and economic growth in South Africa 16
many papers have reacted to their results including Hansen and Tarp (2001), Dalgaard and
Hansen (2001), Guillamont and Chauvet (2001), Collier and Dehn (2001), Lensink and White
(2001), Collier and Dollar (2002), Easterly, Levine and Rodman (2004), Harms and Lutz (2004),
and Murphy and Tresp (2006). Some of these papers confirm the message of Burnside and Dollar
that aid only works in a good policy environment, while others find that when particular
variables are added, the coefficient on the interaction between aid and policy becomes near zero
and/or statistically insignificant.
For example, Collier and Dehn (2001), as part of their contributions to entrench the brilliant
research work of Burnside and Dollar (2000) incorporated export price shocks into Burnside and
Dollar, showing a significant and negative relation between negative shocks and economic
growth. They argued “the adverse effects of negative shocks on growth can be mitigated by
offsetting increases in aid”. Therefore, they suggested that targeting aid towards negative shock
expressing countries could be more effective than towards good policy countries. Using a 2.5%
cut off in their sample size of 113 countries, they found 14 positive shocks and 99 negative
shocks episodes. They indicated that the change in aid interacted with positive shocks is
insignificant at the 1% level. Additionally; incorporating shocks into Alesina and Dollar’s (1998)
regression, they showed that so far donors have not taken shocks into account in aid allocation.
Finally, they claimed that aid effectiveness might be increased significantly if both policy and
adverse export price shocks are considered in determining aid allocation.
Hansen and Tarp (2001) find that aid increases the growth rate, and this conclusion is not
conditional on the policy index established by Burnside and Dollar (2000) they used a fairly
standard growth model capturing non-linear effects between aid and growth, the empirical
specification, with most support by data, does not include an aid–policy interaction term. They
therefore believe to have substantiated that it is premature to rely on policy indexes, such as the
one proposed by Burnside–Dollar, in the allocation of aid. They also note that empirical
conclusions about aid effectiveness, based on cross-country growth regressions, depend on
poorly understood non-linearity and critical methodological choices.
Ali and Isse (2005) further confirmed the findings of Burnside and Dollar.
Irandousta and Ericsson (2005) applied the new developments in the field of likelihood-based
panel co-integration analysis to examine the long-run relationship between foreign aid, and
economic growth. The countries in the panel are: Niger, Nigeria, Rwanda, Senegal, and Togo,

Alain Feudjou; FDJALA001 Foreign aid and economic growth in South Africa 17
and the sample period is 1965–2000 they show that foreign aid enhance economic growth for all
countries in the sample. The same year, Moreira (2005) using a cross country study, also found
that; aid has positive effect on growth, and concluded that in terms of magnitude, aid has less
effect on growth in the short-run than in the long-run and that the time lags in the aid-growth
relationship should not be ignored. Durbarry, Gemmell, and Greenaway (2006) also found a
positive association between foreign aid and economic growth, and confirmed Burnside and
Dollar’s (2000) finding of conditionality on good economic policy. The study also concluded,
however, that the degree to which aid impacts GDP depends largely on other factors as well,
such as geography. In another study, Ekanayake (2009), using the annual data on a group of 85
developing countries covering Asia, Africa, and Latin America and the Caribbean for the period
1980-2007 and the panel data series for foreign aid, while accounting for regional differences in
Asian, African, Latin American, and the Caribbean countries as well as the differences in income
levels demonstrated that foreign aid has a positive effect on economic growth in African
countries. He also highlighted the fact that Africa is the largest recipient of foreign aid than any
other region. Vu Minh Duc (2006) found that foreign aid to Inland countries as well as South
Asian countries during the period 1992-2000 significantly and positively correlates with growth.
To answer to his research question; does foreign aid work, Collodel (2011) said: “Yes, aid does
have a positive impact on growth”. He stated that there is an urgent need to reform the aid system
and develop a new methodology for measuring the effectiveness of foreign aid. Dacy (2006)
analyzed the growth impact of official development assistance to developing countries. Their
approach followed two major ways. First, they disentangle the effects of two components of aid:
a developmental, growth-enhancing component and geopolitical, possibly growth-depressing
component. Second, they designed specifications that allow for the effect of aid and economic
growth to occur over long time lags involving periods of up to several decades. Their results
indicate that aid of the right kind promote long run growth. The effect of developmental aid is
significant, large, and withstands a battery of robustness checks including alternative proxies for
developmental aid, specifications and treatment of outliers. The basic implication of their
findings is that increasing the level of developmental aid (whether by changing the composition
or level of total aid) can have a sizeable impact on long run growth.
Recently, Kargbo (2012) using a triangulation of approaches involving the autoregressive
distributed lag bounds test approach and the Johansen maximum likelihood approach to co-

Alain Feudjou; FDJALA001 Foreign aid and economic growth in South Africa 18
integration for the period 1970-2007, found that foreign aid has a significant contribution in
promoting economic growth in Sierra Leone.
In general, aid is found to have a significant relationship with economic growth because it
increases investment, increases the capacity to import capital goods or technology, aid does not
have an adverse impact on investment and savings and lastly because aid increases the capital
productivity and promotes endogenous technical change (Morrissey, 2001).
Although foreign aid is found to have a significant relationship with economic growth, Pedersen
(1996) in a related study asserted that it is still not possible to conclude that aid affects growth
positively. He used the game theory, to demonstrate that the problems lie in the built-in incentive
of the aid system itself. The aid conditionality is not sufficient and the penalties are not hard
enough when recipient countries deviate from their commitments. In fact, there are incentives for
aid donating agencies to disburse as much aid as possible. This hinders the motivation of
recipient countries and raises the aid dependency, which in turn distorts their development.
Easterly, Levine and Roodman (2004) suggest that economists and policy makers should be less
sanguine about concluding that foreign aid will boost growth in countries with good policies.
The study of Ali and Isse (2005) also demonstrated, that aid is subject to decreasing marginal
returns, indicating a threshold beyond which development assistance can become detrimental to
economic growth. Knack (2000), in a cross-country analysis, presented results, indicating that
higher aid levels erode the quality of governance indexes, that is, bureaucracy, corruption and the
rule of law. He argues “aid dependence can potentially undermine institutional quality,
encouraging rent seeking and corruption, fomenting conflict over control of aid funds, siphoning
off scarce talent from bureaucracy, and alleviating pressures to reform inefficient policies and
institutions”.
Even before Burnside and Dollar’s monumental findings, a study by Bourguignon and Morrisson
(1998) found that aid-intensive African countries experienced zero per capita economic growth
in the 1970s and 80s, despite foreign aid actually increasing (as measured by share of GDP).
Svensson (1998) argues that large aid inflows do not necessarily result in general welfare gains
and high expectation of aid may increase rent seeking and reduce the expected public goods
quality. Moreover, there is no evidence that donors take corruption into account seriously while
providing aid. In another study by, Gomanee and Morrissey (2002), they find that a permanent
rise in foreign aid reduces long-run labor supply and capital accumulation, increases long-run

Alain Feudjou; FDJALA001 Foreign aid and economic growth in South Africa 19
consumption and has no impact on long-run foreign borrowing. They used the optimal growth
model with foreign aid, foreign borrowing and endogenous leisure-and-consumption choices to
show that foreign aid depresses domestic saving, mostly channels into consumption and has no
relationship with investment and growth in developing countries. According to Burnside and
Dollar, (2000), the impact of foreign aid on growth is subject to certain factors. In their work
“Aid, Policies, and Growth”, they find that has little impact on countries where fiscal, monetary
and trade policies are poor. They use data from 56 countries for six four-year periods from 1970-
1973 until 1990-1993 and construct a growth convergence model to illustrate. They explain,
“Aid can affect output only through its effect on the stock of capital, that is, to the extent that it is
used for investment rather than consumption”. They argue that aid itself has small and
insignificant impact but aid interacting with good policy has a significant positive impact on
growth. In fact, policy seems more important for aid effectiveness in lower income countries.
Another finding is that there is no tendency for total aid or bilateral aid to favor good policy,
while multilateral aid is allocated in favor of good policy. They indicate that aid works well in a
good policy environment and a poor country with good policy should get more aid, which is not
always the case in reality. Burnside and Dollar, (2000) also state that a well-designed aid plan
can support effective institutions and governance by providing more knowledge and transferring
technology and skills. It is recommended to decentralize the aid flows in recipient countries.
Money aid is important but idea aid is even more important. Aid can be the midwife of good
policy in recipient countries. In poor-policy countries, idea aid is especially more essential than
money aid. This implies that in a good-policy environment, aid increases growth via the
investment channel whereas in a poor-policy environment, it nurtures the reforms through
policymakers training or knowledge and technology transfer. These non-money effects are
believed even more important and viable than the money value of aid. Aid works much better
where the reform is initiated or internalized by local government rather than when outsiders
impose it. Therefore, aid is normally more effective when it facilitates efficiently and timely
reforms triggered by the local authority (World Bank, 2000). Ouattara (2003) concludes that
different types of aid have different impacts on growth. In a country analysis of Cote d’Ivoire
from 1975 to1999, he categorizes foreign aid into project aid, program aid, technical assistance
and food aid. Using a disaggregation approach with auto regressive techniques, he finds that
project aid displaces public savings. The impact of program aid is almost neutral while technical

Alain Feudjou; FDJALA001 Foreign aid and economic growth in South Africa 20
assistance and food aid increase public savings. Project aid and to a lesser extent, program aid,
worsen the foreign dependence of Cote d’Ivoire while technical assistance and food aid reduce
the gap. Mbaku (1993), in his work “The impact of Foreign aid on economic growth in
Cameroon”, uses an econometric model, based on the neoclassical production function, to test
the relationship between foreign aid and economic growth. The model is tested using time series
data on the country from 1971 to 1990. The results show that domestic resources have a stronger
impact on economic growth in Cameroon than foreign resources. Cleveland (2006), applying a
Granger causality test between foreign aid and economic growth and other diagnostic tests, finds
a causal relationship between foreign aid loans, but not foreign aid grants, with economic growth
in Cameroon, which contradicts the previous work of John Mbaku (1993).
Rajan and Subramanian (2005) attempted to analyze why it is so hard to find a robust effect of
aid on the long-term growth of poor countries, even those with good policies. They look for a
possible offset to the beneficial effect of aid, using a methodology that exploits both cross-
country and within country variation. They found that aid inflows have systematic adverse effect
on countries competitiveness. They also found evidence suggesting that these effects stem from
the real exchange rate evaluation caused by aid inflows.
Vu Minh Duc (2006) attempted to quantify the relationship between foreign aid and economic
growth in developing countries over the period 1975-2000. Using cross-country data comprising
thirty-nine countries, he found evidence that foreign aid negatively correlates with growth in
developing countries. The results suggest that:
• There may be problems in the present aid providing system, where aid hinders growth of
developing countries.
• The successful experience of some Inland countries and South Asian countries nations
during the period of 1992-2000 could be a good lesson for other developing countries.
• Finally, a strong evidence of divergence implies that if the condition were not improved
upon in the least developing countries, there would be large income dispersion among
developing countries in the future.
In another studies, (Bell and Rich, (1994), Ravallion and Datt, (1994), Ravallion and Chen,
(1997), Dollar and Kraay, 2000), find that there is a widely recognized positive correlation
between sustained economic growth and poverty reduction, but not between foreign aid and
economic growth. They argue that increases in economic growth are expected to benefit the poor

Alain Feudjou; FDJALA001 Foreign aid and economic growth in South Africa 21
due to their participation in economic activities, and this leads to larger tax revenues and higher
government expenditures, which might include transfers to the least well off as well as increasing
access to services such as health and education.
Murphy and Tresp (2006) reconsidered the role of economic policy in determining the
effectiveness of foreign aid for generating economic growth in developing countries. They
updated and modified the dataset originally used by Burnside and Dollar (2000) in order to more
fully consider the critique presented by Easterly (2006). Their findings suggest that the
relationship among foreign aid, government policy, and economic growth is tenuous and depends
importantly on the subset of countries included in the analysis. Good policy enhances the
effectiveness of foreign aid in spurring growth when we use the original set of countries included
in Burnside and Dollar, but this relationship disappears for an expanded set of countries. Because
the relationship among aid, policy, and growth is likely to be nonlinear, they presented an
alternative model emphasizing growth thresholds. Their results from this alternative analysis
confirmed the conclusions of Easterly, finding little support for the view that good policy
increases the probability that foreign aid contributes to growth.
As a contribution to a well-known recent paper by Burnside and Dollar (2000) that aid promotes
growth only in a good policy environment, Gunning (2006), addressed nonlinearity in the aid,
policy and growth relationship without improving any particular structure in the relationship and
examined the varying effects of aid and policy in different segments of the data. By using
commonly used aid and policy variables, they revisited the issue from a new perspective. Their
semi-parametric estimation shows that aid diminishes returns. These findings suggest that
nonlinearities if not appropriately addressed may hide some key details, providing only indistinct
information about the aid-policy-growth nexus. Studies carried out by (Kosack, 2003); reveal
that aid can directly decrease welfare; he indicates that they is no relationship between aid and
economic growth in poor democracies.
Despite the fact that foreign aid is found to have no significant existing relationship with
economic growth and that aid causes corruption, encourages rent-seeking behavior, and erodes
bureaucratic institutions. Collodel (2011) states that the relationship between aid and economic
growth could be positive or negative depending on several factors. He argues that there is also
evidence that the effects of foreign aid can be mitigated by other non-economic factors.
Situations of state failure, such as ethnic conflict, genocide or politicization, and revolution can
Alain Feudjou; FDJALA001 Foreign aid and economic growth in South Africa 22
all potentially influence the extent to which aid impacts growth. George Mason University’s
Political Instability Task Force (PITF) created a binary dataset indicating in which countries and
during what years these events take place. According to the PITF, an ethnic conflict requires the
clash of two separate ethnic, religious, or nationalistic factions, and also must meet two threshold
criteria: 1,000 people must be mobilized for armed conflict, and at least 1,000 people per year
must have died as a direct result of this conflict. Similarly, revolutions are defined as episodes of
violent conflict between political groups in hopes of overthrowing the current regime, and must
meet the same threshold criteria as ethnic wars. Not a lot of attention is paid to genocide,
politicization, and revolution and their effects on growth in the literature. Moreover, there has
been virtually no research performed on this question as it concerns the effectiveness of aid. It is
reasonable to believe, though, that resources (including foreign aid) are siphoned off by the
dominant party and used for individual benefit rather than for economically efficient activities, as
intended. Finally, genocide and politicization are defined in a slightly different manner. These
events occur when the group in power carries out sustained policies that target ethnic, religious,
or political rivals, ultimately resulting in the deaths of a “substantial” portion of one of those
groups. Hjertholm and White (2000) studied the effects of high ethnic fractionalization on
economic growth. By fractionalization, they mean the probability that two randomly chosen
people from a population will be of different ethno-linguistic backgrounds. Easterly, Levine, and
Roodman, (2004) concludes that movement from heterogeneity to homogeneity (decreasing
fractionalization) results in better schooling, more efficient infrastructures, and more developed
financial systems and foreign exchange markets. According to their findings, then, it is entirely
possible that ethnic conflict, in its attempt to move away from ethnic diversity and towards
ethnic homogeneity, will actually improve economic growth. Despite their findings, however,
the instability of the regime could still negatively impact the degree of aid’s effectiveness.
Furthermore, out of respect for state sovereignty, these events are not likely to prompt a major
international response, which would perhaps eliminate local control over resources and allow
them to be used productively. Ethnic conflict typically ignores state boundaries. One study by
Charles (2002) estimated that over two-thirds of identified ethnic communal groups in the world
have kindred in another country. The spread across state borders allows other states to intervene
without violating state sovereignty, which could positively impact how resources are used, and
ultimately, economic growth.

Alain Feudjou; FDJALA001 Foreign aid and economic growth in South Africa 23
Additionally, a country’s geographic location can influence economic performance; nations that
are landlocked, for instance, are at a natural disadvantage in global trade. Sachs and Warner
(1996) indicate that landlocked countries, in particular, face very high costs of shipping, since
they must pay road transport costs across at least on international boundary in addition to sea
freight costs. Although air shipments can help overcome many of these problems, only certain
goods can be economically shipped by air, and most countries still import and export the
majority of goods by the sea. A report by the UN Economic and Social Commission for Asia and
the Pacific specifically mentions the positive relationship between aid and growth in landlocked
countries, noting that they are at a disadvantage for these reasons, as well (Tarp, 2000). Due to
their geographical position, then, landlocked countries could potentially benefit from foreign
assistance, as it may fill the gap in trade that they experience relative to countries with easy
access to international trade.
2.3 General summary of literature review
The following table presents the general summary of literature review.
Table 1: Showing names of author and findings
Name Findings
Papanek (1973) Foreign Aid had a greater impact on economic growth.
Chenery and Carter (1973)
ODA accelerated economic growth in some countries but retarded
it in some.
Singh (1985) Foreign aid had a strong positive impact on economic growth in
less development countries when state intervention is not taken
into account.
John Mbaku (1993)
Domestic resources had a greater impact than foreign resources.

Alain Feudjou; FDJALA001 Foreign aid and economic growth in South Africa 24
Snyder (1993)
Foreign aid had a strong and positive relationship with economic
growth when country size is taken into account.
Bell and Rich, (1994), Ravellion and
Datt, (1994), Dollar and Kraay, (2000).
Positive correlation between sustained economic growth and
poverty reduction
Pedersen (1996)
Used game theory to show that foreign aid distorts development.
Burnside and Dollar (1998) Aid had a positive impact on growth in countries with good
governance.
Svensson (1998)
Aid inflows do not result in welfare gains.
Fayissa and El-Kaissy (1999) ODA accelerated economic growth. Foreign aid, domestic
savings, human capital and export are positively correlated with
economic growth.
Knack (2000) Too much dependence on aid undermines institutional quality and
encourages corruption.
Morrissey (2001)
Foreign aid had positive impact on economic growth because it
increases investment.
Mosley and Hudson, (2001) Foreign aid has an indirect impact on poverty and the well being
of recipient countries.
Gomanee and Morrissey (2002) A permanent rise in foreign aid reduces long run labor supply and
capital accumulation.
Quattera (2003)
Different types of aid had different impact on growth.
Kosack, (2003)
Aid directly increases welfare but only in democracies.

Alain Feudjou; FDJALA001 Foreign aid and economic growth in South Africa 25
Collodel (2011) The relationship between aid and economic growth could be positive or negative depending on several factors.
Source: Table done by myself.
The above literature on the impact of aid on growth reveals the fact that the relationship between
the variables varies, depending upon the models, data, non-economic factors and countries of
analysis. Therefore, the question of aid effectiveness is still inconclusive as stated by Easterly,
Levine and Roodman (2004) after conducting a new test on the previous work of Burnside and
Dollar (2000). The above literature review also reveals the fact that most of the researchers have
used cross-country analyses. Some of the studies have concentrated on regions to assess the
impact of aid on growth. Few have considered particular country cases studies and even the few
that have done so, have not gone into looking at the relationship between aid and economic
growth in South Africa. The novelty of this study therefore is to assess the existence of the
relationship between foreign aid on economic growth in particular country case study; South
Africa.

Alain Feudjou; FDJALA001 Foreign aid and economic growth in South Africa 26
CHAPTER THREE
RESEARCH METHODOLOGY
3.0 Introduction
This chapter highlights the methodology employed in the study. The chapter consists of a
background of study area, research design follow by research instrumentation and lastly
variables for data collection and procedure for data analysis.
3.1 Background of study area
According to the CIA world fact book, South Africa became a republic in 1961 after a whites-
only referendum, it has a population of 50,586,757 (July 2012 est.), and its population growth
rate is 1,1 % (2012 est.), the 2010 midyear estimated figures for the categories were Black
African at 79.4%, White at 9.2%, Coloured at 8.8%, and Indian or Asian at 2.6%. According to
the 2001 national census, Christians accounted for 79.7% of the population. This includes Zion
Christian (11.1%), Pentecostal (Charismatic) (8.2%), Roman Catholic (7.1%), Methodist (6.8%),
Dutch Reformed (6.7%), Anglican (3.8%); members of other Christian churches account for 36%
of the population. Muslims accounted for 1.5% of the population, Hindus about 1.3%, and
Judaism 0.2%. 15.1% had no religious affiliation, 2.3% were other and 1.4% was unspecified.
South Africa has eleven official languages: Afrikaans, English, Ndebele, Northern Sotho, Sotho,
Swazi, Tswana, Tsonga, Venda, Xhosa, and Zulu. It has a three-tier system of education starting
with primary school, followed by high school and tertiary education in the form of (academic)
universities and universities of technology. Its healthcare varies from the most basic primary
healthcare, offered free by the state, to highly specialized hi-tech health services available in the
both the public and private sector.
According to the Bloomberg, South Africa has a modern and well-developed transport
infrastructure. The roads are world-class. The air and rail networks are the largest on the
continent. And the country’s ports provide a natural stopover for shipping to and from Europe,
the Americas, Asia, Australasia and both coasts of Africa. The transport sector has been
Alain Feudjou; FDJALA001 Foreign aid and economic growth in South Africa 27
highlighted by the government as a key contributor to South Africa’s competitiveness in global
markets. It is increasingly being seen a crucial engine for economic growth and social
development, and the government has unveiled plans to spend billions of rand to improve the
country’s roads, railways and ports. Major shipping lanes pass along the South African coastline
in the south Atlantic and Indian oceans. Approximately 96% of the country’s exports are
conveyed by sea, and the eight commercial ports are the conduits for trade between South Africa
and its southern African partners as well as hubs for traffic to and from Europe, Asia, the
Americas and the east and west coasts of Africa.
According to the 2010 CIA world fact book report, South Africa’s total road network is about
754 000 kilometers, of which over 70 000km are paved or surfaced roads. The drive from
Musina on South Africa’s northern border to Cape Town in the south is a 2 000km journey on
well-maintained roads. South Africa has an extensive rail network – the 14th longest in the world
– connecting with networks in the sub-Saharan region. The country’s rail infrastructure, which
connects the ports with the rest of South Africa, represents about 80% of Africa’s total. The
Gautrain is an 80km rapid rail network, connecting Johannesburg, Pretoria and OR Tambo
International Airport, easing congestion on the Johannesburg-Pretoria highway by offering
commuters a safe and viable alternative to road travel. Sixty-two airlines, making 274,000
aircraft landings and carrying 16.5-million passengers (counting departures only), moved
through South Africa’s ten principal airports in 2009.
South Africa’s telecom sector boasts the continent’s most advanced networks in terms of
technology deployed and services provided. In a virtually saturated voice market, four mobile
networks – Vodacom, MTN, Cell C and Telkom SA – are competing for market share in the next
growth wave, mobile broadband. 3G/HSPA mobile broadband services now rival available DSL
fixed-line offerings in terms of both speed and price, and have consequently taken the upper
hand in terms of subscriber numbers. All four operators are preparing the introduction of the next
generation of mobile technology, LTE (also referred to as 4G), but are being held back by delays
with suitable frequency spectrum allocations.

Alain Feudjou; FDJALA001 Foreign aid and economic growth in South Africa 28
3.1.1 Economy
South Africa is a middle-income, emerging market with an abundant supply of natural resources;
well-developed financial, legal, communications, energy, and transport sectors; a stock exchange
that is the 18th largest in the world; and modern infrastructure supporting a relatively efficient
distribution of goods to major urban centers throughout the region (KPMG report, 2010).
According to the 2010 Millennium development goal growth was robust from 2004 to 2007 as
South Africa reaped the benefits of macroeconomic stability and a global commodities boom but
began to slow in the second half of 2007 due to an electricity crisis and the subsequent global
financial crisis’ impact on commodity prices and demand. GDP fell nearly 2% in 2009 but
recovered in 2010-11. Unemployment remains high and outdated infrastructure has constrained
growth. State power supplier Eskom encountered problems with aging plants and meeting
electricity demand necessitating “load- shedding” cuts in 2007 and 2008 to residents and
businesses in the major cities. Daunting economic problems remain from the apartheid era –
especially poverty, lack of economic empowerment among the disadvantaged groups, and a
shortage of public transportation.
According to the KPMG’s 2010 Report, South Africa’s economic policy is fiscally conservative
focusing on controlling inflation and attaining a budget surplus. The current government largely
follows these prudent policies but must contend with the impact of the global crisis and is facing
growing pressure from special interest groups to use state-owned enterprises to deliver basic
services to low-income areas and to increase job growth. South Africa is well known throughout
the world for its Gold, Diamonds, Coal and Platinum industries, but besides for these minerals,
the country mines a number of other minerals. What is not as commonly known, is that the
country also has a wide range of additional natural resources that are not as well-known such as
timber, sugar and other agricultural items. The 2010 KPMG report states that driving through the
area of Mpumalanga (formerly the Eastern Transvaal) and also Kwazulu-Natal’s midlands area,
one will see huge areas of timber plantations. These plantations are the foundations of a very
large and lucrative industry. The timber industry of South Africa is very productive and supplies
almost all the countries timber requirements as well as exporting a sizeable percentage of wood
grown in these plantations. Also not generally known is South Africa’s sugar Industry situated
mainly in Kwazulu Natal and to a lesser degree in the Eastern Cape and the Mpumalanga area.

Alain Feudjou; FDJALA001 Foreign aid and economic growth in South Africa 29
The Sugar Industry of South Africa generates an income of about six billion rand annually and
provides work opportunities for a very large amount of people living in these areas. Not to be
forgotten of course is the Wine Industry of South Africa. Since the end of Apartheid the export of
wines from South Africa has continued to grow with each passing year and today South Africa is
one of the top ten wine producers in the world. South African agriculture encompasses a wide
range of products such as fresh fruit (grapes, citrus, nectarines and others), as well as maize,
tobacco wool and cotton. Most of these items are also exported.
3.1.2 South Africa latest economic indicators
South Africa latest economic indicators are shown on the table below.
Table 2: South Africa latest economic indicators.
2010 2011 2012
2 Qtr. 3 Qtr. 4 Qtr. 1 Qtr. 2 Qtr. 3 Qtr. 4 Qtr. 1 Qtr.
General government finance (R m)
Revenue 153 848 160 363 171 239 202 009 166 886 170 048 208 060 219 683
Expenditure 184 452 206 506 201 883 202 919 201 601 234 042 220 512 239 540 Balance (30 604) (46 143) (30 644) -910 (34 715) (63 994) (12 452) (19 857)
Output
GDP at constant 2000 prices (R bn) 1 829,3 1 843,3 1 863,7 1 884,6 1 889,1 1 897,1 1 911,9 n/a
Manufacturing index (2000=100) 102,1 100,2 101,6 104,3 102,9 102,5 103,7 105,5 Durable goods 94,7 89,8 95,7 98,1 98,3 95,8 97,1 98,3
Non-durable goods 108 109,7 106,9 108,8 107,5 108,9 110,6 111
Employment & prices
Employment, private (2000=100)
Mining 119,4 120,5 121,1 123,6 124,3 123,7 124,5 n/a
Manufacturing 90,3 89,5 89,7 89,5 88,7 88,8 89,1 n/a
Construction 184,8 183,6 180,1 183,8 188,4 196,4 191,8 n/a
Consumer prices (2008=100) 111,2 111,8 113 114,5 116,3 118 120,1 121,7 Consumer prices (% change, year on
year)
4,2 3,4 3,4 3,7 4,6 5,5 6,3 6,3
Production prices (2000=100) 191,3 192,6 194,7 200,3 204,6 211,2 214,7 216,5 Production prices (% change, year
on year)
7,2 7,3 6,3 6,4 7 9,7 10,3 8,1
Financial indicators
Exchange rate R: US$ (av) 7,5 7,3 6,9 7 6,8 7,2 8,1 7,8 Exchange rate R: US$ (end-period) 7,6 7 6,6 6,8 6,8 8 8,1 7,7
Deposit rate (av; %) 6,8 6,5 5,4 5,9 5,7 5,6 5,5 n/a
Lending rate (av; %) 10 9,8 9,2 9 9 9 9 n/a

Alain Feudjou; FDJALA001 Foreign aid and economic growth in South Africa 30
Source: 2010 KPMG report; South Africa country profile
3.1.3 South Africa economy indicators; five years forecast
The tables below show five years forecast South Africa economic indicators.
Table 3: South Africa five years economic indicators forecasts: Growth and productivity.
a) Actual; b) estimates c) forecasts
Source: 2010 KPMG report; South Africa country profile
3-month money market rate (av; %) 6,3 6,2 5,6 5,3 5,3 5,3 5,3 n/a Long-term Gov. bond yield (av; %) 8,9 8,3 8,2 8,7 8,6 8,3 8,5 n/a
M2 (end-period; R bn) 1 550 1 588 1 677 1 650 1 645 1 720 1 798 n/a
M2 (% change, year on year) 0,3 2,9 5,6 4,6 6,1 n/a n/a n/a
JSE, all items (Dec 1960=100) 26 259 29 456 32 119 32 204 31 865 29 674 31 986 33 554 JSE, all items (% change, year on
year)
20,7 26 29,8 21,3 37 -12,7 -18,8 -7,9
Gold mining share prices (2000=100) 63,4 63,5 69,5 68,6 67,3 68,7 76,7 70,3 Gold mining share prices (%change,
year on year)
-1,9 1,9 4,9 16,1 6,1 8,2 10,5 2,5
Sectorial trends (2000=100)
Gold mining (volume of production) 65 64,6 64,6 63,5 62,1 58,4 60,7 56,2 Other mining (volume of production) 91 98,3 101 100,2 99,6 95 94,6 91
Retail sales, volume 101,3 102,1 102,9 104,6 105,7 108,3 110,4 109,3
Foreign trade (US$ m)
Exports fob 19 383 21 563 23 767 22 481 24 824 25 862 23 780 22 173 Net gold exports n/a n/a n/a n/a n/a n/a n/a n/a
Imports cif (19 016) (21 445) (21 497) (23 088) (24 694) (26 647) (25 398) (25 564)
Trade balance 368 118 2 270 -607 130 -784 (1 618) (3 391)
Foreign payments (US$ m)
Merchandise trade balance 890 705 2 521 675 1 389 669 -317 n/a
Services balance (1 003) (1 386) (1 218) (1 211) (1 790) (1 202) -637 n/a
Income balance (1 864) (2 107) (1 658) (2 160) (2 049) (3 781) (1 295) n/a Net transfer payments -356 -815 -339 -351 -647 -574 -400 n/a
Current-account balance (2 333) (3 603) -694 (3 047) (3 097) (4 888) (2 649) n/a
Reserves excl gold (end-period) 37 202 38 765 38 175 43 512 43 984 43 208 42 595 43 982
2007
(a)
2008
(a)
2009
(a)
2010
(b)
2011
(b)
2012
(b)
2013
(c)
2014
(c)
2015
(c)
2016
(c)
Growth and productivity (%)
Growth of capital stock 6,3 7,2 5,8 4,9 4,9 4,6 4,6 4,7 4,9 5,1
Growth of real GDP 5,5 3,6 -1,5 2,9 3,1 2,5 3 3,8 4 4,2
Growth of real GDP per
head
4,6 2,7 -2,1 2,8 3,3 2,9 3,5 4,2 4,2 4,1

Alain Feudjou; FDJALA001 Foreign aid and economic growth in South Africa 31
The table below shows South Africa five years Gross Domestic Product at current market prices.
Table 4: South Africa five years economic indicators forecast: Gross Domestic Product at current
market prices
a) Actual; b) estimates c) forecasts
Source: 2010 KPMG report; South Africa country profile
2007
(a)
2008
(a)
2009
(a)
2010
(a)
2011
(a)
2012
(b)
2013
(b)
2014
(b)
2015
(b)
2016
(b)
Expenditure on GDP (R bn at current market prices)
GDP 2 016,2 2 262,5 2 398,2 2 661,4 2 964,3 2 967,4 3 067,5 3 173,5 3 303,8 3 406,4
Private consumption 1 264,7 1 393,0 1 460,9 1 575,9 1 737,3 1 872,8 2 060,1 2 261,9 2 506,2 2 776,9
Government
consumption
380 426,4 502,5 573,5 636,4 704 766,7 849,1 947,7 1 062,8
Gross fixed investment 406,3 520,7 521,7 520,4 559,9 579 614,5 655,8 704,3 756,7
Exports of goods & services
634,6 809,6 657,2 727,7 854,3 996 1 062,6 1 121,3 1 248,0 1 404,3
Imports of goods &
services
689,8 878,7 678,3 733 872,4 1 156,8 1 415,7 1 696,1 2 075,9 2 565,7
Domestic demand 2 073,0 2 332,6 2 434,4 2 666,4 2 958,7 3 151,8 3 444,2 3 771,9 4 155,3 4 591,4
Expenditure on GDP (US$ bn at current market prices)
GDP 286,1 274 284,7 363,8 408,3 364,6 368,4 384,7 386,4 380,6
Private consumption 179,5 168,7 173,4 215,4 239,3 230,1 247,4 274,2 293,1 310,3
Government
consumption
53,9 51,6 59,7 78,4 87,7 86,5 92,1 102,9 110,8 118,7
Gross fixed investment 57,6 63,1 61,9 71,1 77,1 71,2 73,8 79,5 82,4 84,5
Exports of goods & services
90,1 98 78 99,5 117,7 122,4 127,6 135,9 146 156,9
Imports of goods &
services
97,9 106,4 80,5 100,2 120,2 142,2 170 205,6 242,8 286,7
Domestic demand 294,2 282,4 289 364,5 407,6 387,3 413,7 457,2 486 513
Economic structure (% of GDP at current market prices)
Private consumption 62,7 61,6 60,9 59,2 58,6 63,1 67,2 71,3 75,9 81,5
Government consumption
18,8 18,8 21 21,5 21,5 23,7 25 26,8 28,7 31,2
Gross fixed investment 20,1 23 21,8 19,6 18,9 19,5 20 20,7 21,3 22,2
Exports of goods &
services
31,5 35,8 27,4 27,3 28,8 33,6 34,6 35,3 37,8 41,2
Imports of goods &
services
34,2 38,8 28,3 27,5 29,4 39 46,2 53,4 62,8 75,3
Memorandum item
National savings ratio (%)
14,2 15,3 15,7 16,6 16,4 14,2 15,8 17,3 18 18,3

Alain Feudjou; FDJALA001 Foreign aid and economic growth in South Africa 32
3.1.4 Country risk rating
Country risk rating is divided into 5 type of risk: sovereign, currency, banking sector, political
and economic structure risk.
3.1.4.1 Sovereign risk
Stable, a strong macroeconomic policy framework will continue to support the sovereign’s
rating, but rising public debt – fuelled by sustained pressure on the government to step up public
spending – will weigh on sovereign risk (Bloomberg).
3.1.4.2 Currency risk
Stable. The rand will be supported by fairly robust investment inflows, but it will remain
vulnerable to shifts in global sentiment and local policy developments. Sudden withdrawals of
portfolio flows in the event of a worsening of the crisis in the euro zone will sustain the risk of
volatility (Bloomberg).
3.1.4.3 Banking sector risk
Stable. The banking system will remain sound, supported by strong regulation. Further
underlining banking sector stability, the non- performing loan ratio has returned below the
critical 5% threshold. However, rising costs and the stringent requirements of Basel III represent
significant challenges for local banks (KPMG country profile report).
3.1.4.4 Political risk
According to Bloomberg, the Political uncertainty is set to increase ahead of the ANC party
conference in December 2013. The president, Jacob Zuma, is likely to be re-elected as party
leader, but hardliners could be voted into office, leading to an increasingly populist stance.

Alain Feudjou; FDJALA001 Foreign aid and economic growth in South Africa 33
3.1.4.5 Economic structure risk
A highly diversified export base and a well-regulated financial system underpin the BBB rating.
However, structural constraints, including skills shortages and inefficient parastatal, will
continue to act as a drag on growth (2010 KPMG country profile report). The table below
summarizes the South Africa risk rating.
Table 5: Country risk rating
Sovereign
risk
Currency
risk
Banking
sector risk
Political
risk
Economic
structure risk
Country
risk
August 2012 BBB BBB BBB BBB BBB BBB
Source: 2010 KPMG report; South Africa country profile
3.1.5 South Africa outlook for 2012 – 2016
This section presents the South Africa outlook for 2012 to 2016 in the following sub topic;
economic growth, inflation, exchange rate, external sector and policy trends.
3.1.5.1 Economic growth;
Leading indicators for the first half of 2012 reveal a mixed picture. Sectors with greater export
exposure, particularly manufacturing and mining, have performed much less impressively, held
back by the euro zone debt crisis and global uncertainties. During the 2013 budget speech, Mr.
Pravin Gordhan, South Africa finance minister indicates that the situation may not be sustained,
despite the relatively robust performance of retailing, while other economic sectors remain in the
doldrums. Coupled with the weak and highly uncertain external outlook, the Economist
Intelligence Unit has revised down its forecast for growth to 2.5% in 2012 (from 2.8%) and to
3% in 2013 (from 3.5%). Consumer spending will slacken in the face of weak job creation, high
debt levels and subdued economic activity, despite low interest rates, brisk real wage growth and
adequate credit availability. The government will remain supportive of growth through an
ongoing fiscal stimulus, although private investors will be cautious, especially given uncertainty
about some government policies. The risk of recession is low, but growth will be too sluggish to

Alain Feudjou; FDJALA001 Foreign aid and economic growth in South Africa 34
cut the high unemployment rate, which will continue to constrain aggregate demand. In addition,
the external outlook for 2012 is most uncertain, leaving South Africa highly vulnerable to a
downturn in global growth (Mr. Pravin Gordhan).
3.1.5.2 Policy trends
According to Mr. Trevor Manuel South Africa Minister in the Presidency, Planning, the main
challenge facing policymakers in 2012 will be to expedite the country’s ongoing recovery from
the 2009 recession by maintaining stimulus measures (including a budget deficit and cheap
money) while guarding against macroeconomic imbalances and mitigating the risks associated
with global economic fragility. The main test in the medium term (2013-16) will be to overcome
the structural barriers (such as skills shortages) that prevent South Africa from entering a phase
of faster, more labor-intensive growth. However, the task will be complicated by the emergence
of new policymaking centers such as the National Planning Commission and the Department for
Economic Development, to add to the treasury, the South African Reserve Bank (SARB, the
central bank) and the Department of trade and Industry.
Although new initiatives are needed, especially to deal with deep- rooted problems such as high
unemployment, stark inequality, skills shortages, crime and HIV/AIDS, there is a risk of conflict
and inertia (or both) in the absence of decisive leadership. Mr. Trevor Manuel states that he
expected completion of major infrastructure projects will facilitate business activity, but there
will be new challenges in the form of stricter anti- competition laws and steep rises in electricity
tariffs (2013 budget speech)
3.1.5.3 Inflation
According to KPMG country profile report, sound policies, sluggish consumer demand and spare
industrial capacity will help to keep inflation in check, but upward pressure will come from steep
rises in electricity prices and wage increases. Inflation edged down to a ten-month low of 5.6%
in June, helped by cheaper food, to lie comfortably below the SARB’s 6% target ceiling.
Commodity prices are expected to continue to moderate in 2012-16 and domestic demand to
remain subdued in 2012-14, which will help to curb inflationary pressure. Average inflation will
rise slightly, from 5% in 2011 to 5.3% in 2012, underpinned by wage growth, higher

Alain Feudjou; FDJALA001 Foreign aid and economic growth in South Africa 35
administered prices and a weaker rand. Inflation is expected to return to the 4-5% range 2013-16,
helped by more stable commodity prices, subdued economic growth, stricter competition policy
and efficiency gains arising from infrastructure investment. Except for temporary breaches,
inflation will remain below the 6% target ceiling.
3.1.5.4 Exchange rates
After strengthening in early 2012, helped by a large interest-rate differential with rich-country
markets, the rand encountered volatility in response to renewed global uncertainty and a shift
away from riskier emerging-market assets. After sliding to R8.40: US$1 in June, a three-year
low, the rand strengthened slightly to R8.25: US$1 in July, still 21.4% weaker, year on year.
According to the South Africa Minister of Economic Development: Mr. Ebrahim Patel, the rand
is expected to move within the R8-8.3: US$1 range during the remainder of 2012, despite
inevitable daily volatility, provided that the euro zone debt crisis does not spiral out of control.
Gradual rand depreciation is forecast in 2012-16 because of South Africa’s persistent current-
account deficit, relatively high inflation and political uncertainty surrounding the 2014 election.
The rand is now expected to decline from an average of R7.26: US$1 in 2011 to R8.14: US$1 in
2012 and R8.33: US$1 in 2013. Thereafter, it will drift to R8.95: US$1 in 2016, although
exogenous shocks or unwelcome policy shifts could lead to a faster decline.
3.1.5.5 External sector
According to Bloomberg, South Africa’s current-account deficit is expected to widen from a
provisional 3.4% of GDP in 2011 to 5.2% of GDP in 2012. Export growth will be comparatively
muted in 2012, owing to fragility in key OECD markets and weaker commodity prices, thereby
producing a merchandise trade deficit. However, merchandise exports will grow slightly more
quickly than imports in 2013-16 (on an average annual basis), reflecting a pick-up in global
demand. The far larger invisibles deficit (comprising services, income and current transfers) will
remain large throughout the forecast period, underpinned by income outflows to foreign
investors and transfers to fellow members of the Southern African Customs Union. A gradual
decline in the invisibles deficit in 2013-16 (helped by tourism and income earned by outward
investors), combined with stronger exports, will narrow the current-account deficit from 4.3% of

Alain Feudjou; FDJALA001 Foreign aid and economic growth in South Africa 36
GDP in 2013 to 3.2% in 2015. The gap will widen slightly in 2016, to 3.7% of GDP, as faster
GDP growth and massive latent demand increases imports to US$111.3bn.
3.2 Research design and methodology
The research design that we adopted for the study is descriptive statistics. We use the correlation
analysis to investigate whether there is any existing relationship between foreign aid and
economic growth in South Africa. The strength of the relationship between those two variables is
determined by the correlation coefficient. This is because the data for analysis is not too large
and therefore does not require statistical econometric methods. Yearly GDP values over the
period 1994-2010 are used as a sufficient measure of economic growth. We choose 1994 because
this year is an historic year for South Africa, it’s South Africa transition year to democracy, and
South Africa has generally witnessed economic growth since its transition to democracy in 1994,
the domestic outlook remains positive. 2010 is the year where South Africa hosted its first big
even; 2010 world cup, in 2010, South reveals itself to the world. We are not interested on
assessing whether there is any existing relationship between foreign aid on economic growth in
South Africa after the 2010. From 1994–2010, South Africa experienced an average, annualized
growth rate of approximately 3.4 percent. This growth also coincided with the increase of official
development assistance to South Africa. To answer the question whether there is any existing
significant relationship between Foreign Aid and Economic Growth; descriptive and inferential
analyses are used to analyze the data, all in an effort to investigate the relationship between
foreign aid and economic growth in South Africa. We use the Statistical Package for the Social
Sciences (SPSS) to estimate the result of the correlation between the variables and the T-test to
test the hypothesis of the study.
3.3 Research instrumentation
All analysis in the study is made by the use of secondary data obtained from a secondary source,
namely, the World Bank’s world development indicators database for 2011.

Alain Feudjou; FDJALA001 Foreign aid and economic growth in South Africa 37
3.4 Variables for data collection and procedure for data analysis
The variables for data collection are Official Development Assistance (ODA) net flows to South
Africa, yearly, from 1994 to 2010, GDP per capita values US purchasing power parity ($PPP)
over the same period.
The GDP (Gross Domestic Product) is the monetary value of all the finished goods and services
produced within a country's borders in a specific time period, though GDP is usually calculated
on an annual basis. It includes all of private and public consumption, government outlays,
investments and exports less imports that occur within a defined territory. GDP formula is shows
below;
GDP = C + G + I + NX
Where:
"C" is equal to all private consumption, or consumer spending, in a nation's economy
"G" is the sum of government spending
"I" is the sum of all the country's businesses spending on capital
"NX" is the nation's total net exports, calculated as total exports minus total imports. (NX =
Exports - Imports)
GDP is commonly used as an indicator of the economic health of a country, as well as to gauge a
country's standard of living. Critics of using GDP, as an economic measure say the statistic does
not take into account the underground economy - transactions that, for whatever reason, are not
reported to the government. Others say that GDP is not intended to gauge material well-being,
but serves as a measure of a nation's productivity, which is unrelated.
A correlation is done to assess whether there is any existing relationship between foreign aid and
economic growth. If ODA and the GDP covary, there exists a relationship between foreign aid
and economic growth.
A correlation coefficient is known as a measure of the strength and direction of the linear
relationship between foreign aid and economic growth.

Alain Feudjou; FDJALA001 Foreign aid and economic growth in South Africa 38
3.4.1 Characteristics of correlation coefficient
The correlation coefficient ranges from –1 to +1. The closer to the absolute value is to 1, the
stronger the relationship. When the correlation coefficient is zero, it indicates that there is no
linear relationship between variables. The coefficient can either be positive or negative.
3.4.2 Scatter Plot and Correlation
If r is the correlation coefficient; for any two variables, X and Y, the correlation coefficient
between them is given by the formula:
𝑟 =∑(𝐗 − 𝐗) ∙ (𝐘 − 𝐘)
√∑(𝑿 − 𝐗)𝟐∙ ∑(𝒀 − 𝐘)
𝟐
The characteristic of the relationship is shown on the table below:
Table 6: Characteristic of the relationship
Relationship Correction Index (r)
Strong Correlation
0.85 < r <= 1.00 or
-0.85 > r >= -1.00
Moderate Correlation
0.75 < r <= 0.85 or
-0.75> r >= -0.85
Weak Correlation
0.6< r < =0.75 or
-0.6 > r >= -0.75
No Correlation
0 < r < = 0.6 or
0 > r > = 0.6

Alain Feudjou; FDJALA001 Foreign aid and economic growth in South Africa 39
Source: Table done by myself.
Scatter plot is presented below:
Figure 1: Scatter plot
Source: Figure done by myself
To test the hypothesis, a two-tail test is conducted at 0.02 test level, (+_2.6) with N-2 degrees of
freedom (10-2=8).
Curvilinear relationship Strong negative
correlation
R= -1
Moderate negative correlation
R= -0.6
Strong positive correlation
R= +1 No correlation Moderate positive
correlation
R= +0.75

Alain Feudjou; FDJALA001 Foreign aid and economic growth in South Africa 40
CHAPTER FOUR
DATA PRESENTATION AND ANALYSIS
4.0 Introduction
This chapter presents the data that were collected from all secondary sources namely from the
2011 world development indicators.
Descriptive and inferential analyses are used to analyze the data, all in an effort to investigate
whether there is any existing relationship between foreign aid and economic growth in South
Africa.
4.1 Descriptive analyses
The variables used are the official development assistance (ODA) and the gross domestic product
(GDP) of South Africa from 1994 to 2010.
4.1.1 Official Development Assistance (ODA) to South Africa from 1994 to
2010
The ODA refers to aid flows from official donors to countries and territories in part II of the
Development Assistance Committee (DAC) list of recipients: more advanced countries of
Central and Eastern Europe, the countries of the former Soviet Union, and certain advanced
developing countries and territories. Total official flows are the sum of Official Development
Assistance (ODA) or official aid and Other Official Flows (OOF) and represent the total
disbursements by the official sector at large to the recipient country. OOF are transactions by the
official sector whose main objective is other than development-motivated, or, if development-
motivated, whose grant element is below the 25 per cent threshold which would make them
eligible to be recorded as ODA.
Net official development assistance in the following table consists of disbursements of loans
made on concessional terms (net of repayments of principal) and grants by official agencies of
the members of the Development Assistance Committee (DAC), by multilateral institutions, and

Alain Feudjou; FDJALA001 Foreign aid and economic growth in South Africa 41
by non-DAC countries to promote economic development and welfare in countries and territories
in the DAC list of ODA recipients. It includes loans with a grant element of at least 25 percent
(calculated at a rate of discount of 10 percent). Data are in current U.S. dollars.
The aggregation method used is the sum, and the periodicity is annual.
The following data presents the net official development assistance (ODA) received (current
US$) to South Africa from all donors from 1994 to 2010.
Table 7: Net ODA received (current US$) to South Africa from 1994 to 2010.
Source: 2011 World development indicators
The table 6 indicates that the amount of ODA received to South Africa was $293 million in 1994,
it increased from $293 in 1994 to $540 million in 1999, which was the post apartheid period, just
after the first democratic election in South Africa. This amount reduced slightly from $486 in
2000 to $425 million in 2001 when South Africa first democratic elected president Mr. Nelson
YEAR AMOUNT IN CURRENT PRICES (MILLIONS OF US
DOLLARS)
1994 293
1995 386
1996 362
1997 496
1998 513
1999 540
2000 486
2001 425
2002 511
2003 656
2004 629
2005 690
2006 715
2007 807
2008 1 125
2009 1 075
2010 1 032

Alain Feudjou; FDJALA001 Foreign aid and economic growth in South Africa 42
Mandela decided to step down. The amount of ODA to South Africa (SA) started picking up
from $511 in 2008 to $1,125 million in 2008, showing South Africa good economics’ era.
According to the World Health Organization, this period is also marked by the increase of
number of human death in South Africa due to HIV-AIDS, tuberculosis, diarrhea, and childhood
diseases. During this period, many developed and developing countries and international
organization are willing to help SA to develop his economy and to fight those diseases. Some of
these international organizations will double the amount of ODA to SA. The *big push*
campaign initiated by the former British Prime Minister Mr. Tony Blair will also contribute to
increase the amount of ODA to SA. From 2008 to 2010 ODA to SA reduced from $1,125 to
$1,032 million due to the global financial crisis. The figure below shows the graphic of the radar
of the net ODA to SA from 1994 to 2010.
Figure 2: net ODA to SA from 1994 to 2010
Source: Figure done by myself.
4.1.2 South Africa Gross Domestic Product (GDP) from 1994 to 2010
The following table shows South Africa GDP from 1994 to 2010.
19941995
1996
1997
1998
1999
2000
200120022003
2004
2005
2006
2007
2008
2009
2010
17 386
362 496 513
540 486
425 511 656
629 690
715
807
1 125
1 075 1 032
0
500
1000
1500
2000
25001
2
3
4
5
6
7
8910
11
12
13
14
15
16
17
Net ODA to SA from 1994 to 2010
YEAR AMOUNT IN CURRENT PRICES (MILLIONS OF US DOLLARS)
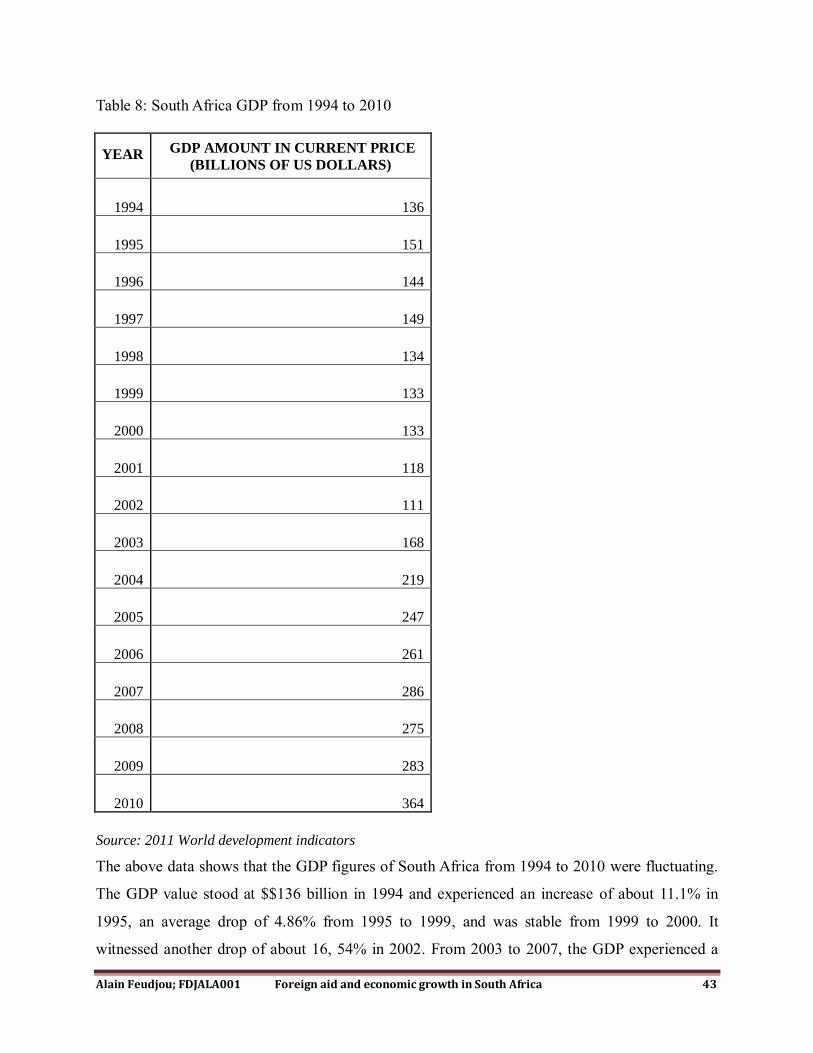
Alain Feudjou; FDJALA001 Foreign aid and economic growth in South Africa 43
Table 8: South Africa GDP from 1994 to 2010
YEAR GDP AMOUNT IN CURRENT PRICE
(BILLIONS OF US DOLLARS)
1994 136
1995 151
1996 144
1997 149
1998 134
1999 133
2000 133
2001 118
2002 111
2003 168
2004 219
2005 247
2006 261
2007 286
2008 275
2009 283
2010 364
Source: 2011 World development indicators
The above data shows that the GDP figures of South Africa from 1994 to 2010 were fluctuating.
The GDP value stood at $$136 billion in 1994 and experienced an increase of about 11.1% in
1995, an average drop of 4.86% from 1995 to 1999, and was stable from 1999 to 2000. It
witnessed another drop of about 16, 54% in 2002. From 2003 to 2007, the GDP experienced a
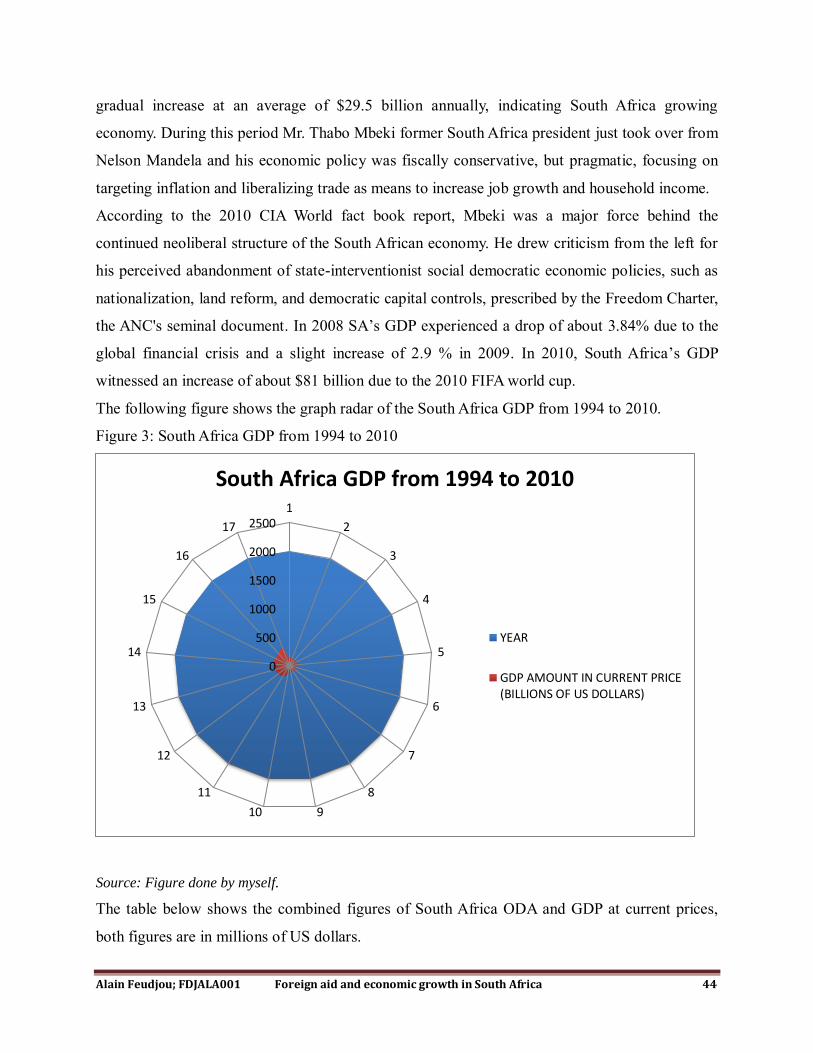
Alain Feudjou; FDJALA001 Foreign aid and economic growth in South Africa 44
gradual increase at an average of $29.5 billion annually, indicating South Africa growing
economy. During this period Mr. Thabo Mbeki former South Africa president just took over from
Nelson Mandela and his economic policy was fiscally conservative, but pragmatic, focusing on
targeting inflation and liberalizing trade as means to increase job growth and household income.
According to the 2010 CIA World fact book report, Mbeki was a major force behind the
continued neoliberal structure of the South African economy. He drew criticism from the left for
his perceived abandonment of state-interventionist social democratic economic policies, such as
nationalization, land reform, and democratic capital controls, prescribed by the Freedom Charter,
the ANC's seminal document. In 2008 SA’s GDP experienced a drop of about 3.84% due to the
global financial crisis and a slight increase of 2.9 % in 2009. In 2010, South Africa’s GDP
witnessed an increase of about $81 billion due to the 2010 FIFA world cup.
The following figure shows the graph radar of the South Africa GDP from 1994 to 2010.
Figure 3: South Africa GDP from 1994 to 2010
Source: Figure done by myself.
The table below shows the combined figures of South Africa ODA and GDP at current prices,
both figures are in millions of US dollars.
0
500
1000
1500
2000
25001
2
3
4
5
6
7
8
910
11
12
13
14
15
16
17
South Africa GDP from 1994 to 2010
YEAR
GDP AMOUNT IN CURRENT PRICE(BILLIONS OF US DOLLARS)

Alain Feudjou; FDJALA001 Foreign aid and economic growth in South Africa 45
Table 9: South Africa ODA and GDP from 1994 to 2010 in millions of US dollars.
YEAR ODA GDP
1994 293 135 778
1995 386 151 113
1996 362 143 732
1997 496 148 814
1998 513 134 296
1999 540 133 184
2000 486 132 878
2001 425 118 479
2002 511 111 101
2003 656 168 219
2004 629 219 093
2005 690 247 052
2006 715 261 007
2007 807 286 169
2008 1 125 275 279
2009 1 075 282 754
2010 1 032 363 910
Source: Computation done by myself.

Alain Feudjou; FDJALA001 Foreign aid and economic growth in South Africa 46
4.2 Inference analysis
4.2.1 Introduction
This section will test the hypothesis
4.2.2 Hypothesis
The hypotheses that guide this study are:
• Ho: There is no relationship between foreign aid and economic growth in South Africa.
• H1: There is a relationship between foreign aid and economic growth in South Africa
Values for ODA and GDP were entered into a Statistical Package for the Social Science (SPSS)
spreadsheet and the Pearson Moment Correlation was computed. The result is shown in tables
below:
Table 10: Descriptive statistics ODA and GDP
Alpha value (for confidence interval) 0,02
(ODA)
Count 17
Mean 631,91588
Variance 63 015,51563
Standard Deviation 251,02891
Mean Standard Error 60,88345
(GDP)
Count 17
Mean 194 873,96069
Variance 5 862 914 714,46894
Standard Deviation 76 569,67229
Mean Standard Error 18 570,87333
Source: Computation done by myself.
The table shows that the study is for a period of 17 years with an alpha value of 0,02. The table
also shows the mean the variance, the standard deviation and the mean standard error for both
variables. The table indicates that the mean of ODA to SA is $631,91588 million with a standard

Alain Feudjou; FDJALA001 Foreign aid and economic growth in South Africa 47
deviation of $251,02891 million and the mean of the GDP is $194 873,96069 million with a
standard deviation of $76 569,67229 million. The mean standard error is $60,88345 for ODA
and $18 570,87333 million for GDP.
Table 11: Correlation coefficient
Correlation Coefficients
Sample size 17 Critical value (2%) 2,60248
ODA GDP
ODA Pearson Correlation Coefficient 1,
GDP Pearson Correlation Coefficient 0,87348 1,
GDP vs. ODA 0,87348
Source: Computation done by myself.
The table shows a correlation coefficient of 0.87348, which is an indication of a positive strong
relationship between foreign aid and economic growth in South Africa. To test the hypothesis, a
two-tail test was conducted at 0.02 test level, (+_2.6) with N-2 degrees of freedom (10-2=8). The
results are presented on the table below.
Table 12: correlation coefficient and critical value
Sample size 17 Critical value (2%) 2,60248
ODA GDP
ODA Pearson Correlation Coefficient 1, R Standard Error
T
P-value
GDP Pearson Correlation Coefficient 0,87348 1, R Standard Error 0,0158
T 6,9484
P-value 0,
Source: Computation done by myself.
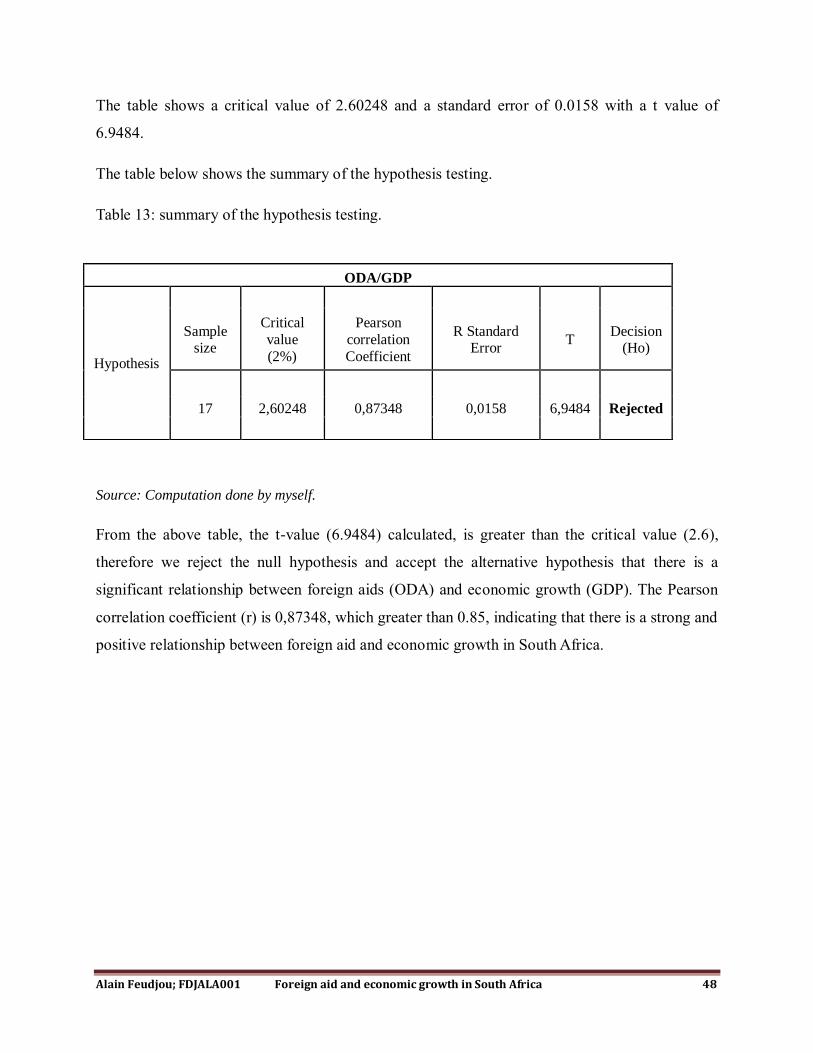
Alain Feudjou; FDJALA001 Foreign aid and economic growth in South Africa 48
The table shows a critical value of 2.60248 and a standard error of 0.0158 with a t value of
6.9484.
The table below shows the summary of the hypothesis testing.
Table 13: summary of the hypothesis testing.
Source: Computation done by myself.
From the above table, the t-value (6.9484) calculated, is greater than the critical value (2.6),
therefore we reject the null hypothesis and accept the alternative hypothesis that there is a
significant relationship between foreign aids (ODA) and economic growth (GDP). The Pearson
correlation coefficient (r) is 0,87348, which greater than 0.85, indicating that there is a strong and
positive relationship between foreign aid and economic growth in South Africa.
ODA/GDP
Hypothesis
Sample size
Critical
value
(2%)
Pearson
correlation
Coefficient
R Standard Error
T Decision
(Ho)
17 2,60248 0,87348 0,0158 6,9484 Rejected

Alain Feudjou; FDJALA001 Foreign aid and economic growth in South Africa 49
CHAPTER FIVE
SUMMARY OF FINDING AND RECOMMENDATION
5.0 Introduction
This chapter summarized the work, made recommendations based on the findings.
5.1 Summary of findings
Our research question was; is there any significant relationship between Foreign Aid and
Economic Growth in South Africa?
Statistics from table 7 and 8 on ODA and GDP values for South Africa respectively, from 1994
to 2010, and the results of the Pearson Correlation Coefficient computed in table 11 and 12, show
that there is a strong and significant relationship between foreign aid and economic growth in
South Africa. Table 11 shows that the hypothesis Ho is rejected. This implies that there is a
positive relationship between ODA and GDP. The findings show that foreign aid contributes to
economic growth in South Africa.
5.2 Recommendations
The Pearson correlation coefficient between ODA and GDP from 1994 and 2010 is 0,87348.
Despite the fact that there is a positive and strong relationship between foreign aid and economic
growth in South Africa, a lot still need to be done in order for foreign aid to effectively impact
economic growth in South Africa. To achieve this objective, foreign aid need to be effectively
managed and the government of South Africa should fight against corruption in order to avoid
the fungibility of aid.
The following measures can be taken in order to effectively manage foreign aid and fight against
corruption;
The government of South Africa should divert a larger portion of aid to investment in
agriculture because according to the CIA 2010 world fact book, its agriculture products
are very rich and only about 9% of its labor force has agriculture as an occupation.

Alain Feudjou; FDJALA001 Foreign aid and economic growth in South Africa 50
Agriculture contribute only 2,5% of South Africa’s GDP. Agricultural trade liberalization
is particularly important and growth in agriculture has a disproportionate effect on
poverty reduction.
The efforts of various aid donors to South Africa must be well coordinated because
concerted action avoids duplication and wastage of scarce resources.
South Africa real GDP real growth rate was estimated to 2,9% in 2010, country
comparison to the world 105. South Africa should divert another larger portion of aid to
investment in education in order to ease employment and foster economic growth, South
Africa unemployment rate was estimated to 24,9% in 2010.
Funding and enough resources should also be diverted to civic education to help South
Africans be informed about the roles and responsibilities of their elected representatives.
Aid donors should provide a framework for the implementation aid funds. Aid can and
does have an impact when provided within a framework that acknowledges the drivers
for broad based growth. Well-targeted aid increases the ability of South Africa to
maximize the benefits of trade liberalization, improve the environment for investment
and ensure that the poor have the ability to contribute in achieving growth.
South Africa witnessed a GDP growth of about $81 billion in 2010. Basic social
indicators still remain some of the worst in the world. There are many reasons for this but
the most important are; corruption, and relatively poor governance, which have allowed
revenue windfalls to be squandered and have impeded growth. Corruption has a
substantial negative impact on economic growth and development and weakens
institutions and government. The costs of corruption fall disproportionately on poor
people. In order to solve this problem, the following measures have been recommended:
o Systematic anti-corruption reform should be implemented and should be driven from within.
Efforts to combat corruption are most successful when change is driven internally, and when
political leadership is strong. The private sector and citizens have a major role and responsibility
in fighting corruption and therefore should well encourage. Industry representatives, including
trade unions, have proven to be strong champions and thus should be encouraged.
o To be effective, anti-corruption strategies must adapt to meet emerging challenges.
o An Anti-corruption strategies for South Africa must be long term and multifaceted. An effective
anti-corruption strategy requires a multi-pronged approach. It needs to draw on successful

Alain Feudjou; FDJALA001 Foreign aid and economic growth in South Africa 51
strategies that support local reform constituencies, reduce opportunities for corruption, and
provide positive and negative incentives.
o Donor priorities and responses must be informed by local needs, identified through South
Africa’s anti-corruption planning. This will determine the scope, sequence and speed of
assistance, as well as where emphasis is warranted. For example, where political will is weak,
engagement with civil society will be the key to success.
o The South Africa women should be given a greater chance in administration, economy and
politics because women are less prone to corruption than men. The linkages between gender
equality and anti-corruption can be promoted, for example, by introducing anti-corruption
measures alongside support for anti-discrimination measures
o The civil society groups, churches, the media, and nonprofit organizations that have the capacity
to gather information on the incidence of corruption in South Africa should be supported, to
promote awareness among constituencies most affected by corrupt activities, improve
understanding of public processes, monitor government activities, and report cases of corruption.

Alain Feudjou; FDJALA001 Foreign aid and economic growth in South Africa 52
CHAPTER SIX
CONCLUSION
6.1 Conclusion
The purpose of this analysis was to determine whether there is any existing relationship between
official development assistance and economic growth. The model developed in this paper
provides evidence supporting the contention that there is a strong and positive relationship
between foreign aid and economic growth. Foreign aid positively impacts economic growth in
South Africa. Therefore, it is not in the interest of developed countries and international bodies
to discontinue aid programs. Moreover, it would be extremely difficult for a donor country to
stop aid since it would be seen by both the domestic and foreign populations as punishing an
already poor country.
The issue of whether foreign aid leads to economic growth is still debatable one. What is clear is
that the impact may be significant or insignificant depending on the country understudy, type of
aid, the adjective of the donor country, the implementation policy of the recipient country, the
methodology used, and the period of study.
However, the effects of aid on economic growth are modest, and fostering economic growth
through foreign aid would be incredibly inefficient and expensive. For instance, using foreign
aid alone to increase GDP by 1% in a country would require an expensive foreign aid package.
Spurring economic growth in South Africa to desirable levels would be an enormous
expenditure.
Efficient infrastructures and institutions might make foreign aid donations more effective in
South Africa. As an upper middle-income country, South Africa has good fiscal policies in
place. These policies can include maintaining small budget deficits, controlling inflation, and
being open to global trade. South Africa build its record of prudent macroeconomic and fiscal
management; use public resources more effectively to alleviate poverty and improve service
delivery; expand capital infrastructure projects that boost capacity and productivity over the
longer term; lower the costs of doing business; take steps to promote a well-regulated
environment for the private sector to expand and thrive; and focus on regional and international

Alain Feudjou; FDJALA001 Foreign aid and economic growth in South Africa 53
partnerships to expand and diversify trade and investment. Donor governments and multilateral
institutions should continue to push economic reforms and trade liberalization on recipient
governments. Not only will this improve the effectiveness of foreign aid, but it will also result in
less aid being required.
Success in these areas lays the foundation for strong, sustainable growth and job creation.
6.2 Suggestions for further Research
Many studies have tried to assess the effectiveness of aid at different level. While micro-
evaluations have found that in most cases aid positively impact economic growth, those at the
macro-level are ambiguous.
Future research should further explore the role of sound economic policies and good governance
in aid effectiveness. Scholars should also explore other ways of quantifying tropical geography,
and governance to provide for additional testing of potential impacts on the effectiveness of
foreign aid. Research can be carried out on the effectiveness of foreign aid, or corruption and its
impact on growth and development in South Africa
Finally, future study of foreign aid should also investigate its effects on economic development,
instead of growth. Doing so will shed light on the question of whether the growth caused by
foreign aid translate to economic development or whether it improves the quality of life in
developing countries.

Alain Feudjou; FDJALA001 Foreign aid and economic growth in South Africa 54
REFERENCES
1. CIA World Fact book (2010).
2. KPMG South Africa country profile (2010).
3. Millennium development goal in SA MDGR,(2010).
4. World Bank (2011). World Bank’s world development indicators database.
5. Alesina, A., & Dollar, D (1998). Who gives foreign aid to whom and why? NBER Working
Paper No. 6612.
6. Ali, M., & Isse, S. (2005). An empirical analysis of the effect of aid on growth. International
Advances in Economic Research 11 (2005): 1-11. JSTOR. Gumberg Library, Pittsburgh, PA.
2 Oct. 2006.
7. Bourguignon, F., & Morrison, C. (1998). Inequality and development: the role of dualism.
Journal of Development Economics, 57, 233-257.
8. Burnside, C., & Dollar, D. (1998). Aid, the incentive regime, and poverty reduction. Policy
Research Working Paper 1937. World Bank, Development Research Group, Washington
D.C.
9. Burnside, C., & Dollar, D. (2000). Aid, policies, and growth. The American Economic
Review, 90(4)), 847-868.
10. Charles, J. (2002). Introduction to economic growth. 2nd edition. Norton and Company New
York.
11. Chenery, B., & Strout, A. (1966). Foreign assistance and economic development. American
Economic Review. September, 56(4), 679–733.
12. Chenery, B., & Carter, G. (1973). Foreign assistance and development performance, 1960-
1970. American Economic Association, 63,2.
13. Cleveland, H. (2006). Purposes of international aid programs. Scientific Monthly 85 (1957,
77-81.
14. Collier, P., & Dehn, J. (2001). Aid, shocks and growth. Working Paper No. 2688, World
Bank.
15. Collier, P., & Dollar D. (2002). Aid allocation and poverty reduction. European Economic
Review, 46(8), 1475 – 500.
16. Collodel., A. (2011). Evaluation of the impact of foreign aid on growth and development.

Alain Feudjou; FDJALA001 Foreign aid and economic growth in South Africa 55
17. Dacy, C. (2006). Foreign aid, government consumption, saving, and growth in less-
developed countries. The Economic Journal, 85 (1975), 548-562.
18. Dalgaard, C., & Hansen H. (2001). On aid, growth and good policies. Journal of
Development Studies, 37(6), 17 – 41.
19. Devarajan S., Miller M., & Swanson E. (2002). Goals for development: history, prospects
and costs. Working Paper 2819, The World Bank, Washington D. C.
20. Durbarry, R., Gemmell, N., & Greenaway, D (2006). New evidence on the impact of foreign
aid on growth. Center for Research in Economic Development and International Trade .98
(1998), Washington D.C
21. Easterly, W. (2003). Can foreign aid buy growth? Journal of Economic Perspectives, 17(3),
23 – 48.
22. Easterly, W., Levine, R., & Roodman, D. (2004). Aid, policies, and growth: Comment. The
American Economic Review, 94(3), 774-780.
23. Easterly, W. (2006). Does foreign aid add up? Foreign Policy, 125 (125), 94.
24. Ekanayake, E. (2009). The effect of foreign aid on economic growth in developing countries.
Journal of International Business and Cultural Studies, 20-24.
25. Fayissa, B., & El-Kaissy, M. (1999). Foreign aid and economic growth of developing
countries (LDCs): Further evidence. Studies in Comparative International Development, 70-
74.
26. Gomanee, K., & Morrissey, O. (2002). Evaluating aid effectiveness against a poverty
reduction criterion. DESG Conference Paper, Nottingham, April 2002.
27. Guillaumont P., & Chauvet L. (2001). Aid and Performance: A reassessment. Journal of
Development Studies, 37,66 – 92.
28. Gunning, W. (2006). Why give aid. Development aid: Why and how? 2nd AFD-EUDN
Conference, Paris.
29. Hansen, H., & Tarp, F. (2001). Aid and growth regressions. Journal of Development
Economics, 64, 547–570.
30. Harms P., & Lutz M. (2004). The macroeconomic effects of foreign aid: A Suvey.
Department of Economics, University of St. Gallen.
31. Hjertholm, P., & White, H. (2000). Survey of foreign aid: History, trends, and allocation.
University of Copenhagen Institute of Economics Discussion Papers. Copenhagen
Alain Feudjou; FDJALA001 Foreign aid and economic growth in South Africa 56
32. Irandousta., M., & Ericsson, J. (2005). Foreign aid, domestic savings, and growth in LDCs:
An application of likelihood-based panel cointegration. Economic Modeling, 22, 616– 627.
33. Jhigan, M.L. (2001). The economics of development and planning. 33rd Revised and
Enlarged Edition, Vrinda Publications (P) Ltd. Washington D.C.
34. Kargbo, M.P. (2012). Impact of foreign aid on economic growth in Sierra Leone; Empirical
Analysis Working Paper No. 2012/07. Sierra Leone.
35. Knack, S. (2000). Aid dependence and the quality of governance: A Cross-Country
Empirical Analysis. World Bank Policy Research Paper.
36. Lensink, R., & White H. (2001). Are there negative returns to aid? Journal of development
Studies, August, 37(6), 42 – 65.
37. Mbaku, J.M. (1993). Foreign aid and economic growth in Cameroon. Applied Economics,
25,1309-14.
38. McKinnon R. (1964). Foreign-exchange constraints in economic development and efficient
aid allocation. The Economic Journal, 74,388 – 409.
39. Murphy R. G., & Tresp N. G (2006). Government policy and the effectiveness of foreign aid.
Department of Economics, Botson College. Boston.
40. Moreira, S.B. (2005). Evaluating the impact of foreign aid on economic groath: A cross-
country study. Journal of economic development 25.Volume 30, Number 2, December 2005.
41. Morrissey,O. (2001). Does aid increase growth? Progress in Development Studies 1, (1), 37-
50.
42. Mosley, P., & Hudson, J. (2001). Aid, poverty reduction and the new conditionality, mimeos.
43. Ouattara, B. (2003). Foreign aid, saving displacement and aid dependency in Cote d’Ivoire:
An aid disaggregation approach. University of Manchester, School of Economic Studies.
Manchester.
44. Papanek, G. (1972). The effect of aid and other resource transfers on savings and growth in
less developed countries. Economics Journal, 82.
45. Papanek, G. (1973). Aid, foreign private investment, savings and growth in Less Developed
Countries. Journal of Political Economy, 81, 120-130.
46. Pedersen, R. (1996). Aid, investment and incentives. Scandinavian Journal of Economics
98(3), 423-438.

Alain Feudjou; FDJALA001 Foreign aid and economic growth in South Africa 57
47. Rajan, G., & Subramanian, A. (2005). Aid and growth: What does the cross-country evidence
really show? International Monetary Fund Working Papers 05. Washington D.C
48. Sachs, J., & Andrew Warner, A. (1996). Sources of slow growth in African Economies.
Harvard Institute for International Development, Development Discussion Papers 545.
49. Singh, D. (1985). State intervention, foreign economic aid, savings and growth in LDCs:
Some Recent Evidence. KYKLOS, 38(2), 216-232.
50. Snyder, W. (1993). Donor bias toward small countries: An overlooked factor in the analysis
of foreign aid and economic growth. Applied Economics, 25, 481-488.
51. Svensson, J. (1998). Foreign aid and rent seeking. World Bank Policy Research Paper 1880.
Gumberg Library, Pittsburgh, PA.
52. Tarp, F. (2000). Foreign aid and development: Lessons learnt and directions for the future.
New York: Routledge.