material properties of islamic paper - ucl discoverydiscovery.ucl.ac.uk/1527462/1/2016 mahgoub...
TRANSCRIPT
Mahgoub et al. Herit Sci (2016) 4:34 DOI 10.1186/s40494-016-0103-4
RESEARCH ARTICLE
Material properties of Islamic paperHend Mahgoub1*, Tiphaine Bardon1, Dirk Lichtblau2, Tom Fearn3 and Matija Strlič1
Abstract
In contrast to scientific research focussing on European paper, there is a significant gap in our knowledge of Islamic papermaking. This research surveys the evidence of techniques and materials typically used in Islamic papermaking, to deduce what might be considered as the most significant characteristics. A substantial collection of 228 Islamic papers (~18th–20th century) was characterized using chemical analytical methods: surface profilometry, gloss meas-urements, specular vs. diffuse reflectance ratio at 457 nm, scanning electron microscopy and infrared spectroscopy for identification of polishing, iodine test for identification of starch, Raspail test for identification of rosin, and fibre furnish analysis. Morphological analysis was performed to examine the presence of watermarks and sieve patterns. In addition, acidity and degree of polymerization of cellulose in paper were determined to explore the average mate-rial state of paper in the collection. Near infrared spectroscopic data of the collection were correlated to chemical properties with the aid of multivariate data analysis methods. Four different models were developed focusing on two main characteristics of Islamic paper: two for identification of polishing and starch, and two quantitative models to determine the acidity and degree of polymerization of cellulose in paper. While no single defining characteristic of Islamic paper was identified, 88 % of all papers in the studied collection either contain starch or are polished, or both. ~2 % of papers contain rosin. The majority of papers are neutral to mildly acidic, which is in contrast to their extensive degradation: ~69 % have DP < 1000. Polishing and starch appear to be associated with current values of pH and DP. The developed non-destructive characterization methodology could be applied to Islamic collections in libraries and archives to expand the database with the material properties of papers of known age and provenance and thus bet-ter understand geographic and temporal distributions of papermaking practices in Islamic countries.
Keywords: Near infrared spectroscopy, Chemometrics, Non-destructive characterization, Polishing, Starch
© 2016 The Author(s). This article is distributed under the terms of the Creative Commons Attribution 4.0 International License (http://creativecommons.org/licenses/by/4.0/), which permits unrestricted use, distribution, and reproduction in any medium, provided you give appropriate credit to the original author(s) and the source, provide a link to the Creative Commons license, and indicate if changes were made. The Creative Commons Public Domain Dedication waiver (http://creativecommons.org/publicdomain/zero/1.0/) applies to the data made available in this article, unless otherwise stated.
BackgroundAs an information carrier, paper has a significant role in history and culture [1, 2]. Yet, although the craft origi-nated in China, the focus of much of recent research has been on Western papermaking. Material properties of paper changed as the knowledge of its production trav-elled from China through central Asia until it reached the West [1–4]. It is well known that Islamic papermak-ers utilized techniques and processes not often used else-where, such as surface polishing, starch sizing or dyeing and decoration, which appear to make Islamic paper dis-tinct from Indic, Sino-Asian or European [2, 4–8]. How-ever, it is as yet unknown how geographically distinct
and widespread these techniques were and whether they affect paper stability.
For the purpose of this paper, we define ‘Islamic paper’ as paper that has been produced in the Islamic cultural realm, i.e. in Arab, Persian or Turkic territories. There could well be regional differences in the history and techniques of papermaking; however, there is currently insufficient knowledge to distinguish them. There is a sig-nificant gap in the knowledge of what Islamic paper is, as provenancing can only be achieved by historical, palaeo-graphical and codicological research [8], and scientific understanding of Islamic paper is almost entirely lacking.
We also know little about what proportion of Islamic paper constitutes manuscripts in Islamic library collec-tions, especially since intensive trade led to significant imports of European paper into Islamic countries from the 17th century on [2, 4, 6, 8]. There is a strong relation-ship between the durability of paper and the materials
Open Access
*Correspondence: [email protected] 1 Institute for Sustainable Heritage, University College London, London, UKFull list of author information is available at the end of the article

Page 2 of 14Mahgoub et al. Herit Sci (2016) 4:34
and techniques used in its production, e.g. the effect of alum-rosin sizing on European paper [9, 10], widely used as a sizing material since the second half of the 19th cen-tury [11, 12]. Gaining such knowledge would help cus-todians of Islamic paper collections to understand the materials and develop more sustainable preservation plans [10].
Palaeography is important in this analysis, however, dating and provenancing of text may not reveal any infor-mation about its carrier due to trade, although a manu-script dated to the 11th century CE or earlier could not have been produced in Europe. Paper morphology, par-ticularly watermarks, is an aspect of European paper-making that is often used for identification, however, in Islamic papermaking watermarks were not common. On the other hand, physical features such as sheet dimen-sion, thickness, colour and paper mould construction [4, 5, 8, 13] are sometimes found to be specific to a geo-graphic region and era. It is as yet unknown how such features could be used to identify Islamic paper in librar-ies and archives and if their absence is a conclusive proof of non-Islamic origin.
Paper fibres can be of decisive importance, as was shown, e.g. for Tibetan paper [14]. However, we currently have no knowledge of, or historical information on, the use of particular fibres in Islamic papermaking, although bast and cotton have been used, as was the case of Euro-pean papermaking [4, 7, 8, 13, 15]. More fibre furnish studies might reveal the presence of less usual fibres such as papyrus, rice, or silk.
We do know, however, that distinct papermaking tech-niques were used such as sizing with starch (which was rare in European papermaking after the introduction of gelatine sizing in the late 13th century [16, 17], polishing either with or without additives (egg white, gum traga-canth), dyeing and other forms of decoration [2, 4, 6, 8, 13, 16, 18, 19]. Some of these techniques were also in use in Chinese and (early) European papermaking, so there may well not be a unique characteristic of Islamic paper-making [8, 16]. Moreover, finishing techniques such as surface sizing and polishing can be applied separately and in addition to the original production process, and thus make the process of establishing the origin of a paper even more difficult. Multidisciplinary studies may well be required: palaeography for the identification of date and place of paper use, codicology for the identification of morphological characteristics and production techniques and scientific analysis for the identification of paper-making materials. Figure 1 shows some diversity that is encountered in Islamic paper collections with respect to paper quality, use of ink and decoration.
Numerous scientific methods are used to study paper and pulp [10, 20, 21] although non-destructive
techniques requiring neither sampling nor sample prep-aration are preferred when dealing with historic objects [20, 22, 23]. Near infrared (NIR) spectroscopy has been successfully used in studies of a variety of heritage mate-rials [23, 24] as it reflects combination and overtone vibrations associated with C–H, O–H and N–H chemi-cal bonds [20, 25]. Spectral data can be used to classify or estimate properties of unknown samples when combined with multivariate data analysis based on a correlation with physical properties obtained from reference analyti-cal methods applied to well-characterized and represent-ative samples [23–26].
This research focusses on the development of a non-destructive characterization methodology of Islamic paper using NIR spectroscopy accompanied by multivari-ate data analysis. A reference database of Islamic papers from sources in the Near East, Central Asia and North Africa was collected for the purpose of material analysis. Several standard characterization methods were used for identification of polishing and sizing, and for fibre furnish analysis. We also determined the pH and degree of polym-erization (DP) of cellulose in paper in order to assess the current material state of the collection (Table 1).
MethodsReference collectionA substantial collection of 228 papers was collected at UCL Institute for Sustainable Heritage from differ-ent sources in Central Asia, Near East and North Africa (15th–19th century) for the purpose of material analysis (ref-collection). Most of the samples are written in Ara-bic (168), several in Coptic script or Persian and Turkic languages. 31 samples are from Samarqand (Uzbekistan). For the majority of papers (133), the date is unknown, while 83 are from 18th to 19th century and 10 are older.
Fig. 1 Two objects in the historic reference material collection at UCL Institute for Sustainable Heritage (Left: AP 85, right: AP 53)

Page 3 of 14Mahgoub et al. Herit Sci (2016) 4:34
Unfortunately, no clear information is available about the provenance, date or history of the storage environment for these samples. Samples without ink or soiling were cut from the paper sheets, away from the margins, for investigation.
The collection was visually examined and digitally doc-umented before sampling. For digitization and morpho-logical measurements, a light table, rulers, digital calliper and a Nikon-D300s DSLR camera were used. All meas-urements, observations and images were recorded per catalogue number (Arabic paper—AP) thus building a reference database. All samples were given a unique ID, consisting of “AP” followed by an incremental number. Sheets from the same bound volume were considered as sub-samples e.g. AP 1-1 and AP 1-2.
Sizing characterizationStarchThe iodine test [6, 27] was used to establish the pres-ence of starch. The I2 solution was prepared by adding 5 g of I2 (≥99.8 %, Sigma Aldrich, Dorset) to 10 g of KI (crystals, Sigma Aldrich, Dorset) dissolved in 100 ml of deionized water. After dissolution, the prepared solution was diluted 1:4 before use. One drop of the diluted solu-tion was then added to ~0.5 cm2 of paper sample. Colour change was observed under low magnification.
RosinThe presence of rosin was tested using the Raspail test [27, 28] for samples that tested negatively for starch. In addition, 35 starch-sized samples were randomly selected to explore the possibility of rosin and starch being pre-sent in the same sample.
One drop of a sucrose solution (35 g sucrose, ≥99.5 %, Sigma Aldrich, Dorset, in 20 ml deionized water) was added to ~0.5 cm2 of paper sample and left for 3 min to allow for the solution to penetrate into the sample. Any excess was removed using filter paper. A drop of con-centrated H2SO4 (95–97 %, Merck, Darmstadt) was then added. Colour change was observed under low magnification.
Surface characterizationSurface polishing of Islamic papers was executed to dif-ferent levels of quality and shine [4, 7, 8] and occasion-ally, a polished surface is difficult to assess by appearance (sheen, or occasionally only sheen marks) or by touch. Polishing was assessed visually and the ref-collection was divided into ‘Polished’, ‘Unpolished’ and ‘Uncertain’ categories. Reflection of light from surfaces depends on surface roughness [29], which can be measured in a variety of ways. Thus, in addition to visual assessment,
roughness and gloss measurements were carried out, the ratio between specular and diffusely reflected light was determined, and scanning electron microscopy (SEM) was used, in order to find an instrumental method to reduce the subjectivity of visual assessment.
RoughnessRoughness is a good indication of surface texture and irregularities [30]. A TRACEiT profilometer (Innowep, Würzburg) was used. The topographic roughness param-eter Ra [29] was determined in both directions (x and y) with the resolution of 1536 lines per 5 mm. The arithme-tic average was calculated.
GlossNovo-Gloss Lite 45o glossmeter (Rhopoint Instruments, St Leonards) with a resolution of 0.1 gloss units (GU) was used. The measurements were collected at 20o. The aver-age gloss value was calculated from ~10 random meas-urements, on both sides of each sheet.
Specular/diffuse reflectance ratioSimilarly to gloss, the principle of this method is to assess the relation between the reflectance of a surface and its roughness [29, 31, 32]. The ratio of intensity of reflected light at 457 nm was determined using a Lab-Spec-5000 spectrometer (ASD, Boulder) at two differ-ent angles relative to the incident beam (0o, 45o). This wavelength was selected as it is used to measure paper brightness [33, 34]. Using the ratio rather than abso-lute values also corrected for any influence of potential chromophores.
Scanning electron microscopy (SEM) imagingTM3030 tabletop scanning electron microscope (Hitachi, Tokyo) in charge-up reduction mode was used to obtain surface topography images. A 5 × 5 mm piece was used without any sample preparation. Images were collected using low accelerating voltage (5 kV) and magnification of 100×.
Fourier transform infrared (FTIR) spectroscopyBruker (Coventry) Alpha ATR-FTIR spectrometer with OPUS software (version 6.5) was used to identify egg white and gum tragacanth as polishing materials [4, 7, 13, 18, 19]. 64 scans were acquired with a resolution of 4 cm−1 over the range 4000–400 cm−1, and averaged to produce the absorbance spectrum. Laboratory-made reference samples of Whatman No. 1 paper (What-man, Maidstone) sized with egg white (from fresh eggs) and gum tragacanth (Cornelissen & Son, London) were prepared.

Page 4 of 14Mahgoub et al. Herit Sci (2016) 4:34
Fibre furnishThe standard procedure [35] was followed using the Her-zberg reagent to investigate fibre composition of samples from the ref-collection. As this analysis is a time con-suming process, 15 samples were selected randomly to explore Islamic papers’ fibres (Table 2). The samples were examined using optical microscopy (Brunel Microscopes Ltd, Wiltshire) equipped with a DSLR camera (Canon EOS 1100D) under transmitted light with and without staining. Fibre identification was based on morphological characteristics [20, 36].
AcidityA modified standard cold extraction procedure [38] was used to measure the pH of 70 samples from the ref-collection. Mettler Toledo (Leicester) SevenGo pH/Ion Meter with a micro-combined glass electrode (diam-eter 3 mm, InLab® Micro, 51343160) was used. Samples (~1.14 mg in ~0.1 ml water) were taken out of the extrac-tion liquid during measurement. All values were rounded to the nearest 0.1 pH unit [38, 39].
Degree of polymerizationThe standard method [40] was used. For each sample, 3–5 repeated measurements of effluent time were per-formed and the average was used for calculating the DP using Mark–Houwink–Sakurada equation [41]. The uncertainty of DP determination of a Whatman No. 1 fil-ter paper (Maidstone) sample was <1 % (n = 3).
Due to the limited availability of historic samples, it was not possible to determine either water content or
the content of non-cellulosic additives in each sample individually. As in previous publications [10, 23, 24], we assumed an average content of non-cellulosic com-pounds (including water) of 5 % knowing that an error of 1 % in this estimation (i.e. 5 % ± 1 %) would lead to ΔDP of 1 %. This could be considered negligible in relation to the observed differences in DP across the collection as discussed later.
Near‑infrared spectroscopyPHAZIR NIR analyzer (Polychromix, now Thermo Fisher, Hemel Hempstead) in the interval of 1600–2400 nm (average of 10 scans), resolution 8 nm, was used. The measurements were carried out using single sheets with a Spectralon target as the background, in areas that contained no inks or visible soiling and away from the margins.
The same samples were measured using the SurveNIR instrument (Lichtblau, Dresden) in the interval of 1100-2200 nm (with 2 nm resolution, average of 8 spectra per sheet with 300 scans each) and the collected data was analysed based on models developed for European paper to explore their applicability.
Multivariate data analysisTwo different multivariate data analysis (MVA) methods have been used to analyse the NIR spectra. For classifi-cation, linear discriminant analysis (LDA) was used for several historic materials with good results [20, 25, 42–44], therefore this method was used to estimate the pres-ence of starch-sizing and polishing. XLSTAT 2013 v.5.01 software was used to model the presence of starch using spectra of 228 samples and also to develop a model to identify polishing on 104 samples. No spectral pre-pro-cessing was used for these models. Calibration and vali-dation datasets were selected randomly.
For quantitative calibration, multivariate regression methods such as partial least squares (PLS) [42–44] have been used to develop NIR-based models for char-acterization of heritage materials extensively. Models were developed to study different materials properties, e.g. European paper [23, 24, 45], textiles [46, 47], parch-ment [48] and easel paintings [49]. Polychromix method generator v. 3.101 R2-64 software was used to build two PLS regression models for the determination of pH and DP using the reference data as measured using the tradi-tional methods described above.
Different spectral pre-processing methods have been used to optimize the quality of calibration for the regression models. Standard normal variate (SNV) and Savitzky–Golay algorithm of the third polynomial order and a nine-point window second derivative were used for the pH model in the interval 1600-2400 nm. Only
Table 1 Summary of the techniques used in this paper, with the corresponding number of samples
The numbers differ for different reasons; in some cases, there was not enough sample (e.g. for DP determination) and in other cases the available data was enough for calibration (e.g. in the case of pH) to support a hypothesis. The number of analyses for the presence of starch and polishing was considered crucial for the key hypothesis of this paper, therefore, all the available samples were analysed
Technique No. of samples analysed
Iodine test 228
Raspail test 146
Visual assessment for polishing 228
Surface roughness 100
Surface gloss 228
Specular/diffuse reflectance ratio 22
SEM 20
FTIR 37
Fibre furnish 15
pH determination 70
DP determination 60

Page 5 of 14Mahgoub et al. Herit Sci (2016) 4:34
Savitzky–Golay algorithm of the third polynomial order and a seven-point window second derivative was applied to the spectra used for DP model. A dataset of 70 samples was used for the pH model, while 60 samples were used for the DP model as lignin-containing samples could not be measured using viscometry. Validation was performed with an independent dataset. Root mean square error of calibration (RMSEC), cross-validation (RMSECV) and prediction (RMSEP) were calculated to evaluate the models.
Results and discussionCharacterization of the reference collectionMorphologyThe 228 samples are of variable thickness ranging from 87 to 240 µm (Fig. 2). 30 are wove paper samples and 166 are laid, of which 50 laid paper samples have no chain lines and 32 are wire-mesh papers (Table 3). No specific features were observed, such as patterned distribution of chain lines, which has previously been observed in some Islamic papers [4, 5].
However, 2 samples (AP44 and AP97, Fig. 3) are made by gluing together two thin paper sheets, pol-ished on the outer sides, so that the resulting sheet is thicker and has both sides polished [7, 13]. In addi-tion, zig-zag indentation in diagonal lines from the sheet’s head to its tail [4] was observed in 3 handmade laid samples (AP36, AP37, and AP38). 61 samples con-tain watermarks, some of which were used in Euro-pean factories for paper exported to Islamic countries such as ‘three crescents’ or ‘tre lune’ [50], as seen in Fig. 4.
SizingStarch sizing could be seen as one of the defining characteristics of Islamic paper [4, 6, 15, 18]. Almost half of the samples (110) contain starch, although variation in the reaction to iodine was visible, which could indicate differences in the source and quantity of starch [27].
The Raspail test for rosin gave a positive reaction in only 5 samples out of 146 that were tested. One starch-sized sample (AP125-2) reacted positively to rosin as
Table 2 List of 15 samples from the ref-collection and their properties, selected randomly for fibre furnish analysis
a The type of the paper was identified visually by observing mould features and alignment of the fibres [37]
Samples Starch Polished Text Typea
AP3 Y Y Arabic Laid with no chain lines (hand-made)
AP5 Y Y Arabic Laid + chain lines (hand-made)
AP6 Y Y Arabic Laid + chain lines (hand-made)
AP7-1 N Y Arabic Laid + chain lines (hand-made)
AP7-2 N Y Arabic Laid + chain lines (hand-made)
AP11-1 Y N Arabic Wove (machine-made)
AP28-2 Y N Persian Laid with no chain lines (hand-made)
AP31 Y N Persian Wove (machine-made)
AP56-3 Y Y Arabic Wove (machine-made)
AP71-1 N Y Persian + Arabic Laid + chain lines (hand-made)
AP75-Type1 N Y Arabic Laid + chain lines (hand-made)
AP84 Y Y Coptic Wove (machine-made)
AP128 N N Arabic Wire-mesh (machine-made)
AP131 Y Y Persian Laid with no chain lines (hand-made)
AP149 N Y one side only Persian Laid with no chain lines (hand-made)
Fig. 2 Frequency plot for paper thickness (n = 228) of samples in the ref-collection

Page 6 of 14Mahgoub et al. Herit Sci (2016) 4:34
well. Since the test gives false positives for casein, ATR-FTIR was used to ensure the absence of peptide bonds. As a result of this analysis, two samples were found to contain protein (AP125-2, AP129-2). Consequently, only three out of the five samples reacting positively
to the Raspail test were undoubtedly sized with rosin (AP98, AP105, AP128), i.e. ~2 %. All three are written in Arabic, have no starch or polishing, and no water-mark. All are mechanically produced (2 wove and 1 wire-mesh).
PolishingMore than 50 % of the samples were visually classified to have polished surfaces. However, the decision was sub-jective and it would be useful to have an objective tool to identify the surface finish. In Fig. 5, we can see that only the ratio of specular vs. diffuse reflectance clearly distin-guishes between unpolished and polished samples and that the use of optical profilometry to assess the surface roughness or gloss measurements is not as efficient in distinguishing these two categories.
Table 3 Evidence of sheet-forming techniques for papers in the ref-collection
Laid and chain lines
Laid with no chain lines
Wove Wire‑mesh Total
Machine-made
16 4 28 28 76
Hand-made 96 50 2 4 152
Total 112 54 30 32 228
Fig. 3 Examples of the strengthening technique observed in two samples (AP44, AP97) involving two sheets being glued together on their unpol-ished sides (Known as Waşşālī method)
Fig. 4 Examples of some watermarks found in the samples, especially the triple-crescent watermark used for papers exported from European paper mills to Islamic countries

Page 7 of 14Mahgoub et al. Herit Sci (2016) 4:34
Scanning electron microscopy could, as a non-optical technique, potentially better visualize the differences between the various levels of roughness of semi-transpar-ent materials due to its ability to produce high resolution images. In Fig. 6, two examples are shown to compare a polished sample with an unpolished one. Unfortunately, SEM is a destructive technique, therefore not applicable to papers of historic significance.
It is worth noting that both visual and instrumental methods of assessment of polishing are still subject to error as many papers are not uniformly polished and the result may therefore depend on the sampled area. Quantitative imaging tools could be developed to esti-mate the homogeneity of polishing and visualise its application, as was developed for some European paper properties [51].
Since polishing could have been done by a prior appli-cation of a coating, though this was not the rule, ATR-FTIR spectroscopy was attempted to identify the coating. Reference samples of paper made of pure cellulose and coated with egg-white or gum tragacanth were produced (Fig. 7) and their spectra compared with a spectral data-base available online [52].
As shown in Fig. 7, the peaks at ~1533 and ~1639 cm−1 (amide group bands), indicate the presence of proteins [20, 53, 54]. However, the cellulose peak at ~1630 cm−1 may obscure the nearby amide peak and not allow for gelatine, casein or egg white [20, 53] to be distinguished. Similarly, it would be difficult to distinguish between gums using FTIR alone [53], although the spectrum of the gum tragacanth-coated sample shows a peak at ~1720-1740 cm−1.
Fig. 5 Comparison of the agreement of three surface characterization techniques with visual assessment. The box plots show measurements for 20 samples obtained from a profilometry; b gloss measurements; c specular vs. diffuse reflectance at 457 nm. The “Polished” and “Unpolished” categories were determined visually. Each box shows the distribution of the measurements based on the median, 1st and 3rd quartile. The whiskers represent minimum and maximum values
Fig. 6 SEM images (×100) of an unpolished sample (left, AP127-1) and a polished sample (right, AP110)

Page 8 of 14Mahgoub et al. Herit Sci (2016) 4:34
To identify the polishing material, spectra of the ref-collection samples (n = 37) were peak-normalized at ~1026 cm−1. Almost half of the measured sam-ples contained well-identifiable proteinaceous peaks. Samples sized with starch could have been polished with egg white or casein, while gelatine was not used in Islamic countries due to “high temperature”, though there is no clear rationale given for this in the literature [6, 16].
Several test samples (~10) have shown peaks in the region ~1720–1740 cm−1, which could indicate the pres-ence of gums. However, none were as strong as the gum tragacanth peak in Fig. 7, which makes gums more diffi-cult to identify than proteins, since this peak could also indicate the presence of oxidised degradation products [21].
Two polished samples (AP48, AP131) showed no pro-tein or gum tragacanth peaks.
Fibre furnish15 samples were randomly selected and investigated for fibre furnish. Only bast (hemp and flax), cotton and wood-based (both hardwood and softwood) fibres were found. All of the identified fibre types are common to European and Islamic papermaking [4, 7, 8, 13, 15]. How-ever, an interesting finding is that most of the samples that were made from wood-pulp are not starch-sized, which might mean that these papers were imported.
Acidity and degree of polymerizationIt is well known that acidity in paper negatively affects its permanence [55, 56], however it cannot be directly linked to loss of mechanical properties and degree of polymeri-zation, as the rate of degradation also depends on tem-perature and RH [57].
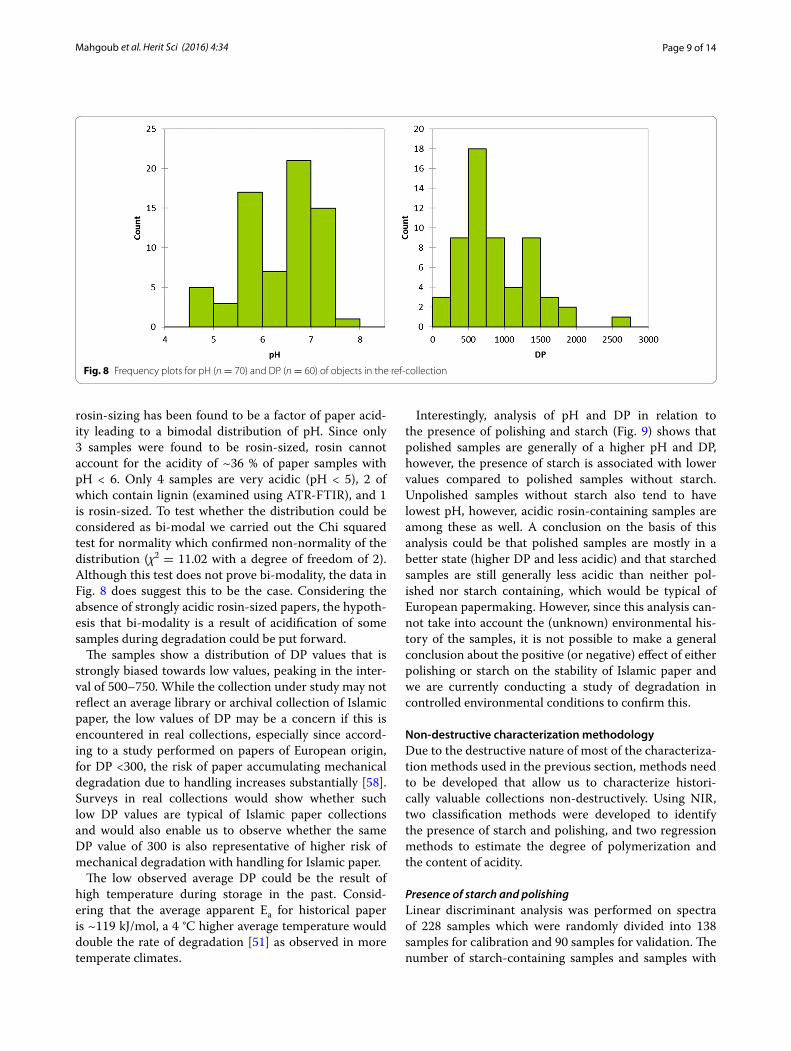
Data in Fig. 8 shows the distribution of pH across the sample collection, while in European papermaking,
Fig. 7 ATR-FTIR spectra of laboratory-made reference samples of cellulose coated with gum tragacanth and egg white, typical coatings used for polishing. In addition, some examples of the samples (AP98, AP133-2, AP4) that showed a peak in the range ~1720–1740 cm−1 indicating the pres-ence of gum tragacanth
Page 9 of 14Mahgoub et al. Herit Sci (2016) 4:34
rosin-sizing has been found to be a factor of paper acid-ity leading to a bimodal distribution of pH. Since only 3 samples were found to be rosin-sized, rosin cannot account for the acidity of ~36 % of paper samples with pH < 6. Only 4 samples are very acidic (pH < 5), 2 of which contain lignin (examined using ATR-FTIR), and 1 is rosin-sized. To test whether the distribution could be considered as bi-modal we carried out the Chi squared test for normality which confirmed non-normality of the distribution (χ2 = 11.02 with a degree of freedom of 2). Although this test does not prove bi-modality, the data in Fig. 8 does suggest this to be the case. Considering the absence of strongly acidic rosin-sized papers, the hypoth-esis that bi-modality is a result of acidification of some samples during degradation could be put forward.
The samples show a distribution of DP values that is strongly biased towards low values, peaking in the inter-val of 500–750. While the collection under study may not reflect an average library or archival collection of Islamic paper, the low values of DP may be a concern if this is encountered in real collections, especially since accord-ing to a study performed on papers of European origin, for DP <300, the risk of paper accumulating mechanical degradation due to handling increases substantially [58]. Surveys in real collections would show whether such low DP values are typical of Islamic paper collections and would also enable us to observe whether the same DP value of 300 is also representative of higher risk of mechanical degradation with handling for Islamic paper.
The low observed average DP could be the result of high temperature during storage in the past. Consid-ering that the average apparent Ea for historical paper is ~119 kJ/mol, a 4 °C higher average temperature would double the rate of degradation [51] as observed in more temperate climates.
Interestingly, analysis of pH and DP in relation to the presence of polishing and starch (Fig. 9) shows that polished samples are generally of a higher pH and DP, however, the presence of starch is associated with lower values compared to polished samples without starch. Unpolished samples without starch also tend to have lowest pH, however, acidic rosin-containing samples are among these as well. A conclusion on the basis of this analysis could be that polished samples are mostly in a better state (higher DP and less acidic) and that starched samples are still generally less acidic than neither pol-ished nor starch containing, which would be typical of European papermaking. However, since this analysis can-not take into account the (unknown) environmental his-tory of the samples, it is not possible to make a general conclusion about the positive (or negative) effect of either polishing or starch on the stability of Islamic paper and we are currently conducting a study of degradation in controlled environmental conditions to confirm this.
Non‑destructive characterization methodologyDue to the destructive nature of most of the characteriza-tion methods used in the previous section, methods need to be developed that allow us to characterize histori-cally valuable collections non-destructively. Using NIR, two classification methods were developed to identify the presence of starch and polishing, and two regression methods to estimate the degree of polymerization and the content of acidity.
Presence of starch and polishingLinear discriminant analysis was performed on spectra of 228 samples which were randomly divided into 138 samples for calibration and 90 samples for validation. The number of starch-containing samples and samples with
Fig. 8 Frequency plots for pH (n = 70) and DP (n = 60) of objects in the ref-collection

Page 10 of 14Mahgoub et al. Herit Sci (2016) 4:34
no starch was almost equal. Spectra in the interval of 1600–2400 nm were used. Table 4 shows that the model is highly satisfactory, with 90 % of successfully identified samples.
A similarly well-performing model was built for the identification of polishing. 74 out of 104 samples were selected randomly for calibration and 30 samples were used for independent validation. Spectra in the interval of 1600–2400 nm were used. 86.7 % of validation samples were correctly identified. Although validation is highly satisfactory, it is worth emphasizing that the model was built based on visual (and thus subjective) assessment of the presence of polishing. It might be possible to improve the predictive value of this classification model by con-firming the presence of polishing with SEM and FTIR; however, as it is, the model is useful for collection sur-veys where visual assessment of the presence of polish-ing is too time consuming in comparison with the NIR method.
Regression models for pH and DPTo build the models, 70 spectra of samples with pH val-ues measured using cold extraction, and 60 spectra of samples with DP determined using viscometry were measured using the PHAZIR hand-held spectrom-eter. Regression statistics for both methods are given in Table 5.
Validation of the models using independent data sets shows that the model for pH does not perform very well, with the root mean square error of prediction (RMSEP) of 0.7, which is useful for a broad classification of samples, but 2–3-times larger than the uncertainty of the experimental method. The errors in DP deter-mination are satisfactory and comparable with models as determined previously for European paper [23]. This indicates that the methods developed here could be use-ful for collection surveys, however, particularly for the pH model, more samples might improve the quality of prediction.
Fig. 9 Boxplots for pH (n = 70) and DP (n = 60) showing the 1st and 3rd quartile, the median and minimum and maximum values (whiskers) for categories with identified polishing (P), starch (S) or not (0)
Table 4 Validation matrices for LDA models for identification of starch and polishing. 138 and 74 samples were used for calibration, respectively
From\to Unpolished Polished Total % correct
Unpolished 14 1 15 93.3
Polished 3 12 15 80.0
Total 17 13 30 86.7
From\to No starch Starch Total % correct
No starch 39 3 42 92.9
Starch 6 42 48 87.5
Total 45 45 90 90.0

Page 11 of 14Mahgoub et al. Herit Sci (2016) 4:34
Finally, it was of interest to explore whether the PLS regression models as applied to European papers could be of use for Islamic papers. For this purpose, the SurveNIR instrument with the associated software and database for European papers was used. NIR spectra of 70 samples from the Ref-Collection were collected using the Surve-NIR Instrument and values of pH and DP were predicted.
In Fig. 10, we compare predicted values to the actual values of pH and DP, obtained using the PLS methods developed in this research specifically for Islamic paper, and for the SurveNIR method developed for European
paper. It is evident that regression methods for European paper perform less well for both pH and DP than regres-sions developed specifically for Islamic paper. This is par-ticularly the case for DP.
To explore whether this reflects the composition of Islamic paper, we plotted points representing starch-containing papers in a different colour in Fig. 10. While the less satisfactory performance of the pH model for European paper cannot be explained by the presence of starch, it is evident that this compound strongly affects the predictions of DP with SurveNIR.
Table 5 PLS calibration and validation parameters for regression models for pH and DP using NIR spectra obtained with the PHAZIR hand-held spectrometer; n-number of samples
PLS model Calibration Validation
n RMSEC RMSECV R2 n RMSEP Factors R2
pH 52 0.37 0.45 0.70 18 0.72 4 0.47
DP 45 263 298 0.60 15 177 3 0.78
Fig. 10 Comparisons of predicted and actual pH and DP values obtained with models developed specifically for Islamic paper (AP, above) and with models developed for European paper (SurveNIR, below). Hollow squares samples with starch, black squares no starch. R2 was calculated for both sets of data
Page 12 of 14Mahgoub et al. Herit Sci (2016) 4:34
With the non-destructive NIR methods, it is now possible to survey well-dated and provenanced histori-cally valuable Islamic paper collections in libraries and archives, which would give us a much clearer view of how widespread specific papermaking practices were through time and geographically. Additionally, we would gain a better insight into the state of conserva-tion of such collections, as well as develop collection-specific preservation advice. This is the focus of our future work.
ConclusionsWe investigated the properties of Islamic paper by explor-ing the material evidence presented by a reference historic materials database of 228 Islamic paper samples from north Africa, the near East and central Asia, mostly from the 18th and 19th century. For the majority of the docu-ments neither their age nor exact provenance can be estab-lished with certainty, however, the collection presents a range of historic material typologies that have not been researched scientifically before. Given that the collection represents a random cross-section of paper production from the Islamic cultural realm, we explored whether typi-cal material properties of Islamic paper could be defined.
We applied a number of techniques to explore the pres-ence of starch (iodine test), polishing (gloss measure-ment, profilometry, specular/diffuse reflectance ratio, SEM), rosin (Raspail test), fibre furnish (optical micros-copy), acidity (pH measurements) and degree of polym-erization (viscometry). Since most of these methods are either destructive and/or time consuming, we also devel-oped non-destructive methods for identification of starch and polishing as well as methods for quantitative deter-mination of pH and DP of Islamic paper, based on NIR spectroscopy and multivariate data analysis. We estab-lished the following:
• The presence of polishing was evaluated visually, although it was found that polishing is often applied unevenly and to different qualities of shine. Since the process of visual evaluation was time consum-ing, instrumental methods were explored, of which the specular/diffuse reflectance ratio at 457 nm gave results that were most consistent with visual observa-tion.
• Due to the semi-transparent properties of paper, optical methods may not be performing optimally and SEM was found to be a reliable technique, albeit destructive. With ATR FTIR, the presence of pro-teinaceous coatings (casein, egg white) can easily be detected, while the presence of gums is difficult to establish due to the absence of specific absorption bands.
• 48 % of the collection contains starch and 64 % are polished. 28 samples are neither polished nor contain starch (~12 %), 90 samples are polished, but do not contain starch, 53 contain starch, but are not pol-ished, and 57 are both polished and contain starch.
• The majority of samples that are neither polished nor contain starch, are written in Arabic (n = 23), of these, a small proportion (~2 %) are rosin-sized and mechanically produced. It could be hypothesised that these papers were imported; however, it is clear that rosin sizing or the absence of both polishing and starch are not typical of Islamic papermaking practice.
• Of the 15 samples of which fibre furnish was deter-mined, none contained fibres that would be consid-ered unusual for European paper making: all were bast, cotton, or wood-derived.
• With respect to acidity, samples show a non-normal distribution, with two peaks in the distribution in the intervals of 6.5–7.0 and 5.5–6. Since only 4 samples are very acidic (pH < 5), 2 of which contain lignin, and 1 is rosin-sized, the observed bi-modality cannot be explained as a reflection of different papermak-ing practices as is the case in European collections where rosin-sized paper represents the acidic peak, and gelatin-sized and post-1990 papers represent the alkaline peak in distribution.
• The DP of samples is mostly low, with 69 % having DP < 1000. Given that the typical fibres are bast and cotton with high initial DP, these results might be a reflection of high temperatures during past storage.
• In the studied collection, the polished samples are typically associated with higher pH and DP, however, this could also be a reflection of age or past storage. Further research is needed to establish how polishing and the presence of starch affect paper stability.
• On the basis of NIR spectra, linear discriminant analysis (LDA) and partial least squares (PLS) regres-sion methods were developed for identification of the presence of starch and polishing and for determi-nation of pH and DP. The validation and prediction errors are considered satisfactory for collection sur-veys, which would enable the collection of relevant data in well dated and provenanced collections.
• NIR methods for the characterization of Euro-pean paper were found unsuitable for application to Islamic paper. While determination of pH gave a larger prediction error, the NIR method for deter-mination of DP of European paper gave inaccurate results due to the presence of starch in Islamic paper.
Scientific evidence of Islamic papermaking practicesFor the first time, our research systematically reviewed the evidence of specific papermaking practices associated

Page 13 of 14Mahgoub et al. Herit Sci (2016) 4:34
with paper used in the Islamic cultural realm. We used established or developed new techniques that could be useful to establish the presence of starch and polishing, and developed techniques that could now be used to sur-vey large Islamic paper collections and establish material properties of well dated and provenanced collections, and thus add a layer of scientific data to codicological, historical and palaeographical research.
Since textual evidence alone is not a proof of provenance of the writing support, and the presence of polishing or even starch is not either (both could be applied to imported paper, prior to writing), and since the majority of Islamic paper has no watermarks, or does not contain fibres that cannot be found in European paper, there can be no une-quivocal evidence for what should or should not be consid-ered as Islamic paper. The literature reports specific cases of sieve patterning, the use of rice or papyrus fibres, but there is no evidence of these in the studied collection.
However, ~88 % of the studied collection contained starch and/or were polished, and these two practices could be considered typical of Islamic paper of the 18th, 19th and early 20th century.
Author details1 Institute for Sustainable Heritage, University College London, London, UK. 2 Lichtblau e.K., Dresden, Germany. 3 Department of Statistical Science, Univer-sity College London, London, UK.
AcknowledgementsHM, and MS jointly developed the concept of this work. HM, TB and MS carried out the experiments, produced samples, developed the computational model and analysed the data. TF contributed to data interpretation. DL contributed to the SurveNIR experiment. All co-authors contributed to the manuscript. All authors read and approved the final manuscript.
AcknowledgementsThe authors gratefully acknowledge the financial support of the EPSRC Centre for Doctoral Training in Science and Engineering in Arts, Heritage and Archae-ology (SEAHA), Lichtblau e.K., and EU Horizon 2020 project Nanorestart.
Particular thanks go to Jan Wouters for his help with this research and useful advice.
Competing interestsThe authors declare that they have no competing interests.
Received: 13 April 2016 Accepted: 11 August 2016
References 1. Hunter D. Papermaking: the history and technique of an ancient craft.
New York: Dover Publications; 1947. 2. Bloom J. Paper before print: the history and impact of paper in the Islamic
world. New Haven: Yale University Press; 2001. 3. Pedersen J. The Arabic book. French G, translator. Hillenbrand R, editor.
New Jersey: Princeton University Press; 1984. 4. Loveday H. Islamic paper: a study of the ancient craft. London: Don Baker
Memorial Fund; 2001. 5. Baker D. A note on the expression. A manuscript on oriental paper Manu-
scripts of the Middle East, vol. 4. Leiden: Ter Lugt Press; 1989. p. 67–8. 6. Baker D. ARAB PARERMAKING. Pap Conserv. 1991;15(1):28–35.
7. Karabacek J, Baker D, Dittmar S. Arab Paper, trans. London: Don Baker Memorial Fund and Archetype Publications; 2001.
8. Déroche F. Islamic codicology—an introduction to the study of manu-scripts in Arabic script. London: Al-Furqan Islamic Heritage Foundation; 2005.
9. Hubbe M. Acidic and alkaline sizings for printing, writing, and drawing papers. Book Pap Gr Annu. 2004;23:139–51.
10. Strlič M, Kolar J. Ageing and stabilization of paper. Ljubljana: National and University Library; 2005.
11. Barrow WJ. Permanence/durability of the book-VII physical and chemical properties of book papers. Richmond: W. J. Barrow Research Laboratory Inc; 1974. p. 1507–949.
12. Au C, Thorn I. Applications of wet-end paper chemistry. Glasgow: Chap-man & Hall; 1995.
13. Al-Sāmarrāʼī Q. Arabic Islamic palaeography & codicology = ʻIlm al-iktināh al-ʻArabī al-Islāmī’. Riyadh: King Faisal Centre for research and Islamic studies; 2001.
14. Helman-Ważny A, Van-Schaik S. Witnesses for Tibetan craftsmanship: bringing together paper analysis, palaeography and codicology in the examination of the earliest Tibetan manuscripts. Archaeometry. 2012;55(4):707–41.
15. Al-Hassan A. The different aspects of Islamic culture: science and technol-ogy in Islam. Technol Appl Sci Part II. 2011;4:155–8.
16. Garlick K. A brief review of the history of sizing and resizing practices [internet]. The book and paper group-annual meeting, Vol.5. The Ameri-can Institute for Conservation of Art and Historic Artifacts. 1986. http://cool.conservation-us.org/coolaic/sg/bpg/annual/v05/bp05-11.html. Accessed 5 Apr 2016.
17. Kolbe G. Gelatine in historical paper production and as inhibiting agent for iron-gall ink corrosion on paper. Restaurator. 2004;25(1):26–39.
18. Ibn Bādīs M. The staff of the scribes and implement of the discerning with a description of the line, the pens, soot inks, Līq, gall inks, dyeing, and details of bookbinding = ’Umdat Al-kuttab Wa’uddat Dhawi Al-albab’. Iran: Islamic Research Center; Ca. 1025.
19. Levey M. Mediaeval Arabic bookmaking and its relation to early chemis-try and pharmacology. Trans Am Philos Soc. 1962;52(4):1–79.
20. Stuart B. Analytical techniques in materials conservation, vol. 4. Molecular spectroscopy. Chichester: Wiley; 2007.
21. Zervos S. Evaluating treatments of paper using statistically valid test methods. Part II: experimental setup and protocol. Restaurator. 2007;28(4):256–88.
22. Derrick M, Stulik D, Landry J. Infrared spectroscopy in conservation sci-ence. Los Angeles: Getty Conservation Institute; 1999.
23. Trafela T, Strlič M, Kolar J, Lichtblau D, Anders M, Mencigar D, Pihlar B. Non-destructive analysis and dating of historical paper based on ir spectroscopy and chemometric data evaluation. Anal Chem. 2007;79(16):6319–23.
24. Strlič M, Kolar J, Lichtblau D. The SurveNIR project—a dedicated near infrared instrument for paper characterization. In: Padfield T, Borchersen K, editors. Museum microclimates. Copenhagen: National Museum of Denmark; 2007. p. 81–4.
25. Blanco M, Villarroya I. NIR spectroscopy: a rapid-response analytical tool. TrAC Trends Anal Chem. 2002;21(4):240–50.
26. Small G. Chemometrics and near-infrared spectroscopy: avoiding the pitfalls. TrAC Trends Anal Chem. 2006;25(11):1057–66.
27. Isenberg I. Pulp and paper microscopy. 3rd ed. Appleton: Institute of Paper Chemistry; 1967.
28. AIC. Paper conservation catalog [internet]. 7th ed. Washington, D.C.: American Institute for Conservation of Historic and Artistic Works, Book and Paper Group. Chapter 10: Spot tests; 1990. http://cool.conservation-us.org/coolaic/sg/bpg/pcc/10_spot-tests.pdf. Accessed 5 Apr 2016.
29. Bhushan B. Modern tribology handbook. Boca Raton: CRC Press; 2001. Chapter 2: Surface roughness analysis and measurement techniques.
30. Leising C. Paper surface roughness with 3D profilometry [internet]. Irvine, USA; 2010. http://nanovea.com/wp-content/themes/wp-nanovea/Appli-cation%20Notes/paperroughness.pdf. Accessed 5 Apr 2016.
31. Bennett H, Porteus J. Relation between surface roughness and specular reflectance at normal incidence. J Optic Soc Am. 1961;51(2):123–9.
32. Huynh V, Fan Y. Surface-texture measurement and characterisation with applications to machine-tool monitoring. Int J Adv Manuf Technol. 1992;7(1):2–10.

Page 14 of 14Mahgoub et al. Herit Sci (2016) 4:34
33. TAPPI-452-om. Brightness of pulp, paper and paperboard (Directional Reflectance at 457 nm). 1998.
34. BS-ISO-2470-1. Paper, board and pulps. Measurement of diffuse blue reflectance factor. Indoor daylight conditions (ISO brightness). London: British Standardization Institute-BSI; 2009.
35. BS-7463. Fiber furnish analysis of paper, board and pulps. London: British Standardization Institute-BSI; 1991.
36. Ilvessalo-Pfäffli M. Fiber atlas: identification of papermaking fibers. Ger-many: Springer-Verlag; 1995.
37. Cornell University Library. Paper, the nature of materials [internet]. Tuto-rial- Iraq and Middle East, library preservation and conservation. 2005. https://www.library.cornell.edu/preservation/librarypreservation/mee/preservation/paper.html. Accesssed 4 Apr 2016.
38. ASTM-D778-97. Standard test methods for hydrogen ion concentration (pH) of paper extracts (hot-extraction and cold-extraction procedures). USA: ASTM International; 2002.
39. Strlič M, Kolar J, Kočar D, Drnovšek T, Šelih V, Susič R, Pihlar B. What is the pH of alkaline paper? [internet]. E-preservation science, MORANA RTD. 2004;1:35–47. http://www.morana-rtd.com/e-preservationscience/2004/Strlic-03-06-2004.pdf. Accessed 5 Apr 2016.
40. BS-ISO-5351. Pulps —determination of limiting viscosity number in cupri-ethylenediamine (CED) solution, 2nd ed. London: British Standardization Institute-BSI; 2010.
41. Evans R, Wallis A. Comparison of cellulose molecular weights determined by high performance size exclusion chromatography and viscometry. Paris: fourth international symposium on wood and pulping chemistry. 1987;1:201–5.
42. Miller JN, Miller JC. Statistics and chemometrics for analytical chemistry. 6th ed. Upper Saddle River: Prentice Hall/Pearson; 2010.
43. Brereton R. Chemometrics for Pattern Recognition. Chichester: Wiley; 2009.
44. Brereton R, Lloyd G. Partial least squares discriminant analysis: taking the magic away. J Chemom. 2014; 2609.
45. SurveNIR, Near infrared tool for collection surveying [internet]. 2000. http://www.science4heritage.org/survenir/. Accessed 8 Jun 2016.
46. Richardson E, Garside P. The use of near infrared spectroscopy as a diag-nostic tool for historic silk artefacts. e-Preserv Sci. 2009;6:68–74.
47. Garside P, Howard S, Loubser K, Wyeth P. On-site categorisation and con-dition assessment of silks in textile collections. Portugal: ICOM-CC 16th triennial conference preprints. 2011;1–10.
48. Možir A, Strlič M, Trafela T, Cigić IK, Kolar J, Deselnicu V, De Bruin G. On oxidative degradation of parchment and its non-destructive characterisa-tion and dating. Applied physics A: materials science & processing, vol. 104. Berlin: Springer; 2011. p. 211–7.
49. Oriola M, Možir A, Garside P, Campo G, Nualart-Torroja A, Civil I, Odlyha M, Cassar M, Strlič M. Looking beneath Dalí’s paint: non-destructive canvas analysis. Anal Methods. 2014;6:86.
50. Wiesmüller B. The watermarks from the Refaiya library. Trans. from the German by Steven Black. [internet]. Between 2008–2012 (N.D.). http://www.refaiya.uni-leipzig.de/texts/Watermarks_Refaiya.pdf. Accessed 4 Apr 2016.
51. Cséfalvayová L, Strlič M, Karjalainen H. Quantitative NIR chemical imaging in heritage science. Anal Chem. 2011;83(13):5101–6.
52. IRUG. Infrared and Raman Users Group, IRUG spectral database [Internet]. 2000. http://www.irug.org/. Accessed 5 Apr 2016.
53. Baker M, Reyden D, Ravenel N. FTIR analysis of coated papers [internet]. Cincinnati: The book and paper group-Annual meeting, Vol. 8. The Ameri-can Institute for Conservation of Art and Historic Artifacts. 1989. http://cool.conservation-us.org/coolaic/sg/bpg/annual/v08/bp08-01.html. Accessed 5 Apr 2016.
54. Gorassini A, Calvini P, Baldin A. Fourier transform infrared spectroscopy (FTIR) analysis of historic paper documents as a preliminary step for chemometrical analysis. Italy: CMA4CH 2nd Mediterraneum meeting on multivariate analysis and chemometry for cultural heritage and environ-ment. 2008;2:47–8.
55. Zou X, Uesaka T, Gurnagul N. Prediction of paper permanence by accelerated aging I. Kinetic analysis of the aging process. Cellulose. 1996;3(1):243–67.
56. Zou X, Uesaka T, Gurnagul N. Prediction of paper permanence by acceler-ated aging II. Comparison of the predictions with natural aging results. Cellulose. 1996;3(1):269–79.
57. Strlič M, Grossi-Sampedro C, Dillon C, Bell N, Fouseki K, Brimblecombe P, Menart E, Ntanos K, Lindsay W, Thickett D, France F, de Bruin G. Damage function for historic paper. Part III: isochrones and demography of collec-tions. Herit Sci. 2015;3(1):1.
58. Strlič M, Grossi-Sampedro C, Dillon C, Bell N, Fouseki K, Brimblecombe P, Menart E, Ntanos K, Lindsay W, Thickett D, France F, De Bruin, G. Damage function for historic paper. Part II: Wear and tear. Herit Sci. 2015;3(1).