maximising ball release speed in overhead throwing … · 2018. 5. 26. · maximising ball release...
TRANSCRIPT
MAXIMISING BALL RELEASE SPEED IN OVERHEAD
THROWING THROUGH OPTIMISING ARM SEGMENT
MASSES
A thesis submitted for the degree of Doctor of Philosophy
by
Patrick Fasbender
Department of Life Sciences, Brunel University London
28 September 2017
2
Abstract
The tapering distribution of segment masses in the human arm helps in the
generation of high ball release speeds in overarm throwing. However, the masses of
the individual arm segments might not be optimal; arm segment masses could be
optimised in order to improve throwing performance. The aim of this project was to
identify and understand the optimal upper arm mass that results in the highest ball
release speed in overarm throwing.
The first study was a theoretical study, using a simple two-segment model of
the arm to determine the optimal combination of arm segment masses that
maximises ball release speed. This simplified throw was chosen to identify the basic
mechanism causing changes in ball release speed with a heavier upper arm mass.
The study identified that there is an optimal upper arm mass, but this optimum
depends on the forearm mass and the shoulder torque. Furthermore, the study
showed that a heavier forearm mass produces a lower ball release speed.
An experimental approach was used in the second study to analyse the effect
of additional upper arm mass on ball release speed and throwing mechanics in an
overarm throw similar to that used by baseball pitchers. However, group analysis of
the ball release speed did not reveal an optimal upper arm mass, and most of the
kinematic, kinetic, and temporal variables were not affected by additional upper arm
mass. However, analysing the ball release speed of each participant individually
revealed that most participants increased their ball release speed, although there
was considerable variation in the optimal upper arm mass. As the optimal upper arm
masses in this study did not agree with those predicted in the first theoretical study, a
3
more realistic three-dimensional model is needed to simulate the effect of upper arm
mass on ball release speed.
The third study was a combination of a theoretical and experimental
approach. A three-dimensional model of the throwing arm was used to predict the
participant’s optimal upper arm mass and to determine the kinematic and kinetic
variables that determine the optimal upper arm mass in overarm throwing. Even
though the simulations did not accurately predict an athlete’s optimal upper arm
mass, the results highlighted that throwing athletes can benefit from a heavier upper
arm mass as long as their ability to produce a high internal shoulder rotation angular
velocity is not restricted.
In summary, the findings of this project highlight that some athletes can
benefit from a heavier upper arm mass to maximise their ball release speed without
increasing the risk of injuries. However, as the optimal upper arm varies between
athletes it is important to analyse each athlete individually.
4
Table of contents
Abstract ...................................................................................................................... 2
Table of contents ........................................................................................................ 4
List of figures ............................................................................................................ 13
List of tables ............................................................................................................. 16
Acknowledgments .................................................................................................... 18
General introduction ....................................................................... 19
Literature review .............................................................................. 26
2.1. Throwing a projectile ...................................................................................... 27
2.2. Human evolution and projectile throwing ....................................................... 27
2.3. Classifications of throws ................................................................................ 28
2.4. Determinants of throwing performance .......................................................... 29
2.4.1. Release angle ....................................................................................... 30
2.4.2. Release height ...................................................................................... 31
2.4.3. Release speed ...................................................................................... 32
2.5. Phases of throwing ........................................................................................ 33
2.5.1. Windup ................................................................................................. 34
2.5.2. Stride .................................................................................................... 35
2.5.3. Arm cocking .......................................................................................... 35
2.5.4. Arm acceleration ................................................................................... 36
5
2.5.5. Arm deceleration .................................................................................. 36
2.5.6. Follow-through ...................................................................................... 37
2.6. Kinetic chain .................................................................................................. 37
2.6.1. Conservation of angular momentum ..................................................... 38
2.6.2. Kinetic chain of throwing ....................................................................... 38
Inertial parameters of the kinetic chain ............................................. 39
Temporal variables ........................................................................... 40
Legs .................................................................................................. 41
Trunk ................................................................................................ 43
Shoulder ........................................................................................... 44
Elbow ................................................................................................ 47
Wrist ................................................................................................. 48
2.7. Injuries in overarm throwing ........................................................................... 49
2.7.1. Kinetic variables associated with injuries .............................................. 49
2.7.2. Kinematic variables associated with injuries ......................................... 50
2.7.3. Temporal characteristics associated with injuries ................................. 51
2.8. Experimental vs. simulation design ................................................................ 52
2.8.1. Pros and cons of different study designs .............................................. 52
2.8.2. Force-velocity relationship .................................................................... 53
2.8.3. Computer models of the upper body .................................................... 53
Shoulder models used in throwing studies ....................................... 54
6
Joint rotation sequence in throwing studies ...................................... 54
2.9. Changes of inertial parameters in overarm throwing ..................................... 55
2.9.1. Upper arm mass ................................................................................... 55
2.9.2. Forearm mass ...................................................................................... 57
2.9.3. Risk of injury ......................................................................................... 57
2.10. Summary ..................................................................................................... 58
Optimal mass of the arm segments in overarm throwing: A 2D
simulation study. ............................................................................. 60
3.1. Introduction .................................................................................................... 61
3.1.1. Inertial parameters in throwing ............................................................. 62
3.1.2. Importance of upper limbs in throwing .................................................. 64
3.1.3. Temporal lag of joint rotations in throwing ............................................ 64
3.1.4. 2D throwing models .............................................................................. 66
3.1.5. Aims of the study .................................................................................. 67
3.1.6. Hypothesis ............................................................................................ 68
3.2. Methods ......................................................................................................... 69
3.2.1. Participant ............................................................................................. 69
3.2.2. Experimental Setup .............................................................................. 70
3.2.3. Determination of subject-specific simulation characteristics ................. 73
3.2.4. Model description ................................................................................. 74
3.2.5. Dependent variables ............................................................................. 77
7
3.3. Results ........................................................................................................... 78
3.3.1. Forearm mass ...................................................................................... 78
3.3.2. Upper arm mass ................................................................................... 79
3.3.3. Optimum combinations of arm segment masses .................................. 80
3.3.4. Time of maximum segment angular velocities ...................................... 83
3.4. Discussion ..................................................................................................... 84
3.4.1. Optimum combination of arm segment masses .................................... 84
Forearm mass .................................................................................. 85
Upper arm mass ............................................................................... 85
3.4.2. Temporal lag of joint rotations .............................................................. 86
3.4.3. Throwing projectile ............................................................................... 87
3.4.4. Limitations ............................................................................................ 87
3.4.5. Applications .......................................................................................... 89
3.4.6. Further Work ......................................................................................... 89
3.5. Conclusions ................................................................................................... 91
Kinematic and kinetic analysis of additional upper arm mass in
overarm throwing. ........................................................................... 92
4.1. Introduction .................................................................................................... 93
4.1.1. Inertial parameters in throwing ............................................................. 94
4.1.2. Kinematics of throwing performance .................................................... 95
Legs .................................................................................................. 96
8
Trunk ................................................................................................ 97
Shoulder ........................................................................................... 97
Elbow ................................................................................................ 98
4.1.3. Temporal characteristics of throwing performance ............................... 99
4.1.4. Kinematic and kinetic variables related to injuries .............................. 100
4.1.5. Aims of the study ................................................................................ 103
4.1.6. Hypotheses ......................................................................................... 104
4.2. Methods ....................................................................................................... 105
4.2.1. Participants ......................................................................................... 105
4.2.2. Data collection .................................................................................... 106
4.2.3. Data analysis ...................................................................................... 110
Model characteristics ...................................................................... 110
Data processing .............................................................................. 113
Statistical analysis .......................................................................... 116
4.3. Results ......................................................................................................... 118
4.3.1. Group analysis .................................................................................... 118
Ball release speed .......................................................................... 118
Kinematic variables......................................................................... 119
Kinetic variables ............................................................................. 119
4.3.2. Individual analysis .............................................................................. 123
4.4. Discussion ................................................................................................... 125
9
4.4.1. Throwing performance ........................................................................ 126
Ball release speed .......................................................................... 126
Throwing technique ........................................................................ 129
4.4.2. Risk of injuries .................................................................................... 131
4.4.3. Limitations .......................................................................................... 133
4.4.4. Applications ........................................................................................ 134
4.4.5. Further Work ....................................................................................... 135
4.5. Conclusions ................................................................................................. 137
Additional upper arm mass does not have the same effect on
each athlete’s throwing mechanics. ............................................ 138
5.1. Introduction .................................................................................................. 139
5.1.1. Inertial parameters in throwing ........................................................... 139
5.1.2. Kinematic and kinetic variables in throwing ........................................ 141
5.1.3. Aims of the study ................................................................................ 143
5.1.4. Hypotheses ......................................................................................... 143
5.2. Methods ....................................................................................................... 145
5.2.1. Participants ......................................................................................... 146
5.2.2. Data collection .................................................................................... 146
5.2.3. Model description ............................................................................... 149
Hardware ........................................................................................ 149
Challenges faced while simulating overhead throws ...................... 149
10
Three-dimensional model ............................................................... 151
Modifications to the upper body model ........................................... 151
5.2.4. Data processing .................................................................................. 153
Experimental throws ....................................................................... 153
Simulated throws ............................................................................ 154
5.2.5. Data analysis ...................................................................................... 155
Simulated throws ............................................................................ 155
Experimental throws ....................................................................... 156
5.3. Results ......................................................................................................... 158
5.3.1. Simulated throws ................................................................................ 158
Ball release speed .......................................................................... 158
Effect of additional upper arm mass on joint angular velocities ...... 160
Maximum joint angles of throws without additional upper arm mass ....
........................................................................................................ 161
Maximum joint angular velocities of throws without additional upper
arm mass ..................................................................................................... 162
Maximum joint torques of throws without additional upper arm mass ...
........................................................................................................ 163
5.3.2. Experimental throws ........................................................................... 164
Ball release speed .......................................................................... 164
Maximum joint angles ..................................................................... 166
11
Joint angles at the instant of ball release ........................................ 168
Maximum joint angular velocities .................................................... 168
Maximum joint torques .................................................................... 168
Optimal upper arm mass ................................................................ 172
5.4. Discussion ................................................................................................... 173
5.4.1. Ball release speed .............................................................................. 173
Simulated throws ............................................................................ 173
Experimental throws ....................................................................... 175
Comparison between simulated and experimental throws.............. 176
5.4.2. Throwing mechanics ........................................................................... 176
Simulated throws ............................................................................ 176
Experimental throws ....................................................................... 179
Mechanisms that affect an athlete’s optimal upper arm mass ........ 179
5.4.3. Limitations .......................................................................................... 180
5.4.4. Applications ........................................................................................ 181
5.4.5. Further work ....................................................................................... 181
5.5. Conclusions ................................................................................................. 184
General Discussion ....................................................................... 185
6.1. Summary of main findings ........................................................................... 187
6.1.1. Chapter 3 ............................................................................................ 187
6.1.2. Chapter 4 ............................................................................................ 188
12
6.1.3. Chapter 5 ............................................................................................ 189
6.2. Limitations ................................................................................................... 190
6.3. Applications ................................................................................................. 191
6.4. Further Work ................................................................................................ 192
6.5. Conclusions ................................................................................................. 193
References ............................................................................................................. 194
Appendices ............................................................................................................ 219
Appendix 1: Calculating Akaike’s Information Criterion (AIC) .......................... 220
Appendix 2: Ethics Approval ............................................................................ 221
13
List of figures
Figure 2-1: Illustrations of throwing classifications in baseball pitching. .............. 29
Figure 2-2: Release parameters while throwing a projectile ................................ 29
Figure 2-3: Six phases of throwing in baseball pitching and throwing in American
football. ............................................................................................. 34
Figure 3-1: Marker placement used for data collection ........................................ 71
Figure 3-2: Diagram of the experimental setup. .................................................. 72
Figure 3-3: Two-dimensional throwing model with two degrees of freedom
(shoulder and elbow joints). .............................................................. 74
Figure 3-4: Time trace of the shoulder and elbow torque of the participant. ........ 76
Figure 3-5: Effect of forearm mass and shoulder torque on ball release velocity. 79
Figure 3-6: Effect of upper arm mass and shoulder torque on ball release speed. .
.................................................................................................. 80
Figure 3-7: Effect of upper arm mass and forearm mass on ball release speed. 81
Figure 3-8: Optimal combination of arm segment masses. ................................. 82
Figure 3-9: Maximum shoulder angular velocity occurred later in the throw for the
throws simulated with the optimal upper arm mass .......................... 83
Figure 4-1: Marker set on the upper body, anterior view (left) and posterior view
(right). .............................................................................................. 108
Figure 4-2: Marker set on the lower body, anterior view (left) and posterior view
(right). .............................................................................................. 109
Figure 4-3: Illustration of Visual 3D model used for kinematic and kinetic analysis.
................................................................................................ 111
Figure 4-4: The six phases of throwing ............................................................. 113
14
Figure 4-5: Definitions of kinematic variables .................................................... 114
Figure 4-6: Anatomical reference frames of the shoulder (A) and elbow joints (B).
................................................................................................ 115
Figure 4-7: Ball release speed with various amounts of additional upper arm
mass. .............................................................................................. 118
Figure 4-8: Ball release speed with additional upper arm mass for each individual
participant. ...................................................................................... 123
Figure 5-1: Illustration of the experimental setup with the participant sitting on a
chair while throwing a baseball as fast as possible at a target. ....... 148
Figure 5-2: Marker set used for data collection, anterior view (left) and posterior
view (right) ...................................................................................... 149
Figure 5-3: Definitions of joint rotations ............................................................. 152
Figure 5-4: Changes in ball release speed with additional upper arm mass for the
simulated throws ............................................................................. 158
Figure 5-5: Ball release speed of the throws performed without additional upper
arm mass in relation to the rate of change in ball release speed with
increasing upper arm mass. ............................................................ 159
Figure 5-6: Changes in maximum joint angular velocities between the throws
simulated without additional upper arm mass and the throws
simulated with a 50% increase in upper arm mass ......................... 161
Figure 5-7: Maximum joint angles for throws performed without additional upper
arm mass in relation to the rate of change in ball release speed with
increasing upper arm mass. ............................................................ 162
15
Figure 5-8: Maximum joint angular velocity for each throw performed without
additional upper arm mass in relation to the rate of change in ball
release speed with increasing upper arm mass. ............................. 163
Figure 5-9: Maximum joint torques for each throw performed without additional
upper arm mass in relation to the rate of change in ball release speed with
increasing upper arm mass. ............................................................ 164
Figure 5-10: Changes in ball release speed in relation to additional upper arm
mass. 165
Figure 5-11: Maximum joint angles reached with additional upper arm mass for
each participant that increased their ball release speed with a heavier
upper arm mass (left) and the participants that were not affected by
changes in upper arm mass (right). ................................................ 167
Figure 5-12: Joint angles at the instant of ball release with different amounts of
additional upper arm mass for the participants that benefited from
additional upper arm mass (left) and those that were not affected
(right). .............................................................................................. 169
Figure 5-13: Maximum joint angular velocities with additional upper arm mass. . 170
Figure 5-14: Maximum joint torques generated with additional mass attached to the
participants’ upper arm. ................................................................... 171
Figure 5-15: Mean and 95% CI of upper arm mass that resulted in a maximum or
minimum for each variable analysed. .............................................. 172
16
List of tables
Table 2-1: Release speeds reached in various sports and the mass of the
projectile thrown (Bartlett, 2000). ........................................................ 33
Table 3-1: Arm segment masses for people of different body masses (Dempster,
1955). .................................................................................................. 70
Table 3-2: Segment characteristics of the 2D throwing model, obtained from the
participant............................................................................................ 73
Table 4-1: Characteristics of the participants (mean, SD). ................................. 106
Table 4-2: Placement of the markers on the anatomical landmarks and the body
segments of the participants. ............................................................ 108
Table 4-3: Segment definitions and order of joint rotations of the Visual 3D model.
........................................................................................................ 111
Table 4-4: Changes in ball release speed, stride length, and joint angles with
additional upper arm mass ................................................................ 121
Table 4-5: Changes in maximum joint angular velocities, maximum joint kinetics,
and timing of kinematic variables with additional upper arm mass .... 122
Table 4-6: Parameters of the linear models and u-shape models fitted to the ball
release velocity for each participant. ................................................. 124
Table 5-1: Characteristics of the participants (mean, SD). ................................. 146
Table 5-2: Mean upper arm mass attached to the participant’s upper arm for each
condition. ........................................................................................... 147
Table 5-3: Modifications to the joint ranges of motion in the upper body model of
Saul et al. (2014). .............................................................................. 153
17
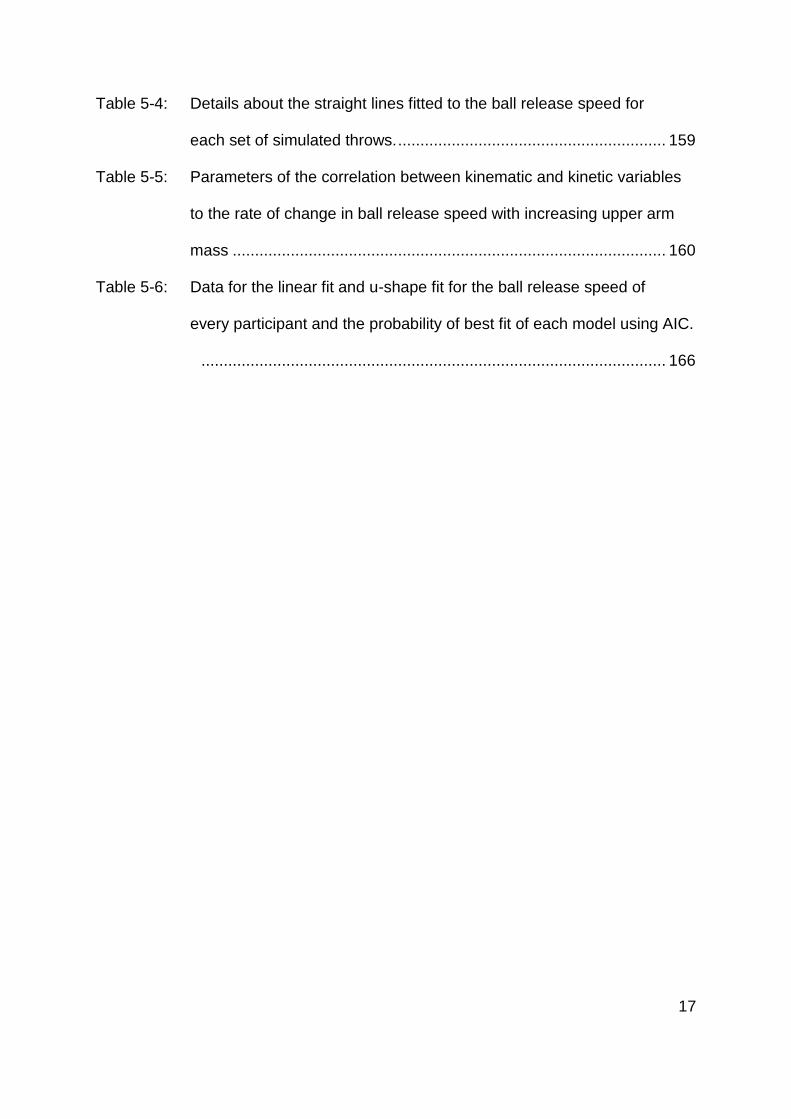
Table 5-4: Details about the straight lines fitted to the ball release speed for
each set of simulated throws. ............................................................ 159
Table 5-5: Parameters of the correlation between kinematic and kinetic variables
to the rate of change in ball release speed with increasing upper arm
mass ................................................................................................. 160
Table 5-6: Data for the linear fit and u-shape fit for the ball release speed of
every participant and the probability of best fit of each model using AIC.
........................................................................................................ 166

18
Acknowledgments
First, I want to thank my supervisors Dr Nick Linthorne and Dr Thomas Korff
for sharing their knowledge with me, supporting me throughout my whole PhD and
their valuable feedback. I also want to thank Professor Bill Baltzopoulos for his
guidance at the early stages of my PhD.
I would like to express my gratitude to Ms Sara Horne, Dr Nicola Theis, Dr
Charlotte Waugh and Dr Marika Noorkoiv for sharing their expertise about research
equipment and always being available to help me out. Huge thanks goes to those
that assisted me in collecting data: George, Joao, Rachel, Jessica and Zach. All of
you made my work much easier.
A special thanks goes to my family. Especially to my wife Maike for your
support and your patience throughout this exciting, but sometimes challenging
journey. A huge thanks goes to my parents Sonja and Claude. You’ve always
supported me in everything I’ve done and give me the confidence to pursue my
dreams. I also want to thank my sister and my brother for always being available to
give me some advice, no matter how close or far away they are.
All the PhD students I have shared this great experience with: Adam, Adele,
Andy, Colm, Danny, Eurico, Fabio, George, Giorgia, Jamie, Jen, Joao, Jon, Karl,
Marcelo, Nick, Nicola, Pedro, Scott, Sean, Steve, Toby, Viktor. Thanks for making
this journey so enjoyable and it was a pleasure to share the office with you.
I also want to thank all my friends that supported me and all the basketball
teams that I was involved in during the time of my PhD, either as a player or as a
coach. You have provided me with a great balance and enabled me to clear my mind
whenever necessary.

19
General introduction
20
Throwing a projectile is a skill used in sports such as baseball, cricket, and
javelin throw where the aim is to throw as fast or as far as possible. As performance
in throwing sports mainly depends on the release velocity (Linthorne, 2006), athletes
aim to maximise their release velocity. Skilled throwers achieve high release
velocities through a sequential proximal-to-distal movement of body segments
(Putnam, 1993; Serrien & Baeyens, 2017). The mass distribution of the human body
starting with the heavy trunk, followed by the lighter upper arm and forearm, and
ending with the very light hand segment (de Leva, 1996; Dempster, 1955) supports
the generation of a high projectile release velocity through conservation of angular
momentum. Due to the differences in segment mass, the lighter distal segments
reach higher angular velocities as the heavier proximal segments decelerate, and
reach angular velocities that are higher than the velocity that can be produced by the
arm muscles acting in isolation (Naito & Maruyama, 2008).
Even though the anthropometric parameters of an athlete can affect the
kinetic chain of overarm throwing, only limited research has analysed how changes
in arm segment mass affect throwing performance. Angular momentum is the
product of angular velocity and moment of inertia (which is affected by the mass
distribution). Athletes can generate a higher angular momentum in a segment by
increasing the angular velocity of the segment or by increasing the moment of inertia
of the segment (Serrien & Baeyens, 2017). Most studies analysing overhead
throwing have focussed on improving ball release speed through various strength
training programs (van den Tillaar, 2004). Improving throwing velocity through
optimising the mass of the arm segments has attracted far less attention.
21
Southard (1998) analysed the effect of additional mass attached to the arm
segments on ball release speed. The participants in this study had to throw a
baseball as fast as possible with eight different segmental mass conditions. The
additional mass was attached to the participant’s upper arm, forearm, or hand, or
with combinations of additional mass on several segments. The upper arm mass
was increased on average by 1.4 kg, which represents an average increase in upper
arm mass by about 60% of the participant’s actual upper arm mass. Additional mass
attached to the participant’s upper arm was the only condition that resulted in an
improved ball release speed (by about 6.4%). The less skilled throwers in the study
benefited from additional upper arm mass the most because they improved their
proximal-to-distal sequence of maximum segment linear velocities. Increasing the
upper arm mass caused the hand segment of the less skilled throwers to lag behind
the forearm segment, thus resulting in a higher ball release speed. Attaching
additional mass to the distal segments resulted in a decrease in ball release speed.
After (Southard, 1998) showed that additional upper arm mass could increase
ball release speed in overarm throwing, Kim, Dounskaia, Hinrichs, and Richard
(2008) analysed how different masses attached to either the upper arm or forearm
affect horizontal arm swing velocity. These researchers increased the arm segment
masses by 25%, 50%, 75%, and 100%, while the participants had to swing their arm
as fast as possible in the horizontal plane in order to produce a movement similar to
that performed by baseball batters. Attaching an additional 25% and 50% to the
upper arm mass resulted in a slight increase in horizontal arm swing velocity,
whereas a 75% and 100% increase resulted in a lower arm swing velocity. Additional
mass attached to the forearm resulted in lower arm swing velocities, thus confirming
22
the findings of Southard (1998) that a heavier distal segment has a negative effect
on throwing performance.
The findings of Southard (1998) and Kim et al. (2008) suggest that athletes
could increase their ball release speed with a heavier upper arm mass. Therefore,
there must be an optimal upper arm mass that results in the highest ball release
speed. Linthorne, Eckardt, Heys, and Reynolds (n.d.) tested this concept in a
modified javelin throw, using an 800 g javelin training ball and a two-step run-up. The
participants in this study increased the distance thrown by around 5.4% with the
optimal amount of mass attached to the upper arm. The optimal upper arm mass
varied between participants and ranged from an additional 0.21 kg to 0.60 kg
attached to the participant’s upper arm. Also, these results were broadly confirmed
by a simple two-dimensional two-segment torque-driven model of throwing
(Linthorne et al., n.d.).
Although the benefit of a heavier upper arm mass has been identified in
overarm throwing (Kim et al., 2008; Linthorne et al., n.d.; Southard, 1998), there
were several limitations of these studies that should be addressed before the
concept of optimising the upper arm can be employed by throwing athletes. None of
the studies examined the changes in throwing mechanics that occur with additional
upper arm mass. Southard (1998) analysed linear velocity of arm segments with
additional upper arm mass, but no study has analysed the changes in joint angles,
joint angular velocities, joint torques, and joint forces with increasing upper arm
mass. The study by Kim et al. (2008) focused on the horizontal arm swing velocity
and the main objective of Linthorne et al. (n.d.) was to confirm that there is an
optimal upper arm mass in javelin throw. Due to the planar movement performed in
23
the study of Kim et al. (2008) and the use of two-dimensional video analysis by
Linthorne et al. (n.d.), these studies did not analyse kinematic or kinetic data.
Analysis of kinematic and kinetic variables with changes in upper arm mass could
help to understand mechanisms that cause the increase in throwing performance.
Furthermore, Linthorne et al. (n.d.) observed an optimal upper arm mass when
throwing for maximum distance, but no study has examined if the same applies
when throwing for maximum ball release speed.
The study by Linthorne et al. (n.d.) is the only one that used a computer
model to examine the effect of additional upper arm on throwing performance. A
simple two-dimensional model of a two segment arm (upper arm and forearm),
driven by constant shoulder and elbow torques, was used to simulate a javelin throw.
Even though this model broadly replicated the results recorded in the throw
experiment, a more realistic representation of the throwing motion would provide
further insight into how changes in upper arm mass affect overarm throwing.
Therefore, simulating the effect of upper arm mass on ball release speed using a
three-dimensional full-body model could help to understand the underlying
mechanisms. Furthermore, Linthorne et al. (n.d.) only changed the upper arm mass
in the throw simulations. A study that combined changes in upper arm mass with
changes in forearm mass, ball mass, shoulder torque, and elbow torque could
provide further information about how these variables interact to affect ball release
speed and the optimal upper arm mass.
Therefore, the main aim of the present project was to determine the optimal
mass of an athlete’s upper arm when throwing for maximum velocity and to
understand the underlying mechanisms. The secondary aim was to identify if
24
athletes can safely optimise their upper arm mass without increasing their risk of
injuries. These aims were tested in three related studies:
The first study used a modelling approach, creating a two-segment two-
dimensional torque-driven computer model of the dominant arm. Overarm
throws with changes in upper arm mass, forearm mass, and shoulder torque
were simulated to determine the optimal relation between upper arm mass
and forearm mass in overarm throwing. It was expected that there is an
optimal upper arm mass that results in the highest ball release speed. Ball
release speed was expected to decrease as the forearm mass increases.
In the second study an experimental approach was used to analyse the effect
of additional upper arm mass on ball release speed and throwing mechanics.
The aim of the second study was to determine the optimal upper arm mass in
overhead throwing and to analyse how a heavier upper arm mass affects joint
kinematic, kinetic, and temporal variables. A series of masses was attached to
a participant’s upper arm while throwing as fast as possible. It was expected
that a heavier upper arm mass does not result in changes in kinematic
variables, but increases the joint forces and joint torques acting on the joints
of the dominant arm.
The third study consisted of two parts. The first part consisted of three-
dimensional simulations of throwing in order to predict the effect of additional
upper arm mass on ball release speed and throwing mechanics. In the
second part, overarm throws performed with additional upper arm mass were
analysed to confirm the findings of the throw simulations. The aim of the third
study was to identify the characteristics of an individual’s throwing technique
25
that determine their optimal upper arm mass. It was expected that an athlete’s
optimal upper arm mass could be predicted from the throw simulations and
that several kinematic and kinetic variables could be identified that determine
an athlete’s optimal upper arm mass.

26
Literature review
27
2.1. Throwing a projectile
Throwing a projectile is a skill our human-like ancestors developed millions of
years ago. The ability to throw allowed our ancestors to defend themselves and hunt
for prey, thus increasing their likelihood of survival (Young, 2009). No other species
is able throw as fast, as far, and as accurate as humans (Roach, Venkadesan,
Rainbow, & Lieberman, 2013). Throughout evolution, humans developed several
musculoskeletal and neurological adaptations that distinguished them from other
primates and enabled them to develop the skill of throwing (Calvin, 1982; Isaac,
1987; Larson, 2015; Roach, Lieberman, Gill, Palmer, & Gill, 2012; Roach &
Richmond, 2015a, 2015b). Today, throwing a projectile is used in sports such as
baseball, cricket, or javelin throw. Professional baseball pitchers release the ball at
velocities of around 130 km/h (Theobalt, Albrecht, Haber, Magnor, & Seidel, 2004),
cricket bowlers reach ball release speeds in excess of 140 km/h (Worthington, King,
& Ranson, 2013), and javelin throwers reach distances of nearly 100 m (Bartlett,
2000).
2.2. Human evolution and projectile throwing
Previous research suggests that skilled overarm throwing played a crucial role
in human evolution as it allowed humans to hit a target (enemy or prey) from a
distance, thus reducing the risk (Isaac, 1987) and increasing their chances of
survival (Young, 2009). Compared to chimpanzees, humans possess a taller, more
mobile waist, lower humeral torsion, and a more laterally orientated glenohumeral
joint, which allows humans to generate high projectile speeds (Roach et al., 2013).
Furthermore, the fully opposable thumb combined with the shorter fingers in the
28
human hand allow for a tight grip of the projectile and an accurate control of release
(Young, 2003). Even though these evolutionary adaptations allowed our ancestors to
throw projectiles at very high speeds, previous research suggests, that the human
body might not be optimal and that a higher upper arm mass could allow athletes to
increase their ball release speeds (Kim et al., 2008; Linthorne et al., n.d.; Southard,
1998). Comparing the mass of some of the projectiles thrown by our ancestors to the
mass of the projectiles used in today’s sports might suggest that the arm segment
masses of humans could be optimal for throwing objects used by our ancestors for
hunting and defence. Objects believed to be used by our ancestors as projectiles are
generally heavier (80 g to 1550 g) (Isaac, 1987) compared to projectiles used in
various sports (Baseball: 145 g; Water polo: 420 g) (Bartlett, 2000).
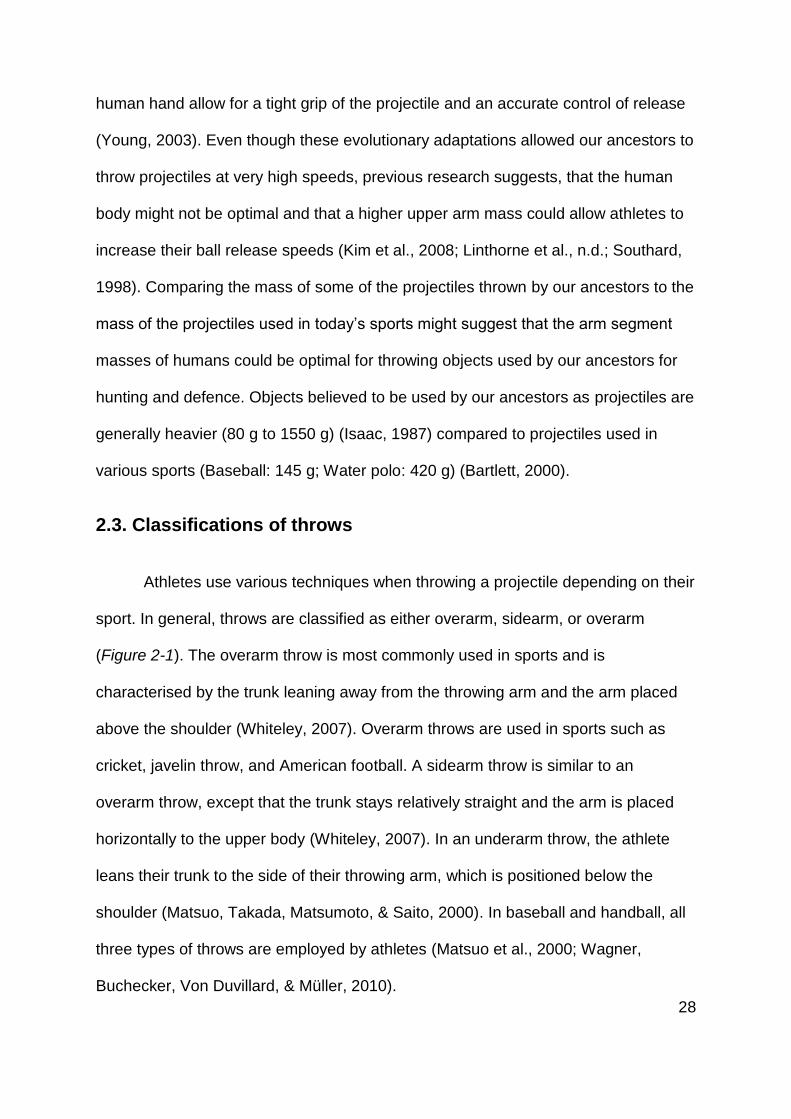
2.3. Classifications of throws
Athletes use various techniques when throwing a projectile depending on their
sport. In general, throws are classified as either overarm, sidearm, or overarm
(Figure 2-1). The overarm throw is most commonly used in sports and is
characterised by the trunk leaning away from the throwing arm and the arm placed
above the shoulder (Whiteley, 2007). Overarm throws are used in sports such as
cricket, javelin throw, and American football. A sidearm throw is similar to an
overarm throw, except that the trunk stays relatively straight and the arm is placed
horizontally to the upper body (Whiteley, 2007). In an underarm throw, the athlete
leans their trunk to the side of their throwing arm, which is positioned below the
shoulder (Matsuo, Takada, Matsumoto, & Saito, 2000). In baseball and handball, all
three types of throws are employed by athletes (Matsuo et al., 2000; Wagner,
Buchecker, Von Duvillard, & Müller, 2010).
29
Figure 2-1: Illustrations of throwing classifications in baseball pitching. The left picture shows an overarm throw. The middle picture displays a sidearm throw. The right image shows an underarm throw. (Adapted from Matsuo et al., 2000)
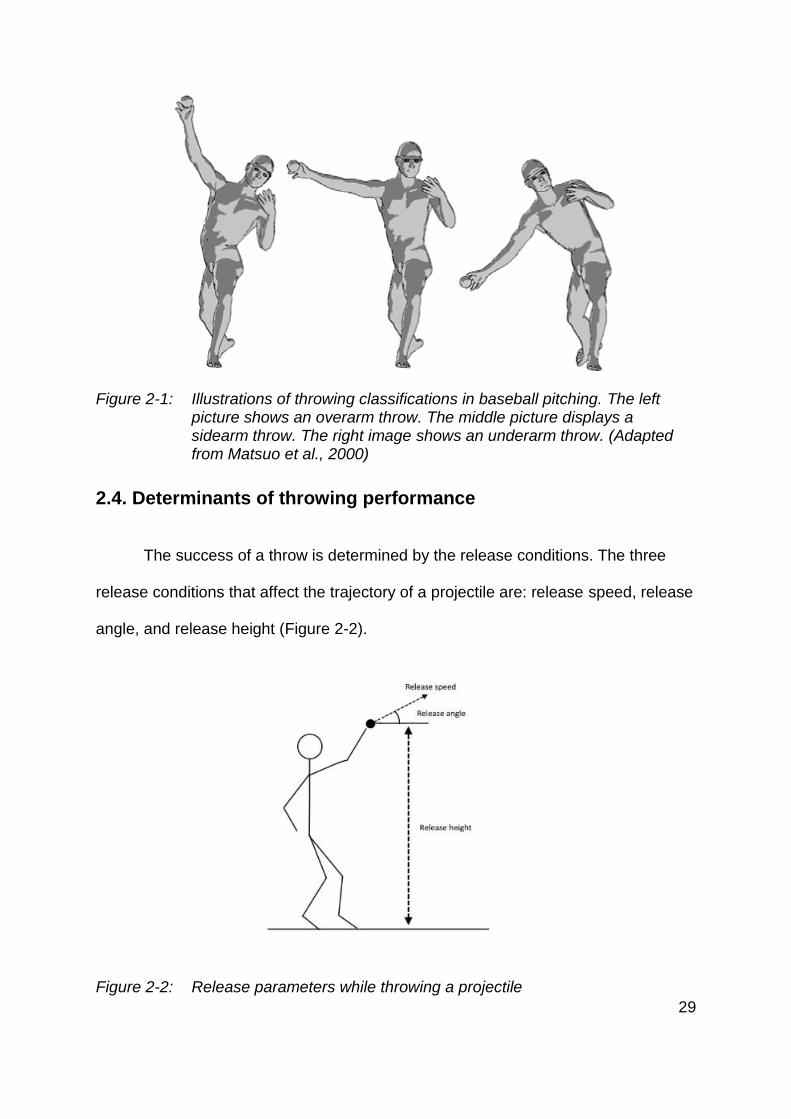
2.4. Determinants of throwing performance
The success of a throw is determined by the release conditions. The three
release conditions that affect the trajectory of a projectile are: release speed, release
angle, and release height (Figure 2-2).
Figure 2-2: Release parameters while throwing a projectile
30
2.4.1. Release angle
The trajectory of a projectile follows a parabolic shape in the absence of
aerodynamics, and so depends on both release angle and release speed (Bartlett,
2000). In many sports the main goal of throwing a projectile is to maximise the
distance thrown. In the absence of aerodynamics and with the projectile landing at
the same height as it is released and without any anatomical constraints, the optimal
release angle is 45°. However, in most sport events the optimal release angle is
considerably less than 45° because athletes can generate higher release velocities
with smaller release angles (Linthorne, 2006).
In other sports, like basketball for example, where the main aim of the
projectile is accuracy rather than distance thrown, the optimal release angle has
been reported to be between 45° and 55°, depending on the distance between the
ball release and the basket (Brancazio, 1981; Hay, 1985). Because in basketball the
ball has to pass through the basket from the top, the optimal release angle is
substantially higher than the ones measured in other sports.
In baseball or cricket, for example, the aim of the throw is to leave the
opponent with the least time possible to react to the flight of the ball, thus heavily
relying on the release speed. A study in cricket observed release angles of 6° to 8°
when throwing a ball over 20 m with the aim to reduce the flight time as much as
possible, and 8° to 18° when throwing the ball over 40 m (Cook & Strike, 2000). In
cricket bowling, release angles of around -6° have been reported for fast bowlers
(Cork, Justham, & West, 2012). In baseball, pitchers could use similar release
angles as reported in cricket as they release the ball from a 0.254 m high mound,
31
resulting in the target potentially being lower or at the same height as the release
height (Nissen et al., 2013). Fastballs in baseball have been reported to be released
with a vertical release velocity of around -2 m/s, meaning that the pitcher is throwing
the ball slightly downwards to reach the strike zone (Alaways, Mish, & Hubbard,
2001).
2.4.2. Release height
In projectile motion, the release height is the difference between the height at
which the projectile is released and the height of landing or the height of the target.
Projectiles that are released with the same release angle and release speed will
reach a larger distance when thrown from a higher release height. The landing
height mainly depends on the rules of the respective sport. In sports such as shot put
or javelin throw, the projectile lands on the ground. Therefore, the release height is
the same as the same as the height at which the projectile is released, which
depends on the athlete’s shoulder height and their arm position as they release the
projectile (Linthorne, 2006).
In baseball, however, as the aim of the throw is to reach the strike zone in the
shortest possible time, the target that the ball has to reach is positioned above the
ground. Additionally, the pitcher is starting his pitching motion while standing on a
0.254 m high mound, thus affecting the release height (Nissen et al., 2013). The
technique used by baseball pitchers allow them to have a very low release angle,
which results in a relatively low release height.
32
2.4.3. Release speed
The release speed of a projectile is the most important determinant of
throwing performance as the range achieved is multiplied by four if the release
speed doubles (Bartlett, 2000). Therefore, most athletes, independent of their sport,
aim at increasing their release speed of the projectile thrown. As previously
mentioned, due to anatomical restraints, humans are able to produce higher release
speeds at lower release angles (Linthorne, 2006). As a result, in order to be able to
increase their release velocity, athletes in various sports reduce their release angles
(Linthorne, 2001; Linthorne & Everett, 2006; Linthorne & Stokes, 2014).
In baseball, the release speed determines how much time the batter has to
react to the flight of the ball. The flight time of an average fastball has been reported
to be around 0.45 s (Alaways et al., 2001). Therefore, slight increases in release
speed can have a big effect on the success of a pitched ball, as it will leave the
batter with even less time to react. As baseball pitches are released with a very low
release angle and from a very low release height, release speed becomes even
more important as the target is nearly straight ahead from the point of release.
Additionally to the release speed, aerodynamics also influence the speed of the ball
as it approaches the batter. A reduction in speed of 3% to 7% of ball speed has been
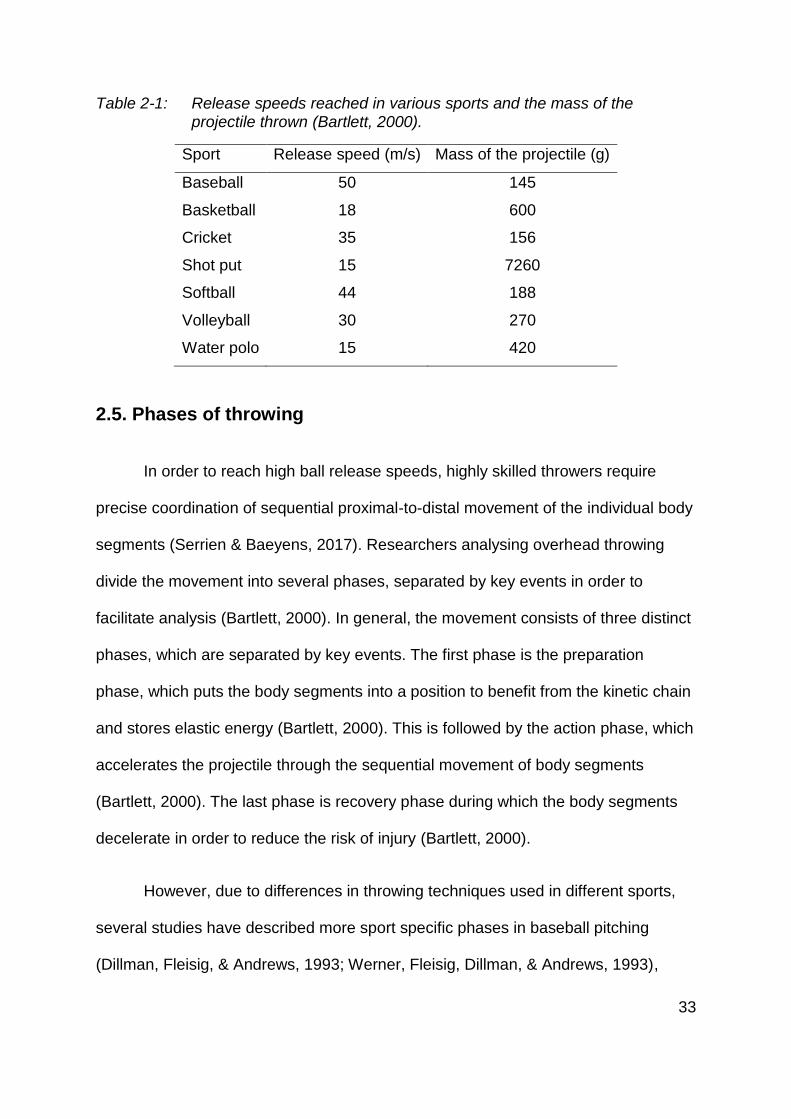
reported by the time the batter hits the ball (Alaways et al., 2001). Examples of ball
release speeds of several sports involving throwing a projectile and the
corresponding mass of the ball are presented in Table 2-1.
33
Table 2-1: Release speeds reached in various sports and the mass of the projectile thrown (Bartlett, 2000).
Sport Release speed (m/s) Mass of the projectile (g)
Baseball 50 145
Basketball 18 600
Cricket 35 156
Shot put 15 7260
Softball 44 188
Volleyball 30 270
Water polo 15 420
2.5. Phases of throwing
In order to reach high ball release speeds, highly skilled throwers require
precise coordination of sequential proximal-to-distal movement of the individual body
segments (Serrien & Baeyens, 2017). Researchers analysing overhead throwing
divide the movement into several phases, separated by key events in order to
facilitate analysis (Bartlett, 2000). In general, the movement consists of three distinct
phases, which are separated by key events. The first phase is the preparation
phase, which puts the body segments into a position to benefit from the kinetic chain
and stores elastic energy (Bartlett, 2000). This is followed by the action phase, which
accelerates the projectile through the sequential movement of body segments
(Bartlett, 2000). The last phase is recovery phase during which the body segments
decelerate in order to reduce the risk of injury (Bartlett, 2000).
However, due to differences in throwing techniques used in different sports,
several studies have described more sport specific phases in baseball pitching
(Dillman, Fleisig, & Andrews, 1993; Werner, Fleisig, Dillman, & Andrews, 1993),
34
American football passing (Fleisig et al., 1996), cricket bowling (Bartlett, Stockill,
Elliott, & Burnett, 1996), handball (Wagner et al., 2010), tennis (Hansen et al., 2017)
and baseball batting (Fleisig, Hsu, Fortenbaugh, Cordover, & Press, 2013). As the
goal of the throws performed in the experimental studies of this project is to throw as
fast as possible, the throws will be divided into the six phases as previously
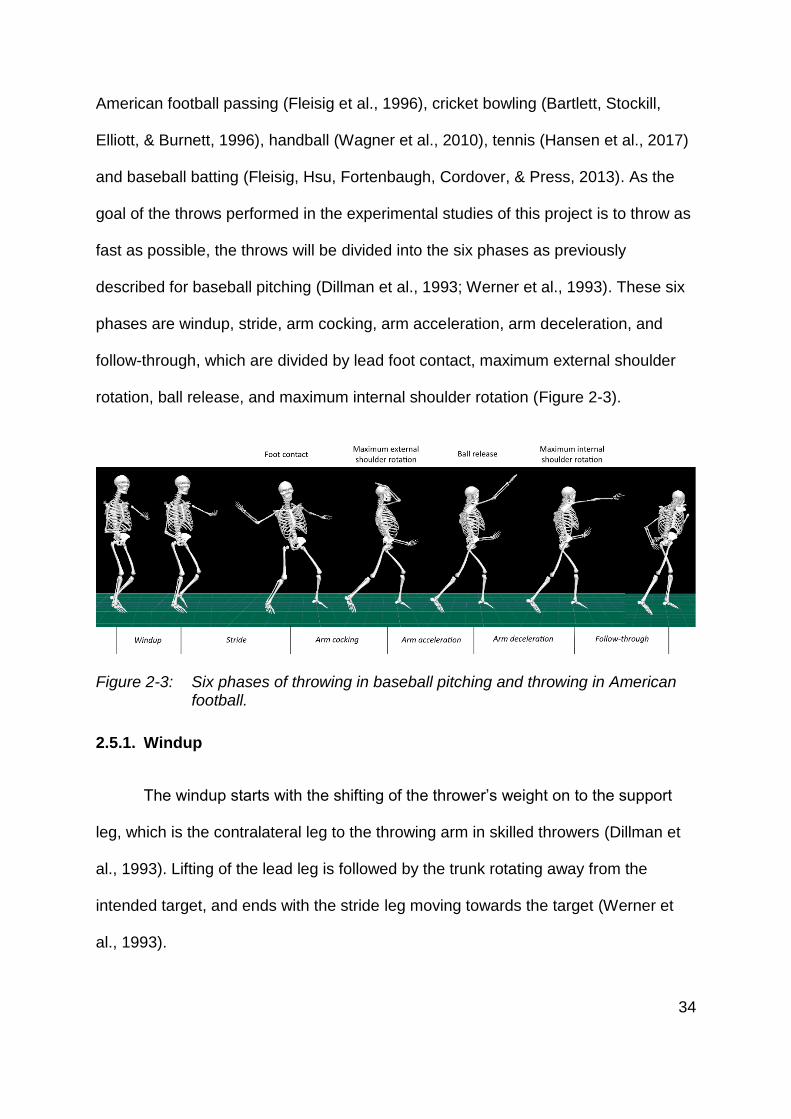
described for baseball pitching (Dillman et al., 1993; Werner et al., 1993). These six
phases are windup, stride, arm cocking, arm acceleration, arm deceleration, and
follow-through, which are divided by lead foot contact, maximum external shoulder
rotation, ball release, and maximum internal shoulder rotation (Figure 2-3).
Figure 2-3: Six phases of throwing in baseball pitching and throwing in American football.
2.5.1. Windup
The windup starts with the shifting of the thrower’s weight on to the support
leg, which is the contralateral leg to the throwing arm in skilled throwers (Dillman et
al., 1993). Lifting of the lead leg is followed by the trunk rotating away from the
intended target, and ends with the stride leg moving towards the target (Werner et
al., 1993).
35
2.5.2. Stride
The stride phase begins with the stride leg movement and ends with the front
foot contact (Werner et al., 1993). During this phase, the thrower’s weight shifts
towards the target. In order to benefit from the trunk rotation to contribute to the ball
release speed, the trunk should not rotate towards the target yet (Dillman et al.,
1993). Additionally, the stride length should be long enough in order to result in
sequential rotation of the hip followed by trunk rotation, which is crucial in order to
increase throwing velocity (Crotin, Bhan, & Ramsey, 2015) and reduce the risk of
injury (Aguinaldo, Buttermore, & Chambers, 2007; Fortenbaugh, Fleisig, & Andrews,
2009).
2.5.3. Arm cocking
The arm cocking phase starts with the front foot contact and ends with the
maximum external shoulder rotation, which lasts for 0.10 s to 0.15 s in baseball
pitchers (Fleisig & Escamilla, 1996). During this phase, the pelvis and trunk rotate
towards the target, while the arm lags behind, resulting in maximum external
shoulder rotation. Throughout the arm cocking phase, the optimal shoulder
abduction is around 90° (Matsuo, Matsumoto, Mochizuki, Takada, & Saito, 2002).
Shortly before highly skilled throwers reach maximum external shoulder rotation
angle, the elbow is extended in order to increase the moment of inertia of the arm to
further increase the external shoulder rotation angle (Stodden, Langendorfer, Fleisig,
& Andrews, 2006). Deviating from the proximal-to-distal sequence, as elbow
extension occurs before internal shoulder rotation, puts the different arm segments in
a position to benefit the most from the changing moment of inertia (Hirashima,
36
Yamane, Nakamura, & Ohtsuki, 2008). The correct arm position combined with a
lower humeral torsion measured in baseball pitchers enables highly skilled throwers
to increase the elastic energy stored at the shoulder during this phase (Roach et al.,
2013; Taylor et al., 2009).
2.5.4. Arm acceleration
The arm acceleration phase is the dynamic phase between the maximum
external shoulder rotation and the instant of ball release (Werner et al., 1993). During
this phase internal shoulder rotation initiates and the elbow extends (Fleisig &
Escamilla, 1996). Highly skilled throwers further extend their elbow, enhancing an
athlete’s ability to reach high internal shoulder rotation angular velocities of up to
10,000°/s (Werner et al., 2007) by decreasing the arm’s moment of inertia around
the longitudinal axis of the upper arm (Dillman et al., 1993). The ability of skilled
throwers to optimise the moment of inertia of the throwing arm during the arm
cocking and arm acceleration phases highlights the importance of the limb posture in
order to reach a high ball release speed (Hirashima et al., 2008).
2.5.5. Arm deceleration
After the athlete releases the ball, internal shoulder rotation and elbow
extension continues until the instant of maximum internal shoulder rotation (Dillman
et al., 1993). This phase is called arm deceleration as the internal shoulder angular
velocity and elbow extension angular velocity decreases and reaches zero.
37
2.5.6. Follow-through
The follow-through starts with maximum internal shoulder rotation and ends
when the athlete reaches a balanced position (Fleisig & Escamilla, 1996). Even
though this phase does not contribute to the ball release speed, a correct follow-
through is important in order to reduce the risk of injury (Fleisig, Andrews, Dillman, &
Escamilla, 1995). Movement of the large body segments such as the legs and trunk
assist the reduction of energy in the throwing arm in order to reduce the loads
especially on the shoulder and the elbow (Fleisig et al., 1995).
2.6. Kinetic chain
The different phases of throwing are characterised by a coordinated
sequential movement of body segments, which is known as the kinetic chain
(Putnam, 1993). A kinetic chain involves movement of several segments, where the
position and movement of one segment depends on the position and movement of
its neighbouring segments (Chu, Jayabalan, Kibler, & Press, 2016). A kinetic chain
can either be performed as a push-like or throw-like movement (Blazevich, 2007). A
push-like movement is characterised by the segments of the kinetic chain all moving
at the same time; whereas for a throw-like movement, a proximal-to-distal sequence
of segment movements is observed. Overarm throwing is performed using a throw-
like kinetic chain with the movement starting from the legs and finishing at the hand
when the projectile is released (Chu et al., 2016). This coordinated movement allows
highly skilled throwers to reach high ball release speeds due to conservation of
angular momentum between the body segments (Serrien & Baeyens, 2017).
38
2.6.1. Conservation of angular momentum
Angular momentum (H) is the product of moment of inertia (I) and angular
velocity (ω):
𝐻 = 𝐼𝜔
As a movement is initiated at the proximal segment, the angular momentum is
transferred to the distal segment as the proximal segment slows down. In human
movements such as overarm throwing, conservation of angular momentum results in
very high velocities of the most distal segments due to inertial parameters of the
body segments. In the early phases of the movement, the heavy proximal segments
generate large amounts of angular momentum. As the proximal segment slows
down, the angular velocity of the lighter distal segment increases, due to the lower
moment of inertia. In overarm throwing, the legs and trunk generate large amounts of
angular momentum. After the trunk rotation slows down, the angular velocity at the
shoulder increases due to the lower upper arm mass. The same principles applies at
the elbow and the wrist, resulting in very high ball release speeds.
2.6.2. Kinetic chain of throwing
The kinetic chain in overarm throwing is initiated by the heavy proximal
segments (the trunk), followed by the lighter distal segments (the arm segments),
resulting in the distal segments rotating faster than the proximal segments (Chu et
al., 2016). Throughout the kinetic chain, highly skilled throwers combine the inertial
parameters of their body segments and conservation of angular momentum to reach
high ball release speeds (Serrien & Baeyens, 2017). As a result, the outcome of the
kinetic chain is related to the magnitudes of joint torques, joint angular velocities, and
39
joint angles (Hirashima et al., 2008). Even though overarm throwing is a fluent
movement of coordinated movement between body segments, research has
focussed on key characteristics that has been related to throwing performance. A
review of key characteristics involved in the kinetic chain of overarm throwing will be
provided.
Inertial parameters of the kinetic chain
Skilled throwers are able to generate high ball release speeds by transferring
angular momentum from their proximal segments to their distal neighbours (Putnam,
1993). Due to the inertial parameters of each body segment along the kinetic chain,
humans manage to increase the angular velocity of the distal segments as the
proximal segments slow down (Chu et al., 2016). Baseball pitchers generate high
amounts of linear and angular momentum through rotation of the trunk segment
during the arm cocking and acceleration phases (Lin, Su, Nakamura, & Chao, 2003),
which are caused by the heavy mass of the trunk. The trunk segment accounts for
around 43% to 50% of the total body mass (de Leva, 1996; Dempster, 1955). Due to
conservation of angular momentum, the angular velocity of the lighter upper arm
segment increases. The same principle applies between the upper arm and the
forearm, and between the forearm and the hand. The mass of the arm segments are
substantially lower than the mass of the trunk segment. The upper arm mass
accounts for less than 3% of the total body mass, the forearm accounting for less
than 2% of the total body mass, and the hand segment around 0.5% of the total body
mass (de Leva, 1996; Dempster, 1955).
40
Analysis of the segmental muscle volumes of baseball pitchers reveals
differences in upper arm muscle volume of their dominant arm compared their non-
dominant arm and compared to football players (Yamada, Masuo, Nakamura, &
Oda, 2013). Additionally, a higher upper arm muscle volume in baseball pitchers has
been related to higher ball release speeds (Yamada, Yamashita, et al., 2013). The
changes in upper arm muscle volume in baseball pitchers could affect their ability to
reach high ball release speeds.
Temporal variables
Correct timing of key events during baseball pitching is crucial in order to
reach high ball release speeds and reducing the risk of injury (Seroyer et al., 2010).
The whole pitching motion starting from the wind-up until the instant of ball release
takes around 1.0 s (Freeston, Ferdinands, & Rooney, 2015). However, the phases
during which the arm moves towards the target, the arm cocking and arm
acceleration phases, only take around 0.15 s to 0.30 s (Stodden, Fleisig, McLean, &
Andrews, 2005; Urbin, Fleisig, Abebe, & Andrews, 2013; Werner, Suri, Guido,
Meister, & Jones, 2008), with the arm acceleration phase taking only around 0.04 s
(Freeston et al., 2015). The majority of the studies that analyse temporal variables in
baseball pitching report the relative timing of a key event as a percentage of the
throwing motion, starting from stride foot contact (0%) to ball release (100%).
Baseball pitchers reach maximum torso angular velocity at around 49% to
52% of the total pitch time depending on their skill level (Fleisig, Barrentine, Zheng,
Escamilla, & Andrews, 1999; Matsuo, Escamilla, Fleisig, Barrentine, & Andrews,
2001). Maximum external shoulder rotation occurs at around 81% during the pitching
41
motion, followed by maximum elbow extension angular velocity at 91% to 95%
(Matsuo et al., 2001; Stodden et al., 2005). Maximum internal shoulder angular
velocity occurs shortly after the ball is released at around 102% to 104%, occurring
earlier during the throw for more skilled throwers (Matsuo et al., 2001).
In addition to the timing of several key variables during the throwing motion,
the correct timing between some of these events have also been identified to affect
ball release speed. Baseball pitchers that increased the time between maximum
pelvis angular velocity and maximum trunk angular velocities managed to reach
higher ball release speeds (van der Graaff et al., 2016). Additionally, differences in
the time between joint movements were observed in children of various ages. In a
group of children that mastered the proximal-to-distal sequence, older children
reduced the time between shoulder and elbow movement, resulting in higher ball
release speeds (Southard, 2009).
Even though the proximal-to-distal sequence of movements has been
described to result in the highest ball release speeds (Serrien & Baeyens, 2017), this
sequence has not been observed in skilled baseball pitchers (Hirashima et al.,
2008). Elbow extension occurs before internal shoulder rotation in order to reduce
the moment of inertia of the throwing arm and favour the production of high internal
shoulder rotation angular velocities (Hirashima et al., 2008).
Legs
In throwing, the legs provide the stable base for the kinetic chain and are
crucial in producing high ball release speeds and decreasing the risk of injury
(Seroyer et al., 2010). When developing the skill of throwing, children employ various
42
strategies in order to increase ball velocity (Langendorfer & Roberton, 2002;
Roberton & Konczak, 2001). Whereas young children perform no step at all when
throwing a ball, more developed children use a small or ipsilateral step to increase
their ball release speed (Lorson & Goodway, 2008). The most advanced throwers
use a long contralateral step, which reaches values of around 74% to 87% of the
thrower’s body height in baseball pitchers and 61% in American football passing
(Fleisig et al., 1996; Matsuo et al., 2001). Correct stride length is also crucial in
reducing the risk of injury in baseball pitchers as it affects the timing of both the trunk
and upper arm rotations when baseball pitchers reduce their stride length to around
50% of their body height (Crotin et al., 2015; Ramsey & Crotin, 2016; Ramsey,
Crotin, & White, 2014).
In baseball pitching, the posterior ground reaction force of the stride leg during
the arm cocking phase has been identified to be related to wrist velocity as it brakes
the movement of the legs and allows the trunk to move forward (McNally, Borstad,
Onate, & Chaudhari, 2015). At the instant of stride foot contact, baseball pitchers flex
their stride leg knee to around 40° to 51° before extending the knee to around 28° to
43° (Fleisig et al., 1996, 1999; Kageyama, Sugiyama, Kanehisa, & Maeda, 2015;
Kageyama, Sugiyama, Takai, Kanehisa, & Maeda, 2014). The knee angle of the
stride leg at both the instants of stride foot contact and ball release have been
identified to affect ball release speed, with more skilled baseball pitchers increasing
their knee extension range of motion (Kageyama et al., 2014; Werner et al., 2008).
Additionally, baseball pitchers that reach higher ball release speeds generate higher
knee extension angular velocities compared to their counterparts that throw less fast
(Kageyama et al., 2014; Matsuo et al., 2001).
43
Trunk
Apart from the trunk being the heaviest segment in the throwing kinetic chain
and thus at the base of generating angular momentum, there are other
characteristics that are essential in our ability to throw. Humans have a taller, more
mobile waist compared to our closest relatives the chimpanzees, which facilitates the
rotation between the hips and the thorax (Bramble & Lieberman, 2004; Roach et al.,
2013). These decoupled body segments permit humans to generate angular
momentum through their legs and transfer it to their upper body. An increased range
of motion between the hips and the thorax combined with the relatively heavy mass
of the trunk, assists humans in producing and storing elastic energy at the shoulder
(Roach et al., 2013), which assists in generating high ball release speeds.
The heavy and flexible trunk allows skilled throwers to use a differentiated
trunk rotation where the pelvis rotates forwards while the upper part of the spine still
rotates away from the target before eventually rotating forwards as well
(Langendorfer & Roberton, 2002). Less developed throwers use no trunk rotation at
all; only forward-backward trunk movement or block trunk rotation (Roberton &
Konczak, 2001; Yan, Payne, & Thomas, 2000). An athlete’s trunk movement while
throwing a projectile not only affects the position and velocities of the trunk and
pelvis, but also affects the motion of the more distal body segments (Urbin, Stodden,
& Fleisig, 2013). Differentiated trunk rotation reduces the maximum shoulder
horizontal adduction angle while increasing the maximum external shoulder rotation
angle, and angular velocities at the shoulder and elbow (Urbin, Stodden, et al.,
2013).
44
In professional baseball pitchers, trunk axial rotation reaches angles of 55°
(Aguinaldo et al., 2007; Fleisig et al., 2013). Collegiate and adolescent baseball
pitchers employ less trunk axial rotation of around 45° to 48° in the build-up of the
throw (Kageyama et al., 2015, 2014). At the instant of ball release, professional
baseball pitchers use more trunk forward tilt compared to their collegiate or
adolescent counterparts. Professional baseball pitchers reach forward trunk angles
of around 122° while collegiate and adolescent baseball pitchers reach angles of
around 100° to the vertical (Fleisig et al., 1996; Kageyama et al., 2015, 2014). The
increase in forward tilt range of motion observed in professional baseball pitchers
enables them to accelerate the ball over a longer distance (Stodden et al., 2005).
Professional baseball pitchers reach trunk axial velocities of around 1200°/s (Fleisig
et al., 1999; Matsuo et al., 2001), and maximum forward trunk tilt angular velocities
of around 630°/s have been recorded for collegiate baseball pitchers (Kageyama et
al., 2015). Additionally, higher trunk angular velocities have been identified to
contribute to higher ball release speeds (Dowling, Pearl, Laughlin, Tubbs, & Fleisig,
2016).
Shoulder
In throwing, the shoulder joint is one of the major contributors to performance
as it connects the heavy trunk to the lighter arm segments, thus being responsible
for storing and transferring elastic energy (Roach et al., 2013). In baseball pitching,
the elastic energy stored at the muscles and tendons crossing the shoulder joint
accounts for up to 54% of internal shoulder rotation work, thus enabling skilled
throwers to reach joint angular velocities that surpass the power production
capacities of the internal shoulder rotator muscles (Roach et al., 2013). As the upper
45
arm lags behind the forward movement of the trunk, skilled throwers benefit from the
conservation of linear and angular momentum as well as the stretch-shortening cycle
of the muscles in order to maximise their ball release speed (Serrien & Baeyens,
2017).
Employing the proximal-to-distal sequence allows skilled throwers to reach
maximum external shoulder rotations of around 182° by professional baseball
pitchers (Sabick, Torry, Kim, & Hawkins, 2004), around 125° for baseball catchers
throwing while sitting on their knees (Plummer & Oliver, 2014), and around 164° in
professional American football quarterbacks (Fleisig et al., 1996). Baseball pitchers
have been shown to retain a lower humeral torsion in their throwing arm compared to
non-throwing athletes (Roach et al., 2012). Furthermore, differences in humeral
torsion have also been observed between the throwing arm and the non-throwing
arm of professional baseball pitchers. A lower humeral torsion means that through
passive stretching baseball pitchers reach greater maximum external shoulder
rotation (throwing arm: 135°; non-throwing arm: 126°) and lower maximum internal
shoulder rotation (throwing arm: 69°; non-throwing arm: 78°) in their throwing arm
compared to their non-throwing arm, while the total range of motion remains the
same (throwing arm: 203°; non-throwing arm: 204°) (Borsa et al., 2005). Similar
results have been found in experienced handball players (Fieseler, Jungermann,
Koke, Delank, & Schwesig, 2014).
A throwing athlete’s ability to reach large external shoulder rotation angles
during the arm cocking phase enables them to generate internal shoulder rotation
angular velocities of up to 10,000°/s in professional baseball pitchers (Werner, Gill,
Murray, Cook, & Hawkins, 2001), around 5000°/s in American football quarterbacks
46
(Fleisig et al., 1996), and around 2500°/s in handball players (Serrien, Clijsen,
Blondeel, Goossens, & Baeyens, 2015; van den Tillaar & Ettema, 2009). As most
throwing-related studies simplify the shoulder joint complex and reduce it to the
glenohumeral joint, the internal shoulder rotation is calculated in relation to the trunk.
A throwing study that incorporated scapula and clavicle movement into their shoulder
model recorded maximum internal shoulder rotation angular velocities of around
3100°/s in baseball pitchers (Gasparutto, van der Graaff, van der Helm, & Veeger,
2015). Previous studies have identified that the maximum internal shoulder angular
velocity is related to high ball release speeds (Fleisig et al., 1999; Hirashima, Kudo,
Watarai, & Ohtsuki, 2007; Werner et al., 2008).
A study analysing the interaction torques acting on the throwing arm of
baseball pitchers revealed, that the high internal shoulder rotation angular velocities
are produced by a combination of joint torques and interaction torques generated
through movement of the proximal segments (Hirashima, Kudo, Watarai, et al.,
2007). The interaction torques at the shoulder joint result in the maximum internal
shoulder angular rotation occurring close to the instant of ball release, even though
only a small amount of internal shoulder rotation torque is generated when an athlete
releases the ball (Hirashima et al., 2008).
Furthermore, several studies have identified the importance of the shoulder
abduction angle throughout the arm cocking and arm acceleration phase in baseball
pitching (Matsuo et al., 2002; Stodden et al., 2005). In overarm baseball pitching the
average shoulder abduction angle during the arm acceleration phase is between 90°
and 100° (Fleisig et al., 1996; Stodden et al., 2005) and the optimal shoulder
abduction angle at the instant of ball release is at around 90° (Matsuo et al., 2002;
47
Matsuo, Matsumoto, Takada, & Mochizuki, 1999). Using a three segment simulation
model, Matsuo et al. (2002) found that the peak in wrist velocity occurred at shoulder
abduction angles ranging between 80° and 114° for both overarm and underarm
baseball pitchers.
Elbow
Throughout the majority of the arm cocking phase, the elbow is flexed at
around 90° in baseball pitchers (Dun, Fleisig, Loftice, Kingsley, & Andrews, 2007;
Fleisig et al., 1999; Werner et al., 1993), extending shortly before the instant of ball
release to around 20° of elbow flexion (Fleisig et al., 1996). Experienced baseball
pitchers reach elbow extension angular velocities of around 2400°/s (Dun et al.,
2007), handball players reach velocities of around 1200°/s (Serrien et al., 2015), and
American football quarterbacks reach velocities of around 1800°/s (Fleisig et al.,
1996).
In overhead throwing, the elbow extension is mainly produced by interaction
torques generated through movement of the trunk and the upper arm (Hirashima et
al., 2008). The importance of the interaction torques in elbow extension are also
highlighted by the arm position and timing of joint rotations in baseball pitchers.
Flexing the elbow to around 90° throughout the arm cocking phase increases the
moment of inertia of the throwing arm, resulting in the upper arm lagging behind the
trunk movement and enabling skilled throwers to increase the maximum external
shoulder rotation angle (Stodden et al., 2006). As elbow extension in baseball
pitchers occurs before internal shoulder rotation, the moment of inertia around the
48
longitudinal axis of the upper arm is reduced, thus facilitating internal shoulder
rotation through interaction torques (Hirashima et al., 2008).
Forearm pronation/supination does not play a major role in generating ball
release speeds (Hirashima & Ohtsuki, 2008). During the arm cocking phase, the
forearm is supinated to around 17° before pronating by around 24° at the instant of
ball release (Barrentine, Matsuo, Escamilla, Fleisig, & Andrews, 1998). The peak
forearm pronation angular velocity occurs during the arm deceleration phase and
reaches values of around 5200°/s (Barrentine et al., 1998).
Wrist
In overarm throwing, the wrist movement does not contribute much towards
the ball release speed (Hirashima, Ohgane, Kudo, Hase, & Ohtsuki, 2003). When
throwing a fastball in baseball, pitchers reach wrist flexion angular velocities of
around 3000°/s during the arm acceleration phase (Barrentine et al., 1998). Even
though the wrist is flexed at instant of ball release, the wrist muscles still produce
wrist extension (Hirashima, Kudo, Watarai, et al., 2007). However, the interaction
torques generated at the forearm counteract the muscle torques and so keep the
wrist joint relatively stable at the instant of ball release (Hirashima et al., 2003), in
order to avoid affecting the force-producing capabilities of the finger muscles, which
are responsible to accurately release the ball (Hore, Watts, Leschuk, & MacDougall,
2001).
49
2.7. Injuries in overarm throwing
Apart from looking at improving performance, research on baseball pitching is
also concerned with reducing the risk of injury. Even though the rate of injuries in
college baseball is one of the lowest compared to other sports (Hootman, Dick, &
Agel, 2007), mainly because of the low percentage of player contact injuries (Dick et
al., 2007), the high percentage of injuries in baseball pitchers justifies research into
injury prevention in overarm throwing. A report on Major League Baseball from 1989
to 1999 highlighted that pitchers in particular are susceptible to injuries, and
accounted for 48% of all injuries during this time period (Conte, Requa, & Garrick,
2001). Similar percentages have been reported from 2002 to 2008, and 67% of the
pitchers’ injuries occurred at the upper extremity (Posner, Cameron, Wolf, Belmont,
& Owens, 2011). Around 30% of these injuries occur at the shoulder joint, and
around 25% occur at the elbow joint (Conte et al., 2001; Posner et al., 2011).
Therefore, identifying factors that increase the risk of injury in overarm throwing is
crucial for professional throwing athletes.
2.7.1. Kinetic variables associated with injuries
Overuse injuries in overarm throwing are caused by high forces and torques
acting frequently on the joints of the throwing arm (Fortenbaugh et al., 2009). As well
as the maximum internal shoulder rotation torque, maximum shoulder compression
force and maximum elbow valgus torque have also been associated with injuries in
baseball pitchers (Fleisig et al., 1995). Shoulder compression forces of about 1100 N
(about 108% of a professional baseball pitcher’s body weight) have been recorded
close to the instant of ball release (Fleisig et al., 1995; Werner et al., 2001).
50
Maximum elbow valgus torque of about 120 N·m in professional baseball pitchers
(Buffi, Werner, Kepple, & Murray, 2015; Werner et al., 1993) and about 20 N·m in
youth baseball pitchers (Sabick, Torry, Lawton, & Hawkins, 2004) occur during the
arm cocking phase at the same time as maximum internal shoulder rotation torque,
which reaches values of about 100 N·m (Anz et al., 2010; Sabick, Torry, Kim, et al.,
2004).
In professional baseball pitchers, maximum internal shoulder rotation torque
has been identified as causing higher shoulder compression force (Werner et al.,
2001), but has not been associated with high shoulder compression force in college
baseball pitchers (Werner et al., 2007). Maximum shoulder abduction torque affects
the generation of higher shoulder compression force as well (Werner et al., 2007,
2001). Furthermore, maximum internal shoulder rotation torque affects elbow valgus
torque in professional baseball pitchers and youth baseball pitchers (Sabick, Torry,
Lawton, et al., 2004; Werner, Murray, Hawkins, & Gill, 2002). In general, the
previously mentioned studies suggest that in order to reduce the risk of injury,
athletes have to reduce their joint torques and joint forces while maintaining the
same ball release speed.
2.7.2. Kinematic variables associated with injuries
Increases in kinetic variables of overarm throwing are caused by several
kinematic variables and thus are pathomechanical (Fortenbaugh et al., 2009). In
professional baseball pitchers, high shoulder compression force is caused by the
maximum external shoulder rotation angle, and the elbow angle at the instant of lead
foot contact and at the instant of ball release (Werner et al., 2001). The importance
51
of the elbow flexion angle to reduce shoulder compression force is also observed in
college baseball pitchers, as well as the maximum horizontal shoulder adduction
angle (Werner et al., 2007).
Elbow valgus torque is affected by elbow flexion angle, maximum external
shoulder rotation angle, shoulder abduction angle, and horizontal shoulder adduction
angular velocity in baseball pitchers of various levels and ages (Aguinaldo &
Chambers, 2009; Sabick, Torry, Lawton, et al., 2004; Werner et al., 2002).
Furthermore, Matsuo et al. (2002) performed three-dimensional throw simulations to
determine the optimal shoulder abduction angle that increases performance and
reduces the elbow valgus torque. Even though a different optimal shoulder abduction
angle was observed for each participant, the study highlighted that baseball pitchers
already employ shoulder abduction angles that minimise the stresses on the
shoulder and elbow joints (Matsuo et al., 2002).
2.7.3. Temporal characteristics associated with injuries
Efficient use of the kinetic chain allows baseball pitchers to decrease forces
and torques that act on the joints of the throwing arm, while reaching high ball
release speeds (Fortenbaugh & Fleisig, 2009). Aguinaldo et al. (2007) observed
lower internal shoulder rotation torques in professional baseball pitchers compared
to less experienced baseball pitchers. A later onset of trunk rotation allowed the
professional baseball pitchers to reach higher ball release speeds, while also
generating less internal shoulder rotation torque. Similar findings have been
observed in relation to the elbow valgus torque. Baseball pitchers that started
rotating their trunk before lead foot contact produced a higher elbow valgus torque
52
compared to the pitchers that delayed trunk rotation (Aguinaldo & Chambers, 2009).
Athletes that manage to increase the transfer of energy from the trunk to the
throwing arm through proper throwing mechanics need to generate less torque at the
shoulder and elbow to reach the same ball release speed, and hence have a lower
risk of injury (Seroyer et al., 2010).
2.8. Experimental vs. simulation design
In biomechanics, either an experimental or a simulation approach can be
used to analyse and describe movements. An experimental approach provides
information about kinematic and kinetic variables of the analysed movement (Pandy,
2001). Simulation studies typically use a simplified representation of the physical
system in order to determine how changes to a variable affect the movement or
other variables analysed (Yeadon & King, 2008). The approach used depends on the
research questions.
2.8.1. Pros and cons of different study designs
Both experimental and simulation study designs have advantages and
disadvantages, which should be taken into consideration before planning a study.
The advantage of an experimental approach is that researchers are analysing actual
movement irrespective of the instructions the participants are given (Yeadon & King,
2008). Even if the researcher instructs the participant to change certain aspects of
their movement, a realistic movement will still be recorded. However, the
disadvantage of an experimental approach is that attempting to change one variable
might affect several other variables (Yeadon & King, 2008).
53
Employing a simulation approach enables researchers to design an ideal
theoretical experiment, which allows them to change a single variable and analyse
the effect this has on the movement (King & Yeadon, 2015). A disadvantage of such
an approach is that the analysed movement does not represent the actual movement
of a participant. Changing a certain variable of a participant’s movement could
potentially result in a different outcome to the results obtained from computer
simulations.
2.8.2. Force-velocity relationship
The maximum force that a muscle can generate depends on the velocity at
which the muscle is contracting. In the concentric phase, higher forces are produced
at low velocities and lower forces at higher velocities, whereas in the eccentric
phase, higher forces are generated at high velocities (Yeadon, King, & Wilson,
2006). This relationship affects humans’ ability to generate joint torques and thus
impacts movements such as overarm throwing (Kentel, King, & Mitchell, 2011).
2.8.3. Computer models of the upper body
Various studies have used computer models to analyse throwing in order to
improve throwing performance or prevent injuries. The shoulder joint complex in
particular causes some challenges to researchers. The shoulder joint complex
consists of three joints; the glenohumeral joint, the acromioclavicular joint, and the
sternoclavicular joint. These joints link the trunk to the humerus, scapula, and
clavicle (Terry & Chopp, 2000). Due to the complexity of the human shoulder, a lot of
research has focussed on developing accurate shoulder models to analyse arm
movement.
54
Shoulder models used in throwing studies
In three-dimensional throwing studies, most researchers employed a
simplified shoulder model that restricts movement to the glenohumeral joint (Fleisig
et al., 1996; Hirashima, Kudo, Watarai, et al., 2007; Hong, Cheung, & Roberts, 2001;
Hore, Debicki, Gribble, & Watts, 2011; Keeley, Oliver, & Dougherty, 2012; Roach &
Lieberman, 2014). The main reason for using a simplified shoulder model is the
difficulties of accurately tracking the scapula with skin markers during fast arm
movements because of the displacement between the scapula and the skin (Veeger,
Chadwick, & Magermans, 2003).
Several studies have used an electromagnetic tracking device to record
scapula movement (Meyer et al., 2008; Myers, Laudner, Pasquale, Bradley, &
Lephart, 2005; Oliver & Weimar, 2015) or reflective skin markers tracked by high
speed cameras (Miyashita, Kobayashi, Koshida, & Urabe, 2010). However, all of
these studies acknowledged the limitations of their procedures caused by potential
skin movement. A study by Gasparutto et al. (2015) used regression equations to
estimate the glenohumeral joint centre and the movement of the scapula to analyse
the joint velocities at the shoulder produced by Dutch baseball pitchers.
Joint rotation sequence in throwing studies
Apart from differences in the shoulder models used in throwing studies,
researchers have used various joint rotation sequences for the shoulder joint when
analysing overarm throwing. The most commonly used rotation orders are the ISB-
recommended YXY sequence (Gasparutto et al., 2015; Keeley et al., 2012) and the
XYZ sequence (Dillman et al., 1993; Feltner & Dapena, 1986; Fleisig et al., 1996;
55
Roach et al., 2013). Three-dimensional kinematic analysis of the glenohumeral joint
is complicated, due the large range of motion, which can result in gimbal lock (Šenk
& Chèze, 2006). However, studies comparing the results of several joint rotation
sequences concluded that there is no one sequence that best describes each
shoulder rotation while also avoiding gimbal lock (Phadke, Braman, LaPrade, &
Ludewig, 2011; Šenk & Chèze, 2006). Therefore, in the present project I decided to
follow the ISB recommendations, as they were proposed in order to facilitate
comparison between studies (Wu et al., 2005).
2.9. Changes of inertial parameters in overarm throwing
Various aspects of overarm throwing have been analysed in order to
understand how humans employ the proximal-to-distal sequence to generate high
ball release speeds (Putnam, 1993; Serrien & Baeyens, 2017), improve throwing
performance (Fortenbaugh & Fleisig, 2009; Matsuo et al., 2002), and reduce the risk
of injury (Aguinaldo et al., 2007; Aguinaldo & Chambers, 2009; Werner et al., 2001,
2002). However, only limited research has been done to analyse how arm segment
masses affect overarm throwing. In overarm throwing, the body segment masses
facilitate the generation of high ball release speeds because the proximal segments
are heavier than the distal segments (de Leva, 1996; Dempster, 1955). Analysing
how changes in body segment mass affect overarm throwing could help athlete’s to
increase throwing performance without increasing the risk of injury.
2.9.1. Upper arm mass
Several studies have analysed the effect that changes in arm segment mass
distribution has on the ability to throw a projectile as far or as fast as possible.
56
Southard (1998) analysed the throwing performance of participants from four
different skill levels while attaching additional masses to the different segments of
the throwing arm. In this study, the skill levels were based on the participant’s ability
to perform a proximal-to-distal sequence of segment motions. Attaching an additional
1.4 kg of mass to the participant’s upper arm resulted in an increase in ball release
speed by 6.4% for the less skilled throwers. The additional upper arm mass enabled
the participants to improve their throwing technique as the heavier upper arm mass
caused the movement of the distal segments to lag behind the proximal segments.
Kim et al. (2008) attached various masses to the participant’s upper arm and
they were asked to swing their arm as fast as possible. The researchers observed a
slight increase in horizontal arm swing velocity with an upper arm that was increased
by 25% and 50% from the participant’s actual upper arm mass. The greatest
increase in horizontal arm swing velocity was about 1.4% and this was recorded with
50% of additional upper arm mass (about 1 kg). However, increasing the upper arm
mass by 75% and 100% of the participant’s upper arm mass resulted in a lower
horizontal arm swing velocity.
As the studies by Southard (1998) and Kim et al. (2008) observed an increase
in performance with a heavier upper arm mass for some of their participants, these
findings suggest that there is an optimal upper arm mass that enables athletes to
maximise their throwing performance. Linthorne et al. (n.d.) analysed how different
amounts of mass attached to the upper arm affect the distance thrown in a modified
javelin throw using an 800 g training ball. They found that there is an optimal upper
arm mass ranging between 0.21 kg and 0.60 kg of additional mass which produced
an average increase in distance thrown by 5.4%. Furthermore, the results of a
57
simple two-segment computer model of throwing broadly agreed with the
participant’s optimal upper arm mass.
2.9.2. Forearm mass
On the other hand, attaching additional mass to the more distal segments
(forearm and hand) of the throwing arm results in a decrease in throwing
performance and horizontal arm swing velocity (Kim et al., 2008; Southard, 1998).
Increasing the mass of the forearm segment or hand segment results in a decrease
in ball release speed (Southard, 1998). A similar decrease also occurred to the
horizontal arm swing velocity as the moment of inertia of the arm increases with
additional mass attached to the distal segments, thus negatively affecting the end-
point velocity (Kim et al., 2008).
2.9.3. Risk of injury
Even though previous studies have analysed the effect of additional upper
arm mass on throwing performance (Kim et al., 2008; Linthorne et al., n.d.; Southard,
1998), no research has focussed on how a heavier upper arm mass would affect an
athlete’s risk of injury. A simplistic application of Newton’s second law of motion
suggests that athletes have to generate higher forces and torques with a heavier
segment mass so as to produce the same acceleration (Fortenbaugh et al., 2009).
However, improvements to the proximal-to-distal sequence and to the mechanical
efficiency of the throwing motion could influence the loads acting on the joints and
so, heavier segment masses might not necessarily result in an increased risk of
injury (Fortenbaugh & Fleisig, 2009). The Improvement in the kinetic chain of less
skilled throwers with additional upper arm mass observed by Southard (1998)
58
suggests that these participants also managed to reduce the loads that acted on
their joints during the throws. However, further research on how changes in arm
segment masses affects joint forces and joint torques is required in order to
determine if additional upper arm mass increases the risk of injury in overarm
throwing.
2.10. Summary
The ability to throw has been identified as a crucial skill when it came to the
survival of our ancestors as it allowed them to hunt for prey and defend themselves
(Young, 2009). Throwing ability is facilitated by several anatomical characteristics of
the human body (Roach et al., 2013), including the mass distribution of the different
body segments, which allows us to benefit from the kinetic chain principle, thus
reaching a very high velocity at the hand (the lightest and most distal segment)
(Putnam, 1993).
Some studies have suggested that the mass distribution of the segments of
the throwing arm can be improved in order to reach a higher ball release speed (Kim
et al., 2008; Southard, 1998) and increase the distance thrown (Linthorne et al.,
n.d.). These studies suggest that athletes can benefit from a heavier upper arm
mass, whereas increasing the mass of either the forearm or hand segment results in
a decrease in performance. Although these studies highlight the importance of the
arm segment masses to an athlete’s ability to throw a projectile, only the study by
Linthorne et al. (n.d.) suggests that there is an optimal upper arm mass that results
in the highest throwing performance and that this optimal mass might be specific to
the participant.
59
Even though several studies have shown that throwing athletes might benefit
from a heavier upper arm mass to increase their ball release speed or distance
thrown, further research is required in order to determine if athletes should attempt to
optimise their upper arm mass. No previous study has analysed how a heavier arm
segment mass affects throwing mechanics and how changes in segment mass
determine an athlete’s optimal upper arm mass. Furthermore, changing arm
segment masses in combination with joint torques in a full-body throwing model
would provide further information about how arm segment masses are related to an
athlete’s ability to throw a ball as fast as possible.
The overall aim of the present project was to identify an athlete’s optimal
upper arm mass in overarm throwing, and to determine if additional upper arm mass
affects the risk of injury. The findings of the present project was expected to provide
throwing athletes with further evidence on whether they should attempt to optimise
the masses of their arm segments.
60
Optimal mass of the arm segments in
overarm throwing: A 2D simulation study.
61
3.1. Introduction
The main characteristic of a throwing motion is the kinetic chain. Through the
use of this proximal-to-distal sequence, humans are able to throw a projectile with
both high velocity and high accuracy (Putnam, 1993; Seroyer et al., 2010). In many
sports (eg. baseball, handball, water polo, etc.) the aim is to achieve a very high
projectile velocity in order to leave the opponent with little time to react. The kinetic
chain in such sports involves the athlete starting the throwing movement with their
legs, followed by trunk rotation, before transferring the generated energy to their arm
(Roach et al., 2013). This mechanism results in a very high angular velocity of the
lighter distal segments as their heavier proximal neighbour segments slow down
(Pappas, Zawacki, & Sullivan, 1985).
The proximal-to-distal sequence of body segment movement allows humans
to reach higher angular velocities at the distal segments, which cannot be produced
by the muscles acting on that segment alone, but are assisted by the movement of
the proximal segments (Putnam, 1991). Thus, the motion of a segment depends on
the motion and the position of its neighbouring segment (Putnam, 1993). In overarm
throwing, several studies have shown that elbow extension is mainly produced by
interaction torques generated by the movement at the shoulder, which highlights the
importance of optimising the sequential movement along the kinetic chain (Feltner,
1989; Hirashima et al., 2008). Several studies used two-dimensional arm models to
determine that a proximal-to-distal onset of either muscle activation (de Lussanet &
Alexander, 1997) or joint torques (Herring & Chapman, 1992) lead to the best
throwing performance. The latter study confirmed that this joint torque pattern is the
best, irrespective of changes to segment characteristics (mass and length). These
62
studies highlight the complex nature of the multisegmental throwing movement, as
the central nervous system has to combine coordination of muscle forces and the
anthropometric parameters of the different body segments involved. A lot of
biomechanical research in overarm throwing has focused on the coordination of
muscle forces or joint torques in order to improve throwing performance. However,
an area that has only attracted little attention so far in throwing-related studies is the
effect that anthropometric parameters have on throwing performance.
The human anatomy, with the segments at the start (eg. trunk) of the kinetic
chain being heavier and having a greater moment of inertia than those at the end
(eg. forearm, hand) (de Leva, 1996), allows for the generation of high end point
velocities, resulting in high projectile release velocities. Several studies observed
that changing the mass distribution of the arm segments can lead to increases in
throwing performance and improvements in throwing technique (Kim et al., 2008;
Linthorne et al., n.d.; Southard, 1998). However, no study has analysed the optimal
distribution of arm segment masses that results in the highest ball release speed.
3.1.1. Inertial parameters in throwing
Many studies have focused on describing the throwing techniques for various
sports (Bartlett et al., 1996; Fleisig et al., 1996; Worthington et al., 2013) and how to
improve throwing performance through training programs (van den Tillaar, 2004).
However, there is limited research on how the inertial parameters of the arm
segments affect throwing velocity or throw distance (Kim et al., 2008; Linthorne et
al., n.d.; Southard, 1998). Although the mass distribution of the human arm very
likely assists the generation of high release velocities, these studies suggest that the
63
mass distribution might not be optimal. A study by Southard (1998) observed an
increase by around 6.4% in ball release speed while attaching around 1.4 kg of
additional mass at the centre of mass of the upper arm. An increase by around 1.4%
in horizontal arm swing velocity was measured in another study that attached around
1.0 kg to the upper arm (Kim et al., 2008). The authors argue that the relatively low
increase in arm swing velocity was caused by the use of the non-dominant arm,
which has been shown to affect the ability to regulate interaction torques (Sainburg,
2002). A study by Linthorne et al. (n.d.) observed an increase in throw distances of 1
to 3 m (3-8%) in javelin throwers as additional mass was added to the upper arm of
the participants. However, the optimal mass added to the upper arm was specific to
each participant.
On the other hand, increasing the mass of the forearm or the hand segment
resulted in a decrease in ball release speed (Southard, 1998) and horizontal arm
swing velocity (Kim et al., 2008). Kim et al. (2008) explained the decrease in
horizontal arm swing velocity by the increase of the system’s moment of inertia,
which overpowered the higher muscle torque produced by the participants. A similar
effect on the ball release speed was also identified while using a wrist brace in order
to restrict the range of motion during an overarm throw (Roach & Lieberman, 2014).
As this brace increased the mass at the distal end of the kinetic chain, the throws
resulted in a decrease in ball release speed. Studies using a double pendulum
simulation of a throwing motion and a double pendulum simulation of a forehand in
tennis came to similar conclusions. Throwing heavier balls resulted in a decrease in
throwing velocity (Cross, 2004) and a heavier racket led to a decrease in racket tip
speed (Cross, 2011). Therefore, identifying an optimal relationship between the
64
upper arm mass and the forearm can assist athletes in generating higher projectile
velocities.
3.1.2. Importance of upper limbs in throwing
Although an advanced throwing motion is characterised by an efficient
transfer of energy through the whole kinetic chain, the upper limbs play the dominant
role in generating a high ball release speed. According to previous research
(Toyoshima, Hoshikawa, Miyashita, & Oguri, 1974), 53% of the ball velocity in an
overarm throw is produced by the upper limbs. However, other studies, analysing
similar throwing motions, have shown that not all the angular rotation of the shoulder,
elbow, and wrist joints are produced by the respective muscles crossing these joints
(Feltner, 1989; Hirashima et al., 2008; Hong et al., 2001). The rapid joint rotations,
especially at the elbow and the wrist, are largely due to interaction torques generated
at the heavier proximal segments (Hirashima, Kudo, Watarai, et al., 2007). At the
shoulder joint, a substantial amount of the rotation is produced by the various
shoulder muscles, whereas the rest is transferred from more proximal segments
(Hirashima, Kudo, Watarai, et al., 2007). Similar results were obtained by a study of
ball release speed in cricket bowling by Zhang, Unka and Liu (2011). The
investigators observed a contribution of up to 50% from the shoulder rotations to the
ball release speed. The findings of the previously mentioned studies highlight the
importance of upper limb motions in an efficient overarm throw.
3.1.3. Temporal lag of joint rotations in throwing
Temporal lag between the different joint rotations plays an important role in an
athlete’s throwing motion. Highly skilled throwers are able to produce a proximal-to-
65
distal sequence of joint rotations in order to maximise the ball release speed
(Putnam, 1993). Additionally, a decrease in elbow lag was observed for the most
skilled throwers compared to their less skilled counterparts (Southard, 2009).
Several studies have focused on the arm motion during throwing and the importance
of the temporal lag between elbow and shoulder rotations in order to improve
performance and reduce the risk of injury (Fortenbaugh et al., 2009; Matsuo et al.,
2001). An increase in time between the peak angular velocities of the upper torso
and the elbow extension resulted in a decrease in ball release speed and a decrease
in joint torques (Urbin, Fleisig, et al., 2013). However, other studies suggest that
athletes can optimise the temporal lag between joint rotations in order to reach the
same ball release speed and at the same time decrease the joint kinetics and thus
reduce the risk of injuries (Herring & Chapman, 1992). In a three-segment simulation
(upper arm, forearm and hand), they demonstrated that the highest release velocity
was obtained with the elbow torque onset occurring 200 ms after the onset of the
shoulder torque, followed by the wrist torque onset 40 ms after the elbow torque.
These results not only confirm the importance of the temporal lag of a distal
segment compared to their proximal neighbour, but also the importance of the
correct timing in order to optimise transfer of energy between the segments.
Attaching additional mass to the upper arm of less skilled throwers resulted in
changes in temporal lag between the different segments (Southard, 1998). Whereas
these subjects did not produce a proximal-to-distal sequence of maximum arm
segment velocity, a heavier upper arm mass results in a more advanced throwing
motion. Therefore, the researchers expect that optimising the arm segment mass
66
distribution results in an improved temporal lag between maximum joint angular
velocities that cause an increase in projectile velocity.
3.1.4. 2D throwing models
In biomechanics, computer simulation models are used in order to improve
performance or reduce the risk of injuries. These simulations allow for one variable
at a time to be changed, thus carrying out ideal theoretical experiments (King &
Yeadon, 2015). Computer simulation models can range from very simple two-
dimensional models to complex three-dimensional full-body models. The main rule is
that the model should be as simple as possible while having the required complexity
to allow the research question to be answered (Yeadon & King, 2008). Several
studies have used simple two-dimensional rigid body computer models in order to
analyse mechanical principles in overarm throwing.
A two-segment arm model was created to analyse the timing of muscle
activation onset (Chowdhary & Challis, 1999) and a three-segment model was
created to analyse the timing of joint torque onset in throwing (Herring & Chapman,
1992). Reducing the complexity of the models in these studies enabled the
researchers to highlight the importance of the proximal-to-distal sequence in order to
improve throwing performance. Another study, also using a two-segment arm model
to examine the coordination patterns of throwing, suggested that the physical
properties of the arm segments have an influence on the proximal-to-distal patterns
(Chowdhary & Challis, 2001). Similar outcomes are observed by a study using a
three-segment model to analyse interaction torques in throwing, confirming that
humans’ central nervous system uses the biomechanical properties of the throwing
67
arm in order to achieve higher projectile velocities (Debicki, Watts, Gribble, & Hore,
2010).
The findings of the studies on a multisegmental movement indicate the
importance of analysing different arm segment mass distributions in more detail in
order to determine their effect on throwing performance and on the throwing motion.
In order to isolate each individual variable, a computer simulation model is required
in this study. As the main focus of this study is to determine an optimal relationship
between the upper arm mass and the forearm mass, a two-dimensional torque-
driven arm model with two segments was considered sufficient in order to fulfil the
aims of the present study.
3.1.5. Aims of the study
Although previous studies have identified that ball release speed depends on
the mass of the arm segments, it is not known if there is an optimal combination of
arm segment masses that produces the highest ball release speed. Therefore, the
aim of the present study was to determine the combination of upper arm and forearm
masses that optimises throwing performance. A two-dimensional computer
simulation model of throwing was developed. The two-segment model was driven by
a shoulder torque and an elbow torque. The outcome of the present study could be
beneficial for athletes that are required to throw a projectile as fast as possible by
providing them with information about how arm segment masses could affect their
performance.
68
3.1.6. Hypothesis
Several hypotheses were tested in the present study:
Ball release speed decreases as forearm mass increases.
There is an optimal upper arm mass that results in the highest ball release
speed.
The optimal upper arm mass leads to improvements in timing between
maximum upper arm angular velocity and maximum forearm angular velocity.
69
3.2. Methods
A two-dimensional simulation model of throwing was created using Working
Model 2D software (Design Simulation Technologies Inc., Canton, MI, USA). The
model was driven by joint torques at the shoulder and at the elbow. The torque
values in the model were obtained experimentally from a participant performing a
similar throwing motion. The throw simulations were run for 320 combinations of
upper arm and forearm masses. In addition, five shoulder torque values were
investigated, resulting in a total of 1600 simulated throws. A simplified two-
dimensional model was chosen for this study in order to investigate whether an
optimal arm segment mass exists and investigate the mechanisms that determine
the optimal mass distribution. Even though the throwing technique in this simulation
study differs from the techniques used by athletes in sports throwing, similar models
have been successfully used in order to verify different mechanisms related to the
kinetic chain (de Lussanet & Alexander, 1997; Herring & Chapman, 1992).
3.2.1. Participant
One physically active male participant (age: 30 years, height: 1.72 m, mass:
68.0 kg) took part in the study. The participant used his dominant arm (right) to throw
a tennis ball at a target. The participant had no advanced expertise in any particular
throwing-related activity. The study was conducted in the Biomechanics Laboratory
at Brunel University London. The Research Ethics Committee at Brunel University
London approved the research protocol, and before the start of the testing a detailed
explanation of the protocol was provided to the participant and informed consent was
obtained.
70
The participant’s upper arm mass was calculated to be 1.90 kg and his
forearm mass 1.09 kg, based on the body proportion data reported by Dempster
(1955). Values for the upper arm and forearm masses for adult males of different
masses are presented in Table 3-1. The moment of inertia about an axis through the
centre of mass of each arm segment was adjusted according to the mass of each
segment used in the simulated throws, using the following equation:
𝐼 = 𝑚 ∗ (𝐾𝑐𝑔 × 𝑠𝑒𝑔𝑚𝑒𝑛𝑡 𝑙𝑒𝑛𝑔𝑡ℎ)2
where 𝐼 is the moment of inertia, 𝑚 is the segment mass and 𝐾𝑐𝑔 is the radius of
gyration about the centre of mass.
Table 3-1: Arm segment masses for people of different body masses (Dempster, 1955).
Body mass (kg) Upper arm mass (kg) Forearm mass (kg)
Participant 68.0 1.90 1.09
Adult male 50.0 1.40 0.80
75.0 2.10 1.20
100.0 2.80 1.60
3.2.2. Experimental Setup
At the start of the data collection session, reflective markers were placed on
the upper body of the participant (Figure 3-1). Eleven markers were placed on the
anatomical landmarks and the segments of the trunk and dominant arm in order to
calculate joint angles. Two additional markers were attached on either side of a
tennis ball (58 g), which was used as the throwing projectile in order to calculate ball
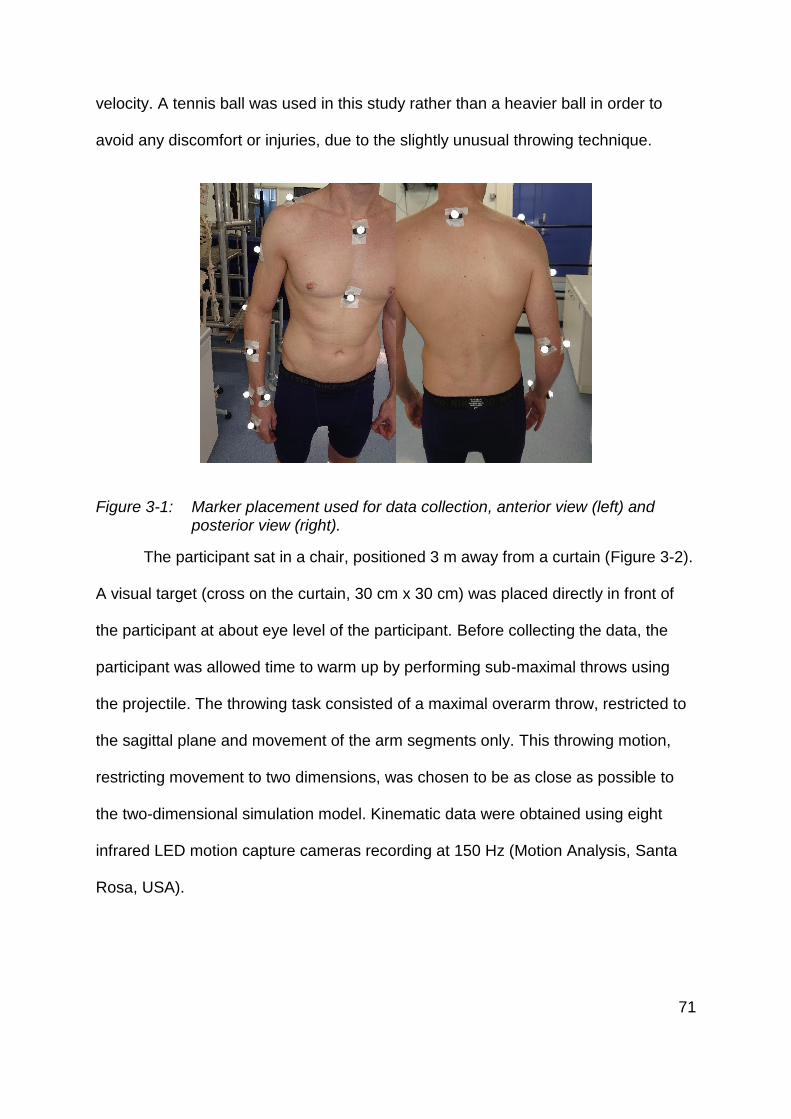
71
velocity. A tennis ball was used in this study rather than a heavier ball in order to
avoid any discomfort or injuries, due to the slightly unusual throwing technique.
Figure 3-1: Marker placement used for data collection, anterior view (left) and posterior view (right).
The participant sat in a chair, positioned 3 m away from a curtain (Figure 3-2).
A visual target (cross on the curtain, 30 cm x 30 cm) was placed directly in front of
the participant at about eye level of the participant. Before collecting the data, the
participant was allowed time to warm up by performing sub-maximal throws using
the projectile. The throwing task consisted of a maximal overarm throw, restricted to
the sagittal plane and movement of the arm segments only. This throwing motion,
restricting movement to two dimensions, was chosen to be as close as possible to
the two-dimensional simulation model. Kinematic data were obtained using eight
infrared LED motion capture cameras recording at 150 Hz (Motion Analysis, Santa
Rosa, USA).
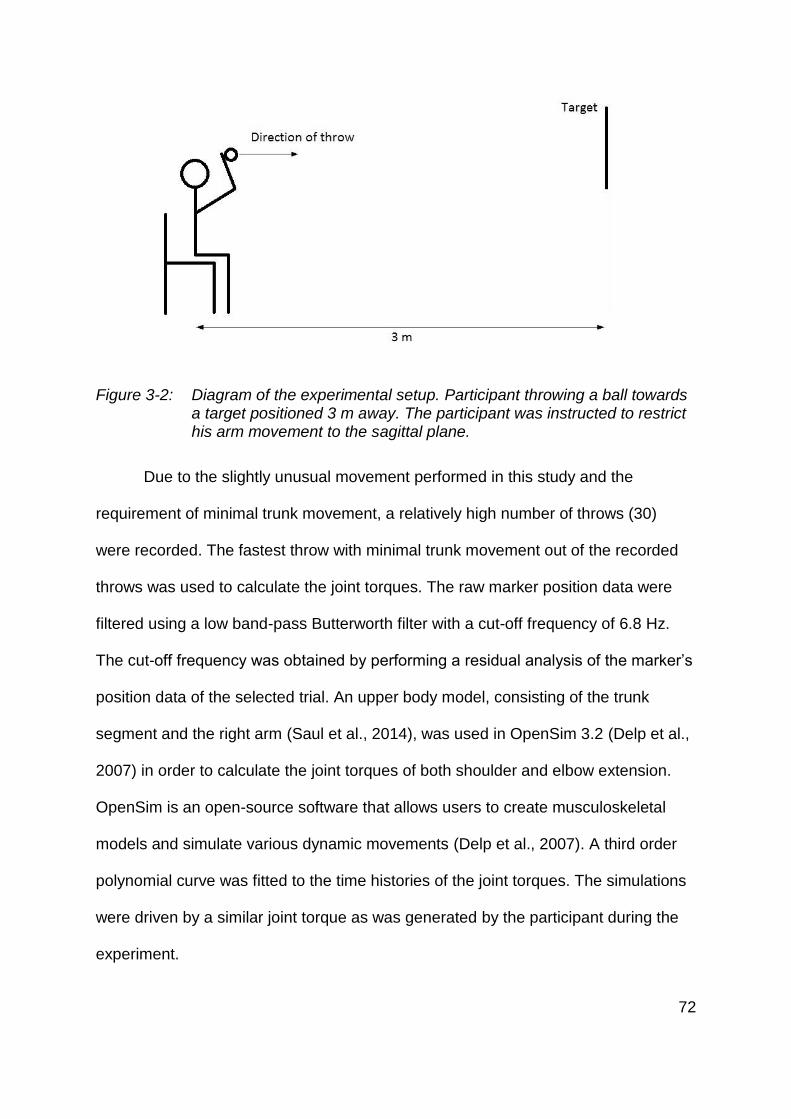
72
Figure 3-2: Diagram of the experimental setup. Participant throwing a ball towards a target positioned 3 m away. The participant was instructed to restrict his arm movement to the sagittal plane.
Due to the slightly unusual movement performed in this study and the
requirement of minimal trunk movement, a relatively high number of throws (30)
were recorded. The fastest throw with minimal trunk movement out of the recorded
throws was used to calculate the joint torques. The raw marker position data were
filtered using a low band-pass Butterworth filter with a cut-off frequency of 6.8 Hz.
The cut-off frequency was obtained by performing a residual analysis of the marker’s
position data of the selected trial. An upper body model, consisting of the trunk
segment and the right arm (Saul et al., 2014), was used in OpenSim 3.2 (Delp et al.,
2007) in order to calculate the joint torques of both shoulder and elbow extension.
OpenSim is an open-source software that allows users to create musculoskeletal
models and simulate various dynamic movements (Delp et al., 2007). A third order
polynomial curve was fitted to the time histories of the joint torques. The simulations
were driven by a similar joint torque as was generated by the participant during the
experiment.
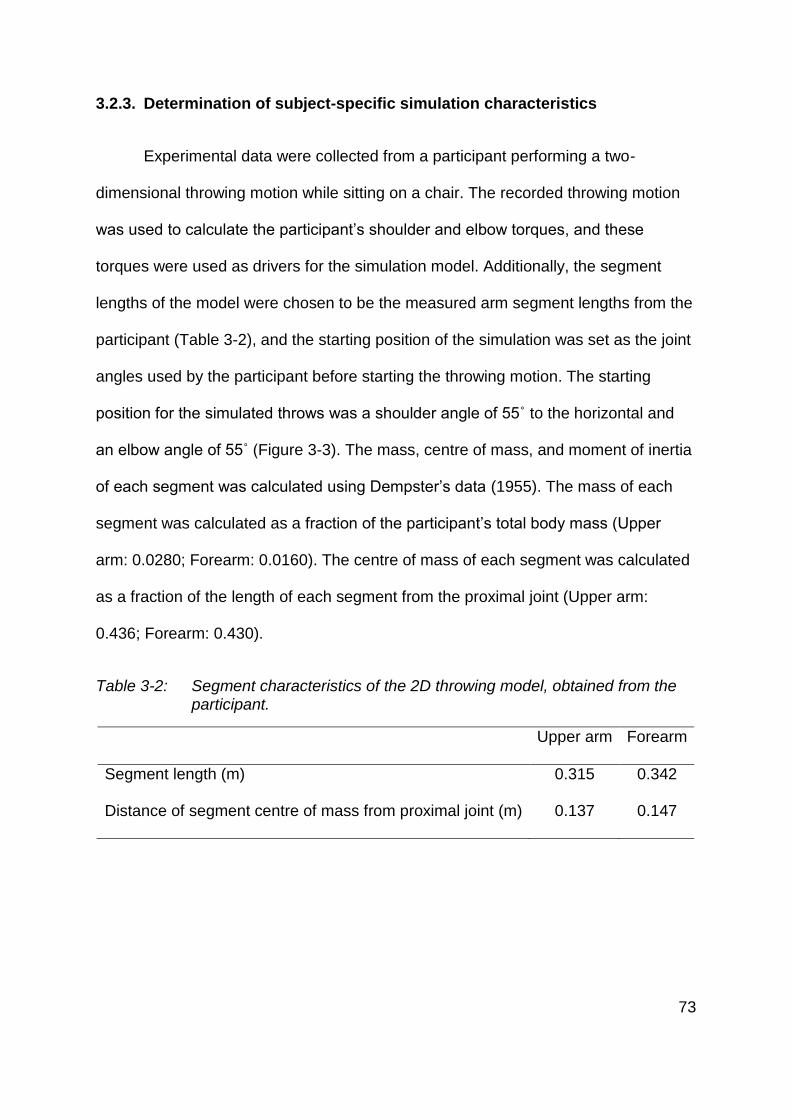
73
3.2.3. Determination of subject-specific simulation characteristics
Experimental data were collected from a participant performing a two-
dimensional throwing motion while sitting on a chair. The recorded throwing motion
was used to calculate the participant’s shoulder and elbow torques, and these
torques were used as drivers for the simulation model. Additionally, the segment
lengths of the model were chosen to be the measured arm segment lengths from the
participant (Table 3-2), and the starting position of the simulation was set as the joint
angles used by the participant before starting the throwing motion. The starting
position for the simulated throws was a shoulder angle of 55˚ to the horizontal and
an elbow angle of 55˚ (Figure 3-3). The mass, centre of mass, and moment of inertia
of each segment was calculated using Dempster’s data (1955). The mass of each
segment was calculated as a fraction of the participant’s total body mass (Upper
arm: 0.0280; Forearm: 0.0160). The centre of mass of each segment was calculated
as a fraction of the length of each segment from the proximal joint (Upper arm:
0.436; Forearm: 0.430).
Table 3-2: Segment characteristics of the 2D throwing model, obtained from the participant.
Upper arm Forearm
Segment length (m) 0.315 0.342
Distance of segment centre of mass from proximal joint (m) 0.137 0.147
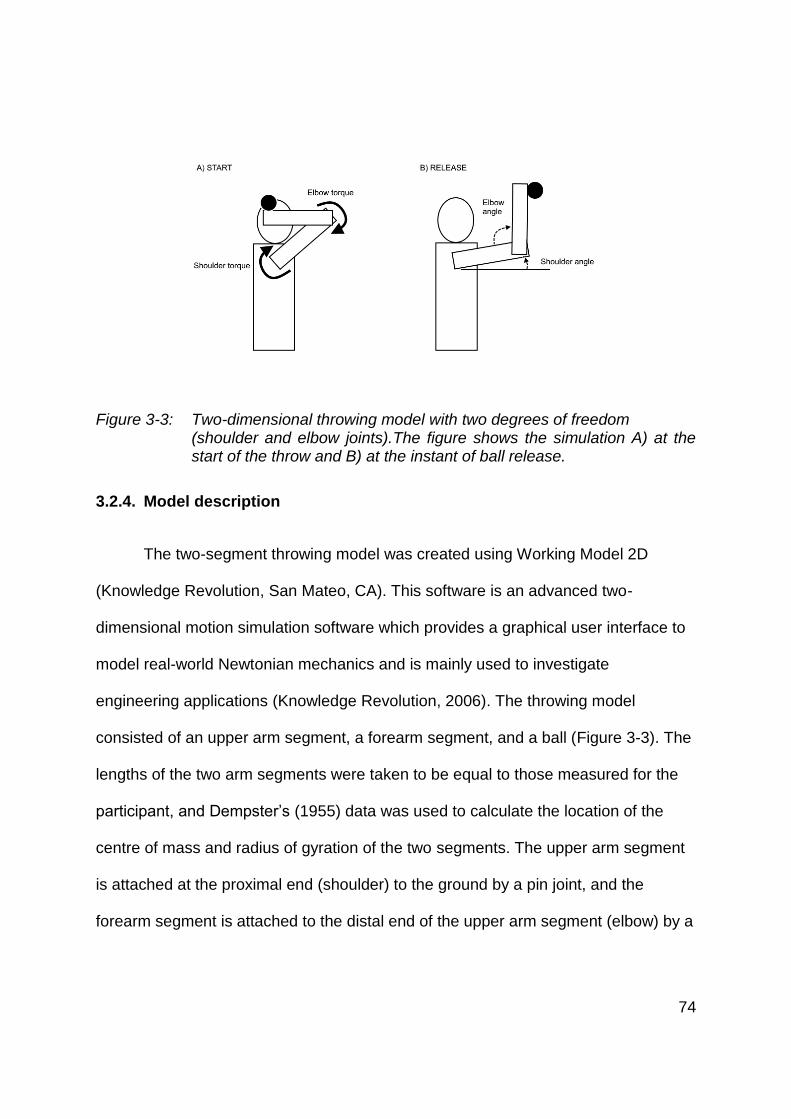
74
Figure 3-3: Two-dimensional throwing model with two degrees of freedom (shoulder and elbow joints).The figure shows the simulation A) at the start of the throw and B) at the instant of ball release.
3.2.4. Model description
The two-segment throwing model was created using Working Model 2D
(Knowledge Revolution, San Mateo, CA). This software is an advanced two-
dimensional motion simulation software which provides a graphical user interface to
model real-world Newtonian mechanics and is mainly used to investigate
engineering applications (Knowledge Revolution, 2006). The throwing model
consisted of an upper arm segment, a forearm segment, and a ball (Figure 3-3). The
lengths of the two arm segments were taken to be equal to those measured for the
participant, and Dempster’s (1955) data was used to calculate the location of the
centre of mass and radius of gyration of the two segments. The upper arm segment
is attached at the proximal end (shoulder) to the ground by a pin joint, and the
forearm segment is attached to the distal end of the upper arm segment (elbow) by a
75
pin joint. The starting position of the throw simulations was set to be the same as
that used by the participant (Figure 3-3).
A ball with the dimensions of a tennis ball was fixed to the distal end of the
forearm segment. The model is driven by joint torques at the shoulder and elbow
joints. The magnitudes of the shoulder and elbow torques were obtained from
experimental data recorded from a participant who performed a throwing motion that
was restricted to arm movement in the sagittal plane. A rotational spring (stiffness =
2 N·m/˚) that simulates the passive structures around the shoulder was added at the
shoulder joint to keep the joint angles within anatomical limits (Herring & Chapman,
1992). The magnitude of the rotational spring stiffness was determined by comparing
the shoulder range of motion in the simulated throw to the experimental throw.
Even though humans do not normally use such a throwing technique to
achieve high ball release speeds, this simplified two-dimensional throwing model
was expected to provide general information about the effect of segment mass on
performance in a kinetic chain. Although the degrees of freedom are reduced in this
model, the sequential nature of maximum segment angular velocities of a throwing
motion is retained. The upper arm mass was changed from 0.5 kg to 10 kg in
increments of 0.5 kg, and the forearm mass was changed from 0.5 kg to 2 kg in
increments of 0.1 kg, resulting in 320 simulated throws. I decided to simulate throws
with a large range of upper arm and forearm masses in order to ensure that an
optimum upper arm mass and forearm mass could be determined.
The release condition for all simulated throws was when the elbow angle
reached 92° (180° elbow angle being at full elbow extension), which was the elbow
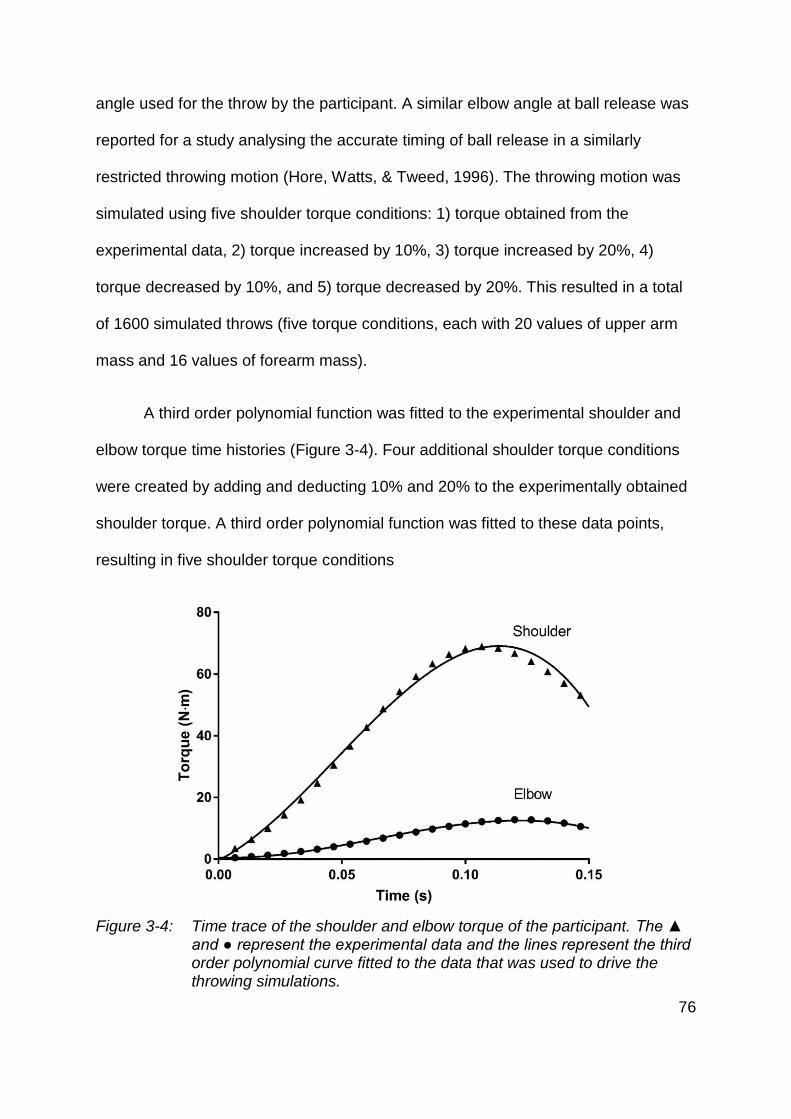
76
angle used for the throw by the participant. A similar elbow angle at ball release was
reported for a study analysing the accurate timing of ball release in a similarly
restricted throwing motion (Hore, Watts, & Tweed, 1996). The throwing motion was
simulated using five shoulder torque conditions: 1) torque obtained from the
experimental data, 2) torque increased by 10%, 3) torque increased by 20%, 4)
torque decreased by 10%, and 5) torque decreased by 20%. This resulted in a total
of 1600 simulated throws (five torque conditions, each with 20 values of upper arm
mass and 16 values of forearm mass).
A third order polynomial function was fitted to the experimental shoulder and
elbow torque time histories (Figure 3-4). Four additional shoulder torque conditions
were created by adding and deducting 10% and 20% to the experimentally obtained
shoulder torque. A third order polynomial function was fitted to these data points,
resulting in five shoulder torque conditions
Figure 3-4: Time trace of the shoulder and elbow torque of the participant. The ▲ and ● represent the experimental data and the lines represent the third order polynomial curve fitted to the data that was used to drive the throwing simulations.
77
3.2.5. Dependent variables
The resultant ball release speed was obtained for each simulated throw at the
time when the elbow angle reached 92˚. In addition to the ball release speed, the
timing between the maximum upper arm angular velocity and the maximum forearm
angular velocity were analysed. The timing was calculated relative to the total time of
each individual throwing simulation, where the starting position was set at 0% and
ball release at 100% of the throwing motion, similar to how previous research
analysed throwing motions (Fleisig et al., 1996).
78
3.3. Results
The results of the two-dimensional two segment simulations performed in the
present study highlight that there is an optimal upper arm mass that results in the
highest ball release speed. Additionally, the ball release speed decreases as the
forearm mass increases. During the throws performed with optimal upper arm mass,
the maximum upper arm angular velocity occurred later compared to the throws
performed with the arm segment masses of the participant tested for the present
study. Furthermore, the optimal upper arm mass increases as the thrower’s forearm
mass increases.
3.3.1. Forearm mass
Increasing the forearm mass in the 2D throwing simulation resulted in a lower
ball release speed (Figure 3-5). The ball release speed decreased as the forearm
mass got heavier, independent of the amount of shoulder torque used to drive the
simulation. This decrease in resultant ball release speed was observed for all upper
arm masses. The highest ball release speeds were achieved with the lowest forearm
masses. Further reducing the forearm mass beyond of the minimum used in this
study would probably have resulted in even higher ball release speeds. On average,
decreasing the forearm mass by 0.1 kg decreased the ball release speed by about
2.4%.
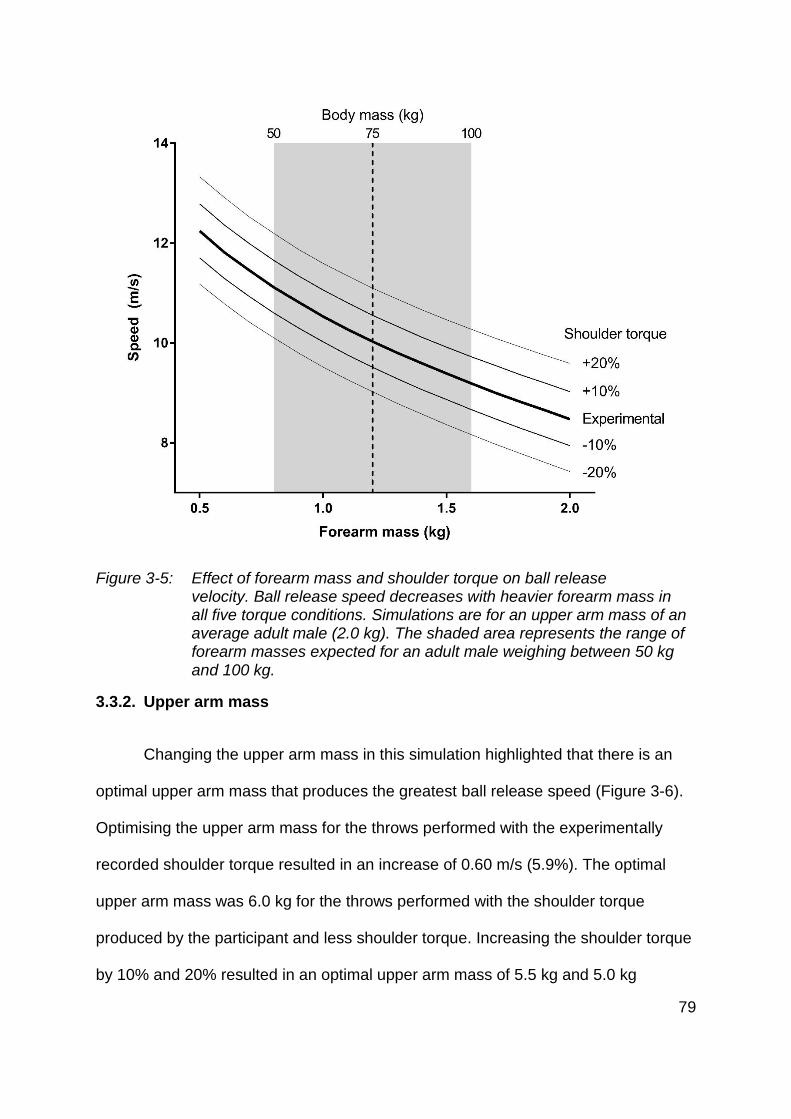
79
Figure 3-5: Effect of forearm mass and shoulder torque on ball release velocity. Ball release speed decreases with heavier forearm mass in all five torque conditions. Simulations are for an upper arm mass of an average adult male (2.0 kg). The shaded area represents the range of forearm masses expected for an adult male weighing between 50 kg and 100 kg.
3.3.2. Upper arm mass
Changing the upper arm mass in this simulation highlighted that there is an
optimal upper arm mass that produces the greatest ball release speed (Figure 3-6).
Optimising the upper arm mass for the throws performed with the experimentally
recorded shoulder torque resulted in an increase of 0.60 m/s (5.9%). The optimal
upper arm mass was 6.0 kg for the throws performed with the shoulder torque
produced by the participant and less shoulder torque. Increasing the shoulder torque
by 10% and 20% resulted in an optimal upper arm mass of 5.5 kg and 5.0 kg
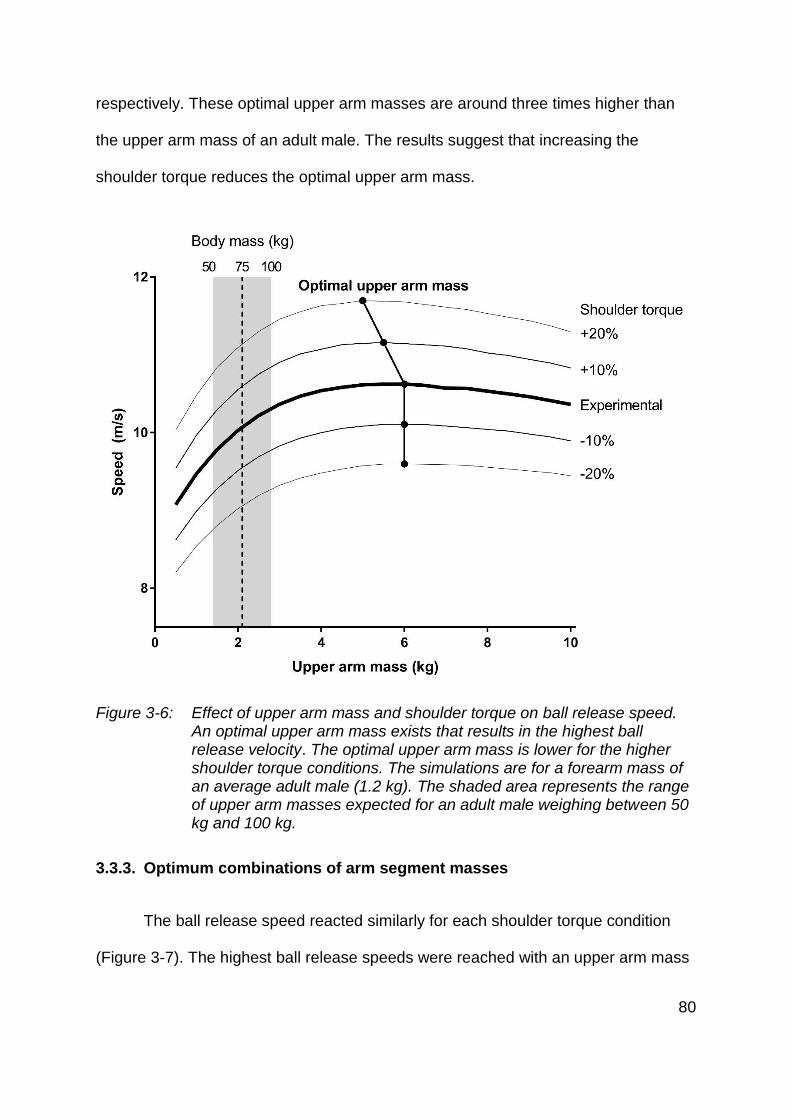
80
respectively. These optimal upper arm masses are around three times higher than
the upper arm mass of an adult male. The results suggest that increasing the
shoulder torque reduces the optimal upper arm mass.
Figure 3-6: Effect of upper arm mass and shoulder torque on ball release speed. An optimal upper arm mass exists that results in the highest ball release velocity. The optimal upper arm mass is lower for the higher shoulder torque conditions. The simulations are for a forearm mass of an average adult male (1.2 kg). The shaded area represents the range of upper arm masses expected for an adult male weighing between 50 kg and 100 kg.
3.3.3. Optimum combinations of arm segment masses
The ball release speed reacted similarly for each shoulder torque condition
(Figure 3-7). The highest ball release speeds were reached with an upper arm mass
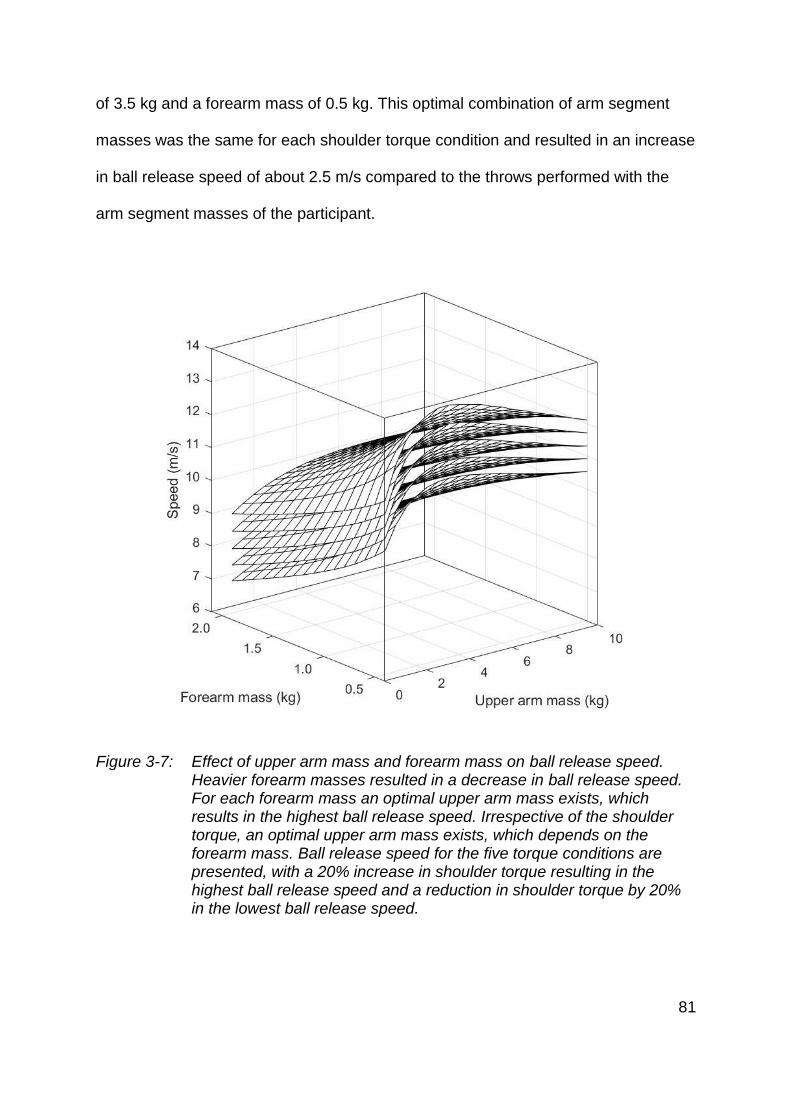
81
of 3.5 kg and a forearm mass of 0.5 kg. This optimal combination of arm segment
masses was the same for each shoulder torque condition and resulted in an increase
in ball release speed of about 2.5 m/s compared to the throws performed with the
arm segment masses of the participant.
Figure 3-7: Effect of upper arm mass and forearm mass on ball release speed. Heavier forearm masses resulted in a decrease in ball release speed. For each forearm mass an optimal upper arm mass exists, which results in the highest ball release speed. Irrespective of the shoulder torque, an optimal upper arm mass exists, which depends on the forearm mass. Ball release speed for the five torque conditions are presented, with a 20% increase in shoulder torque resulting in the highest ball release speed and a reduction in shoulder torque by 20% in the lowest ball release speed.
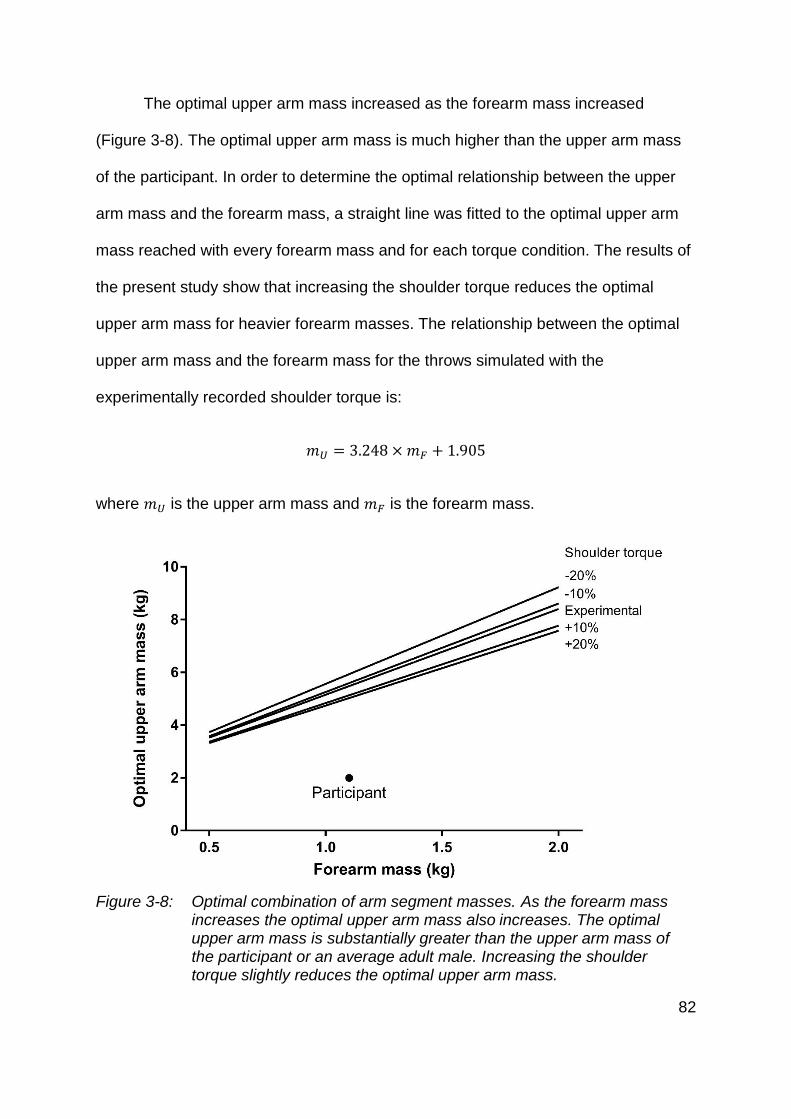
82
The optimal upper arm mass increased as the forearm mass increased
(Figure 3-8). The optimal upper arm mass is much higher than the upper arm mass
of the participant. In order to determine the optimal relationship between the upper
arm mass and the forearm mass, a straight line was fitted to the optimal upper arm
mass reached with every forearm mass and for each torque condition. The results of
the present study show that increasing the shoulder torque reduces the optimal
upper arm mass for heavier forearm masses. The relationship between the optimal
upper arm mass and the forearm mass for the throws simulated with the
experimentally recorded shoulder torque is:
𝑚𝑈 = 3.248 × 𝑚𝐹 + 1.905
where 𝑚𝑈 is the upper arm mass and 𝑚𝐹 is the forearm mass.
Figure 3-8: Optimal combination of arm segment masses. As the forearm mass increases the optimal upper arm mass also increases. The optimal upper arm mass is substantially greater than the upper arm mass of the participant or an average adult male. Increasing the shoulder torque slightly reduces the optimal upper arm mass.
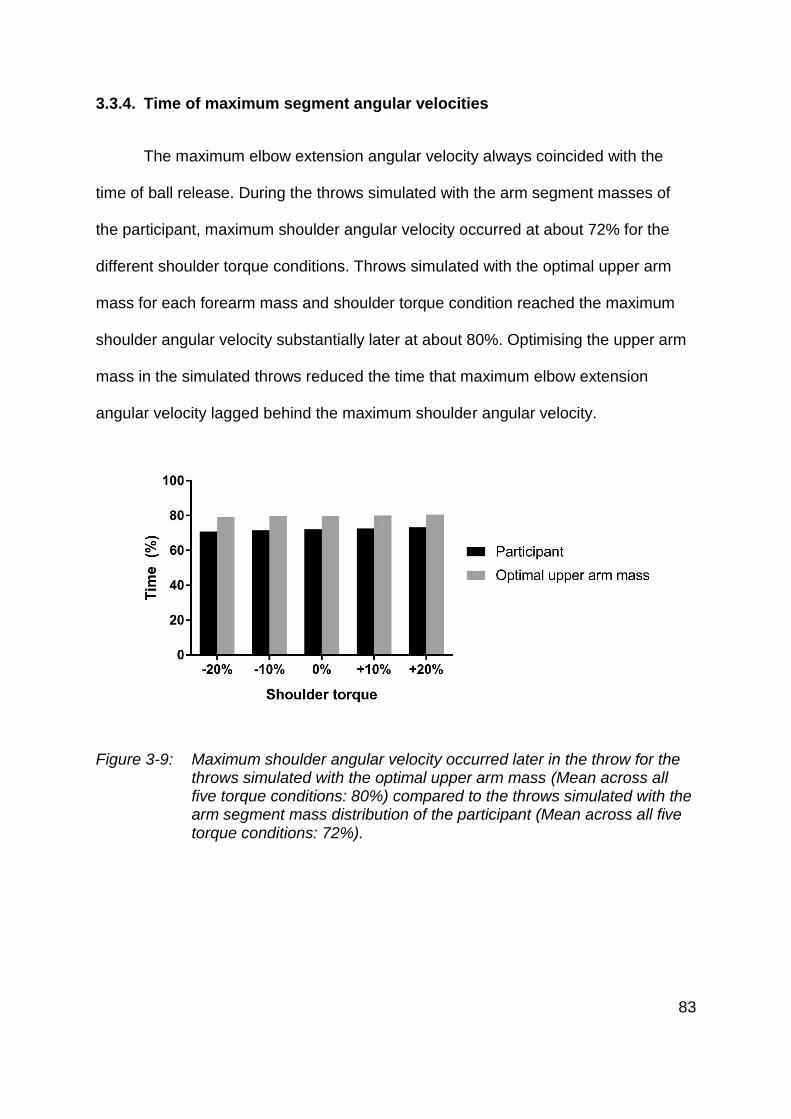
83
3.3.4. Time of maximum segment angular velocities
The maximum elbow extension angular velocity always coincided with the
time of ball release. During the throws simulated with the arm segment masses of
the participant, maximum shoulder angular velocity occurred at about 72% for the
different shoulder torque conditions. Throws simulated with the optimal upper arm
mass for each forearm mass and shoulder torque condition reached the maximum
shoulder angular velocity substantially later at about 80%. Optimising the upper arm
mass in the simulated throws reduced the time that maximum elbow extension
angular velocity lagged behind the maximum shoulder angular velocity.
Figure 3-9: Maximum shoulder angular velocity occurred later in the throw for the throws simulated with the optimal upper arm mass (Mean across all five torque conditions: 80%) compared to the throws simulated with the arm segment mass distribution of the participant (Mean across all five torque conditions: 72%).
84
3.4. Discussion
The two-dimensional simulation of an overarm throw showed that for a given
forearm mass there is an optimum upper arm mass which produces the highest ball
release speed. However, the optimal upper arm is much higher than the upper arm
mass of an average adult male. Increasing the forearm mass decreases the ball
release speed, suggesting that athletes should attempt to keep their forearm as light
as possible. The results also suggest that the optimal upper arm mass is lower in
athletes that can generate higher shoulder torque. With the optimum combination of
arm segment masses the maximum shoulder angular velocity occurs later during the
throw.
3.4.1. Optimum combination of arm segment masses
In a kinetic chain the inertial parameters play a crucial role in creating fast and
accurate movements. Throwing, which is amongst the fastest movements that a
human can produce (Roach et al., 2013), relies heavily on the effective use of the
kinetic chain to transfer angular momentum from one segment to the next and so
produce a high ball release speed. The transfer of angular momentum increases the
angular momentum of the distal segments as, in a human body, the distal segment
(hand and forearm) is lighter than the proximal segment (upper arm) (Putnam, 1993;
Winter, 2009). However, the results of the present study suggest that although the
human anatomy allows us to throw a projectile fast and accurate, the upper arm
mass of a typical adult human is substantially less than the optimal value.
Additionally, keeping the forearm mass as low as possible increases the ball release
speed.
85
Forearm mass
In the model used in the present study, reducing forearm mass from 1.0 kg to
0.5 kg increased ball release speed by about 1.7 m/s. Increasing the forearm mass,
however, caused the ball release speed to decrease. The lowest forearm mass
tested in this study was 0.5 kg, but the changes in ball release speed recorded for
various amounts of forearm mass suggest that the ball release speed would further
decrease with even lower forearm masses. However, a forearm mass of 0.5 kg is
probably unrealistic for an athlete to reach. The findings from the present study
suggest that throwing athletes should attempt to keep their forearm mass as low as
possible, confirming the results of previous studies (Kim et al., 2008; Southard,
1998). Previous studies reported that both the elbow flexion/extension and wrist
flexion/extension are mainly produced through velocity-dependant torques generated
at more proximal joints (Hirashima et al., 2008), and that muscles crossing the wrist
are predominantly responsible to control the accurate release (Hirashima et al.,
2003). These findings combined with the results of the present study suggest that
increasing the mass of the muscle groups running alongside the forearm and
crossing the wrist joint could have a negative effect on throwing velocity.
Upper arm mass
The results of this study agree with previous studies (Kim et al., 2008;
Southard, 1998) which found that a heavier upper arm can increase ball release
speed. The present study showed that there is an optimal upper arm mass, which
increases ball release speed by about 6%. However, a throwing athlete would have
to nearly triple their upper arm mass in order to reach this optimum. Increasing the
86
mass of the muscles in the upper arm would probably also result in an increase in
muscle strength as well as an increase in upper arm mass. However, a substantial
increase in muscle mass might reduce the flexibility at the shoulder joint, which might
then affect the athlete’s ability to throw fast and accurate. Therefore, further analysis
is required in order to determine how upper arm mass influences the kinetic chain
and throwing velocity in a full-body throwing motion.
Furthermore, the optimal upper arm mass of the two-dimensional simulation
changes with different amounts of shoulder torque, suggesting that the optimal arm
mass is lower in athletes that produce more shoulder torque. Therefore, the optimal
upper arm mass of skilled throwers could be lower compared to less skilled throwers.
Similar findings were observed in a study comparing the effect of upper arm mass on
ball release speed between throwers of various skill levels (Southard, 1998), where
only less skilled throwers benefited from additional upper arm mass. Combined with
the higher muscle volumes on baseball pitchers’ dominant upper arm (Yamada,
Yamashita, et al., 2013), the results of the present study indicate that baseball
pitchers might already be at their optimal upper arm mass through their training
routine.
3.4.2. Temporal lag of joint rotations
Optimising the masses of the upper arm and the forearm results in the
maximum angular velocity of the upper arm occurring later in the throwing motion.
This temporal change in the throwing movement confirms the importance of the
relative timing of the joint rotations during the proximal-to-distal sequence (Southard,
2009). The correct timing of joint rotations along the kinetic chain allows the throwing
87
athlete to optimise the transfer of energy between the segments (Southard, 2009;
Stodden et al., 2006), which in the present two-dimensional simulation was achieved
through changes in arm segment mass.
3.4.3. Throwing projectile
In the present study, a tennis ball was used to be thrown as fast as possible.
This fairly light projectile (58 g) was used in order to avoid injuries caused by the
slightly unusual throwing motion recorded in the present study. As projectiles used
by our ancestors (Isaac, 1987) and projectiles used in various sports (Bartlett, 2000)
are heavier, the low mass of the tennis ball might have affected the results of the
present study. The mass of the ball thrown might therefore be partly responsible for
the high optimum upper arm mass determined in the present study. However, further
analysis is required in order to determine how the mass of the projectile affects the
optimal upper arm mass and if the masses of the different arm segments evolved to
optimise the throwing of heavier objects than are used in sports today.
3.4.4. Limitations
In this study, a simplified throwing model was used to determine if there is an
optimal combination of arm segment masses that results in the fastest ball release
speed in overarm throwing. The model used only contains an upper arm and forearm
segments and a shoulder and elbow joint. According to Hirashima (2002), the
muscle torque at the wrist counteracts the interaction torque and thus the wrist joint
does not contribute much towards ball release speed but is mainly responsible for
the accurate ball release. Therefore, the omission of a wrist joint in the model should
not affect the influence of arm segment mass on the ball release speed.
88
In the simple throwing model, the shoulder joint was represented as a pin joint
and so the simulated throws did not include internal shoulder rotation, which is one
of the major contributors to ball release speed in overarm throwing. Thus, the model
used in this study was not able to identify the impact of internal shoulder rotation on
the optimal combination of arm segment masses. In addition, the simulated throws
did not include a wind-up and only focused on the forward movement of the arm
segments and the ball. Optimising the arm segment masses could increase the
elastic energy generated at the shoulder, because the upper arm lags further behind
the trunk. Therefore, including a shoulder joint in a model of throwing that allows
rotation around all axes could affect the optimal arm segment masses and, as a
result, the improvements in throwing velocity observed in the present simulation.
Furthermore, the lack of subject-specific segmental inertial parameters
constitutes another limitation. However, due to simplistic nature of the model used in
the present study, it was assumed that using subject-specific segmental inertial
parameters would not have a substantial effect on the outcome of the study.
Even though there are several limitations to the present throwing simulation,
the two-dimensional model confirmed previous findings that additional upper arm
mass improves throwing velocity. In addition, the results of the present study
identified the optimal arm segment mass that results in the highest ball release
speed. The present study is the first step in identifying the existence of an optimal
arm segment mass distribution that maximises the ball release speed and thus
highlights the importance of using this concept in order to improve an athlete’s ability
to throw a projectile.
89
3.4.5. Applications
The present study confirms the findings of previous studies that found that a
heavier upper arm can increase throwing velocity (Kim et al., 2008; Linthorne et al.,
n.d.; Southard, 1998). The present study extends our knowledge by highlighting that
athletes attempting to throw as fast as possible can optimise their arm segment
masses. Thus, throwing athletes and their coaches could be advised to monitor the
athlete’s arm segment masses in order to benefit from this effect. Hypertrophy
training could be included into an athlete’s training routine to maximise the effect of
anthropometrics on their throwing velocity. However, hypertrophy training might also
change muscle strength, and this might affect the throwing velocity.
3.4.6. Further Work
Even though this study confirmed that there is an optimal combination of arm
segment masses in an overarm throw in the sagittal plane, we do not known what
the optimal masses are in a more realistic overarm throwing motion. Due to the
limitations of the simplified model used in this study, further work is required in order
to determine if athletes in throwing sports could benefit from optimising their arm
segment masses. Previous studies have identified that increasing the upper arm
mass results in a faster ball release speed (Kim et al., 2008; Linthorne et al., n.d.;
Southard, 1998), but none of the studies analysed the existence of an optimal upper
arm mass in a throwing motion with the aim to maximise ball release speed.
Analysing the ball release speed of throws performed with various amounts of mass
attached to a thrower’s upper arm could lead to identifying the optimal upper arm
mass for athletes attempting to throw as fast as possible.
90
Additionally, no study has investigated the effect that additional upper arm
mass has on an athlete’s throwing technique. Due to the two-dimensional nature of
the model used in this study, the movement at the shoulder joint was restricted to a
pin joint, ignoring some crucial rotations in generating high ball release speeds
(Fleisig et al., 1999; Hirashima et al., 2008). Analysing both kinematic and kinetic
variables that have previously been identified as significantly contributing to high ball
release speeds could lead to understanding how a heavier upper arm mass results
in an increase in performance and determine if it increases the risk of injuries.
Previous research suggests that the optimal upper arm mass could be
subject-specific and depend on the person’s forearm mass (Linthorne et al., n.d.).
The model used in this study confirmed the relationship between the forearm mass
and the optimal upper arm mass. Due to the simplified shoulder rotation and the
restrictions of the movement to two dimensions, a more complex model would be
required in order to accurately predict an athlete’s optimal upper arm mass.
Therefore, further research is required to develop a more realistic computer model
that can be used by coaches in order to simulate an athlete’s throwing performance.
91
3.5. Conclusions
This study confirms that the inertial parameters of the arm segments can
affect throwing performance. Although the results were obtained using a simplified
model of an overarm throwing motion, the study extends our knowledge of the
importance of segment mass in the kinetic chain. The most important finding of this
study is that there is an optimal upper arm mass for this two-dimensional throwing
simulation. Furthermore, a heavier forearm mass has a negative effect on throwing
velocity. As a result, the optimal upper arm mass and the optimal forearm mass in
the two-dimensional throws simulated in the present study are probably unrealistic
for humans to achieve. However, the lower optimal upper arm mass for the throws
simulated with a higher amount of shoulder torque indicates that the optimal upper
arm mass of skilled throwers might be lower than the optimal upper arm masses
observed in the present study.
92
Kinematic and kinetic analysis of additional
upper arm mass in overarm throwing.
93
4.1. Introduction
The ability to throw both fast and accurate is a skill that is unique to humans
(Young, 2009). The main reason for a human’s ability to throw a projectile is the
anatomy of our body. Two anatomical characteristics that set us apart from other
species are our tall, mobile trunk and our flexibility at the shoulder joint. These
characteristics allow the energy produced at the trunk to be stored at the shoulder
and transferred to the arm and the projectile (Roach & Richmond, 2015a; Roach et
al., 2013). Furthermore, this transfer of energy and angular momentum is enhanced
by the mass distribution of the segments along the kinetic chain (Stodden, Fleisig,
McLean, Lyman, & Andrews, 2001) as the distal segments are lighter compared to
their proximal neighbour segments (de Leva, 1996). The anthropometric
characteristics of the human body allow skilled throwers to increase the angular
velocity of the distal segments due to conservation of angular momentum (Putnam,
1993), resulting in high ball release speeds. The ability of humans to throw
projectiles was an evolutionary adaptation to hunt for prey and defend against
enemies (Young, 2009), and throwing is still performed today in sports such as
baseball, cricket, and some of the field events in athletics. The goal in these sporting
events is to maximise throwing performance by either throwing the projectile faster or
farther.
Previous studies have shown that anthropometric parameters can affect
throwing performance. A study comparing high and low velocity baseball pitchers
found significantly longer arm segment lengths in the high velocity group (Matsuo et
al., 2001). However, as it is not possible to change the segment lengths of an
athlete, some research has focused on adapting the arm segment masses in order
94
to improve throwing performance (Kim et al., 2008; Linthorne et al., n.d.; Southard,
1998). Changes in segment mass can be achieved through muscle hypertrophy
training.
4.1.1. Inertial parameters in throwing
Previous studies found that changes in mass distribution of the throwing arm
affect ball release speed. An increase by around 6.4% in ball release speed was
observed with additional mass (average: 1.4 kg) attached to the upper arm
(Southard, 1998). The results of this study indicate that less skilled throwers
improved the use of the kinetic chain with additional upper arm mass, thus
increasing their ball release speed. Another study measured a slight increase in
horizontal arm swing velocity with 25% and 50% increase in upper arm mass (Kim et
al., 2008). A study focussing on the performance of javelin throwers observed that
the optimal upper arm mass for both release velocity and distance thrown is higher
than their actual upper arm mass (Linthorne et al., n.d.). The optimal upper arm
mass in this study depended on the participant and resulted in an average increase
in throw distance of 5.4%. These findings are similar to those obtained from the two-
dimensional simulation performed in Chapter 3, where an optimal upper arm mass
results in the highest ball release speed. The optimal upper arm mass in the two-
dimensional simulation study is more than double the upper arm mass of an average
adult male.
Additionally, a study that restricted the wrist motion in overhand throwing
found a decrease in ball velocity (Roach & Lieberman, 2014). However, instead of
relating the decrease in ball velocity to the restricted movement, the investigators
95
concluded that the increase in mass at the distal end of the kinetic chain was
responsible for the decrease in velocity. The mass of the wrist brace resulted in a
decrease in maximum internal shoulder velocity, but did not significantly affect the
elbow extension velocity. Further evidence on the negative effect that a heavier
forearm mass has on throwing performance was provided by studies analysing
maximum throws (Southard, 1998), horizontal arm swing velocity (Kim et al., 2008),
and two-dimensional simulations of overhead throwing (Chapter 3).
Although some studies showed that a heavier upper arm mass can have a
positive effect on the ball release speed and throwing distance of a projectile, no
previous study managed to detect the optimal upper arm mass that maximises the
ball release speed, as was discovered in my previous study using two-dimensional
simulations (Chapter 3). Only a study by (Linthorne et al., n.d.) identified the optimal
upper arm mass for three javelin throwers to be between 0.21 kg to 0.60 kg heavier
than their actual upper arm mass. Additionally, little is known about how changes in
upper arm mass affect the kinematics and kinetics of throwing. Understanding how
upper arm mass affects an athlete’s throwing technique could help to determine an
athlete’s optimal upper arm mass and reveal if athletes can safely apply this principle
without increasing the risk of injury.
4.1.2. Kinematics of throwing performance
In addition to the anatomical characteristics of the human body, several
kinematic variables have been identified as major contributors to high ball release
speeds. However, only limited research is available that analysed kinematic changes
with additional upper arm mass. Southard (1998) reported faster arm segment linear
96
velocity for the condition with additional upper arm mass compared to throws
performed with additional mass attached to other arm segments. Even though
previous studies detected an increase in ball release speed with additional upper
arm mass (Kim et al., 2008; Linthorne et al., n.d.; Southard, 1998), none of these
studies analysed the effect the additional mass has on joint kinematic variables that
have previously been identified to assist the generation of high ball release speeds.
As the main objective of the throws performed during the present study was to throw
as fast as possible, while attempting to hit a target, the following sections will focus
on the kinematics of baseball pitching.
Legs
The generation of high ball release speed starts with the legs and the trunk,
which serve as a stable base for the ballistic motion of the upper arm (Seroyer et al.,
2010), which is highlighted by the importance of the stride length. In baseball
pitching the stride length is between 74% and 87% of the participant’s body height
(Fleisig et al., 1996; Matsuo et al., 2001). Although the stride length did not vary
between different ball velocity groups (Matsuo et al., 2001), decreasing the stride
length to around 50% of body height resulted in the upper arm lagging further behind
the trunk rotations compared to longer stride lengths (Ramsey & Crotin, 2016;
Ramsey et al., 2014), potentially increasing the risk of injury (Aguinaldo et al., 2007).
Both stride knee flexion angle and angular velocity play a crucial role in
throwing performance. A multiple linear regression analysis identified the knee angle
of the lead leg at the instants of lead foot contact and at ball release to affect ball
release speed (Werner et al., 2008). Baseball pitchers throw with a more flexed lead
97
knee at both instants compared to American football passing (Fleisig et al., 1996)
and reach values of 51 ± 11° at the instant of foot contact and 40 ± 12° at the instant
of ball release. Similar values were recorded in a study comparing baseball pitchers
of various levels of development (Fleisig et al., 1999). Lead knee extension angular
velocity at the instant of ball release is significantly higher for pitchers that achieve
higher ball release speeds (Matsuo et al., 2001).
Trunk
Forward trunk tilt at the instant of ball release is related to high ball release
speed (Dowling et al., 2016; Fortenbaugh et al., 2009; Seroyer et al., 2010; Werner
et al., 2008). A larger forward trunk tilt angle has been recorded in a high velocity (37
± 7°) baseball pitching group compared to a low velocity (29 ± 11°) group (Matsuo et
al., 2001). Increasing the forward tilt angle towards ball release permits a baseball
pitcher to accelerate their throwing arm over a longer distance and thus perform
more work on the ball (Seroyer et al., 2010; Stodden et al., 2005). Additionally, the
maximum trunk angular velocity is higher in professional baseball pitchers compared
to their less experienced counterparts (Fleisig et al., 1999), while another study
observed a correlation between higher trunk angular velocities and higher ball
release speeds (Dowling et al., 2016).
Shoulder
The shoulder joint plays a crucial role in overhead throwing due to its flexibility
(Veeger & van der Helm, 2007) and ability to store elastic energy which supports the
generation of high angular velocities of the distal segments (Roach et al., 2013).
Especially the maximum external shoulder rotation angle has previously been linked
98
to contribute to high ball release speeds, reaching angles of external rotation of
around 180° (Dun et al., 2007; Fleisig et al., 1996, 1999; Sabick, Torry, Kim, et al.,
2004; Stodden et al., 2005; Werner et al., 2008). A pitcher who is able to produce
more external shoulder rotation, due to low humeral torsion (Roach et al., 2012;
Roach & Richmond, 2015b), can generate a higher ball release speed (Matsuo et al.,
2001).
However, an increase in maximum external shoulder rotation does not
necessarily result in an increase in internal shoulder rotation angular velocity
(Matsuo et al., 2001). Although, an increase in external shoulder rotation allows the
ball to be accelerated over a greater distance (Seroyer et al., 2010). Furthermore,
some studies have associated higher ball release speeds with higher internal
shoulder rotation angular velocities (Fleisig et al., 1999; Werner et al., 2008). Some
studies have recorded internal shoulder rotation angular velocities in baseball
pitchers surpassing 10,000°/s (Werner et al., 2001).
Additionally, the shoulder abduction angle during the arm acceleration phase
affects ball release speed (Stodden et al., 2005). A study using a three segment
computer simulation of the throwing arm identified that the optimal shoulder
abduction angle is around 90° in order to maximise wrist velocity (Matsuo et al.,
2002).
Elbow
Elbow flexion angle at the instant of stride foot contact and at the instant of
ball release have previously been associated with high ball release speeds (Stodden
et al., 2005; Werner et al., 2008). In preparation for the arm cocking phase, the
99
elbow of skilled throwers is flexed to around 90° in order to increase the moment of
inertia around the longitudinal shoulder rotation axis, allowing the generation of
larger external shoulder rotation angles (Stodden et al., 2006). After maximum
external shoulder rotation is reached, the elbow rapidly extends with angular
velocities of around 2300°/s (Dun et al., 2007; Fleisig et al., 1999) to 2500°/s
(Werner et al., 2001), which allow athletes to reach elbow flexion angles of around
25° at the instant of ball release (Stodden et al., 2005).
4.1.3. Temporal characteristics of throwing performance
High ball release speeds are reached through sequential proximal-to-distal
segment movements, as the distal segment reaches a higher velocity compared to
their proximal neighbour through conservation of angular momentum (Putnam,
1993). However, not only the correct sequence is important in overhead throwing,
but also the relative timing of certain key events throughout the motion (Southard,
2009). Several temporal parameters are correlated with higher ball release speeds.
In order to compare the timing between throws, most studies report temporal
parameters as a percentage of the throwing motion (0% is stride foot contact; 100%
is instant of ball release). A group of high velocity baseball pitchers reached
maximum elbow extension angular velocity earlier (91.1% ± 1.9%) compared to a
low velocity group (93.0% ± 2.4%) (Matsuo et al., 2001). Similar findings are
obtained for the time of maximum internal shoulder rotation, which occurs closer to
the instant of ball release for the high velocity group (102.3% ± 2.0%) compared to
the low velocity group (104.4% ± 1.8%) (Matsuo et al., 2001). Another study also
detected an increase in trunk separation time, meaning the time between maximum
100
pelvis angular velocity and maximum trunk angular velocity, as the ball velocity
increased (van der Graaff et al., 2016).
Attaching additional mass to the upper arm mass affects the timing between
maximum segment angular velocities. Southard (1998) reported that less skilled
throwers who did not produce a proximal-to-distal sequence of maximum segment
angular velocities managed to improve their kinetic chain with a heavier upper arm
mass, which enables them to increase their ball release speed. However, additional
upper arm mass did not affect the skilled throwers in this study. Additionally, in my
previous study (Chapter 3) the throws simulated with the optimal upper arm mass
occurred after around 80% of the whole throwing motion, which is later compared to
the throws simulated with the upper arm mass of an average adult male (at around
70% to 73% of the total throwing time). These findings confirm that optimal upper
arm mass can result in temporal changes of an athlete’s throwing technique.
4.1.4. Kinematic and kinetic variables related to injuries
Apart from increasing performance, another objective of a biomechanical
analysis is to reduce the risk of injury by optimising technique and as a result
decrease the loads on the joints. Due to the rapid nature of the throwing motion, high
joint torques and joint forces are produced throughout the movement, which can
result in injury, especially to the shoulder or the elbow joint (Conte et al., 2001).
Improving an athlete’s throwing technique can result in both an increase in throwing
performance and a reduced risk of injury by optimizing the use of the kinetic chain
and decreasing the stress on the joints (Seroyer et al., 2010).
101
According to Newton’s second law of motion (𝐹 = 𝑚 ∙ 𝑎), an increase in either
the acceleration or the mass results in an increase in the force that needs to be
applied. Therefore, an increase in upper arm mass should lead to higher forces and
as a result higher stresses, especially on the shoulder joint. However, this simple
theory becomes much more complex due to the temporal sequencing of the kinetic
chain in overhead throwing (Fortenbaugh et al., 2009). Through improving the
mechanical efficiency of the throws, skilled throwers cause less stress on their joints
while increasing the ball release speed (Fortenbaugh & Fleisig, 2009). Therefore, the
success of attaching additional mass to the participant’s upper arm cannot only be
measured by an increase in ball release speed, but also by the joint forces and joint
torques acting on the throwing arm.
Overuse injuries in throwing result from high forces and torques that act
mainly on the shoulder and elbow joints (Fortenbaugh et al., 2009). Several studies
have reported forces and torques acting on the shoulder and elbow joints and related
them to various kinematic variables that affect the generation of high stresses (Buffi
et al., 2015; Fleisig et al., 1995; Werner et al., 2001, 2002). Shoulder compression
force and elbow valgus torque in particular have been identified as leading to injuries
in sports such as baseball (Werner et al., 2001, 2002). Shoulder compression force
reaches values of around 1090 ± 110 N in highly skilled baseball pitchers (Fleisig et
al., 1995) or around 108 ± 16% of a professional baseball pitcher’s body weight
(Werner et al., 2001). Even though the maximum compression force in collegiate
baseball pitchers is significantly lower (81 ± 10% of body weight), it is still regarded
as a major risk for injury (Werner et al., 2008).
102
In professional baseball pitchers, shoulder compression force is related to a
higher maximum shoulder external rotation angle, a higher shoulder internal rotation
and shoulder abduction torque, and the elbow flexion angle both at the instant of ball
release and at the instant of stride foot contact (Werner et al., 2001). Improper
maximum shoulder external rotation, which reach angles between 158° and 185°
(Aguinaldo & Chambers, 2009; Fleisig et al., 2006; Werner et al., 1993, 2008) has
been identified to cause high loads on the shoulder joint. An increase in shoulder
internal rotation torque has also been observed with an early onset of trunk rotation,
which leads to greater stress on the shoulder joint (Aguinaldo et al., 2007).
Maximum elbow valgus torques during the arm cocking phase reaches 120
N∙m (Werner et al., 1993). Similar to the maximum compression force at the
shoulder, the maximum valgus torque is also affected by the maximum external
shoulder rotation and the elbow flexion angle at the instant of maximum valgus
torque (Aguinaldo & Chambers, 2009). In addition, higher elbow valgus torques have
also been measured with improper shoulder abduction angles using a three segment
model to run three dimensional simulations (Matsuo et al., 2002).
Optimising the upper arm mass could lead to an optimisation of the kinetic
chain of throwing, resulting in an increase in throwing performance while not
increasing the stresses on the both the shoulder and the elbow joint. In the present
study, kinematic and kinetic variables that have previously been identified to affect
the risk of injuries will be analysed in order to determine if this method is suitable for
athletes and coaches to adopt. Especially the shoulder compression force, the elbow
valgus torque, internal shoulder torque have been recognised as the main kinetic
variables causing overuse injuries in baseball pitching (Chalmers et al., 2017;
103
Fortenbaugh et al., 2009; Seroyer et al., 2010). Kinematic variables that lead to
higher stresses are the maximum external shoulder rotation, elbow flexion angle
throughout the throwing motion, and timing of trunk rotation (Aguinaldo et al., 2007;
Aguinaldo & Chambers, 2009; Werner et al., 2001).
4.1.5. Aims of the study
The main aim of the present study was to identify the optimal upper arm mass
in overarm throwing which produces the highest ball release speed. Even though
previous studies have identified that a heavier upper arm mass can improve an
athlete’s throwing performance (Kim et al., 2008; Linthorne et al., n.d.; Southard,
1998), none of these studies attempted to determine the optimal upper arm mass in
a throwing task with the goal of maximising the ball release speed. The throws
analysed in the present study are similar to throws performed by baseball pitchers.
Furthermore, the present study analysed how additional upper arm mass
affects an athlete’s throwing technique and what effect additional upper arm mass
has on the risk of injury. No previous study has analysed how additional upper arm
mass affects joint angular kinematics and kinetics. Determining the optimal upper
arm mass in maximal-effort overarm throwing and identifying how changes in upper
arm mass affect throwing technique will provide further insight into how athletes
could benefit from optimising their upper arm mass. Additionally, analysis of
variables related to both shoulder and elbow injuries in baseball pitching will highlight
if coaches should attempt to apply this method.
104
4.1.6. Hypotheses
The following hypotheses were tested in the present study:
Optimising the mass of the upper arm results in a substantially higher ball
release speed.
Changes in upper arm mass do not affect maximum joint angles, joint angles
at the instant of lead foot contact, joint angles at the instant of ball release,
and joint angular velocities.
Changes in upper arm mass affect the timing of maximum joint angles and
timing of maximum joint angular velocities
Heavier upper arm mass increases joint torques and joint forces.
105
4.2. Methods
The present study used an experimental approach. The participants
performed maximal throws using a baseball with masses attached to their upper
arm. Motion analysis data of the throws were recorded in order to analyse kinematic,
kinetic, and temporal variables that have previously been identified to either relate to
throwing performance (Fleisig et al., 1996; Matsuo et al., 2001) or injury prevention
(Fortenbaugh et al., 2009; Seroyer et al., 2010) in baseball pitching. Analysing how
additional upper arm mass affects ball release speed as well as joint kinematics and
kinetics provides evidence about how an athlete’s throwing technique is affected by
changes in upper arm mass. Ethics approval was obtained from the College of
Health and Life Sciences at Brunel University London.
4.2.1. Participants
Thirteen healthy adults (7 male, 6 female) participated in the study (Table
4-1). After agreeing to take part, all participants signed an informed consent form. All
participants were physically active, but none regularly practiced a sport where
throwing a projectile as fast as possible was required (eg. baseball, cricket, javelin
throw). None of the participants reported having a shoulder injury in the six months
prior to testing. The location of the centre of mass of the upper arm was calculated
as a percentage of the length of the upper arm, and the mass of the upper arm was
calculated as a percentage of the total body mass (de Leva, 1996).
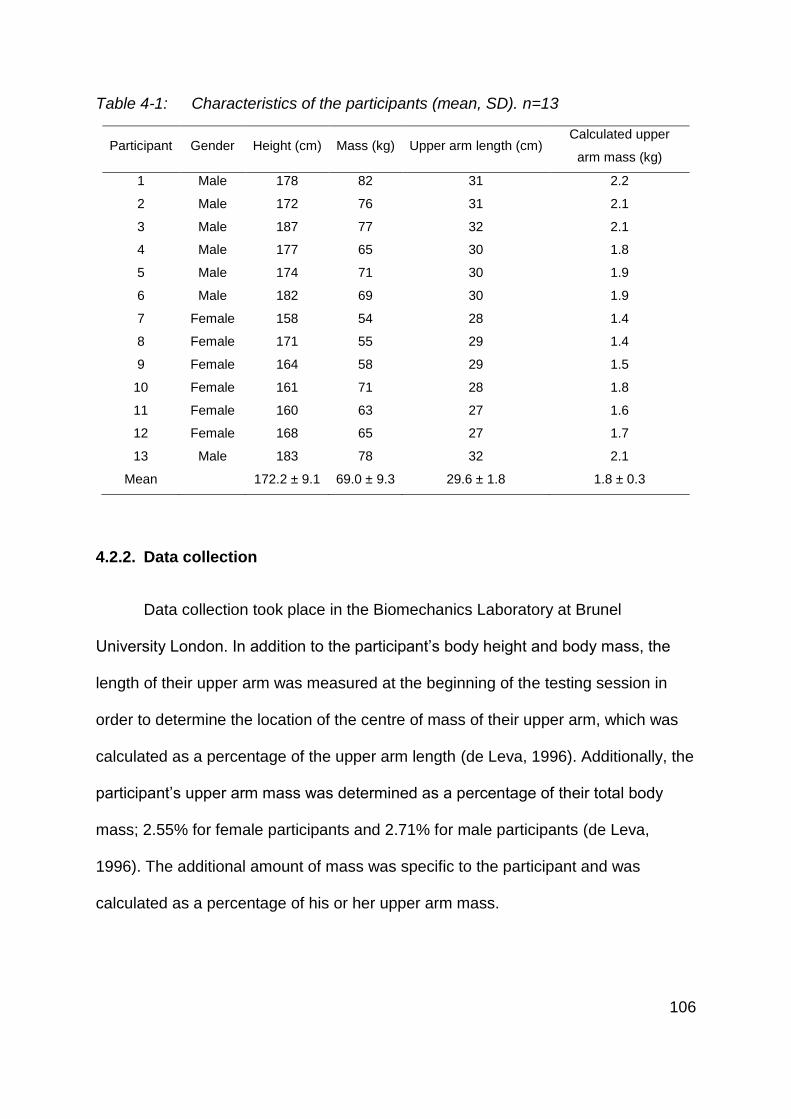
106
Table 4-1: Characteristics of the participants (mean, SD). n=13
Participant Gender Height (cm) Mass (kg) Upper arm length (cm) Calculated upper
arm mass (kg)
1 Male 178 82 31 2.2
2 Male 172 76 31 2.1
3 Male 187 77 32 2.1
4 Male 177 65 30 1.8
5 Male 174 71 30 1.9
6 Male 182 69 30 1.9
7 Female 158 54 28 1.4
8 Female 171 55 29 1.4
9 Female 164 58 29 1.5
10 Female 161 71 28 1.8
11 Female 160 63 27 1.6
12 Female 168 65 27 1.7
13 Male 183 78 32 2.1
Mean 172.2 ± 9.1 69.0 ± 9.3 29.6 ± 1.8 1.8 ± 0.3
4.2.2. Data collection
Data collection took place in the Biomechanics Laboratory at Brunel
University London. In addition to the participant’s body height and body mass, the
length of their upper arm was measured at the beginning of the testing session in
order to determine the location of the centre of mass of their upper arm, which was
calculated as a percentage of the upper arm length (de Leva, 1996). Additionally, the
participant’s upper arm mass was determined as a percentage of their total body
mass; 2.55% for female participants and 2.71% for male participants (de Leva,
1996). The additional amount of mass was specific to the participant and was
calculated as a percentage of his or her upper arm mass.
107
Each participant completed a total of 30 maximal-effort throws with various
amounts of mass attached around the centre of mass of their throwing arm. Apart
from throws performed without additional mass, the participant’s upper arm mass
was increased by 10%, 20%, 30%, 40% and 50% of body mass. The average mass
attached to the upper arm for each condition was 0.18 kg ± 0.03 kg, 0.37 kg ± 0.06
kg, 0.55 kg ± 0.09 kg, 0.73 kg ± 0.12, and 0.91 kg ± 0.14 kg respectively. The
masses attached to the participant’s upper arm ranged between 0.14 kg and 1.12 kg.
The additional mass consisted of lead shot and was attached to the participant’s
upper arm with Vet-Wrap (a cohesive bandage). The additional mass was attached
evenly around the centre of mass of the upper arm. Care was taken while attaching
the masses in order to ensure that the participant’s throwing motion was not
restricted or hindered. Five throws for each upper arm mass condition were
recorded.
At the start of the testing session, 46 reflective markers were placed on
anatomical landmarks of the participant’s body and the body segments in order to
calculate joint rotations (Table 4-2, Figure 4-1, Figure 4-2). Two reflective markers
were placed on the ball in order to calculate the ball release speed. Motion analysis
data were recorded of the throws using 10 infrared LED cameras (Motion Analysis,
Santa Rosa, USA) at 150 Hz. The participant threw a baseball ball (148 g) as fast as
possible towards a target positioned 5 m in front of them. The target was a cross
marked on a curtain at the height of the participant’s shoulder (30 cm x 30 cm). The
accuracy of the throws was not measured, but all throws hit the curtain.
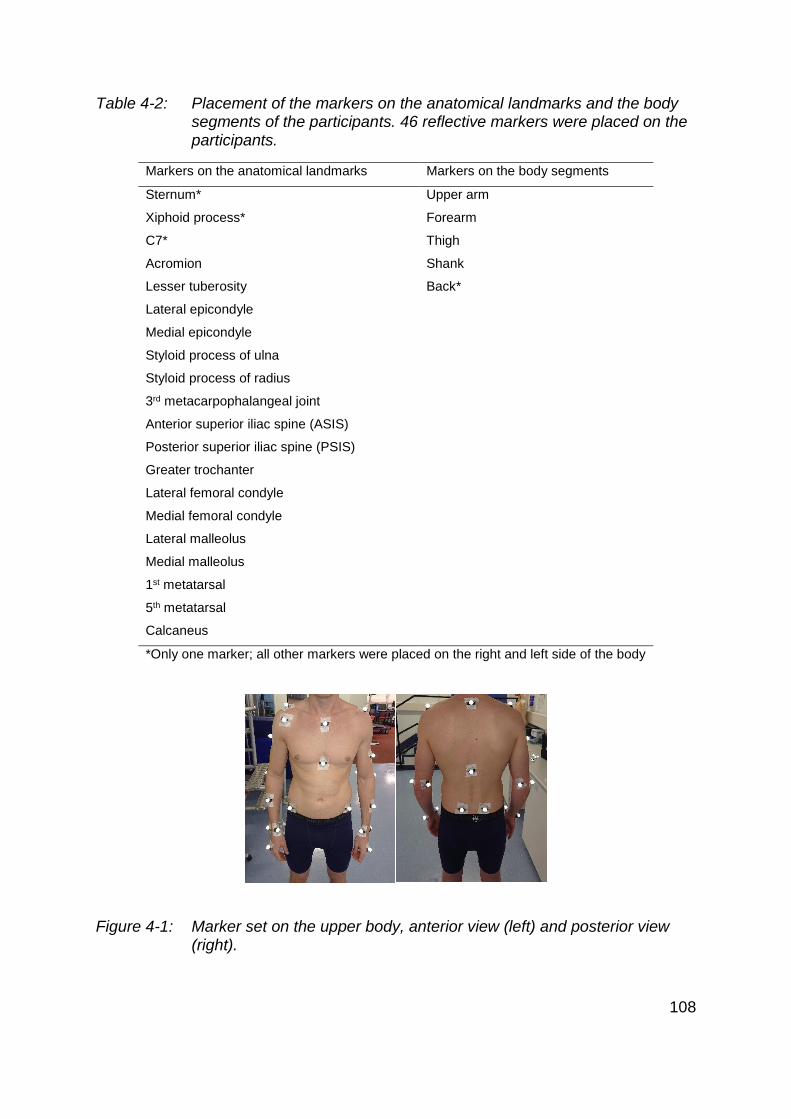
108
Table 4-2: Placement of the markers on the anatomical landmarks and the body segments of the participants. 46 reflective markers were placed on the participants.
Markers on the anatomical landmarks Markers on the body segments
Sternum* Upper arm
Xiphoid process* Forearm
C7* Thigh
Acromion Shank
Lesser tuberosity Back*
Lateral epicondyle
Medial epicondyle
Styloid process of ulna
Styloid process of radius
3rd metacarpophalangeal joint
Anterior superior iliac spine (ASIS)
Posterior superior iliac spine (PSIS)
Greater trochanter
Lateral femoral condyle
Medial femoral condyle
Lateral malleolus
Medial malleolus
1st metatarsal
5th metatarsal
Calcaneus
*Only one marker; all other markers were placed on the right and left side of the body
Figure 4-1: Marker set on the upper body, anterior view (left) and posterior view (right).
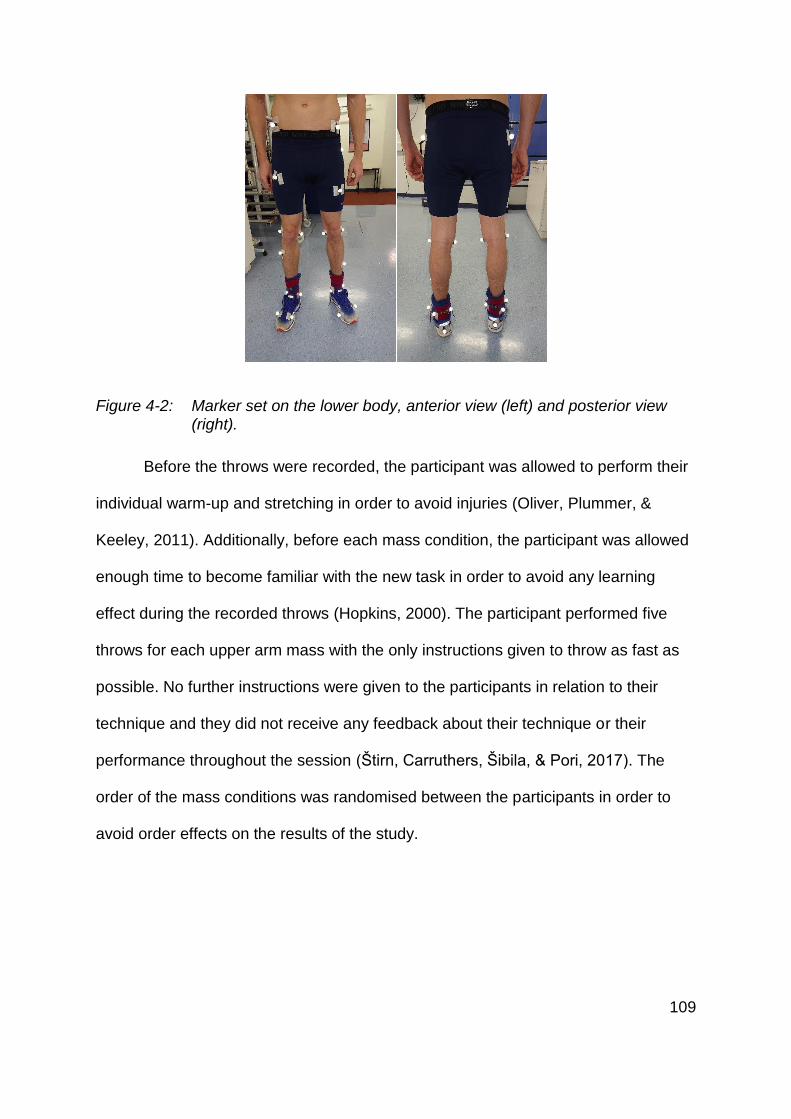
109
Figure 4-2: Marker set on the lower body, anterior view (left) and posterior view (right).
Before the throws were recorded, the participant was allowed to perform their
individual warm-up and stretching in order to avoid injuries (Oliver, Plummer, &
Keeley, 2011). Additionally, before each mass condition, the participant was allowed
enough time to become familiar with the new task in order to avoid any learning
effect during the recorded throws (Hopkins, 2000). The participant performed five
throws for each upper arm mass with the only instructions given to throw as fast as
possible. No further instructions were given to the participants in relation to their
technique and they did not receive any feedback about their technique or their
performance throughout the session (Štirn, Carruthers, Šibila, & Pori, 2017). The
order of the mass conditions was randomised between the participants in order to
avoid order effects on the results of the study.
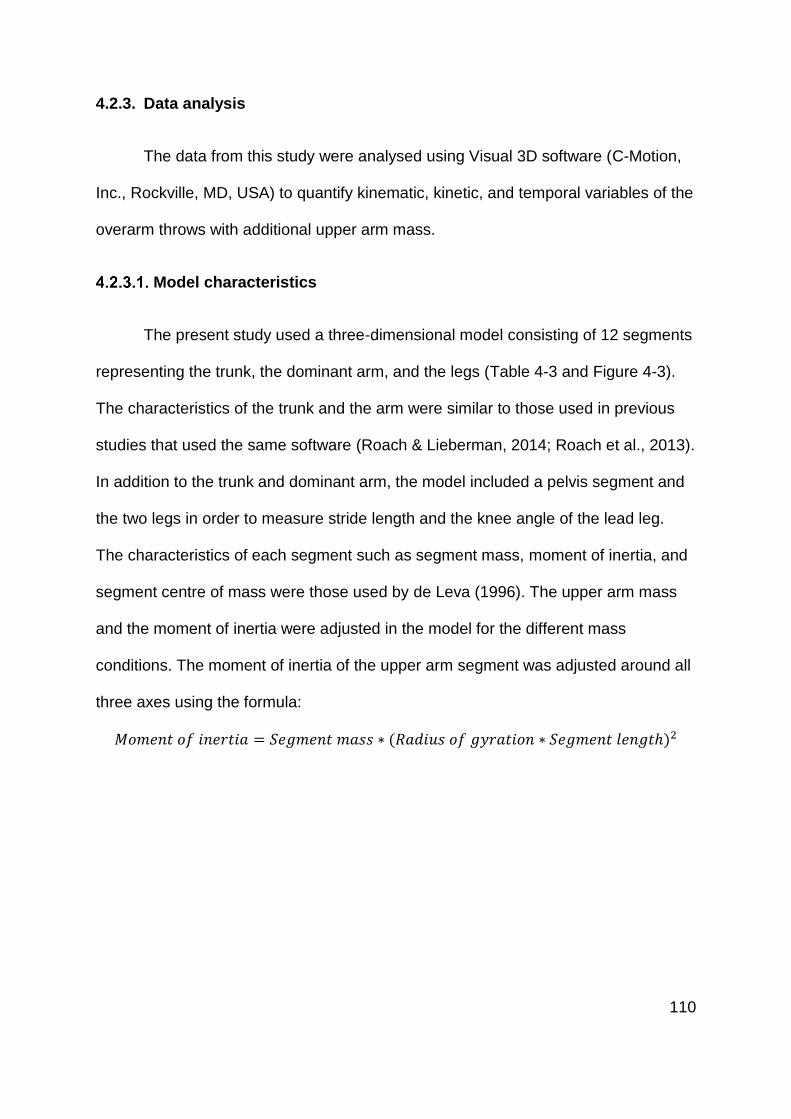
110
4.2.3. Data analysis
The data from this study were analysed using Visual 3D software (C-Motion,
Inc., Rockville, MD, USA) to quantify kinematic, kinetic, and temporal variables of the
overarm throws with additional upper arm mass.
Model characteristics
The present study used a three-dimensional model consisting of 12 segments
representing the trunk, the dominant arm, and the legs (Table 4-3 and Figure 4-3).
The characteristics of the trunk and the arm were similar to those used in previous
studies that used the same software (Roach & Lieberman, 2014; Roach et al., 2013).
In addition to the trunk and dominant arm, the model included a pelvis segment and
the two legs in order to measure stride length and the knee angle of the lead leg.
The characteristics of each segment such as segment mass, moment of inertia, and
segment centre of mass were those used by de Leva (1996). The upper arm mass
and the moment of inertia were adjusted in the model for the different mass
conditions. The moment of inertia of the upper arm segment was adjusted around all
three axes using the formula:
𝑀𝑜𝑚𝑒𝑛𝑡 𝑜𝑓 𝑖𝑛𝑒𝑟𝑡𝑖𝑎 = 𝑆𝑒𝑔𝑚𝑒𝑛𝑡 𝑚𝑎𝑠𝑠 ∗ (𝑅𝑎𝑑𝑖𝑢𝑠 𝑜𝑓 𝑔𝑦𝑟𝑎𝑡𝑖𝑜𝑛 ∗ 𝑆𝑒𝑔𝑚𝑒𝑛𝑡 𝑙𝑒𝑛𝑔𝑡ℎ)2
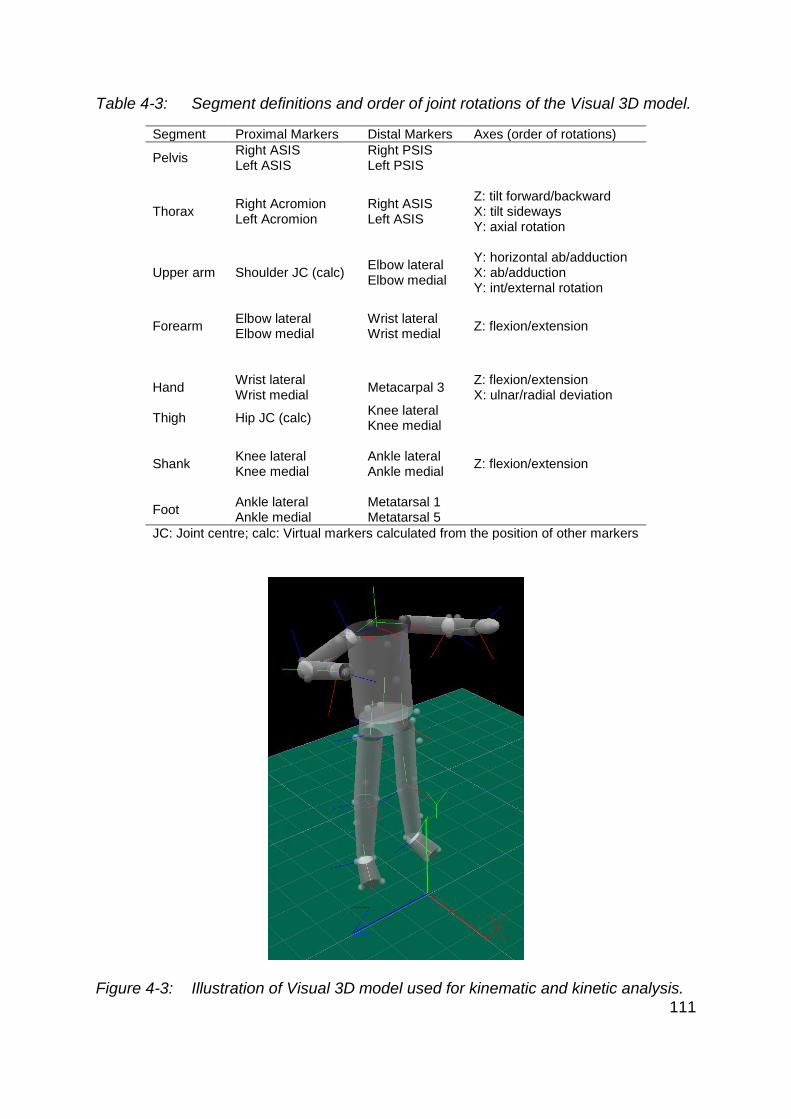
111
Table 4-3: Segment definitions and order of joint rotations of the Visual 3D model.
Segment Proximal Markers Distal Markers Axes (order of rotations)
Pelvis Right ASIS Left ASIS
Right PSIS Left PSIS
Thorax Right Acromion Left Acromion
Right ASIS Left ASIS
Z: tilt forward/backward X: tilt sideways Y: axial rotation
Upper arm Shoulder JC (calc) Elbow lateral Elbow medial
Y: horizontal ab/adduction X: ab/adduction Y: int/external rotation
Forearm Elbow lateral Elbow medial
Wrist lateral Wrist medial
Z: flexion/extension
Hand Wrist lateral Wrist medial
Metacarpal 3 Z: flexion/extension X: ulnar/radial deviation
Thigh Hip JC (calc) Knee lateral Knee medial
Shank Knee lateral Knee medial
Ankle lateral Ankle medial
Z: flexion/extension
Foot Ankle lateral Ankle medial
Metatarsal 1 Metatarsal 5
JC: Joint centre; calc: Virtual markers calculated from the position of other markers
Figure 4-3: Illustration of Visual 3D model used for kinematic and kinetic analysis.
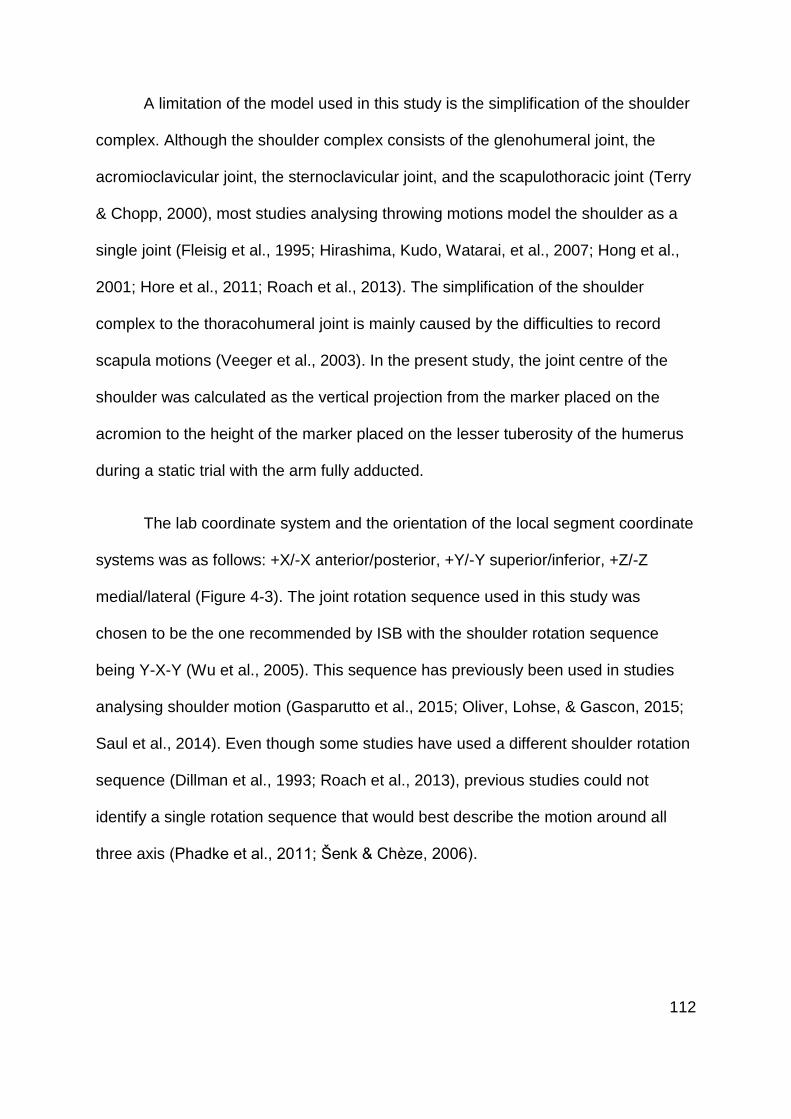
112
A limitation of the model used in this study is the simplification of the shoulder
complex. Although the shoulder complex consists of the glenohumeral joint, the
acromioclavicular joint, the sternoclavicular joint, and the scapulothoracic joint (Terry
& Chopp, 2000), most studies analysing throwing motions model the shoulder as a
single joint (Fleisig et al., 1995; Hirashima, Kudo, Watarai, et al., 2007; Hong et al.,
2001; Hore et al., 2011; Roach et al., 2013). The simplification of the shoulder
complex to the thoracohumeral joint is mainly caused by the difficulties to record
scapula motions (Veeger et al., 2003). In the present study, the joint centre of the
shoulder was calculated as the vertical projection from the marker placed on the
acromion to the height of the marker placed on the lesser tuberosity of the humerus
during a static trial with the arm fully adducted.
The lab coordinate system and the orientation of the local segment coordinate
systems was as follows: +X/-X anterior/posterior, +Y/-Y superior/inferior, +Z/-Z
medial/lateral (Figure 4-3). The joint rotation sequence used in this study was
chosen to be the one recommended by ISB with the shoulder rotation sequence
being Y-X-Y (Wu et al., 2005). This sequence has previously been used in studies
analysing shoulder motion (Gasparutto et al., 2015; Oliver, Lohse, & Gascon, 2015;
Saul et al., 2014). Even though some studies have used a different shoulder rotation
sequence (Dillman et al., 1993; Roach et al., 2013), previous studies could not
identify a single rotation sequence that would best describe the motion around all
three axis (Phadke et al., 2011; Šenk & Chèze, 2006).
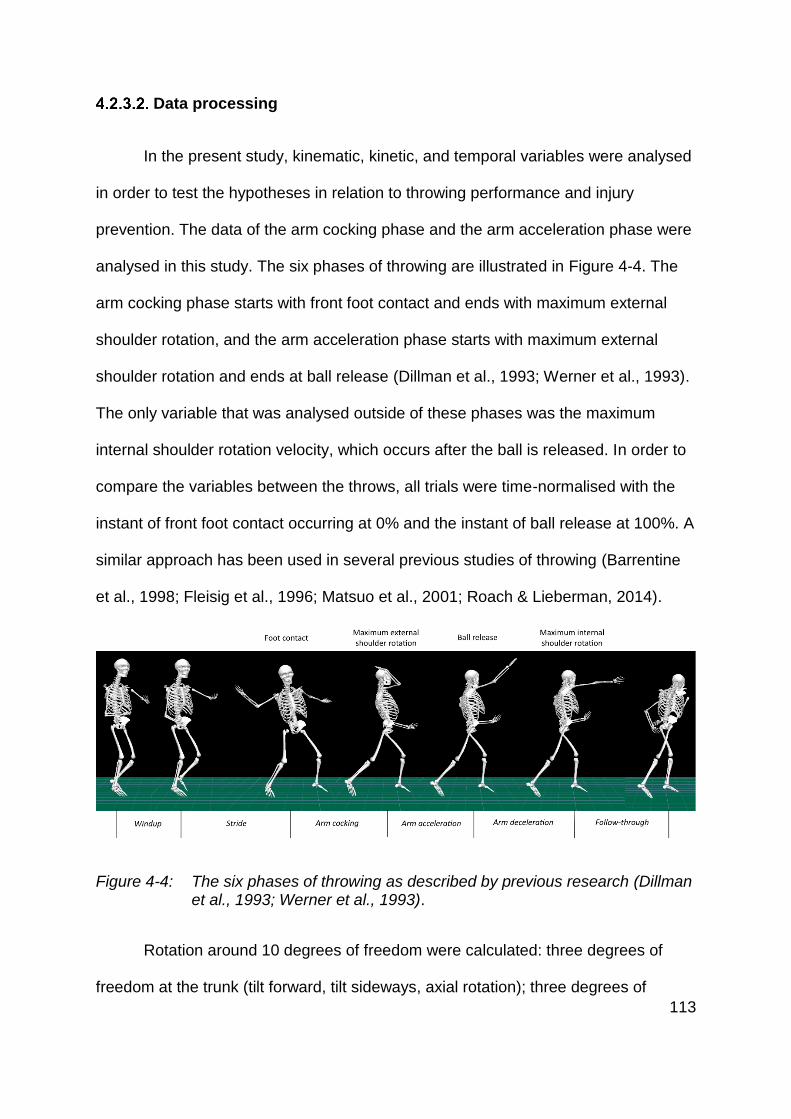
113
Data processing
In the present study, kinematic, kinetic, and temporal variables were analysed
in order to test the hypotheses in relation to throwing performance and injury
prevention. The data of the arm cocking phase and the arm acceleration phase were
analysed in this study. The six phases of throwing are illustrated in Figure 4-4. The
arm cocking phase starts with front foot contact and ends with maximum external
shoulder rotation, and the arm acceleration phase starts with maximum external
shoulder rotation and ends at ball release (Dillman et al., 1993; Werner et al., 1993).
The only variable that was analysed outside of these phases was the maximum
internal shoulder rotation velocity, which occurs after the ball is released. In order to
compare the variables between the throws, all trials were time-normalised with the
instant of front foot contact occurring at 0% and the instant of ball release at 100%. A
similar approach has been used in several previous studies of throwing (Barrentine
et al., 1998; Fleisig et al., 1996; Matsuo et al., 2001; Roach & Lieberman, 2014).
Figure 4-4: The six phases of throwing as described by previous research (Dillman et al., 1993; Werner et al., 1993).
Rotation around 10 degrees of freedom were calculated: three degrees of
freedom at the trunk (tilt forward, tilt sideways, axial rotation); three degrees of
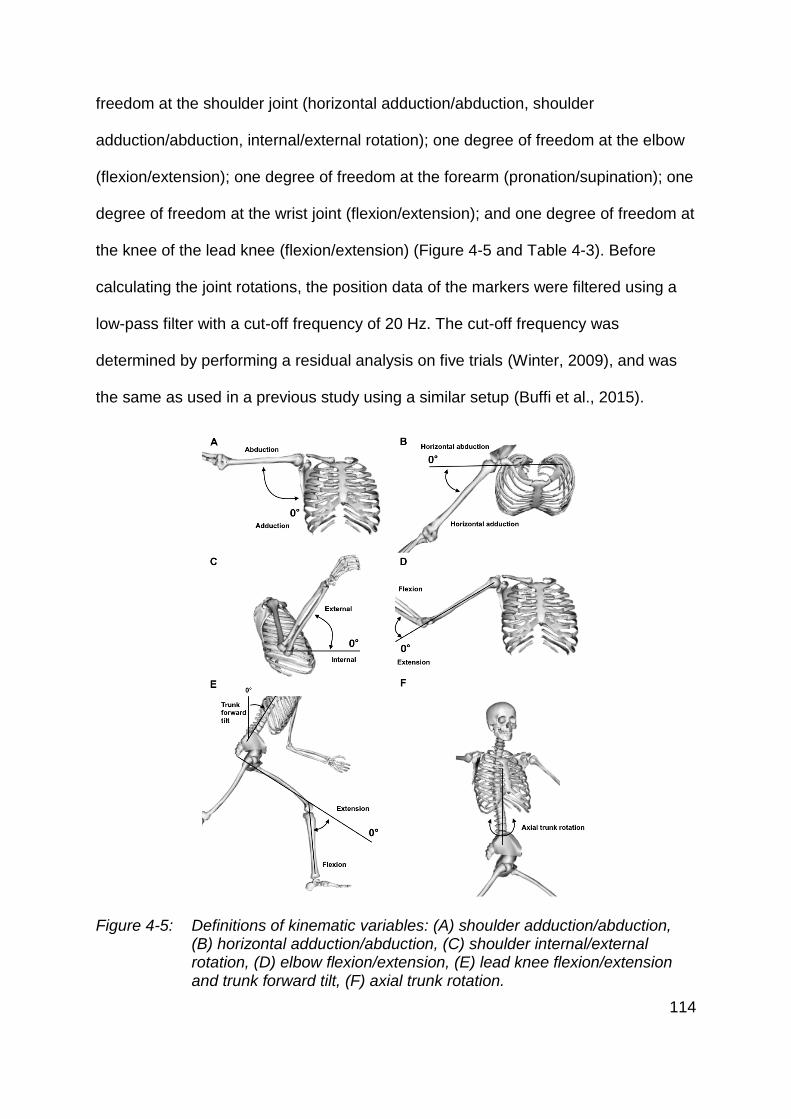
114
freedom at the shoulder joint (horizontal adduction/abduction, shoulder
adduction/abduction, internal/external rotation); one degree of freedom at the elbow
(flexion/extension); one degree of freedom at the forearm (pronation/supination); one
degree of freedom at the wrist joint (flexion/extension); and one degree of freedom at
the knee of the lead knee (flexion/extension) (Figure 4-5 and Table 4-3). Before
calculating the joint rotations, the position data of the markers were filtered using a
low-pass filter with a cut-off frequency of 20 Hz. The cut-off frequency was
determined by performing a residual analysis on five trials (Winter, 2009), and was
the same as used in a previous study using a similar setup (Buffi et al., 2015).
Figure 4-5: Definitions of kinematic variables: (A) shoulder adduction/abduction, (B) horizontal adduction/abduction, (C) shoulder internal/external rotation, (D) elbow flexion/extension, (E) lead knee flexion/extension and trunk forward tilt, (F) axial trunk rotation.
115
Joint torques were calculated for all three rotations of the shoulder joint, elbow
flexion/extension torque, and elbow varus/valgus torque (Figure 4-6). Additionally,
shoulder distraction/compression force at the shoulder was calculated (Figure 4-6).
Joint torques were normalised by dividing the values by the participant’s body height
and body mass and multiplying by the average body height and body mass of all the
participants, whereas the joint forces were normalised by dividing the values by the
participant’s body mass and multiplying by the average body mass (Fleisig et al.,
1996).
Figure 4-6: Anatomical reference frames of the shoulder (A) and elbow joints (B). Sy: Shoulder compression force (+), shoulder distraction force (-); Ex: axis of valgus (+)/ varus (-) torque.
Values at the instant of front foot contact, at the instant of ball release, and the
maximum values of these variables were analysed as these have previously been
identified as relating to either throwing performance or risk of injuries (Fleisig et al.,
1996, 1995, 1999; Matsuo et al., 2001; Stodden et al., 2005; Werner et al., 2001,
2002). In addition to kinematic and kinetic variables, the ball release speed was
calculated as the velocity of a virtual marker created at the midpoint between the two
116
reflective markers attached to the ball. The instant of ball release was visually
determined for each individual throw to be when the distance between the hand
marker and the ball markers started to increase. The stride length was defined as the
distance between the two ankle joint centres at the instant of front foot contact, and
was reported as a percentage of total body height (Fleisig et al., 1996). The three
fastest throws for each upper arm mass condition by each participant were chosen
for the analysis in order to account for the variability of ball release speed and
throwing technique within the throws performed by a participant (Bartlett, Wheat, &
Robins, 2007; Fleisig, Chu, Weber, & Andrews, 2009). The average value across the
three throws for each variable was used for each participant.
Statistical analysis
The statistical analysis was divided into two parts. First, a group analysis of
the ball release speed, kinematic variables, kinetic variables, and temporal variables
was performed. Additionally, the ball release speed was analysed for each
participant individually in order to determine if all participants benefited from the
additional upper arm mass.
Differences in ball release speed and throwing technique for all participants
with additional upper arm mass were analysed using a repeated measures ANOVA
test. If the main effect for upper arm mass was significant, follow-up t-tests
(Bonferroni) were performed for each upper arm mass condition. Statistical
significance was accepted at p<0.05. For data that were not normally distributed, the
non-parametric Friedman’s ANOVA was used to analyse the data.
117
Due to the considerable inter-individual differences that might occur in ball
release speed with additional upper arm mass, the ball release speed of each
participant was analysed individually (Bates, James, & Dufek, 2004). In order to
determine each participant’s optimal upper arm mass, a straight line (𝑦 = 𝑎𝑥 + 𝑏)
and a u-shape curve (𝑦 = 𝑌𝑀 + 𝑐(𝑥 − 𝑋𝑀)2) were fitted to the ball release speed with
changes in upper arm mass for each individual participant (Linthorne & Stokes,
2014). Akaike’s Information Criterion (AIC) was calculated using GraphPad Prism
version 7.00 (GraphPad Software, La Jolla, California, USA) in order to determine
which of the two models better fits the data (Motulsky & Christopoulos, 2003). Details
about how to calculate the AIC are provided in Appendix 1. The variables of the u-
shape provide information about the maximum ball release speed achieved (𝑌𝑀) and
the optimal upper arm mass (𝑋𝑀). In case of a straight line being the best-fit model to
the ball release speed with additional upper arm mass, the 95% confidence interval
of the gradient (a) was analysed in order to determine the effect. If the 95%
confidence interval of the gradient included zero, it was concluded that the additional
upper arm mass did not affect the participant’s ball release speed (Motulsky, 2013).
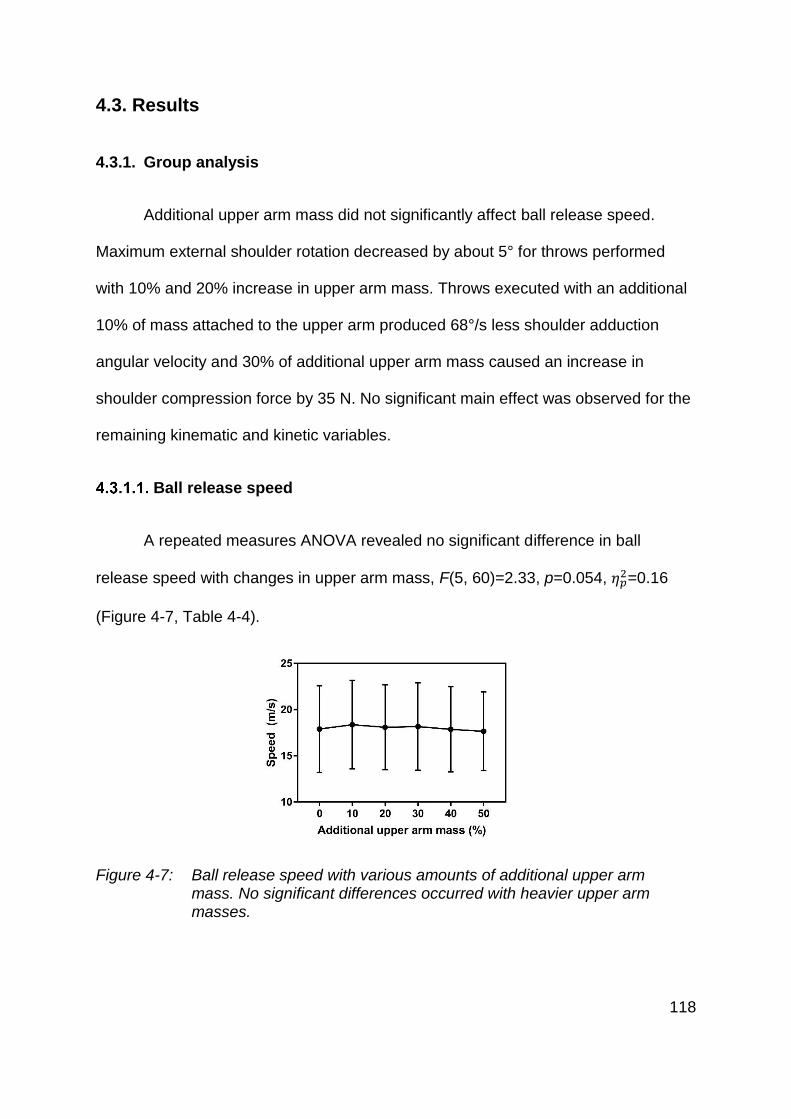
118
4.3. Results
4.3.1. Group analysis
Additional upper arm mass did not significantly affect ball release speed.
Maximum external shoulder rotation decreased by about 5° for throws performed
with 10% and 20% increase in upper arm mass. Throws executed with an additional
10% of mass attached to the upper arm produced 68°/s less shoulder adduction
angular velocity and 30% of additional upper arm mass caused an increase in
shoulder compression force by 35 N. No significant main effect was observed for the
remaining kinematic and kinetic variables.
Ball release speed
A repeated measures ANOVA revealed no significant difference in ball
release speed with changes in upper arm mass, F(5, 60)=2.33, p=0.054, 𝜂𝑝2=0.16
(Figure 4-7, Table 4-4).
Figure 4-7: Ball release speed with various amounts of additional upper arm mass. No significant differences occurred with heavier upper arm masses.
119
Kinematic variables
Most of the angles at maximum value, at the instant of front foot contact, and
at the instant of ball release did not significantly change with increased upper arm
mass (Table 4-4). The only significant changes were for the maximum external
shoulder rotation angle. Additional upper arm mass resulted in a significant main
effect for maximum external shoulder rotation, F(5, 60)=6.26, p<0.01, 𝜂𝑝2=0.34.
Bonferroni post-hoc tests revealed that maximum external shoulder rotation
significantly decreased with an additional 10% and 20% (p<0.05) of upper arm mass
compared to the throws performed without additional upper arm mass. A decrease of
about 5° was recorded.
A significant main effect for maximum shoulder adduction angular velocity
was recorded with additional upper arm mass, F(5, 60)=2.51, p<0.05, 𝜂𝑝2=0.17 (Table
4-5). A significant increase by 68°/s (p<0.05) in maximum shoulder adduction
angular velocity was measured with an additional 10% of upper arm mass compared
to the throws performed without additional upper arm mass. Repeated measures
ANOVA for all remaining kinematic variables, including the timing of these variables,
did not show any significant main effects between the different upper arm mass
conditions.
Kinetic variables
Additional upper arm results in a significant difference in maximum shoulder
compression force, F(5, 60)=3.05, p<0.05, 𝜂𝑝2=0.20 (Table 4-5). Bonferroni post-hoc
tests identified a significant increase by 35 N in maximum shoulder compression
force (p<0.05) for the throws performed with an additional 30% of mass attached to
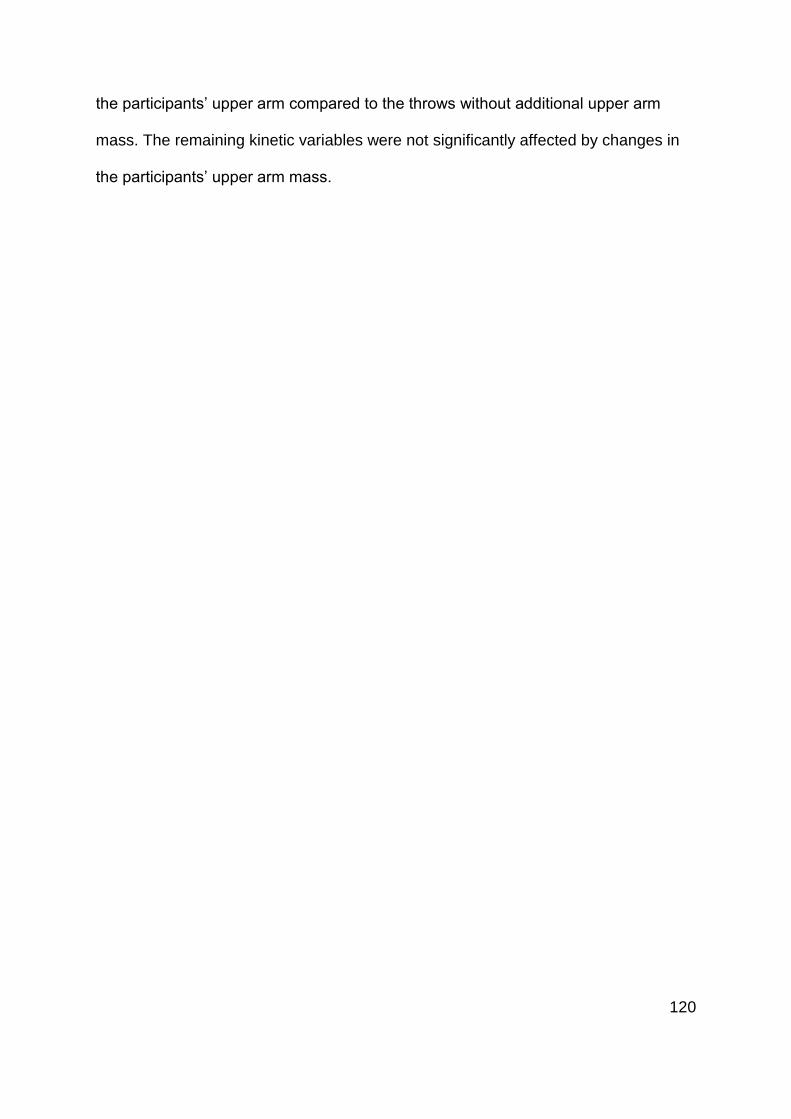
120
the participants’ upper arm compared to the throws without additional upper arm
mass. The remaining kinetic variables were not significantly affected by changes in
the participants’ upper arm mass.
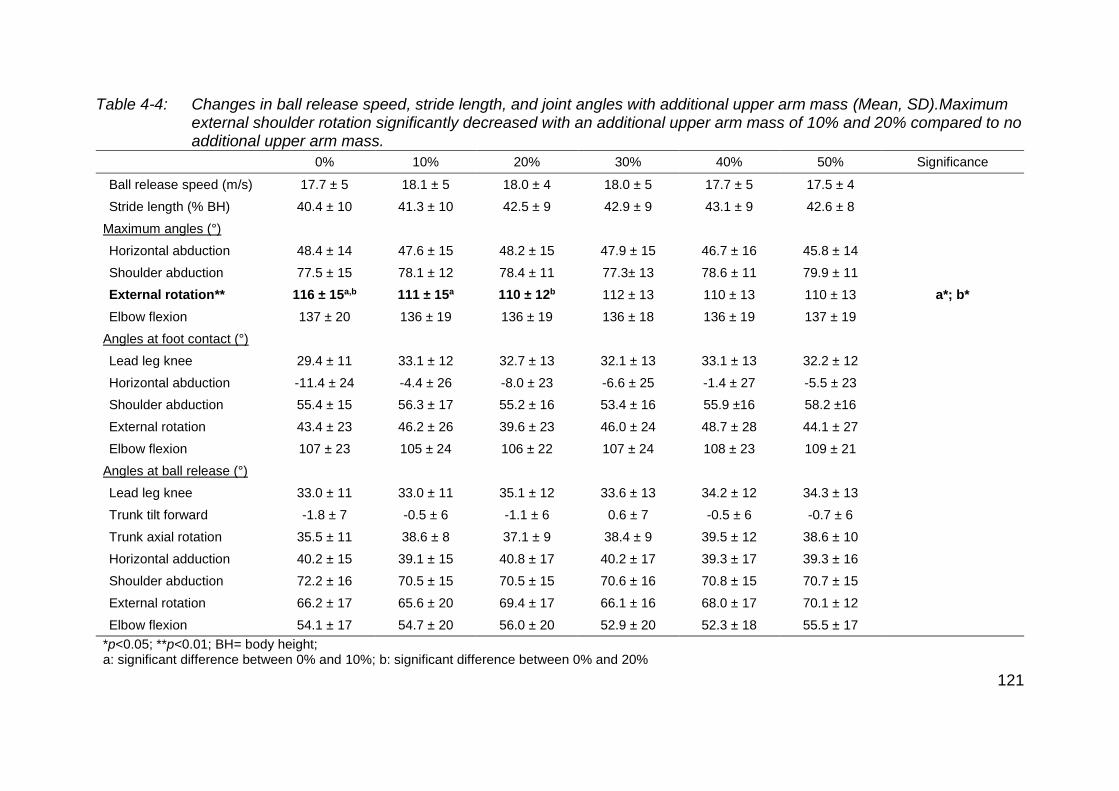
121
Table 4-4: Changes in ball release speed, stride length, and joint angles with additional upper arm mass (Mean, SD).Maximum external shoulder rotation significantly decreased with an additional upper arm mass of 10% and 20% compared to no additional upper arm mass.
0% 10% 20% 30% 40% 50% Significance
Ball release speed (m/s) 17.7 ± 5 18.1 ± 5 18.0 ± 4 18.0 ± 5 17.7 ± 5 17.5 ± 4
Stride length (% BH) 40.4 ± 10 41.3 ± 10 42.5 ± 9 42.9 ± 9 43.1 ± 9 42.6 ± 8
Maximum angles (°)
Horizontal abduction 48.4 ± 14 47.6 ± 15 48.2 ± 15 47.9 ± 15 46.7 ± 16 45.8 ± 14
Shoulder abduction 77.5 ± 15 78.1 ± 12 78.4 ± 11 77.3± 13 78.6 ± 11 79.9 ± 11
External rotation** 116 ± 15a,b 111 ± 15a 110 ± 12b 112 ± 13 110 ± 13 110 ± 13 a*; b*
Elbow flexion 137 ± 20 136 ± 19 136 ± 19 136 ± 18 136 ± 19 137 ± 19
Angles at foot contact (°)
Lead leg knee 29.4 ± 11 33.1 ± 12 32.7 ± 13 32.1 ± 13 33.1 ± 13 32.2 ± 12
Horizontal abduction -11.4 ± 24 -4.4 ± 26 -8.0 ± 23 -6.6 ± 25 -1.4 ± 27 -5.5 ± 23
Shoulder abduction 55.4 ± 15 56.3 ± 17 55.2 ± 16 53.4 ± 16 55.9 ±16 58.2 ±16
External rotation 43.4 ± 23 46.2 ± 26 39.6 ± 23 46.0 ± 24 48.7 ± 28 44.1 ± 27
Elbow flexion 107 ± 23 105 ± 24 106 ± 22 107 ± 24 108 ± 23 109 ± 21
Angles at ball release (°)
Lead leg knee 33.0 ± 11 33.0 ± 11 35.1 ± 12 33.6 ± 13 34.2 ± 12 34.3 ± 13
Trunk tilt forward -1.8 ± 7 -0.5 ± 6 -1.1 ± 6 0.6 ± 7 -0.5 ± 6 -0.7 ± 6
Trunk axial rotation 35.5 ± 11 38.6 ± 8 37.1 ± 9 38.4 ± 9 39.5 ± 12 38.6 ± 10
Horizontal adduction 40.2 ± 15 39.1 ± 15 40.8 ± 17 40.2 ± 17 39.3 ± 17 39.3 ± 16
Shoulder abduction 72.2 ± 16 70.5 ± 15 70.5 ± 15 70.6 ± 16 70.8 ± 15 70.7 ± 15
External rotation 66.2 ± 17 65.6 ± 20 69.4 ± 17 66.1 ± 16 68.0 ± 17 70.1 ± 12
Elbow flexion 54.1 ± 17 54.7 ± 20 56.0 ± 20 52.9 ± 20 52.3 ± 18 55.5 ± 17
*p<0.05; **p<0.01; BH= body height; a: significant difference between 0% and 10%; b: significant difference between 0% and 20%
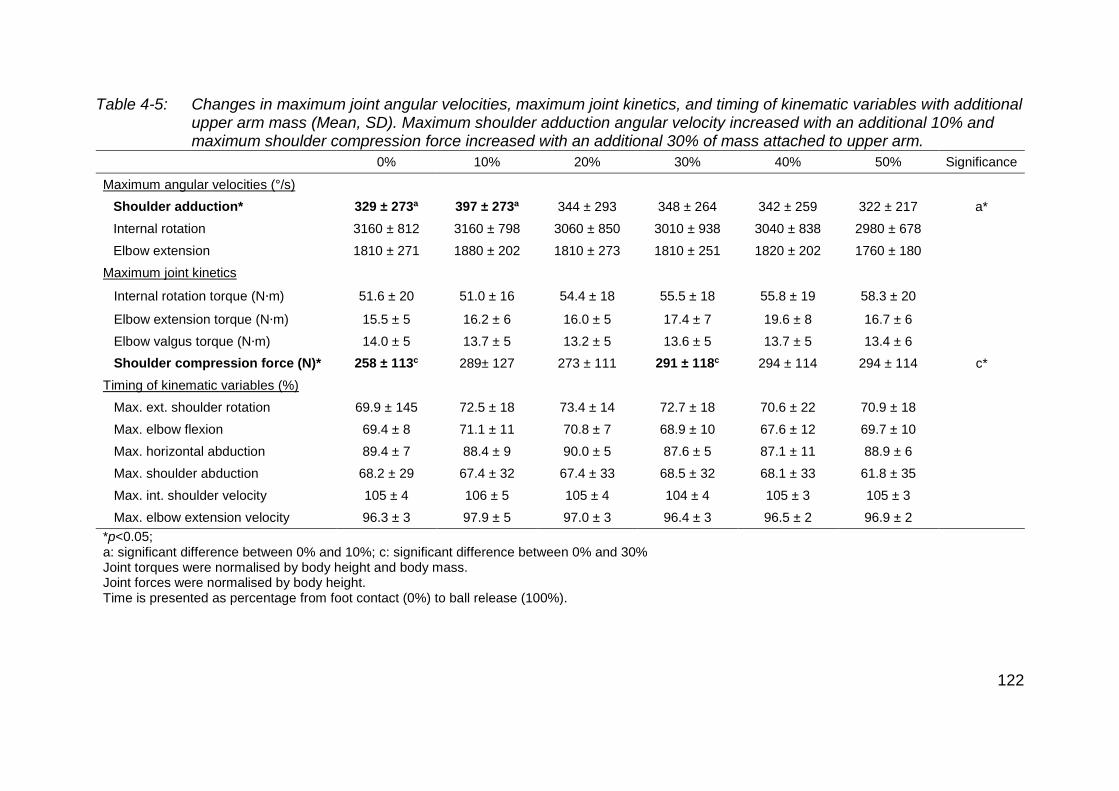
122
Table 4-5: Changes in maximum joint angular velocities, maximum joint kinetics, and timing of kinematic variables with additional upper arm mass (Mean, SD). Maximum shoulder adduction angular velocity increased with an additional 10% and maximum shoulder compression force increased with an additional 30% of mass attached to upper arm.
0% 10% 20% 30% 40% 50% Significance
Maximum angular velocities (°/s)
Shoulder adduction* 329 ± 273a 397 ± 273a 344 ± 293 348 ± 264 342 ± 259 322 ± 217 a*
Internal rotation 3160 ± 812 3160 ± 798 3060 ± 850 3010 ± 938 3040 ± 838 2980 ± 678
Elbow extension 1810 ± 271 1880 ± 202 1810 ± 273 1810 ± 251 1820 ± 202 1760 ± 180
Maximum joint kinetics
Internal rotation torque (N∙m) 51.6 ± 20 51.0 ± 16 54.4 ± 18 55.5 ± 18 55.8 ± 19 58.3 ± 20
Elbow extension torque (N∙m) 15.5 ± 5 16.2 ± 6 16.0 ± 5 17.4 ± 7 19.6 ± 8 16.7 ± 6
Elbow valgus torque (N∙m) 14.0 ± 5 13.7 ± 5 13.2 ± 5 13.6 ± 5 13.7 ± 5 13.4 ± 6
Shoulder compression force (N)* 258 ± 113c 289± 127 273 ± 111 291 ± 118c 294 ± 114 294 ± 114 c*
Timing of kinematic variables (%)
Max. ext. shoulder rotation 69.9 ± 145 72.5 ± 18 73.4 ± 14 72.7 ± 18 70.6 ± 22 70.9 ± 18
Max. elbow flexion 69.4 ± 8 71.1 ± 11 70.8 ± 7 68.9 ± 10 67.6 ± 12 69.7 ± 10
Max. horizontal abduction 89.4 ± 7 88.4 ± 9 90.0 ± 5 87.6 ± 5 87.1 ± 11 88.9 ± 6
Max. shoulder abduction 68.2 ± 29 67.4 ± 32 67.4 ± 33 68.5 ± 32 68.1 ± 33 61.8 ± 35
Max. int. shoulder velocity 105 ± 4 106 ± 5 105 ± 4 104 ± 4 105 ± 3 105 ± 3
Max. elbow extension velocity 96.3 ± 3 97.9 ± 5 97.0 ± 3 96.4 ± 3 96.5 ± 2 96.9 ± 2
*p<0.05; a: significant difference between 0% and 10%; c: significant difference between 0% and 30% Joint torques were normalised by body height and body mass. Joint forces were normalised by body height. Time is presented as percentage from foot contact (0%) to ball release (100%).
123
4.3.2. Individual analysis
Analysing the ball release speed with additional upper arm mass for each
individual participant highlights that some participants benefited from increasing their
upper arm mass (Figure 4-8 A). A u-shape was the best fit to the ball release speed
for eight out of the thirteen participants (Table 4-6). The increase in ball release
speed for these participants ranged between 0.04 m/s and 2.40 m/s. The optimal
upper arm mass ranged between 7.3% and 34.6% of additional upper arm mass.
Figure 4-8: Ball release speed with additional upper arm mass for each individual participant. (A) The optimal upper arm mass (x) for 8 participants is higher than their actual upper arm mass. (B) 5 participants did not display an optimal upper arm mass within the range of masses tested. The ball release speed for each individual throw analysed for Participants 2 and 10 are presented including the best-fit curve with the 95% confidence interval (dashed lines).
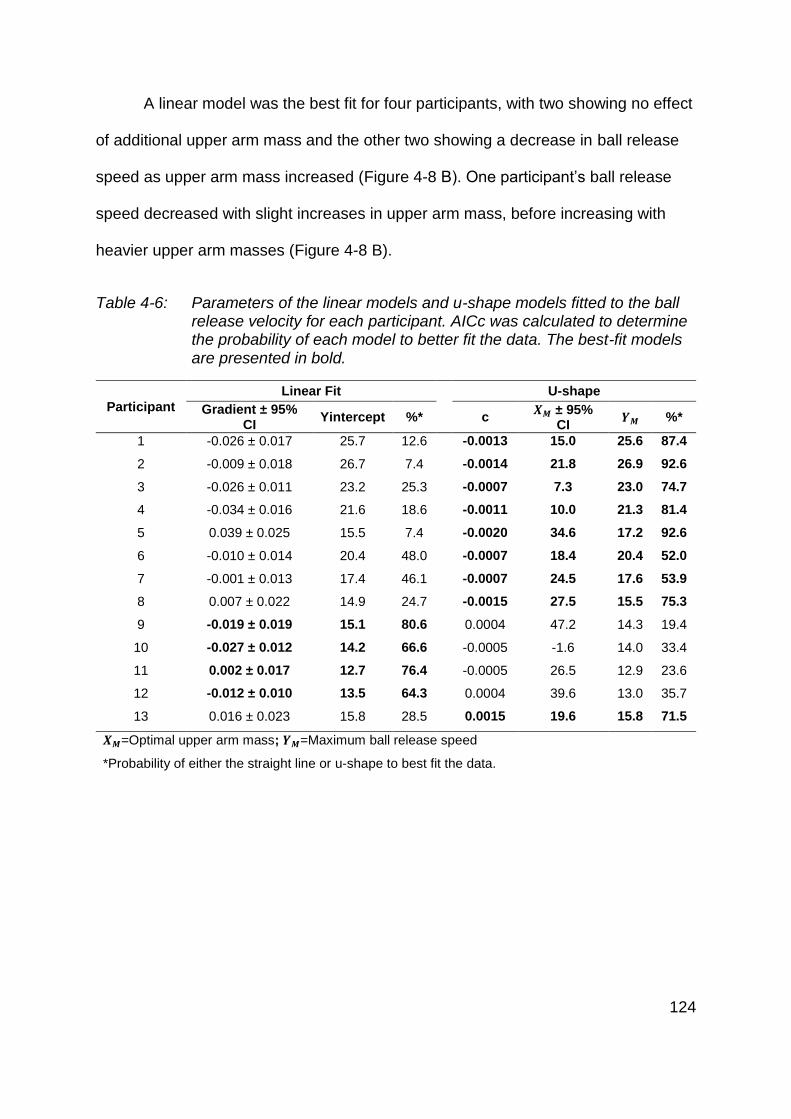
124
A linear model was the best fit for four participants, with two showing no effect
of additional upper arm mass and the other two showing a decrease in ball release
speed as upper arm mass increased (Figure 4-8 B). One participant’s ball release
speed decreased with slight increases in upper arm mass, before increasing with
heavier upper arm masses (Figure 4-8 B).
Table 4-6: Parameters of the linear models and u-shape models fitted to the ball release velocity for each participant. AICc was calculated to determine the probability of each model to better fit the data. The best-fit models are presented in bold.
Participant
Linear Fit U-shape
Gradient ± 95% CI
Yintercept %* c 𝑿𝑴 ± 95%
CI 𝒀𝑴 %*
1 -0.026 ± 0.017 25.7 12.6 -0.0013 15.0 25.6 87.4
2 -0.009 ± 0.018 26.7 7.4 -0.0014 21.8 26.9 92.6
3 -0.026 ± 0.011 23.2 25.3 -0.0007 7.3 23.0 74.7
4 -0.034 ± 0.016 21.6 18.6 -0.0011 10.0 21.3 81.4
5 0.039 ± 0.025 15.5 7.4 -0.0020 34.6 17.2 92.6
6 -0.010 ± 0.014 20.4 48.0 -0.0007 18.4 20.4 52.0
7 -0.001 ± 0.013 17.4 46.1 -0.0007 24.5 17.6 53.9
8 0.007 ± 0.022 14.9 24.7 -0.0015 27.5 15.5 75.3
9 -0.019 ± 0.019 15.1 80.6 0.0004 47.2 14.3 19.4
10 -0.027 ± 0.012 14.2 66.6 -0.0005 -1.6 14.0 33.4
11 0.002 ± 0.017 12.7 76.4 -0.0005 26.5 12.9 23.6
12 -0.012 ± 0.010 13.5 64.3 0.0004 39.6 13.0 35.7
13 0.016 ± 0.023 15.8 28.5 0.0015 19.6 15.8 71.5
𝑿𝑴=Optimal upper arm mass; 𝒀𝑴=Maximum ball release speed
*Probability of either the straight line or u-shape to best fit the data.
125
4.4. Discussion
The group analysis of the ball release speed with additional upper arm mass
did not reveal a common optimal upper arm mass. None of the upper arm mass
conditions resulted in a higher ball release speed. Furthermore, analysis of the
throwing technique revealed differences in maximum external shoulder rotation for
throws performed with an additional 10% and 20% of mass attached to the upper
arm. Increasing the upper arm mass by 10% resulted in an increase in maximum
shoulder adduction angular velocity, while an additional 30% of mass increased the
shoulder compression force. None of the other kinematic, kinetic, or temporal
variables changed between the upper arm mass conditions.
However, analysing the ball release speed of each individual participant
revealed that the majority of the participants (8 out of 13) benefited from a heavier
upper arm mass. The optimal upper arm mass varied between participants, which
might be one of the reasons why no significant differences in ball release speed
were observed between the mass conditions. Additionally, out of the eight
participants that increased their ball release speed with a heavier upper arm mass,
only two of them improved their ball release speed by more than a previous study in
cricket bowling has identified to have an effect on the performance (Petersen,
Wilson, & Hopkins, 2004). A participant’s individual optimal upper arm mass, the
small effect of additional upper arm mass on some participant’s ball release speed,
and the negative effect on the performance of some participants provided evidence
that future studies should analyse each participant individually.
126
4.4.1. Throwing performance
Throwing a projectile is an important skill in some sports, where the goal is to
throw the projectile as fast, as far, or as accurate as possible (eg. baseball, cricket,
javelin throw, basketball). Apart from the release angle and the release height, the
release velocity is the major contributor to the success in many of these sports
(Linthorne, 2006). Thus, athletes and coaches try to maximise the release velocity in
order to improve their performance. Previous research has focussed on various
training programs in order to improve throwing performance (van den Tillaar, 2004),
including training programs that involved throwing balls of various masses (Petersen
et al., 2004; Wickington & Linthorne, 2017). However, only limited research has
emphasised the idea of changing arm segment masses to maximise throwing
performance.
Ball release speed
Throwing a projectile involves complex coordination between the body
segments in order to reach a high velocity at the most distal segment of the kinetic
chain (Putnam, 1993). As the kinetic chain relies on the conservation of angular
momentum in order to increase the angular velocity, changes in segment mass and
moment of inertia affect the outcome of the movement. Three previous studies have
analysed the effect of arm segment mass on throwing performance, such as
throwing as fast as possible (Southard, 1998), throwing as far as possible (Linthorne
et al., n.d.), or horizontal arm swing velocity (Kim et al., 2008). All three studies and
the two-dimensional simulation study performed in the previous chapter (Chapter 3)
conclude that an athlete’s throwing performance can be improved by increasing the
127
upper arm mass. The findings of these studies would suggest that there is an optimal
upper arm mass that results in the highest ball release speed, as has been observed
in javelin throwing where the aim is to maximise the distance thrown (Linthorne et al.,
n.d.). However, no previous study has attempted to determine the optimal upper arm
mass in a throw where the goal is to reach the highest ball release speed.
The present study did not identify an optimal upper arm mass that results in
the maximum ball release speed across all participants (Figure 4-7 and Table 4-4).
However, further analysis of the ball release speed for each individual participant
highlighted that 8 out of 13 participants increased their performance with heavier
upper arm masses (Figure 4-8 A and Table 4-6). Of the remaining five participants,
two were not affected by additional upper arm mass (Figure 4-8 B). The ball release
speed decreased as the upper arm mass increased for two participants, while one
participant showed a negative effect with the lighter upper arm mass conditions, but
benefited from the heavier upper arm masses. These differences between
participants combined with the variability in optimal upper arm mass between
participants suggest that there is not a common optimal upper arm mass that would
benefit all athletes. Fitting a u-shape to the ball release speed of each participant
revealed an optimal upper arm masses ranging from 7.3% to 34.6% of additional
mass attached around the centre of mass of the upper arm. The highest increase
observed in the present study was 2.4 m/s, but some of the participants only
managed to slightly increase their ball release speed, with only participants
increasing their ball release speed by more than 0.7 m/s, which makes a substantial
difference in cricket bowling (Petersen et al., 2004)
128
The results of the present study show that optimising an athlete’s upper arm
mass could be beneficial in sports such as baseball where the aim is to maximise
ball release speed. However, it has to be noted that not every athlete would benefit
from a heavier upper arm mass. The findings of the present study extend our
knowledge by highlighting that the optimal upper arm mass varies between
participants, but athletes and coaches should be cautious when attempting to apply
these findings by ensuring that the specific athlete benefits from a heavier upper arm
mass and determining the athlete’s optimal upper arm mass. Differences in the
optimal upper arm mass between participants have previously been observed in
javelin throwing (Linthorne et al., n.d.), and the present study confirms that this is
also the case for throwing a baseball for maximum velocity.
The participants in the present study were not highly skilled throwers. It
remains to be seen if highly skilled athletes are affected in the same way by
additional upper arm mass. The ball release speeds achieved in the present study
were comparable to those of youth baseball pitchers (Fleisig et al., 1999; Ishida,
Murata, & Hirano, 2006; Sgroi et al., 2015; Wicke, Keeley, & Oliver, 2013), but lower
than those of professional and college baseball pitchers (Fleisig et al., 2006, 1999;
Whiteside, Martini, Zernicke, & Goulet, 2016). A previous study observed a positive
relationship between the muscle volume of the upper arm of the throwing arm and
the ball release speed in high-school baseball pitchers (Yamada, Yamashita, et al.,
2013). Therefore, it might be that highly skilled throwers are already at their optimal
upper arm mass through their sport-specific training. Further research involving
highly skilled throwers is required in order to determine if their upper arm mass could
be optimised.
129
The inclusion of female participants in the present study might have affected
the outcome, as various studies have reported a “gender gap” in throwing
performance (Ehl, Roberton, & Langendorfer, 2005; Lorson, Stodden, Langendorfer,
& Goodway, 2013; Thomas, Alderson, Thomas, Campbell, & Elliott, 2010). The four
participants that were not affected or negatively affected by additional upper arm
mass were all female (Figure 4-8 B). Further research could provide an insight into
how differences in body segment masses affect a female’s ability to throw.
Throwing technique
Although previous studies have analysed the effect of additional upper arm
mass on ball release speed, none of them have identified how changes in upper arm
mass affect joint kinematics. In the present study, it was hypothesised that heavier
upper arm masses would not affect joint kinematics. Retaining a similar throwing
technique while improving performance might be an indication that optimising the
upper arm mass improves the transfer of angular momentum between the heavy
trunk segment and the much lighter upper arm.
In the present study, maximum external shoulder rotation decreased with an
additional 10% or 20% of mass attached to the participant’s upper arm (Table 4-4).
Previous studies have identified that decreasing the maximum external shoulder
rotation results in lower ball release speeds (Matsuo et al., 2001). However, as the
ball release speed with additional upper arm mass in the present study did not
change, the results suggest that the participants improved the transfer of momentum
as they reached the same ball release speed while decreasing the range of motion
about the longitudinal axis of the upper arm. The maximum external shoulder
130
rotation values recorded in the present study are lower than the values reported for
baseball pitchers (Dun et al., 2007; Escamilla et al., 2007), as the participants in the
present study did not regularly engage in throwing-related sporting activities.
Optimising the upper arm mass did not affect any of the other angles of the
shoulder or elbow. Shoulder abduction angles throughout the throws were less than
the values reported in baseball pitching studies (Fleisig et al., 1996; Fortenbaugh &
Fleisig, 2009). A previous study used three-dimensional simulations of baseball
pitchers to determine that the optimal shoulder abduction angle to maximise hand
velocity is about 90° (Matsuo et al., 2002). The differences in shoulder abduction
angle between highly skilled throwers and the participants in this study are one of the
reasons for the lower ball release speeds recorded in the present study. However, in
the present study changing the participant’s upper arm mass did not improve their
shoulder abduction angle.
Attaching an additional 10% of mass to the participant’s upper arm resulted in
an increase in maximum shoulder adduction angular velocity (Table 4-5). Increasing
the shoulder angular velocity has previously been identified as contributing to a
higher ball release speed (Werner et al., 2008). Increasing the velocity of the
shoulder joint could also assist elbow extension due to the interactions torques
acting from the upper arm on the forearm (Hirashima, 2002). Additional upper arm
mass did not affect the other angular velocities that were measured. Interestingly,
even with a reduced external shoulder rotation the maximum internal shoulder
rotation did not decrease. This suggests that the heavier upper arm mass enabled
the participants to generate the same amount of internal shoulder rotation angular
131
velocity even though they reduced the range of motion over which they accelerated
their upper arm.
A study by Southard (1998) analysed the effect of additional masses attached
to the arm segments on throwing. He found that heavier upper arm masses of
around 1.4 kg resulted in improvements in the proximal-to-distal sequence in
maximum linear segment velocities. Less skilled throwers were able to increase their
ball release speed as the additional upper arm mass allowed them to benefit from a
more advanced kinetic chain. In the present study, there were no changes in relative
timing of key instances of the throwing motion with changes in upper arm mass.
Even though group analysis of the ball release speed did not identify a
common optimal upper arm mass in overarm throwing, analysing the ball release
speed of each participant individually showed that some athletes can benefit from
additional upper arm mass (Figure 4-8). Eight of the thirteen participants in the
present study increased their ball release speed with additional upper arm mass.
However, the optimal upper arm mass varied between participants. These findings
confirm those of previous studies and highlight the importance of determining each
athlete’s individual optimal upper arm mass (Linthorne et al., n.d.; Chapter 3).
4.4.2. Risk of injuries
The success of any intervention is determined by the effect it has on the risk
of injuries as well as by the change in performance. Changes in throwing technique
that result in higher stresses on the joints without increasing performance are
pathomechanical changes (Fortenbaugh et al., 2009). The present study showed
that additional upper arm mass improved throwing performance in some participants,
132
but no study yet has analysed if additional upper arm mass increases the risk of
injury.
In a simplistic application of Newton’s second law of motion, an increase in
mass must be accompanied by an increase in forces and torques if the acceleration
is to remain constant. However, the kinetic chain in throwing is a complex sequence
of actions so this simple argument might not hold (Fortenbaugh et al., 2009). A
higher segment mass might not produce greater forces and torques as it might affect
the mechanical efficiency of the throw (Fortenbaugh & Fleisig, 2009). Through
proper technique, baseball pitchers have shown that they are able to reach higher
ball release speeds while also reducing the stresses on their joints (Aguinaldo et al.,
2007; Fortenbaugh & Fleisig, 2009).
Apart from higher ball release speeds, several kinetic variables have been
identified as causing overuse injuries that arise from repeated stresses on athletes’
shoulder and elbow joints. A major cause of shoulder injuries is a high compression
force acting on the shoulder joint, which reaches more than 1000 N (Dillman et al.,
1993; Werner et al., 2007). Ball velocity, maximum external shoulder rotation, elbow
flexion, shoulder internal rotation torque, and shoulder abduction torque affect the
magnitude of the shoulder compression force (Werner et al., 2001). The results of
the present study show that increasing the upper arm mass by 30% causes an
increase in shoulder compression force, thus increasing the load on the shoulder
complex and increasing the risk of injury.
High elbow valgus torques are another common cause of overuse injuries in
throwing sports (Fleisig et al., 1995; Werner et al., 2002). Maximal external shoulder
133
rotation, elbow flexion angle, and shoulder abduction angles have been identified as
affecting the generation of elbow valgus torque (Aguinaldo & Chambers, 2009;
Matsuo et al., 2002; Werner et al., 2002). In the present study, changes in upper arm
mass did not affect maximum elbow valgus torque, and so is not likely to increase
the risk of injury. Furthermore, the reduction in maximum external shoulder rotation
with 10% or 20% of additional upper arm mass by the participants in the present
study might suggest a lower risk of injury. An increase in maximum external shoulder
rotation has been identified to increase the risk of injuries (Werner et al., 2001).
The only difference in kinetic variables was observed with an additional 30%
of mass attached to the participant’s upper arm, which resulted in an increase in
shoulder compression force. As additional upper arm mass had only limited effect on
ball release speed, further research is required in order to confirm if optimising an
athlete’s upper arm mass increases the loads on the joints.
4.4.3. Limitations
Even though the present study showed that optimal upper arm mass can
potentially help athletes improve their throwing performance, several limitations
might restrict these findings from being applied to athletes. Firstly, the participants in
the present study were not highly skilled throwers and were not regularly engaged in
throwing sports. Therefore, it remains to be seen if the same outcome applies to
highly skilled athletes or if their upper arm mass is already optimised through their
training (Yamada, Yamashita, et al., 2013).
Furthermore, the simplification of the shoulder model used in the present
study might have affected both kinematic and kinetic variables of the shoulder
134
movement. However, the shoulder model used in the present study is similar to
those used by most studies analysing overhead throwing. Incorporating the motions
of the various joints of the shoulder complex into the model could improve our
understanding, especially regarding the risk of injuries (Gasparutto et al., 2015). As
the shoulder model used in the present study reported the movement at the shoulder
joint as a single glenohumeral joint, the effect that additional upper arm mass has on
the movement of the scapula and the clavicle are not known.
Additionally, the participant’s segmental inertial parameters were determined
as a percentage of the total body mass (de Leva, 1996), which was used to calculate
the additional mass that was attached to participant’s upper arm. Employing a more
accurate method to determine subject-specific segmental inertial parameters could
increase the accuracy of the masses attached to the participant’s upper arm. The
method used in the present study might have affected the participant’s optimal upper
arm mass.
4.4.4. Applications
The results of the present study confirm that athletes can improve their ball
release speed by optimising their upper arm mass. However, as the optimal upper
arm mass varies between participants, determining an athlete’s optimal upper arm
mass is important in order to maximise their performance. Furthermore, kinematic
and kinetic analysis of the throws performed with additional upper arm mass
revealed that small increases in upper arm mass do not increase the joint forces and
joint torques acting on the throwing arm, thus not increasing the risk of injuries.
However, the increase in shoulder compression force with an additional 30% of
135
mass attached to the upper arm might suggest that an upper arm mass heavier than
the optimal mass could negatively affect the risk or injury. Therefore, athletes and
coaches should determine an athlete’s optimal upper arm mass in order to maximise
the outcome.
4.4.5. Further Work
As the optimal upper arm mass varies between participants, further research
is needed in order to determine if an athlete’s optimal upper arm mass is affected by
the throwing technique employed by each individual athlete. As not every participant
in the present study benefited from a heavier upper arm mass to increase their ball
release speed, it is unknown what causes the different outcomes with additional
upper arm mass. Analysis of kinematic and kinetic variables for each participant
individually could provide further insight into how to determine an athlete’s optimal
upper arm mass.
As the throws performed in this study were neither sport-specific nor
performed by high skilled athletes, further research needs to be done in order to
determine the optimal upper arm mass for professional athletes of various sports.
Due to the differences in throwing technique used in different sports (eg. baseball,
cricket, javelin throw) the optimal upper arm mass might vary between sports or
might not be applicable to every throwing technique. In javelin throwing, athletes can
improve both their distance thrown and release velocity by optimising their upper arm
mass (Linthorne et al., n.d.), but it is unknown if baseball pitchers or cricket bowlers
could benefit from optimising their upper arm mass. Additionally, the differences in

136
the mass of the object thrown in the different sports might affect an athlete’s optimal
upper arm mass.
137
4.5. Conclusions
In sports such as baseball, cricket, or javelin throw, athletes aim to maximise
their release velocity in order to improve their performance. The results of the
present study suggest that some athletes would benefit from a heavier upper arm
mass in order to increase their ball release speed. Furthermore, in the present study
there were no clear indications that a heavier upper arm mass would negatively
affect an athlete’s risk of injury. However, as not every athlete benefits from a
heavier upper arm mass and because the optimal upper arm mass varies between
each individual athlete, coaches should be advised to determine an athlete’s optimal
upper arm mass first before attempting to increase the upper arm mass through
hypertrophy exercises.
138
Additional upper arm mass does not have
the same effect on each athlete’s throwing
mechanics.
139
5.1. Introduction
In many throwing sports, the athlete’s goal is to throw a projectile as fast or as
far as possible. Thus, in order to be successful, athletes attempt to maximise their
release velocity (Bartlett, 2000). Professional baseball pitchers are able to reach ball
release speeds of around 50 m/s through sequential proximal-to-distal movement of
their body segments (Putnam, 1993). Several studies suggest that athletes can
improve their ball release speed by increasing their upper arm mass (Kim et al.,
2008; Southard, 1998). Furthermore, in my previous studies (Chapters 3 & 4) and in
the study by Linthorne et al. (n.d.) there was an optimal upper arm mass that
resulted in the highest ball release speed or the furthest distance thrown. However,
in these studies the magnitude of the optimal upper arm mass varied between the
participants.
5.1.1. Inertial parameters in throwing
Previous studies have shown that changes in the mass of the upper arm of
the throwing arm affect the ball release speed. Southard (1998) found an increase of
around 6.4% in ball release speed for the less skilled throwers when attaching
around 1.4 kg of additional mass to the participant’s upper arm. The increase in ball
release speed was caused by an improved use of the kinetic chain, as the less
skilled participant’s upper arm movement lagged behind the trunk movement with
additional upper arm mass. The study by Kim et al. (2008) measured a slight
increase in horizontal arm swing velocity with 25% and 50% increase in upper arm
mass. Linthorne et al. (n.d.) focussed on javelin throwers and observed that the
optimal upper arm mass to achieve maximum release velocity and distance thrown is
140
greater than the athletes’ actual upper arm mass. The optimal upper arm mass in
this study depended on the participant and resulted in an average increase in throw
distance of 5.4%. These findings are similar to those obtained from the two-
dimensional throw simulations in Chapter 3, where an optimal upper arm mass
resulted in the highest ball release speed. The optimal upper arm mass in this study
was more than double the upper arm mass of an average adult male. Also, the
optimal upper arm mass was greater for throw simulations with a heavier forearm
mass, and slightly lower for throw simulations with a greater shoulder torque.
Furthermore, kinematic and kinetic analysis of throws performed with
additional upper arm mass revealed that a heavier upper arm mass has only limited
effect on the athlete’s throwing mechanics (Chapter 4). In my previous study,
maximum joint angles, joint angles at the instant of ball release, maximum joint
angular velocities, and maximum joint kinetics did not significantly change with
additional upper arm mass, except for the maximum external shoulder rotation,
maximum shoulder adduction angular velocity, and shoulder compression force.
Increasing the participant’s upper arm mass by 10% or 20% resulted in a decrease
in maximum external shoulder rotation and an increase in maximum shoulder
adduction angular velocity. An additional 30% of mass attached to the participant’s
upper arm caused a significant increase in shoulder compression force. However,
group analysis in Chapter 4 did not result in a significant increase in ball release
speed with additional upper arm mass. Nevertheless, the results of the Chapter 4
study suggest that the optimal upper arm mass varies between athletes, indicating
that each athlete should be analysed individually in order to maximise performance
without increasing the risk of injury.
141
Previous studies suggest that the optimal upper arm mass in overarm
throwing depends on the athlete’s forearm mass (Linthorne et al., n.d.; Chapter 3)
and their skill level (Southard, 1998). However, it is unclear if the effect of additional
upper arm mass on ball release speed depends on the athlete’s throwing motion.
Therefore, identifying differences in joint kinematic and kinetic variables between
athletes that benefit from additional upper arm mass and those whose ball release
speed is not affected or decreases with additional upper arm mass could provide
insight into which athletes can benefit from a heavier upper arm mass. This
information could help to determine the mechanisms that enable athletes to increase
their ball release speed with additional upper arm mass.
5.1.2. Kinematic and kinetic variables in throwing
In overhead throwing, several kinematic variables have previously been
identified to determine the ball release speed. One of the major contributors to a high
ball release speed is the internal/external shoulder rotation. A study comparing a
high velocity to a low velocity group of professional baseball pitchers recorded a
higher maximum external shoulder rotation angle for the high velocity group by 13°
on average (Matsuo et al., 2001). Similar findings were obtained in a study using
college baseball pitchers (Werner et al., 2008) and between the dominant and non-
dominant arm in recreational baseball pitchers (Gray, Watts, Debicki, & Hore, 2006).
The ability of skilled throwers to reach larger external shoulder rotation angles is
related to their lower humeral torsion, which has an impact on throwing performance
(Roach et al., 2012; Roach & Richmond, 2015b).
142
A larger external shoulder angle allows skilled throwers to store more elastic
energy in the shoulder (Roach et al., 2013) and, as a result, increase their maximum
internal shoulder angular velocity (Gray et al., 2006). Similar results were seen
between baseball pitchers of different stages of development, where college pitchers
(7430 °/s ± 1270) generated higher internal shoulder velocities compared to high
school pitchers (6820 °/s ± 1380) (Fleisig et al., 1999). The same differences were
also observed within youth baseball pitchers, where higher internal shoulder
velocities resulted in higher ball release speeds (Chen, Liu, & Yang, 2016). Studies
analysing the contributions of segment rotations towards ball release speed
confirmed these findings. Several studies identified the internal shoulder rotation to
contribute the most towards the ball release speed (Hirashima, Kudo, Watarai, et al.,
2007; Hirashima & Ohtsuki, 2008; Roach & Lieberman, 2014).
Additionally, maximum elbow extension velocity has been recognised as a
key variable in overhead throwing. Within college baseball pitchers, faster elbow
extension velocities were measured for the throws performed with higher ball release
speeds (Werner et al., 2008). Similar results were observed between pitchers
throwing with their dominant and non-dominant arm, where they did not manage to
reach the same elbow extension velocities with their non-dominant arm (Gray et al.,
2006) and between baseball pitchers of different stages of development (Chen et al.,
2016; Fleisig et al., 1999). The angular velocity of the elbow extension during the
acceleration phase proved to be one of the main contributors to ball release speed
(Hirashima et al., 2008). However, whereas the shoulder rotations are mainly
produced by the muscles that surround the shoulder joint (Hirashima et al., 2008;
Naito & Maruyama, 2008), the elbow extension is mainly created by interaction
143
torques (Hirashima et al., 2008), which are used to increase the velocity of the
thrown projectile (Gray et al., 2006; Hirashima, 2002; Hirashima et al., 2003).
5.1.3. Aims of the study
Previous studies have shown that adding mass to the upper arm can increase
throwing velocity (Kim et al., 2008; Southard, 1998) and that athletes can optimise
their upper arm mass to maximise their ball release speed or the distance thrown
(Linthorne et al., n.d.; Chapter 3). However, as not every athlete benefits from
additional mass attached to their upper arm (Southard, 1998, Chapter 4), it is unclear
if there are characteristics of an athlete’s throwing technique that determine whether
additional upper arm mass will increase the athlete’s throwing velocity. Therefore,
the main aim of the present study was to determine if the effect of additional upper
arm mass on ball release speed can be predicted by kinematic or kinetic variables of
an athlete’s throwing technique. In order to reach these aims, the present study was
divided into two parts, using both an experimental and a simulation approach. This
approach was selected in order to identify if an athlete’s optimal upper arm mass
could be determined using a simulation model and if a similar optimal upper arm
mass could be confirmed by analysing experimentally collected data from athletes
throwing a ball with additional mass attached to their upper arm..
5.1.4. Hypotheses
The hypotheses that were tested in the present study were:
The optimal upper arm mass for a participant can be predicted by performing
overarm throwing simulations using a three-dimensional upper-body model.
144
The optimal upper arm mass for a participant determined from the simulations
is similar to the optimal upper arm mass determined in a throwing experiment.
The effect of additional upper arm mass on ball release speed is caused by
differences between participants in maximum joint angles, joint angles at the
instant of ball release, maximum joint angular velocities, and maximum joint
torques.
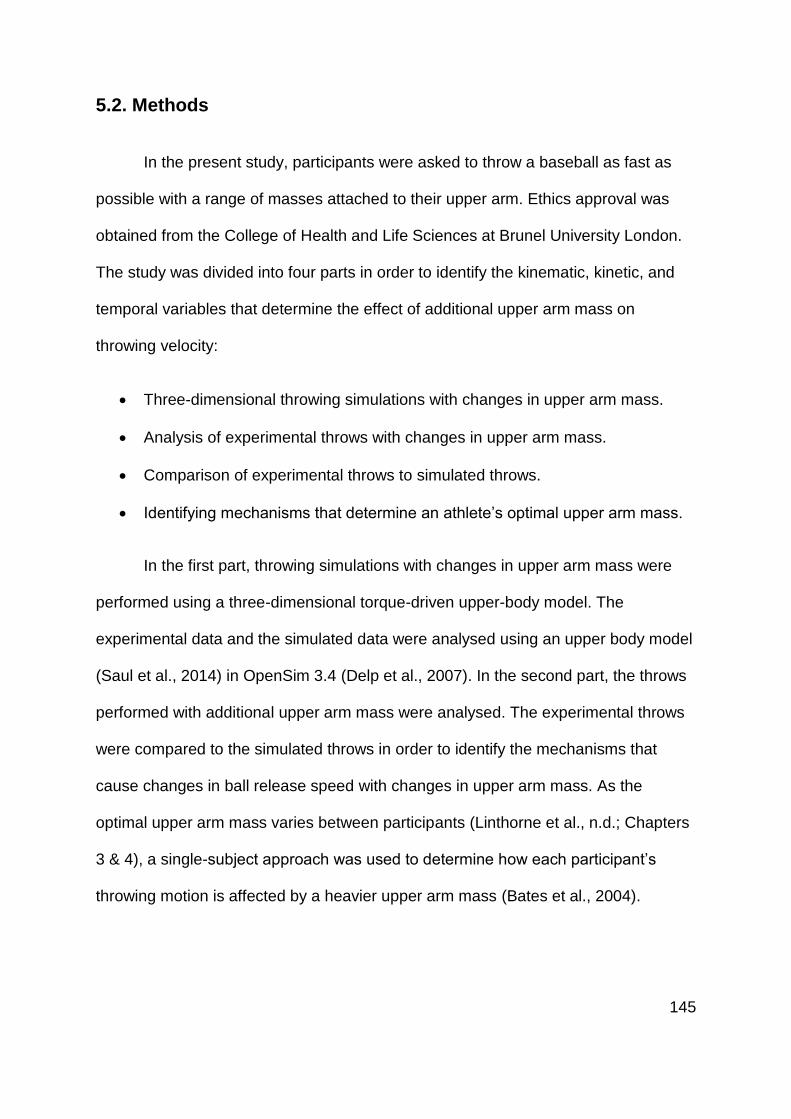
145
5.2. Methods
In the present study, participants were asked to throw a baseball as fast as
possible with a range of masses attached to their upper arm. Ethics approval was
obtained from the College of Health and Life Sciences at Brunel University London.
The study was divided into four parts in order to identify the kinematic, kinetic, and
temporal variables that determine the effect of additional upper arm mass on
throwing velocity:
Three-dimensional throwing simulations with changes in upper arm mass.
Analysis of experimental throws with changes in upper arm mass.
Comparison of experimental throws to simulated throws.
Identifying mechanisms that determine an athlete’s optimal upper arm mass.
In the first part, throwing simulations with changes in upper arm mass were
performed using a three-dimensional torque-driven upper-body model. The
experimental data and the simulated data were analysed using an upper body model
(Saul et al., 2014) in OpenSim 3.4 (Delp et al., 2007). In the second part, the throws
performed with additional upper arm mass were analysed. The experimental throws
were compared to the simulated throws in order to identify the mechanisms that
cause changes in ball release speed with changes in upper arm mass. As the
optimal upper arm mass varies between participants (Linthorne et al., n.d.; Chapters
3 & 4), a single-subject approach was used to determine how each participant’s
throwing motion is affected by a heavier upper arm mass (Bates et al., 2004).
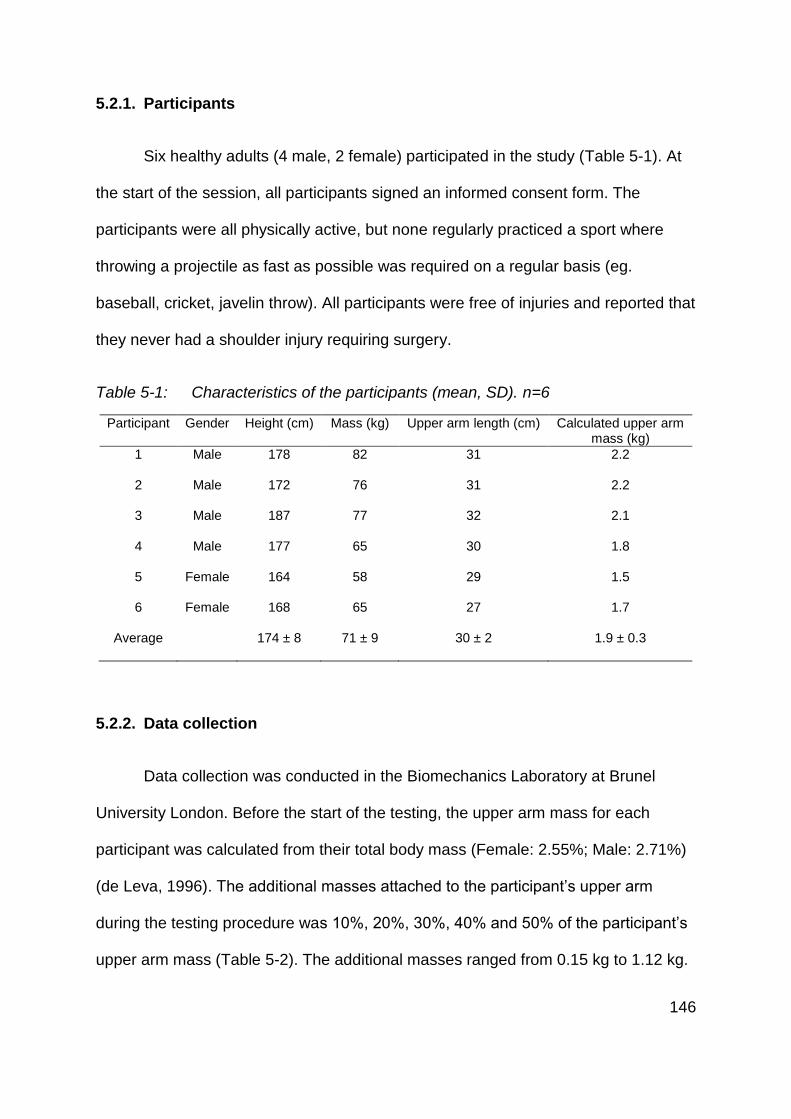
146
5.2.1. Participants
Six healthy adults (4 male, 2 female) participated in the study (Table 5-1). At
the start of the session, all participants signed an informed consent form. The
participants were all physically active, but none regularly practiced a sport where
throwing a projectile as fast as possible was required on a regular basis (eg.
baseball, cricket, javelin throw). All participants were free of injuries and reported that
they never had a shoulder injury requiring surgery.
Table 5-1: Characteristics of the participants (mean, SD). n=6
Participant Gender Height (cm) Mass (kg) Upper arm length (cm) Calculated upper arm mass (kg)
1 Male 178 82 31 2.2
2 Male 172 76 31 2.2
3 Male 187 77 32 2.1
4 Male 177 65 30 1.8
5 Female 164 58 29 1.5
6 Female 168 65 27 1.7
Average 174 ± 8 71 ± 9 30 ± 2 1.9 ± 0.3
5.2.2. Data collection
Data collection was conducted in the Biomechanics Laboratory at Brunel
University London. Before the start of the testing, the upper arm mass for each
participant was calculated from their total body mass (Female: 2.55%; Male: 2.71%)
(de Leva, 1996). The additional masses attached to the participant’s upper arm
during the testing procedure was 10%, 20%, 30%, 40% and 50% of the participant’s
upper arm mass (Table 5-2). The additional masses ranged from 0.15 kg to 1.12 kg.
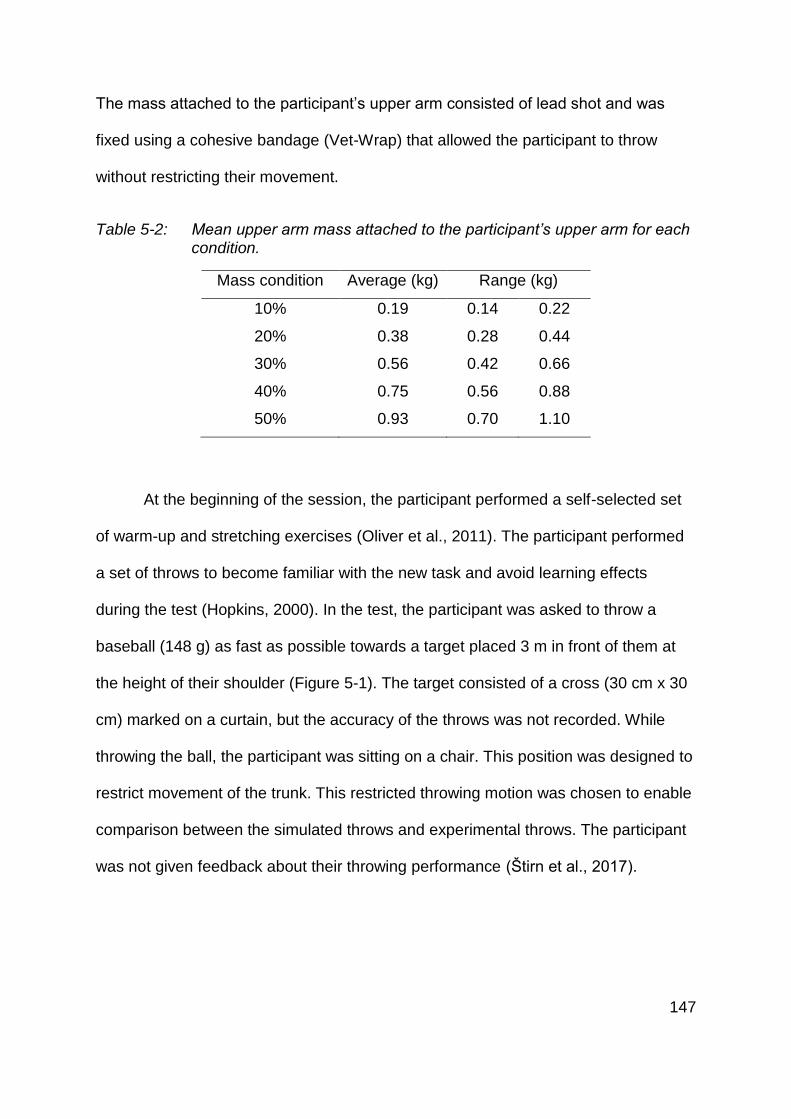
147
The mass attached to the participant’s upper arm consisted of lead shot and was
fixed using a cohesive bandage (Vet-Wrap) that allowed the participant to throw
without restricting their movement.
Table 5-2: Mean upper arm mass attached to the participant’s upper arm for each condition.
Mass condition Average (kg) Range (kg)
10% 0.19 0.14 0.22
20% 0.38 0.28 0.44
30% 0.56 0.42 0.66
40% 0.75 0.56 0.88
50% 0.93 0.70 1.10
At the beginning of the session, the participant performed a self-selected set
of warm-up and stretching exercises (Oliver et al., 2011). The participant performed
a set of throws to become familiar with the new task and avoid learning effects
during the test (Hopkins, 2000). In the test, the participant was asked to throw a
baseball (148 g) as fast as possible towards a target placed 3 m in front of them at
the height of their shoulder (Figure 5-1). The target consisted of a cross (30 cm x 30
cm) marked on a curtain, but the accuracy of the throws was not recorded. While
throwing the ball, the participant was sitting on a chair. This position was designed to
restrict movement of the trunk. This restricted throwing motion was chosen to enable
comparison between the simulated throws and experimental throws. The participant
was not given feedback about their throwing performance (Štirn et al., 2017).
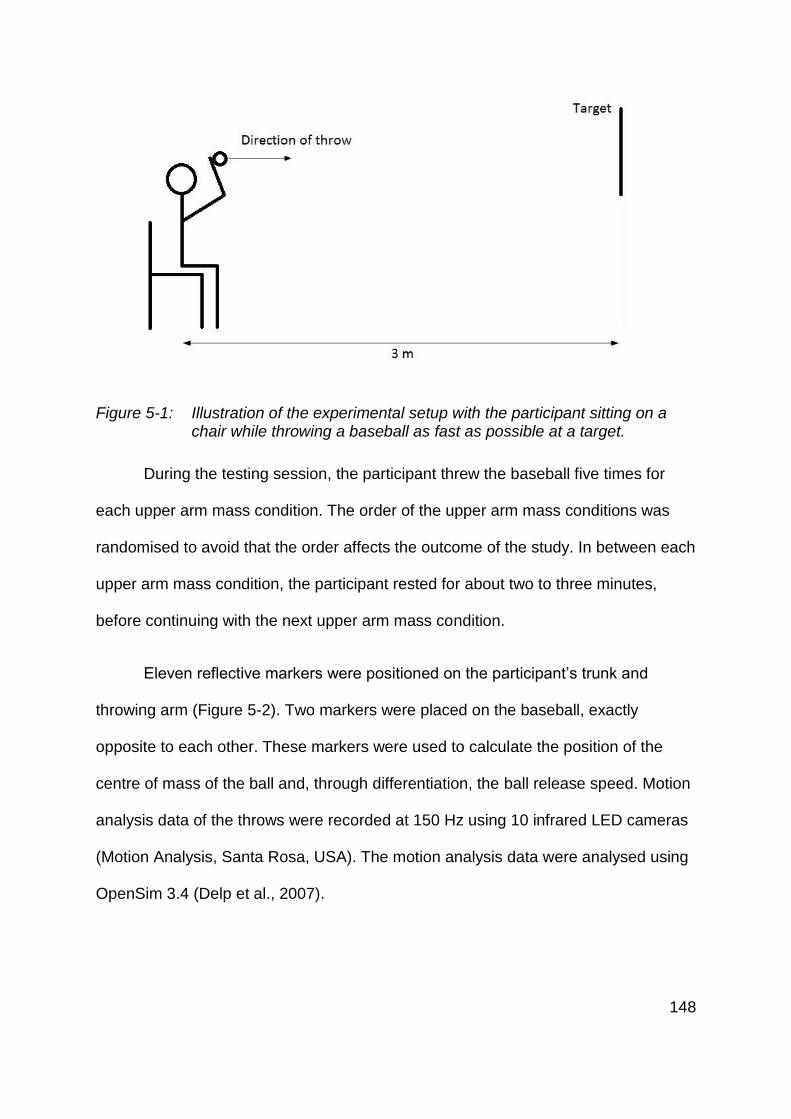
148
Figure 5-1: Illustration of the experimental setup with the participant sitting on a chair while throwing a baseball as fast as possible at a target.
During the testing session, the participant threw the baseball five times for
each upper arm mass condition. The order of the upper arm mass conditions was
randomised to avoid that the order affects the outcome of the study. In between each
upper arm mass condition, the participant rested for about two to three minutes,
before continuing with the next upper arm mass condition.
Eleven reflective markers were positioned on the participant’s trunk and
throwing arm (Figure 5-2). Two markers were placed on the baseball, exactly
opposite to each other. These markers were used to calculate the position of the
centre of mass of the ball and, through differentiation, the ball release speed. Motion
analysis data of the throws were recorded at 150 Hz using 10 infrared LED cameras
(Motion Analysis, Santa Rosa, USA). The motion analysis data were analysed using
OpenSim 3.4 (Delp et al., 2007).
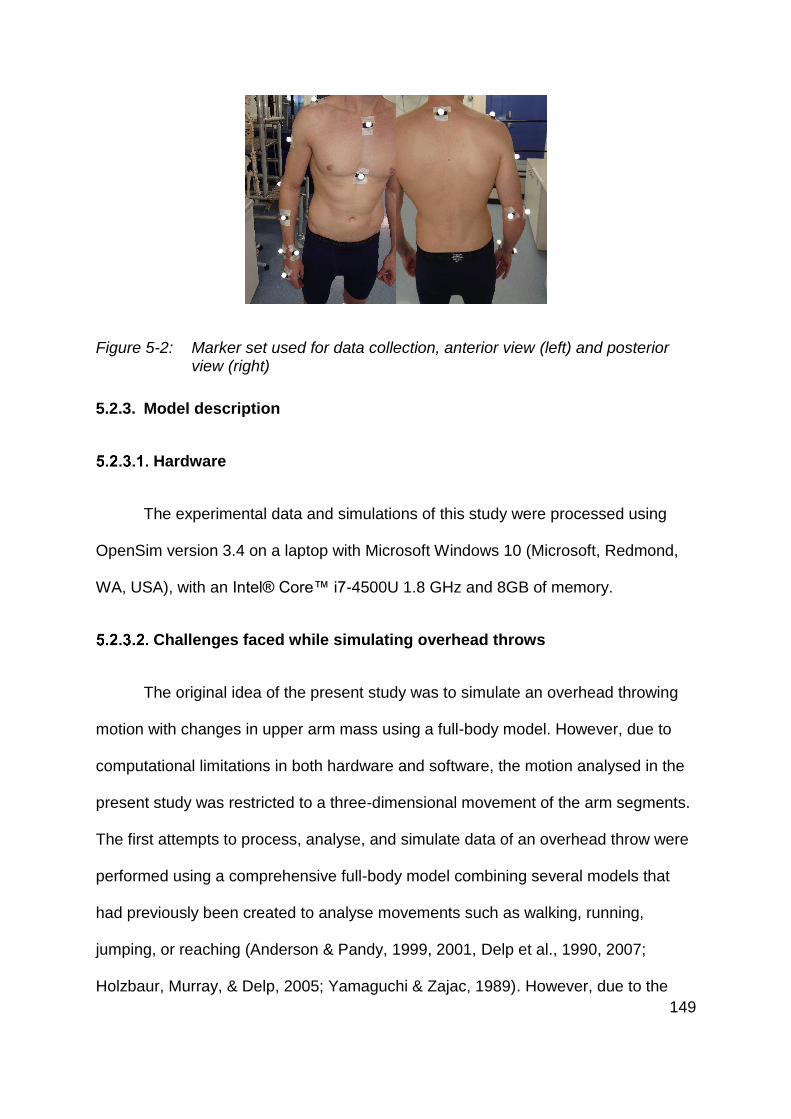
149
Figure 5-2: Marker set used for data collection, anterior view (left) and posterior view (right)
5.2.3. Model description
Hardware
The experimental data and simulations of this study were processed using
OpenSim version 3.4 on a laptop with Microsoft Windows 10 (Microsoft, Redmond,
WA, USA), with an Intel® Core™ i7-4500U 1.8 GHz and 8GB of memory.
Challenges faced while simulating overhead throws
The original idea of the present study was to simulate an overhead throwing
motion with changes in upper arm mass using a full-body model. However, due to
computational limitations in both hardware and software, the motion analysed in the
present study was restricted to a three-dimensional movement of the arm segments.
The first attempts to process, analyse, and simulate data of an overhead throw were
performed using a comprehensive full-body model combining several models that
had previously been created to analyse movements such as walking, running,
jumping, or reaching (Anderson & Pandy, 1999, 2001, Delp et al., 1990, 2007;
Holzbaur, Murray, & Delp, 2005; Yamaguchi & Zajac, 1989). However, due to the
150
constraints on the movement of the upper body, the Inverse Kinematics tool in
OpenSim 3.4 was not able to come to a solution. Removing the constraints of the
upper body and increasing the range of motion at the shoulder joint allowed the
software to find a solution for the Inverse Kinematics tool. However, due to the time
required to compute joint angles (3 to 4 hours per throw) and the inability to generate
joint torques for this model, a simpler model had to be employed.
Unfortunately, similar challenges were encountered when using a full-body
model with a simplified shoulder joint (Hamner, Seth, & Delp, 2010). This model was
initially developed to analyse running and so the shoulder movement was restricted
to the glenohumeral joint, which is a common simplification in a three-dimensional
analysis of throwing (Buffi et al., 2015; Fleisig et al., 1996; Roach et al., 2013).
However, due to the complexity of the model, Inverse Kinematics and simulations in
OpenSim 3.4 were not always able to come to a solution, or the movement diverged
from the original movement.
As all attempts to use a full-body model to simulate overhead throwing failed,
the analysis was reduced to the upper body only. An upper body model consisting of
the trunk and the right arm was used in the present study (Saul et al., 2014). The
model used was developed to simulate reaching movements and was later modified
in order to be compatible with OpenSim 3.4. The trunk movement in the reaching
simulations performed in the study by Saul et al. (2014) was restricted and attempts
to include trunk movement into the throwing simulations were unsuccessful.
Therefore, the throws analysed in the present study were restricted to the movement
of the arm segments.
151
Three-dimensional model
The upper body model used in the present study (Saul et al., 2014) is based
on a previously developed model (Holzbaur et al., 2005) and adapted to be
compatible with OpenSim versions 3.2 and later. The model described by Saul et al.
(2014) has seven degrees of freedom: shoulder horizontal adduction/abduction,
shoulder adduction/abduction, shoulder internal/external rotation, elbow
flexion/extension, pronation/supination, wrist flexion/extension, and wrist deviation.
The order of joint rotations used in the upper body model are those recommended by
the International Society of Biomechanics (Wu et al., 2005).
The inertial parameters for the humerus, radius, ulna, and hand segments of
the model are based on previous research (Blana, Hincapie, Chadwick, & Kirsch,
2008; Clauser, McConville, & Young, 1969; McConville, Churchill, Kaleps, Clauser, &
Cuzzi, 1980; Reich & Daunicht, 2000). Furthermore, the upper body model includes
fifty musculotendon actuators.
Modifications to the upper body model
To enable the upper body model to be used to analyse and simulate overhead
throwing, several parameters in the original model had to be modified. The mass of
the hand segment was increased to be equal to the mass of the hand and ball. To
increase computation efficiency and prevent the simulations from diverging, the
degrees of freedom were reduced by fixing pronation/supination, wrist
flexion/extension, and wrist deviation. As a result, the model used in the present
study had only four degrees of freedom (Figure 5-3). Previous studies have identified
that neither wrist movement nor forearm pronation/supination have a substantial
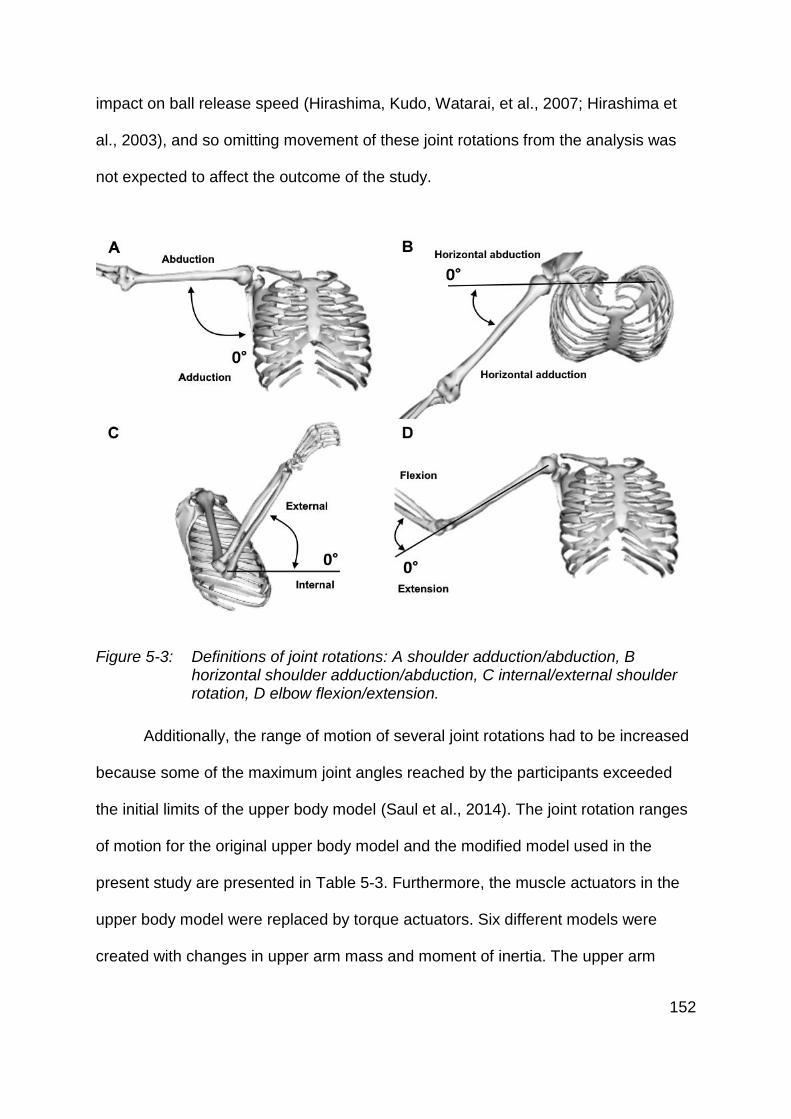
152
impact on ball release speed (Hirashima, Kudo, Watarai, et al., 2007; Hirashima et
al., 2003), and so omitting movement of these joint rotations from the analysis was
not expected to affect the outcome of the study.
Figure 5-3: Definitions of joint rotations: A shoulder adduction/abduction, B horizontal shoulder adduction/abduction, C internal/external shoulder rotation, D elbow flexion/extension.
Additionally, the range of motion of several joint rotations had to be increased
because some of the maximum joint angles reached by the participants exceeded
the initial limits of the upper body model (Saul et al., 2014). The joint rotation ranges
of motion for the original upper body model and the modified model used in the
present study are presented in Table 5-3. Furthermore, the muscle actuators in the
upper body model were replaced by torque actuators. Six different models were
created with changes in upper arm mass and moment of inertia. The upper arm
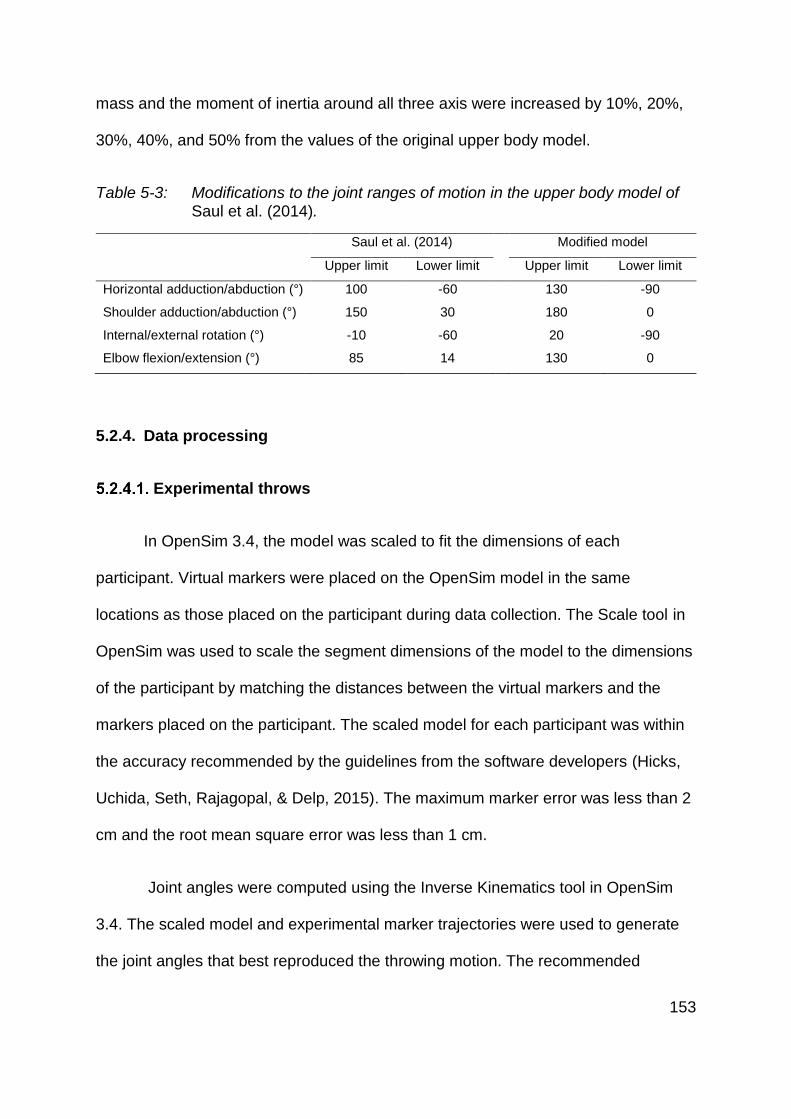
153
mass and the moment of inertia around all three axis were increased by 10%, 20%,
30%, 40%, and 50% from the values of the original upper body model.
Table 5-3: Modifications to the joint ranges of motion in the upper body model of Saul et al. (2014).
Saul et al. (2014) Modified model
Upper limit Lower limit Upper limit Lower limit
Horizontal adduction/abduction (°) 100 -60 130 -90
Shoulder adduction/abduction (°) 150 30 180 0
Internal/external rotation (°) -10 -60 20 -90
Elbow flexion/extension (°) 85 14 130 0
5.2.4. Data processing
Experimental throws
In OpenSim 3.4, the model was scaled to fit the dimensions of each
participant. Virtual markers were placed on the OpenSim model in the same
locations as those placed on the participant during data collection. The Scale tool in
OpenSim was used to scale the segment dimensions of the model to the dimensions
of the participant by matching the distances between the virtual markers and the
markers placed on the participant. The scaled model for each participant was within
the accuracy recommended by the guidelines from the software developers (Hicks,
Uchida, Seth, Rajagopal, & Delp, 2015). The maximum marker error was less than 2
cm and the root mean square error was less than 1 cm.
Joint angles were computed using the Inverse Kinematics tool in OpenSim
3.4. The scaled model and experimental marker trajectories were used to generate
the joint angles that best reproduced the throwing motion. The recommended
154
guidelines for the accuracy of the Inverse Kinematics tool were followed for every
processed throwing motion (Hicks et al., 2015); maximum marker error was less than
4 cm and root mean square error less than 2 cm. For all further analysis, the joint
angles were low-pass filtered with a cut-off frequency of 20 Hz. The cut-off frequency
was determined using residual analysis (Winter, 2009) and was the same as
previously used in a baseball pitching study (Buffi et al., 2015). The residual analysis
was performed on five randomly selected trials and five randomly selected markers
for each trial.
The Inverse Dynamics tool and Analyze tool in OpenSim 3.4 were used to
obtain joint torques, joint velocities, joint accelerations, and segment velocities. The
Inverse Dynamics tool calculates the joint torques that cause the movement
previously computed by the Inverse Kinematics tool. The Inverse Dynamics tool
solves the equations of motion taking into account the properties of the model used
and the motion analysed. In this study, the data were analysed from the instant of
maximum horizontal shoulder abduction angle to the instant of ball release (which
was taken as the instant of maximum hand velocity). For each participant, the three
fastest throws for each upper arm mass condition were chosen for further analysis.
Simulated throws
The joint torques for the three fastest throws without additional upper arm
mass by the participant were used to drive the three-dimensional throw simulations.
For each throw, six simulations were performed with 0%, 10%, 20%, 30%, 40% and
50% increase in upper arm mass, resulting in 108 simulated throws across all 6
participants (6 participants, 3 throws per participant, and 6 mass conditions). As in
155
the experimental throws, the simulated throws started at the time of minimum
horizontal adduction and ended with maximum horizontal hand velocity. Joint
kinematics were generated in order to analyse the differences between the different
upper arm mass conditions.
5.2.5. Data analysis
A single-subject analysis approach was used in the present study as previous
studies indicated that the optimal upper arm mass might be unique to the participant
(Linthorne et al., n.d.; Chapter 4).
Simulated throws
The simulated throws did not include a ball segment therefore the instant of
maximum hand velocity was taken as the instant of ball release, and the maximum
hand velocity was taken as the ball release speed. A similar approach was
previously used in a study performing three-dimensional throwing simulations to
determine the optimal shoulder abduction angle in overarm throwing (Matsuo et al.,
2002). The ball release speed for each simulated throw was plotted against the
additional upper arm mass. A straight line (𝑦 = 𝐺𝑟𝑎𝑑𝑖𝑒𝑛𝑡 ∙ 𝑥 + 𝑌𝑖𝑛𝑡𝑒𝑟𝑐𝑒𝑝𝑡) was fitted
to the data, where the gradient represented the effect of additional upper arm mass
on ball release speed.
The kinematic and kinetic variables of the simulated throws were plotted
against the rate of change in ball release speed (gradient) with increasing upper arm
mass in order to determine which variables affect the outcome of the throw
simulations. Analysing kinematic and kinetic variables in relation to the effect of
156
additional upper arm mass on ball release speed was employed to determine why
differences between the throws occurred. The changes in joint angular velocities
between the throws simulated with an increase in upper arm mass by 50% and the
throws performed without additional upper arm mass were analysed to identify how a
heavier upper arm mass affected the joint angular velocities. Additionally, the
maximum joint angles, maximum joint angular velocities, and maximum joint torques
of the throws performed without additional upper arm mass were plotted against the
rate of change in ball release speed with increasing upper arm mass in order to
identify if differences in joint kinematics or joint kinetics determine the outcome of the
simulations. The correlation coefficient (r) was calculated to determine the linear
relation between the kinematic/kinetic variables and the rate of change in ball
release speed. An r value of ± 0.7 is considered a very strong correlation, ± 0.5 a
strong correlation, ± 0.3 a moderate correlation, and ± 0.1 a weak correlation
(Cohen, 1988). As recommended by Batterham and Hopkins (2006), the 90% CI of
the correlation coefficient was calculated using the Fisher z transformation using a
spreadsheet provided by Hopkins (2007). Analysis of the simulated throws was
performed using GraphPad Prism version 7.00 (GraphPad Software, La Jolla,
California, USA).
Experimental throws
Ball release speed, kinematic variables, and kinetic variables were plotted
against the additional upper arm mass that was attached to the participant’s throwing
arm. A straight line (𝑦 = 𝐺𝑟𝑎𝑑𝑖𝑒𝑛𝑡 ∙ 𝑥 + 𝑌𝑖𝑛𝑡𝑒𝑟𝑐𝑒𝑝𝑡) and a u-shape (𝑦 = 𝑌𝑀 +
𝑐(𝑥 − 𝑋𝑀)2) were fitted to all variables for the three throws performed by the
participant in order to determine the effect of additional upper arm mass on the

157
variable. Akaike’s Information Criterion (AIC) was used to determine which of the two
models was a better fit to the data (Motulsky & Christopoulos, 2003). The AIC values
were calculated using GraphPad Prism version 7.00 (GraphPad Software, La Jolla,
California, USA) and details on how the AIC is calculated are presented in Appendix
1. In the case that the straight line was the best fit to the data, the gradient
represented the effect of additional upper arm mass and the 95% CI was used to
determine if the analysed variable was affected by changes in upper arm mass
(Motulsky, 2013). In the case that the inverted u-shape was the best fit to the
variable analysed, 𝑋𝑀 represented the participant’s optimal upper arm mass and 𝑌𝑀
was the maximum ball release speed.
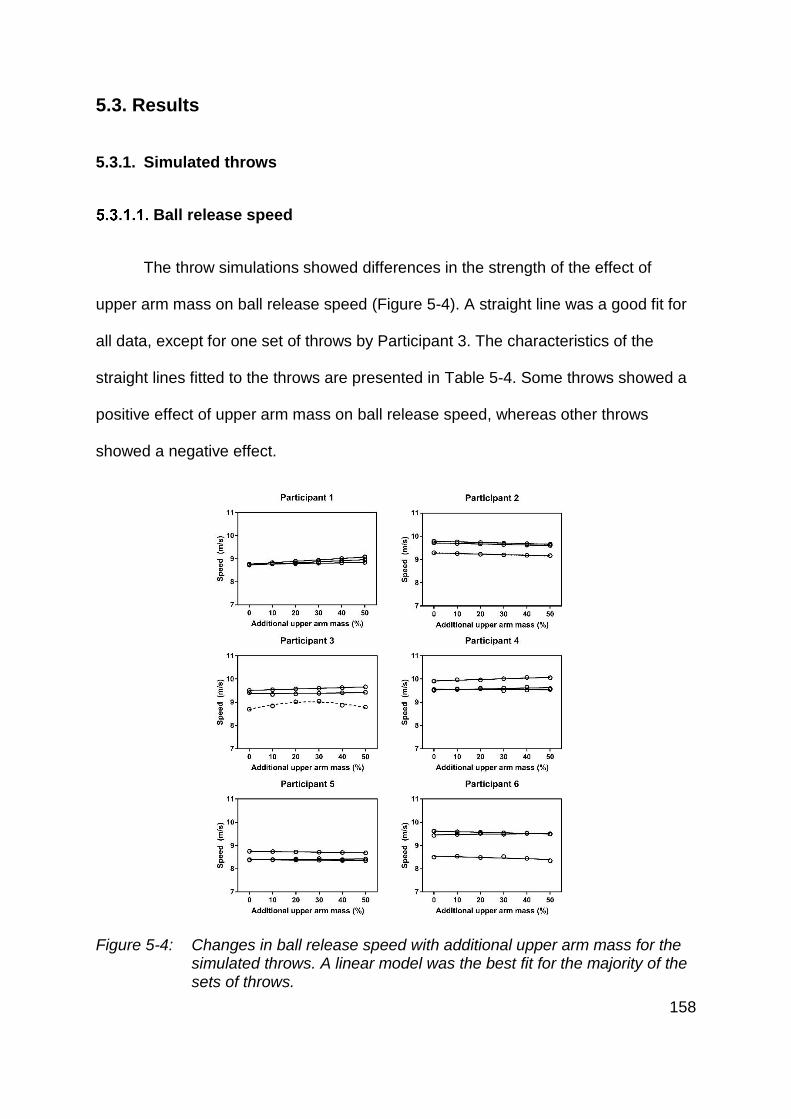
158
5.3. Results
5.3.1. Simulated throws
Ball release speed
The throw simulations showed differences in the strength of the effect of
upper arm mass on ball release speed (Figure 5-4). A straight line was a good fit for
all data, except for one set of throws by Participant 3. The characteristics of the
straight lines fitted to the throws are presented in Table 5-4. Some throws showed a
positive effect of upper arm mass on ball release speed, whereas other throws
showed a negative effect.
Figure 5-4: Changes in ball release speed with additional upper arm mass for the simulated throws. A linear model was the best fit for the majority of the sets of throws.
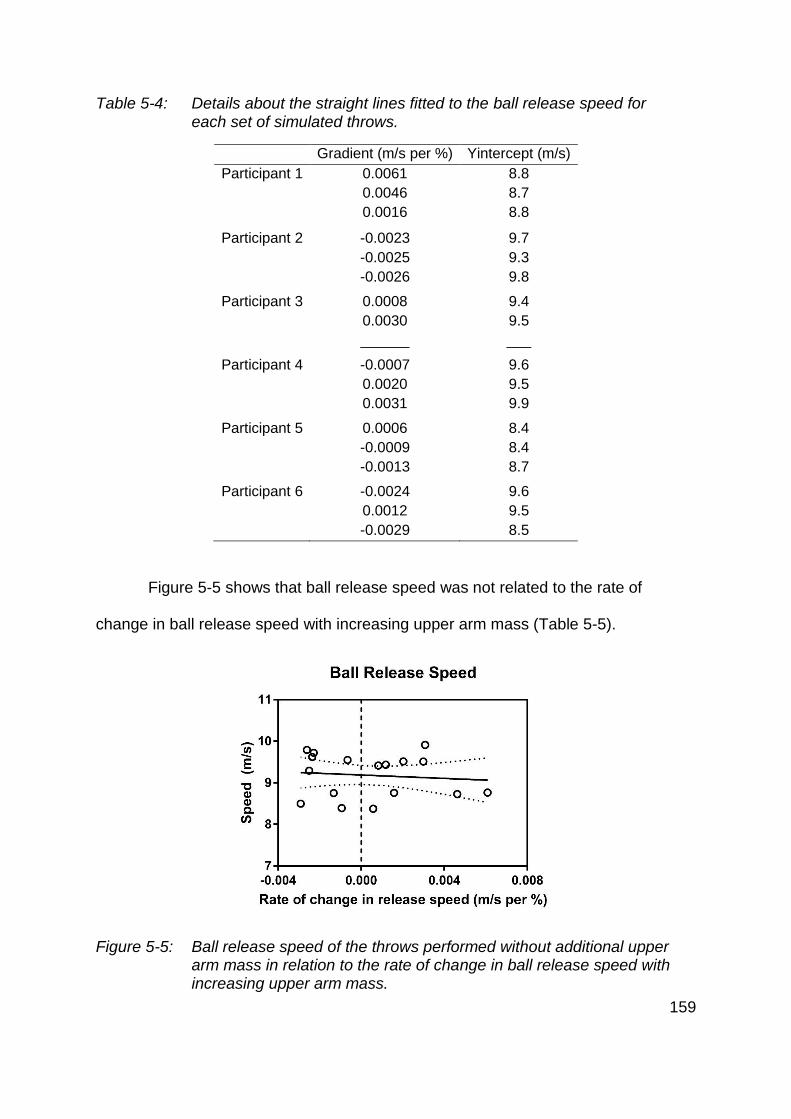
159
Table 5-4: Details about the straight lines fitted to the ball release speed for each set of simulated throws.
Gradient (m/s per %) Yintercept (m/s)
Participant 1 0.0061 8.8
0.0046 8.7
0.0016 8.8
Participant 2 -0.0023 9.7
-0.0025 9.3
-0.0026 9.8
Participant 3 0.0008 9.4
0.0030 9.5
______ ___
Participant 4 -0.0007 9.6
0.0020 9.5
0.0031 9.9
Participant 5 0.0006 8.4
-0.0009 8.4
-0.0013 8.7
Participant 6 -0.0024 9.6
0.0012 9.5
-0.0029 8.5
Figure 5-5 shows that ball release speed was not related to the rate of
change in ball release speed with increasing upper arm mass (Table 5-5).
Figure 5-5: Ball release speed of the throws performed without additional upper arm mass in relation to the rate of change in ball release speed with increasing upper arm mass.
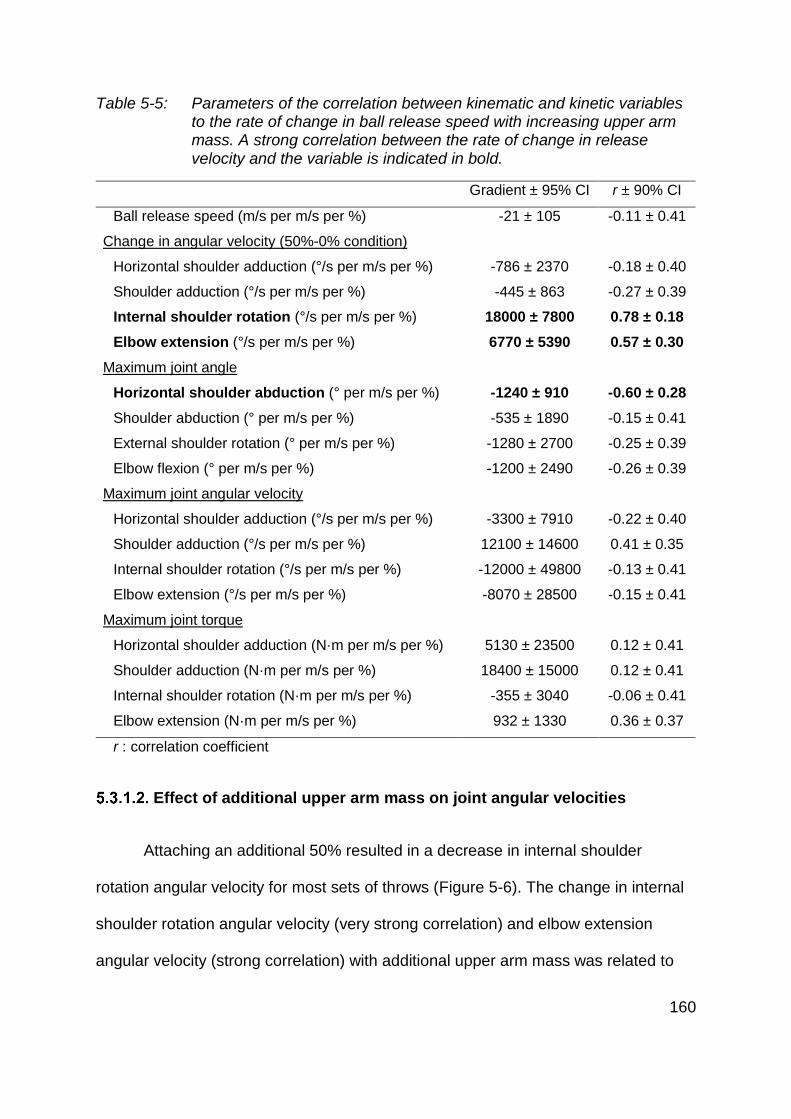
160
Table 5-5: Parameters of the correlation between kinematic and kinetic variables to the rate of change in ball release speed with increasing upper arm mass. A strong correlation between the rate of change in release velocity and the variable is indicated in bold.
Gradient ± 95% CI r ± 90% CI
Ball release speed (m/s per m/s per %) -21 ± 105 -0.11 ± 0.41
Change in angular velocity (50%-0% condition)
Horizontal shoulder adduction (°/s per m/s per %) -786 ± 2370 -0.18 ± 0.40
Shoulder adduction (°/s per m/s per %) -445 ± 863 -0.27 ± 0.39
Internal shoulder rotation (°/s per m/s per %) 18000 ± 7800 0.78 ± 0.18
Elbow extension (°/s per m/s per %) 6770 ± 5390 0.57 ± 0.30
Maximum joint angle
Horizontal shoulder abduction (° per m/s per %) -1240 ± 910 -0.60 ± 0.28
Shoulder abduction (° per m/s per %) -535 ± 1890 -0.15 ± 0.41
External shoulder rotation (° per m/s per %) -1280 ± 2700 -0.25 ± 0.39
Elbow flexion (° per m/s per %) -1200 ± 2490 -0.26 ± 0.39
Maximum joint angular velocity
Horizontal shoulder adduction (°/s per m/s per %) -3300 ± 7910 -0.22 ± 0.40
Shoulder adduction (°/s per m/s per %) 12100 ± 14600 0.41 ± 0.35
Internal shoulder rotation (°/s per m/s per %) -12000 ± 49800 -0.13 ± 0.41
Elbow extension (°/s per m/s per %) -8070 ± 28500 -0.15 ± 0.41
Maximum joint torque
Horizontal shoulder adduction (N·m per m/s per %) 5130 ± 23500 0.12 ± 0.41
Shoulder adduction (N·m per m/s per %) 18400 ± 15000 0.12 ± 0.41
Internal shoulder rotation (N·m per m/s per %) -355 ± 3040 -0.06 ± 0.41
Elbow extension (N·m per m/s per %) 932 ± 1330 0.36 ± 0.37
r : correlation coefficient
Effect of additional upper arm mass on joint angular velocities
Attaching an additional 50% resulted in a decrease in internal shoulder
rotation angular velocity for most sets of throws (Figure 5-6). The change in internal
shoulder rotation angular velocity (very strong correlation) and elbow extension
angular velocity (strong correlation) with additional upper arm mass was related to
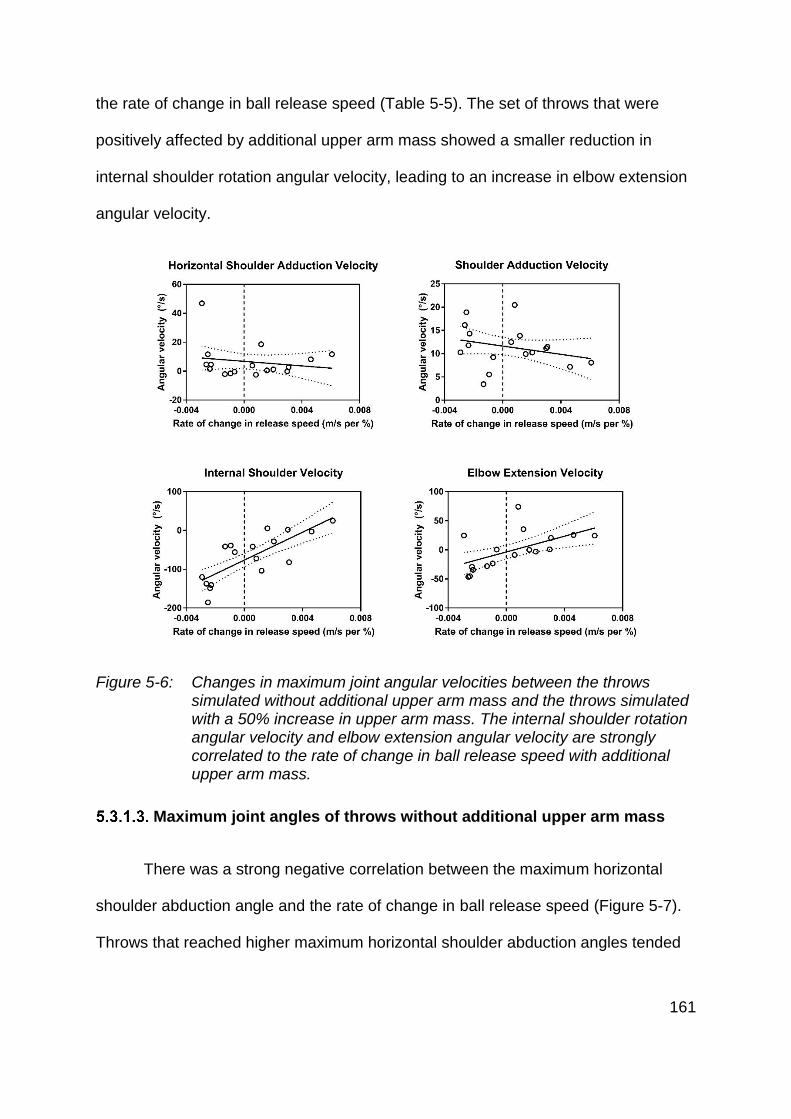
161
the rate of change in ball release speed (Table 5-5). The set of throws that were
positively affected by additional upper arm mass showed a smaller reduction in
internal shoulder rotation angular velocity, leading to an increase in elbow extension
angular velocity.
Figure 5-6: Changes in maximum joint angular velocities between the throws simulated without additional upper arm mass and the throws simulated with a 50% increase in upper arm mass. The internal shoulder rotation angular velocity and elbow extension angular velocity are strongly correlated to the rate of change in ball release speed with additional upper arm mass.
Maximum joint angles of throws without additional upper arm mass
There was a strong negative correlation between the maximum horizontal
shoulder abduction angle and the rate of change in ball release speed (Figure 5-7).
Throws that reached higher maximum horizontal shoulder abduction angles tended
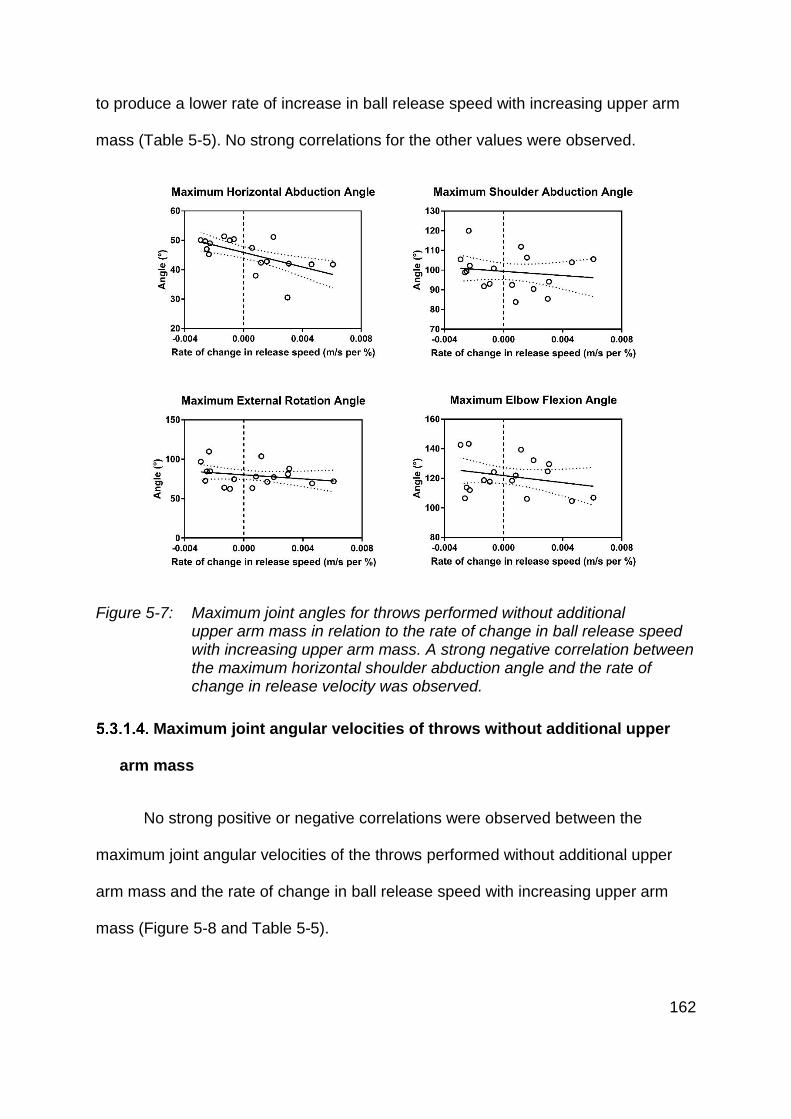
162
to produce a lower rate of increase in ball release speed with increasing upper arm
mass (Table 5-5). No strong correlations for the other values were observed.
Figure 5-7: Maximum joint angles for throws performed without additional upper arm mass in relation to the rate of change in ball release speed with increasing upper arm mass. A strong negative correlation between the maximum horizontal shoulder abduction angle and the rate of change in release velocity was observed.
Maximum joint angular velocities of throws without additional upper
arm mass
No strong positive or negative correlations were observed between the
maximum joint angular velocities of the throws performed without additional upper
arm mass and the rate of change in ball release speed with increasing upper arm
mass (Figure 5-8 and Table 5-5).
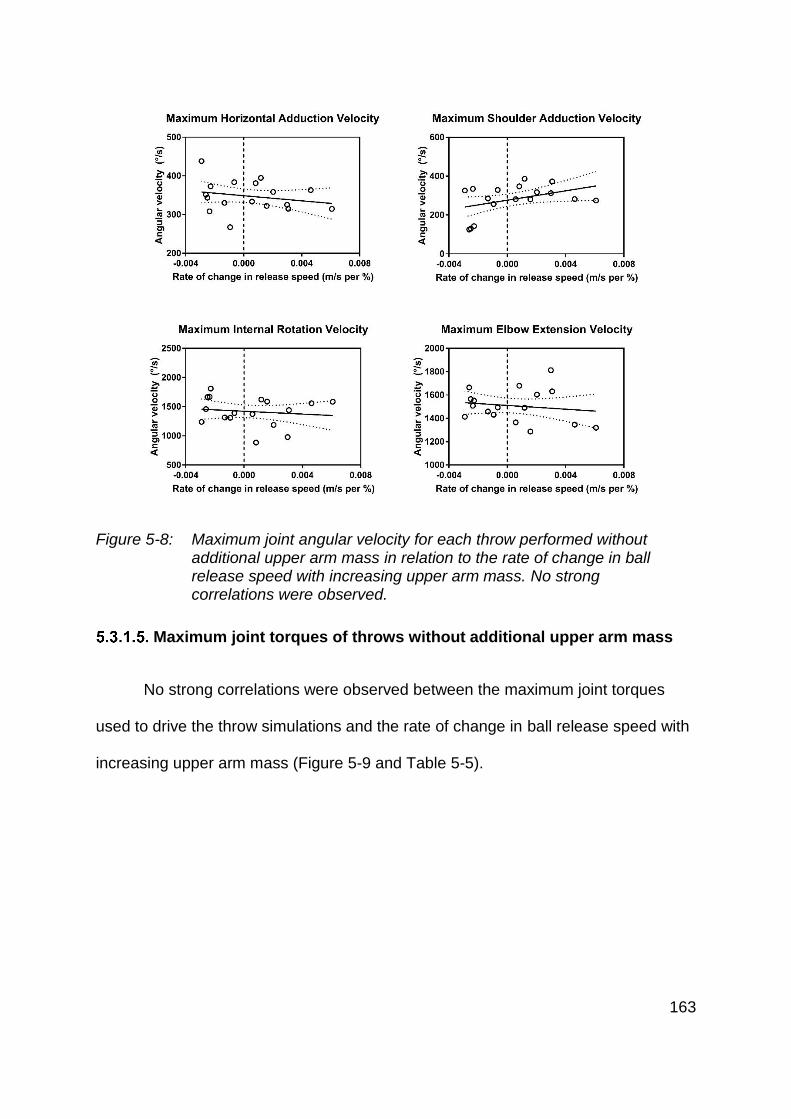
163
Figure 5-8: Maximum joint angular velocity for each throw performed without additional upper arm mass in relation to the rate of change in ball release speed with increasing upper arm mass. No strong correlations were observed.
Maximum joint torques of throws without additional upper arm mass
No strong correlations were observed between the maximum joint torques
used to drive the throw simulations and the rate of change in ball release speed with
increasing upper arm mass (Figure 5-9 and Table 5-5).
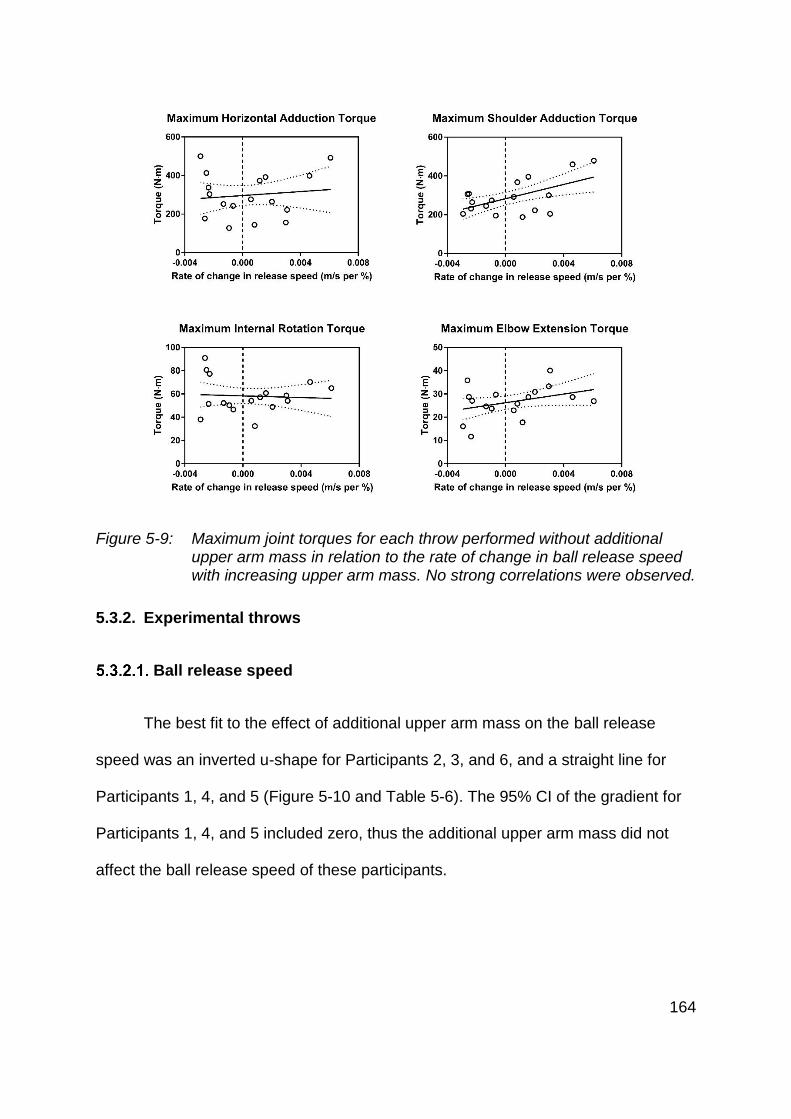
164
Figure 5-9: Maximum joint torques for each throw performed without additional upper arm mass in relation to the rate of change in ball release speed with increasing upper arm mass. No strong correlations were observed.
5.3.2. Experimental throws
Ball release speed
The best fit to the effect of additional upper arm mass on the ball release
speed was an inverted u-shape for Participants 2, 3, and 6, and a straight line for
Participants 1, 4, and 5 (Figure 5-10 and Table 5-6). The 95% CI of the gradient for
Participants 1, 4, and 5 included zero, thus the additional upper arm mass did not
affect the ball release speed of these participants.
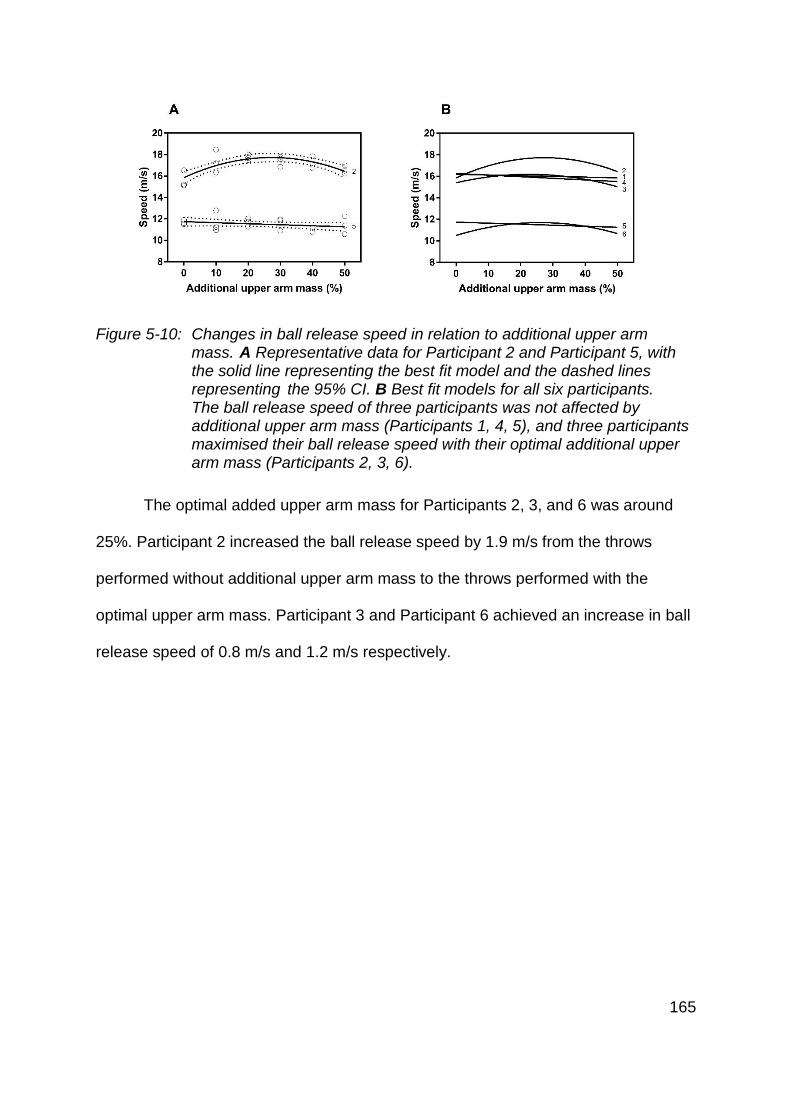
165
Figure 5-10: Changes in ball release speed in relation to additional upper arm mass. A Representative data for Participant 2 and Participant 5, with the solid line representing the best fit model and the dashed lines representing the 95% CI. B Best fit models for all six participants. The ball release speed of three participants was not affected by additional upper arm mass (Participants 1, 4, 5), and three participants maximised their ball release speed with their optimal additional upper arm mass (Participants 2, 3, 6).
The optimal added upper arm mass for Participants 2, 3, and 6 was around
25%. Participant 2 increased the ball release speed by 1.9 m/s from the throws
performed without additional upper arm mass to the throws performed with the
optimal upper arm mass. Participant 3 and Participant 6 achieved an increase in ball
release speed of 0.8 m/s and 1.2 m/s respectively.
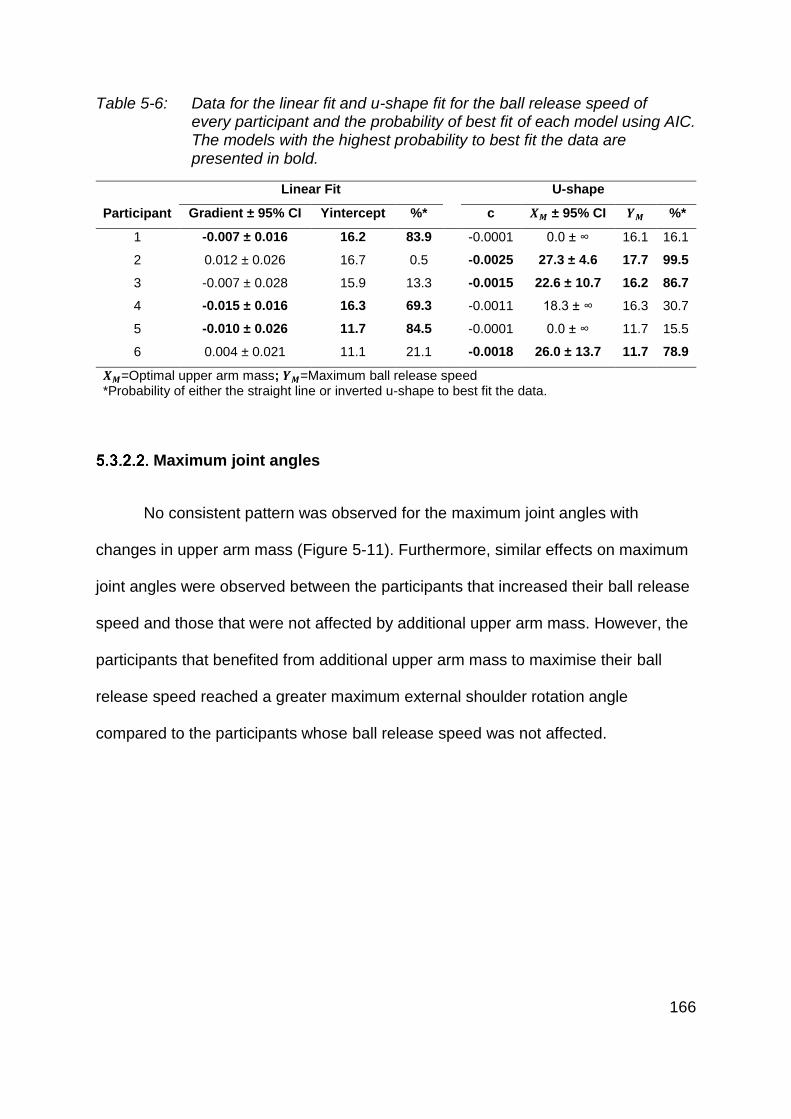
166
Table 5-6: Data for the linear fit and u-shape fit for the ball release speed of every participant and the probability of best fit of each model using AIC. The models with the highest probability to best fit the data are presented in bold.
Participant
Linear Fit U-shape
Gradient ± 95% CI Yintercept %* c 𝑿𝑴 ± 95% CI 𝒀𝑴 %*
1 -0.007 ± 0.016 16.2 83.9 -0.0001 0.0 ± ∞ 16.1 16.1
2 0.012 ± 0.026 16.7 0.5 -0.0025 27.3 ± 4.6 17.7 99.5
3 -0.007 ± 0.028 15.9 13.3 -0.0015 22.6 ± 10.7 16.2 86.7
4 -0.015 ± 0.016 16.3 69.3 -0.0011 18.3 ± ∞ 16.3 30.7
5 -0.010 ± 0.026 11.7 84.5 -0.0001 0.0 ± ∞ 11.7 15.5
6 0.004 ± 0.021 11.1 21.1 -0.0018 26.0 ± 13.7 11.7 78.9
𝑿𝑴=Optimal upper arm mass; 𝒀𝑴=Maximum ball release speed *Probability of either the straight line or inverted u-shape to best fit the data.
Maximum joint angles
No consistent pattern was observed for the maximum joint angles with
changes in upper arm mass (Figure 5-11). Furthermore, similar effects on maximum
joint angles were observed between the participants that increased their ball release
speed and those that were not affected by additional upper arm mass. However, the
participants that benefited from additional upper arm mass to maximise their ball
release speed reached a greater maximum external shoulder rotation angle
compared to the participants whose ball release speed was not affected.
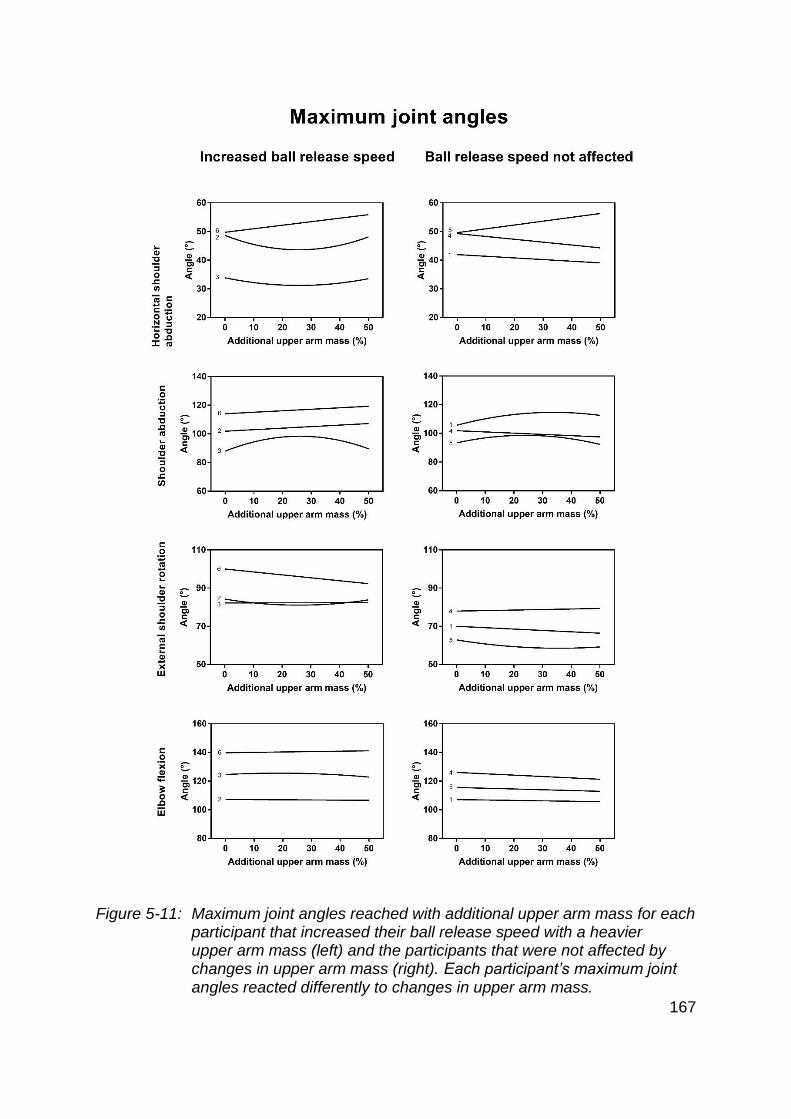
167
Figure 5-11: Maximum joint angles reached with additional upper arm mass for each participant that increased their ball release speed with a heavier upper arm mass (left) and the participants that were not affected by changes in upper arm mass (right). Each participant’s maximum joint angles reacted differently to changes in upper arm mass.
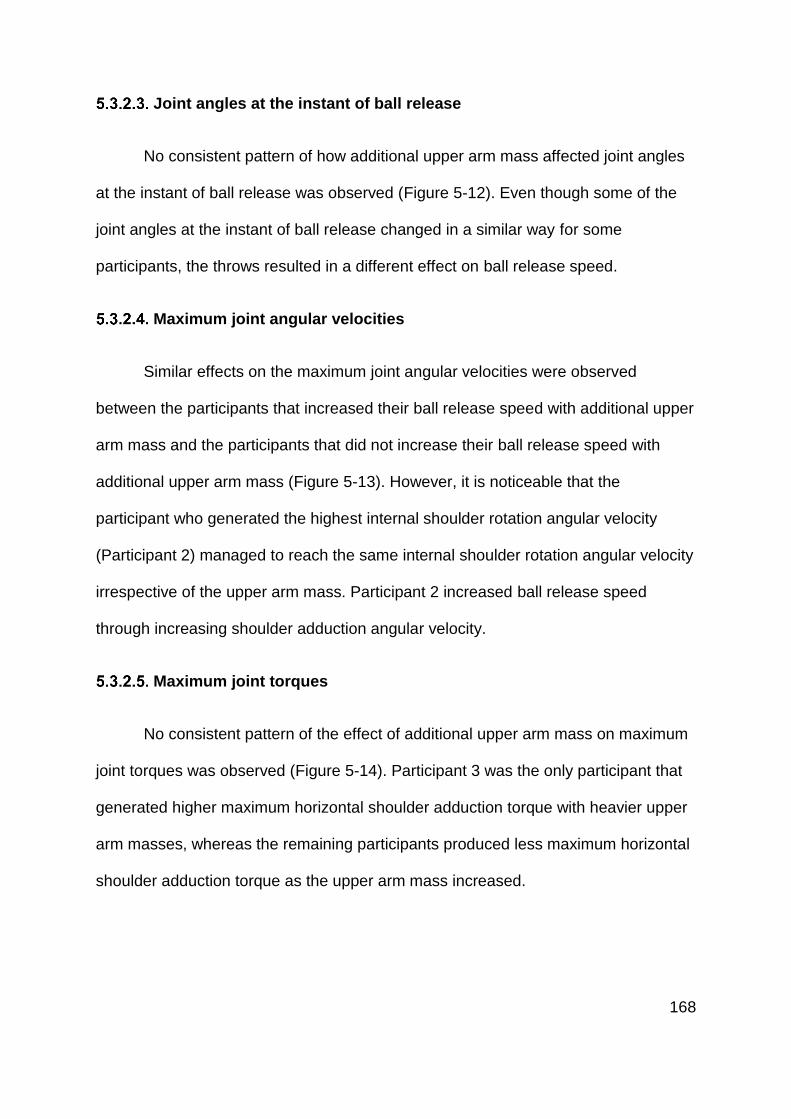
168
Joint angles at the instant of ball release
No consistent pattern of how additional upper arm mass affected joint angles
at the instant of ball release was observed (Figure 5-12). Even though some of the
joint angles at the instant of ball release changed in a similar way for some
participants, the throws resulted in a different effect on ball release speed.
Maximum joint angular velocities
Similar effects on the maximum joint angular velocities were observed
between the participants that increased their ball release speed with additional upper
arm mass and the participants that did not increase their ball release speed with
additional upper arm mass (Figure 5-13). However, it is noticeable that the
participant who generated the highest internal shoulder rotation angular velocity
(Participant 2) managed to reach the same internal shoulder rotation angular velocity
irrespective of the upper arm mass. Participant 2 increased ball release speed
through increasing shoulder adduction angular velocity.
Maximum joint torques
No consistent pattern of the effect of additional upper arm mass on maximum
joint torques was observed (Figure 5-14). Participant 3 was the only participant that
generated higher maximum horizontal shoulder adduction torque with heavier upper
arm masses, whereas the remaining participants produced less maximum horizontal
shoulder adduction torque as the upper arm mass increased.
169
Figure 5-12: Joint angles at the instant of ball release with different amounts of additional upper arm mass for the participants that benefited from additional upper arm mass (left) and those that were not affected (right). Each participant’s joint angles reacted differently to additional upper arm mass.
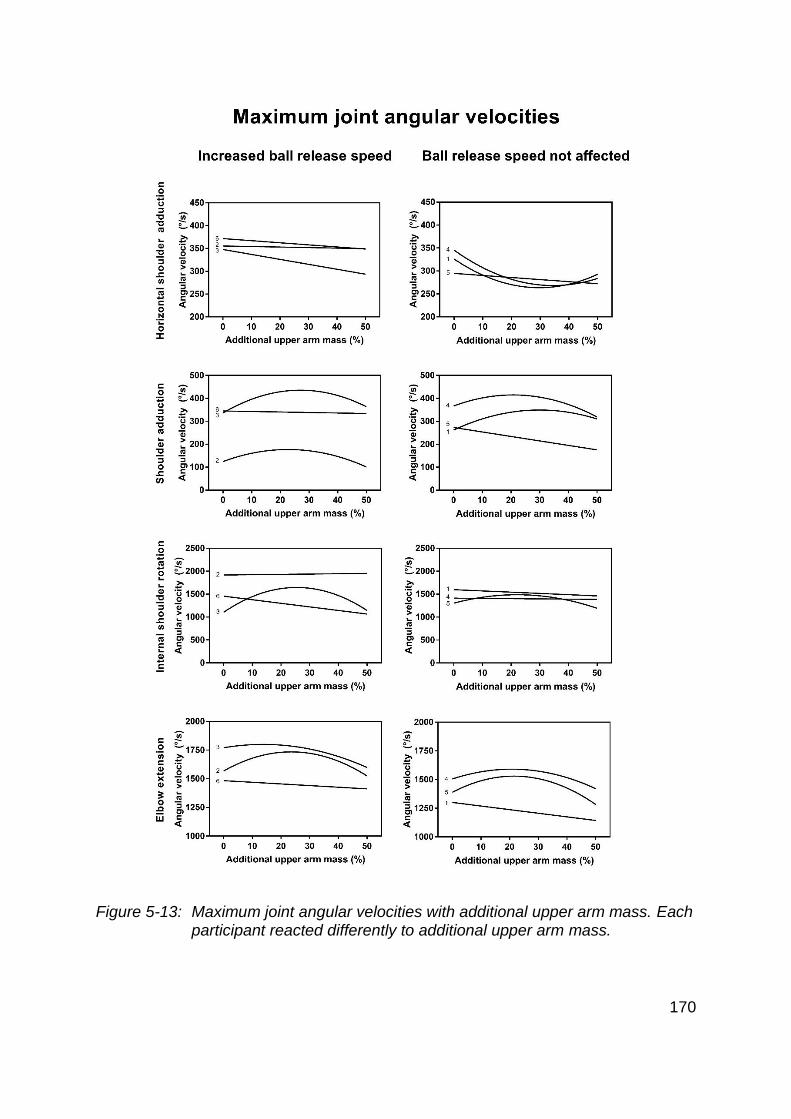
170
Figure 5-13: Maximum joint angular velocities with additional upper arm mass. Each participant reacted differently to additional upper arm mass.
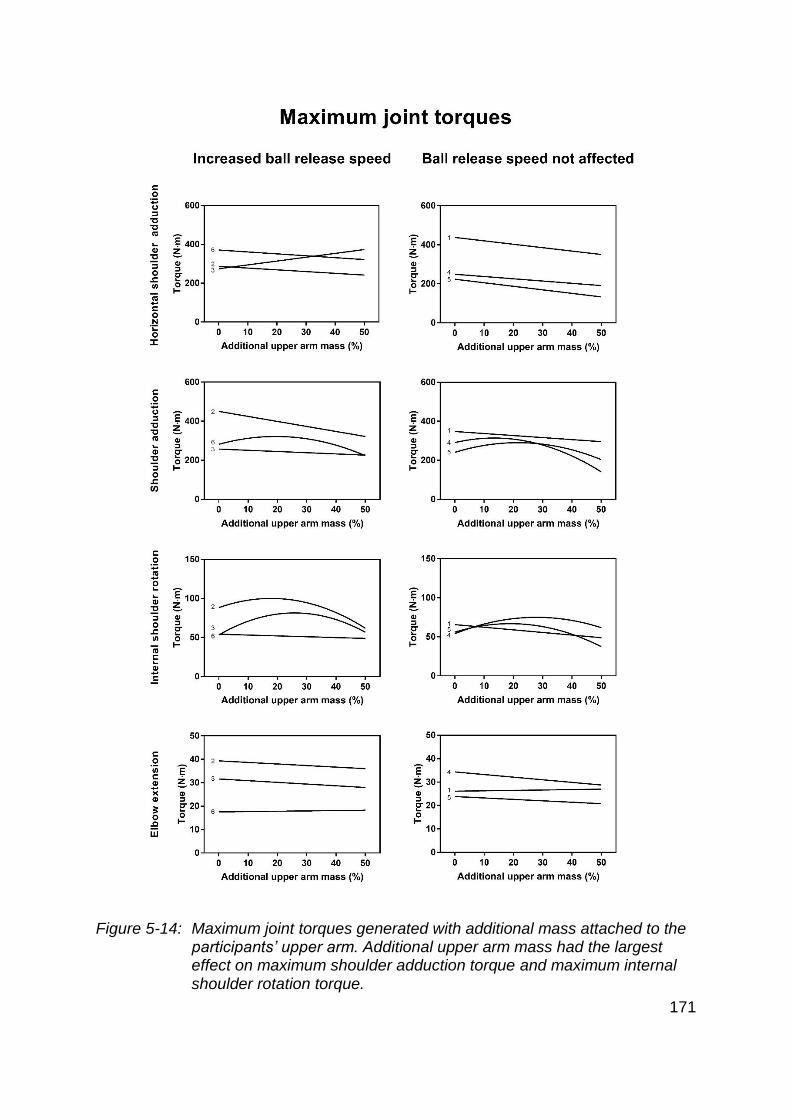
171
Figure 5-14: Maximum joint torques generated with additional mass attached to the participants’ upper arm. Additional upper arm mass had the largest effect on maximum shoulder adduction torque and maximum internal shoulder rotation torque.
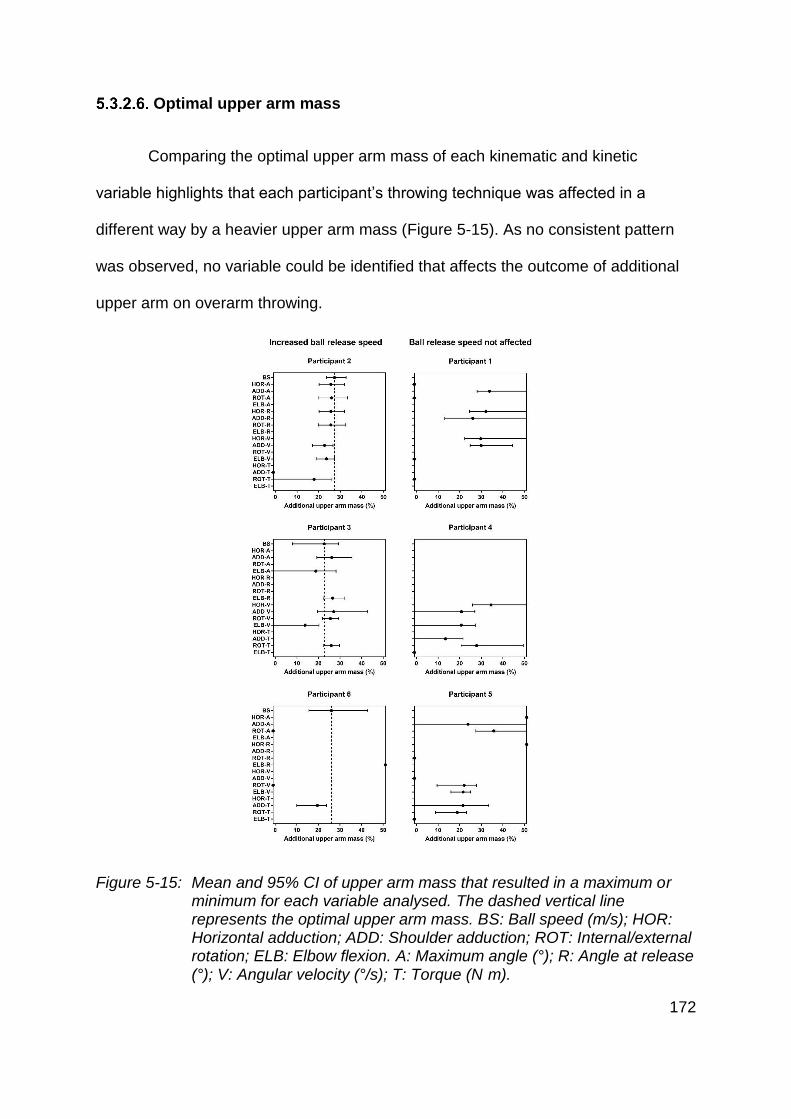
172
Optimal upper arm mass
Comparing the optimal upper arm mass of each kinematic and kinetic
variable highlights that each participant’s throwing technique was affected in a
different way by a heavier upper arm mass (Figure 5-15). As no consistent pattern
was observed, no variable could be identified that affects the outcome of additional
upper arm on overarm throwing.
Figure 5-15: Mean and 95% CI of upper arm mass that resulted in a maximum or minimum for each variable analysed. The dashed vertical line represents the optimal upper arm mass. BS: Ball speed (m/s); HOR: Horizontal adduction; ADD: Shoulder adduction; ROT: Internal/external rotation; ELB: Elbow flexion. A: Maximum angle (°); R: Angle at release (°); V: Angular velocity (°/s); T: Torque (N·m).
173
5.4. Discussion
The results of the present study suggest that not every athlete would benefit
from a heavier upper arm mass. In both the simulated throws and the experimental
throws, adding mass to the upper arm did not have a consistent effect on all six
participants. The simulated throws whose maximum internal shoulder rotation
angular velocity and maximum elbow extension angular velocity were less affected
by additional upper arm mass produced a higher ball release speed. The analysis of
kinematic and kinetic variables did not provide a clear indication about why some
participants had an optimal upper arm mass that maximised their ball release speed
and some participants did not.
In the present study, a mix of both experimental and simulation approach was
used to determine an athlete’s optimal upper arm mass that results in the highest
ball release velocity. The aim of such an approach was to provide a tool for coaches
and athletes to identify the athlete’s optimal upper arm mass. However, as there
were substantial differences between the experimental and simulation results, the
method employed in the present study might not have been adequate to reach this
aim. Therefore, further work might be required in order to improve the model used in
the present study.
5.4.1. Ball release speed
Simulated throws
The best fit model to the ball release speed of the simulated throws with
additional upper arm mass was a straight line for the majority of the throws, which
174
means that an optimal upper arm mass within the range of masses tested could not
be identified. Even though Linthorne et al. (n.d.) observed an optimal upper arm
mass while testing similar upper arm masses in a javelin throw, the results of the
simulations performed in the present study did not agree with those findings.
However, the results from the present study confirm the findings of the two-
dimensional simulations performed in my first study (Chapter 3), which suggests that
the optimal upper arm mass is heavier than the masses tested in the present study.
Furthermore, the results from the present study also agree with the findings of
Chapter 4 as the effect of additional upper arm mass varied between throws. The
differences in optimal upper arm mass between the throws performed in the present
study and in the javelin throwing study by Linthorne et al. (n.d.) might be caused by
differences in throwing technique. However, further studies are required to determine
how additional upper arm mass affects throwing performance in different sports.
The largest increase in ball release speed recorded in the present study was
0.30 m/s, and the largest decrease in ball release speed in the simulated throws was
0.15 m/s. Petersen et al. (2004) suggested that in cricket bowling the smallest
change in ball release speed that a batsman would notice is about 0.70 m/s.
Therefore, in the present study none of the simulated throws would substantially
affect the performance of a throwing athlete. However, it remains to be seen if
heavier upper arm masses would have had a larger effect on the ball release speed
of the simulated throws.
175
Experimental throws
Similar to the results obtained from the simulated throws, the participants in
the experimental throws reacted in different ways when they performed throws with
additional mass attached to their upper arm. Three out of the six participants
displayed an optimal upper arm mass that maximises their ball release speed,
whereas a heavier upper arm mass did not affect the ball release speed of the other
three participants. In the present study, the maximum increase in ball release speed
recorded with the optimal upper arm mass was 1.9 m/s. The other two participants
increased their ball release speed by 1.2 m/s and 0.8 m/s. The increase in ball
release speed by all three participants was higher than the value previously
mentioned to make a noticeable difference to the outcome in cricket fast bowling (0.7
m/s) (Petersen et al., 2004). These results confirm the findings of previous studies,
that some athletes can benefit from optimising their upper arm mass in order to
improve their throwing performance (Kim et al., 2008; Linthorne et al., n.d.; Southard,
1998; Chapter 3 & 4).
The optimal upper arm masses recorded in the present study are similar to
those found in the study by Linthorne et al. (n.d.), but considerably less than the
optimal upper arm mass found in Chapter 3. The study by Southard (1998) recorded
an increase in ball release by less skilled throwers with even heavier masses
attached to the upper arm. On average 1.4 kg was attached to the participant’s
upper arm in that study, which is higher than the heaviest mass used in the present
study (1.12 kg). The findings by Southard (1998) suggest that the optimal upper arm
mass of some athletes could be heavier than the range of masses tested in my
studies.
176
Comparison between simulated and experimental throws
The model used in the present study to simulate the effect of additional upper
arm mass on throwing performance did not predict the athlete’s optimal upper arm
mass. The experimental throws showed that some athletes could maximise their ball
release speed with optimal upper arm mass. However, not every participant that took
part in the present study benefited from a heavier upper arm mass to increase their
ball release speed. As the range of masses tested in the present study was
considerably less than the optimal upper arm mass identified in my first study
(Chapter 3), the optimal upper arm mass for some of the participants might be above
the heaviest amount tested and simulated in the present study. The outcome of both
the simulated and experimental throws highlight the challenges that athletes and
coaches face when attempting to determine an athlete’s optimal upper arm mass.
The varying results of additional upper arm mass on ball release speed in overarm
throwing between participants and between the simulation and experimental data
show that further research is required in order to determine an athlete’s optimal
upper arm mass.
5.4.2. Throwing mechanics
Simulated throws
Attaching additional mass to the upper arm had only small effects on the
participant’s ball release speed. However, analysing the changes in joint angular
velocity highlighted that increasing the upper arm mass had a negative effect on the
internal shoulder rotation angular velocity for the majority of the sets of throws. Only
three sets of throws out of the seventeen used for simulation generated higher
177
internal shoulder rotation angular velocity with a 50% increase in upper arm mass.
However, analysing the relation between the changes in internal shoulder rotation
angular velocity and the rate of change in ball release speed with increasing upper
arm mass revealed that the throws where a heavier upper arm mass had less effect
on the internal shoulder angular velocity had a greater ball release speed. This
finding might be relevant to baseball pitchers, who produce internal shoulder rotation
angular velocities of up to 10,000°/s (Werner et al., 2001) and rely on the internal
shoulder rotation to achieve a high ball release speed. Therefore, if a baseball
pitcher should attempt to optimise their upper arm mass, it is crucial that the changes
in inertial parameters do not limit their ability to generate the same values of internal
shoulder rotation angular velocity.
Further evidence of the importance of maintaining a high internal shoulder
rotation angular velocity irrespective of the upper arm mass was provided by the
differences in elbow extension angular velocity between simulated throws with a
heavier upper arm mass and throws performed without additional upper arm mass.
The throws that increased the ball release speed with additional upper arm mass did
so by increasing the elbow extension angular velocity or generating similar elbow
extension angular velocities irrespective of the upper arm mass. Hirashima et al.
(2007) showed that the elbow extension in overarm throwing is mainly produced by
interaction torques generated through the movement of the heavier proximal joints.
Therefore, retaining similar values of internal shoulder rotation angular velocity with a
heavier upper arm mass should also increase the elbow extension angular velocity.
However, it has to be noted that one outlier occurred that had a substantial increase
in elbow extension angular velocity, even though the ball release speed of that throw
178
decreased. Further analysis is required to determine why the ball release speed in
that throw was negatively affected.
The effect that additional upper arm mass has on the shoulder rotation
angular velocities suggests that the throws that generated similar values of
maximum shoulder angular velocities had an increase in elbow extension angular
velocity and an increase in ball release speed. Thus, the results suggest that
athletes could benefit from optimising their upper arm mass as long as they are able
to generate the same amount of shoulder angular velocity. Through increasing the
upper arm mass, athletes could improve the efficiency of transfer of energy between
the upper arm and forearm, resulting in a higher ball release speed. Further analysis
focussing on the changes of interaction torques with increasing upper arm mass
could provide vital information about how inertial parameters of a body segment
affect the movement and position of the other segments in overarm throwing.
Throws performed with a greater maximum horizontal shoulder abduction
angle were negatively affected by increasing upper arm mass. The remaining
kinematic and kinetic variables were similar between the throws, irrespective of the
rate of change in ball release speed with increasing upper arm mass. These results
highlight that small differences in throwing technique between participants or within a
participant can change the effect of additional upper arm mass on ball release
speed, which makes it difficult to determine an athlete’s optimal upper arm mass.
Thus, athletes should only optimise their upper arm mass if they are able to
consistently reach higher ball release speeds with a heavier upper arm mass.
Therefore, further analysis is required to analyse the effect of additional upper arm
179
mass on highly skilled throwers, and preferably under similar conditions to
competition.
Experimental throws
Kinematic and kinetic analysis of the throws performed with changes in upper
arm mass did not reveal a consistent pattern of how upper arm mass affects an
athlete’s throwing mechanics. In overarm throwing the position and the movement of
one segment is determined by the joint torques and by the position and the
movement of other joints (Hirashima et al., 2008) and so changes in upper arm mass
could affect each throw in a different way. Therefore, the results of the present study
suggest that before coaches attempt to optimise an athlete’s upper arm mass, it has
to be ensured that the change results in a substantial increase in ball release speed
and that the throws performed with a heavier upper arm mass do not result in higher
loads on the shoulder joint or elbow joint (Chapter 4).
Mechanisms that affect an athlete’s optimal upper arm mass
The results of the present study did not identify the kinematic or kinetic
variables in an athlete’s throwing technique that predict if an athlete could benefit
from a heavier upper arm mass. Even though the results of the simulated throws
suggested that throwers that reduced the maximum horizontal shoulder abduction
angle could benefit from additional upper arm mass, no such evidence was observed
during the throwing experiment. Furthermore, the results of the simulations highlight
that athletes than can maintain the same level of shoulder angular velocity with a
heavier upper arm mass were able to benefit from an increase in angular velocity at
the distal segments through a more efficient transfer of energy (Fortenbaugh &
180
Fleisig, 2009). However, no such evidence was observed in the present study for
throws performed with additional upper arm mass, as a similar effect on both
shoulder and elbow angular velocities were recorded between the participants,
irrespective of their performance.
5.4.3. Limitations
The participants in the present study were not highly skilled athletes and were
asked to perform an unusual throwing motion. It remains to be seen if the same
outcomes will be observed with highly skilled throwers. Therefore, due to the lack of
throwing experience of the participants in the present study, the findings might not
apply to athletes from any specific sport.
The present study did not analyse the effect that additional upper arm mass
has on the accuracy of a throw. In some throwing sports, accuracy is crucial for
performance as the athletes have to aim towards a target (Freeston et al., 2015;
Freeston & Rooney, 2014; Hore, Watts, Martin, & Miller, 1995) or release the
projectile at the optimal release angle in order to maximise the distance thrown
(Linthorne, 2001; Linthorne & Everett, 2006; Linthorne & Stokes, 2014).
Furthermore, as the timing of ball release can also affect the ball release speed,
especially in unskilled throwers (Jegede, Watts, Stitt, & Hore, 2005), future research
should record the athlete’s ability to accurately release the projectile when analysing
the effect of additional upper arm mass on throwing performance.
Another limitation of the present study was the lack of subject-specific
segmental inertial parameters to determine the participant’s upper arm mass. Future
studies that attempt to determine an athlete’s optimal upper arm mass should use a
181
more accurate method to determine the participant’s upper arm mass, which would
affect the optimal upper arm mass as well as the computer models used to analyse
and simulate the movement.
5.4.4. Applications
The results of the present study did not identify kinematic or kinetic
characteristics that determine how additional upper arm mass affects an athlete’s
throwing performance. However, the present study is further evidence that some
athletes could benefit from increasing their upper arm in order to reach higher ball
release speeds (Kim et al., 2008; Linthorne et al., n.d.; Southard, 1998; Chapter 3 &
4). Furthermore, the results of the simulations suggest that if athletes are able to
maintain or even increase their internal shoulder angular velocity with a heavier
upper arm mass they are more likely to reach higher ball release speeds. Therefore,
an athlete’s throwing mechanics with additional upper arm mass should be analysed
first before attempting to increase an athlete’s upper arm muscle mass in order to
maximise performance without increasing the risk of injuries (Fortenbaugh et al.,
2009).
5.4.5. Further work
The results of the throw simulations provided some evidence that the throws
that resulted in a higher ball release speed with additional upper arm mass benefited
from the increase in angular momentum due to the heavier mass and as a result
affected the elbow extension angular velocity. However, further analysis is required
to identify how a heavier upper arm mass affects the movement of the distal
segments, for example through the analysis of interaction torques (Hirashima, Kudo,
182
& Ohtsuki, 2007; Hirashima, Kudo, Watarai, et al., 2007). As the present study did
not identify a kinematic or kinetic variable that determines the effect of additional
upper arm mass on ball release speed, analysing how one segment determines the
movement of another segment could help to explain why certain participants
increase their ball release speed and some do not.
Furthermore, as the participants in the present study did not participate in a
sport that requires throwing on a regular basis, the findings cannot be applied to
highly skilled throwers. Further work is required to analyse the effect of additional
upper arm mass on highly skilled athletes of various sports throwing projectiles of
various masses. Linthorne et al. (n.d.) observed an optimal upper arm mass in a
javelin throw, but further research is required to determine if the same principle can
be applied in sports such as baseball, cricket, or handball. Furthermore, different
throwing techniques within a sport could be analysed in order to determine which
athletes can benefit from optimising their upper arm mass (Fleisig et al., 2006;
Wagner et al., 2010). Southard (1998) suggested that skilled throwers might not
benefit from additional upper arm mass. Furthermore, the higher upper arm muscle
volume in baseball pitcher’s dominant upper arm might indicate that highly skilled
throwers have reached their optimal upper arm mass already (Yamada, Yamashita,
et al., 2013; Yamada, Masuo, et al., 2013).
Future studies should also include throwing accuracy when analysing the
effect of additional upper arm mass on throwing performance. As the accuracy of ball
release can affect the ball release speed of less skilled throwers (Jegede et al.,
2005), further research is required in order to determine if an athlete’s accuracy of
ball release is affected by a heavier upper arm mass. As the central nervous system

183
is able to compensate for changes occurring during overarm throwing in order to
control ball release (Hore et al., 2001), it remains to be seen if the central nervous
system compensates for changes in inertial parameters so as to retain the accuracy
of ball release.
184
5.5. Conclusions
The present study is further evidence that some athletes could benefit from a
heavier upper arm mass in order to maximise their ball release speed. However, as
previous studies already identified, this might not be the case for every athlete
involved in a throwing sport (Southard, 1998; Chapter 4). The methods used in the
present study did not allow me to accurately predict the effect of additional upper
arm mass on the ball release speed of the participants, but the throw simulations
provided some insight into the importance of maintaining a high shoulder angular
velocity in order to increase ball release speed with a heavier upper arm mass. Thus,
athletes whose shoulder angular velocities are not affected by additional upper arm
mass should be able to benefit from a heavier upper arm mass. Furthermore, the
results of the throwing experiment highlight that there is no consistent pattern of how
additional upper arm mass affects an athlete’s throwing mechanics, which further
supports previous findings that each athlete’s individual optimal upper arm mass
would have to be determine in order to maximise ball release speed (Linthorne et al.,
n.d.; Chapter 3 & 4).

185
General Discussion
186
In sports that involve throwing a projectile (such as baseball, cricket, and
some of the field events in athletics), the aim is to throw either as fast or as far as
possible. Therefore, increasing the release velocity of the projectile is the main
interest of athletes as this variable has the greatest effect on throwing performance
(Linthorne & Stokes, 2014). Most research in the biomechanics of throwing has
focused on describing the throwing motion (Dillman et al., 1993; Werner et al., 1993),
identifying variables that allow athletes to throw faster (Gray et al., 2006; Kageyama
et al., 2015; Matsuo et al., 2001; Werner et al., 2008) or analysing different training
programs (DeRenne, Ho, & Murphy, 2001; Marques et al., 2012; van den Tillaar,
2004). The effect that changes in arm segment masses have on ball release speed
in overarm throwing has not attracted much interest from researchers so far.
The results from a few studies suggest that athletes can benefit from
increasing the mass of their upper arm to achieve a higher ball release speed (Kim
et al., 2008; Linthorne et al., n.d.; Southard, 1998). These findings imply that there is
an optimal upper arm mass that results in the best throwing performance, as has
been shown in a modified javelin throw (Linthorne et al., n.d.). However, no previous
study has determined the optimal upper arm mass that produces the highest ball
release speed. Also, the effect of additional upper arm mass on joint kinematic
variables and joint kinetic variables is still not known, and thus it remains to be seen
if a heavier upper arm mass causes kinematic changes that increase the risk of
injuries.
Therefore, the main aim of this series of studies was to determine the optimal
combination of arm segment masses that result in the highest ball release speed in
overarm throwing. Even though previous studies have shown that a heavier upper
187
arm mass can result in a higher ball release speed (Kim et al., 2008; Linthorne et al.,
n.d.; Southard, 1998), none of these studies identified how changes in upper arm
mass affect joint kinematics and joint kinetics. Therefore, analysis of the throwing
motion could provide vital information about how a heavier upper arm mass affects
throwing performance and throwing mechanics.
6.1. Summary of main findings
6.1.1. Chapter 3
In the first study, a two-dimensional computer simulation model was to
determine the optimal arm segment masses that maximises ball release speed. The
results of the simulations showed that there is an optimal upper arm mass. However,
this optimum depends on the forearm mass and on the shoulder torque used to drive
the model. As the forearm mass in the simulation model was increased, the optimum
upper arm mass also increased. Changing the forearm mass showed that the lower
the forearm mass the higher the ball release speed. Furthermore, increasing the
shoulder torque produced a higher ball release speed and a slightly lower optimal
upper arm mass.
These findings suggest that athletes could benefit from optimising their upper
arm mass in order to maximise their ball release speed. Furthermore, if athletes are
able to keep their forearm mass as low as possible and increase their shoulder
torque, their optimal upper arm mass should be lower, thus making it easier for them
to reach their optimal upper arm mass through hypertrophy exercise. Even though
the optimal segment masses identified by the two-dimensional throwing model are
not realistic for athletes to achieve (forearm: 0.5 kg or even lower; upper arm: more
188
than double the mass of an average adult male), this study provides some vital
information about how the upper arm mass and forearm mass affect ball release
speed. Furthermore, these findings were a first step towards determining the optimal
upper arm mass in overarm throwing that produces the highest ball release speed.
6.1.2. Chapter 4
The second study analysed the changes in joint kinematic, joint kinetic, and
temporal variables with additional mass attached to the participant’s upper arm. The
aim of this study was to determine how heavier upper arm masses affect throwing
mechanics and the risk of injury. Even though the majority of participants showed a
clear optimal upper arm mass if analysed individually, no common optimal upper arm
mass could be determined. The optimum upper arm mass varied between
participants, ranging from 7.2% to 26.9% increase in upper arm mass, and resulted
in an increase in ball release speed that ranged from 0.04 m/s to 2.40 m/s.
Analysis of changes in throwing mechanics with additional upper arm mass
revealed that most variables did not change much between the different mass
conditions. The only variables that were affected were the maximum external
shoulder rotation angle, maximum shoulder adduction angular velocity and maximum
shoulder compression force. All remaining variables were not substantially different
between the mass conditions. These results showed that increasing the upper arm
mass does not substantially change the athlete’s throwing mechanics, and, as a
consequence, does not increase the risk of injuries in overarm throwing. The findings
of this study highlight that the concept of optimising an athlete’s upper arm mass
could be used in throwing sports.
189
6.1.3. Chapter 5
The main aim of the third study was to predict the participant’s optimal upper
arm mass and to identify the joint kinematic variables and joint kinetic variables that
determine the athlete’s optimal upper arm mass. This study was divided into two
parts. First, a three-dimensional model of the arm segments was used to simulate
the effect of changes in upper arm mass, driven by joint torque profiles recorded
from the participants. In the second part, the simulated throws were compared to
throws performed by the participants with a series of masses attached to their upper
arm mass.
Even though the ball release of the simulated throws varied compared to the
throws recorded in the throwing experiment, both methods confirmed that a heavier
upper arm does not necessarily result in a higher ball release speed. Whereas some
participants showed a clear optimal upper arm mass (ranging from 22.6% to 27.3%
of additional mass attached to the participant’s upper arm), only small variations in
ball release speed were observed in the simulated throws as the upper arm mass
was increased. The participants that benefited from optimising their upper arm mass
increased their ball release speed by about 1.3 m/s, which is an increase by about
9.5% from the throws performed without additional upper arm mass.
Analysis of changes in joint angular velocities of the throws simulated with
additional upper arm mass revealed that athletes could benefit from a heavier upper
arm as long as the changes in inertial parameters do not restrict their ability to
generate a high internal shoulder rotation angular velocity. Reductions in internal
shoulder rotation angular velocities with heavier upper arm mass caused a decrease
190
in elbow extension angular velocity and a lower ball release speed. Furthermore, the
throws whose internal shoulder rotation angular velocity was less effected had an
increase in elbow extension angular velocity and a higher ball release speed. These
findings suggest that a heavier upper arm optimised the transfer of angular
momentum between the body segments. However, this study could not identify any
common kinematic or kinetic characteristics of an athlete’s throwing mechanics that
could allow athletes to determine if they would benefit from a higher optimal upper
arm mass.
6.2. Limitations
A limitation of the current project was the skill level of the participants. Due to
limited access to highly skilled throwers, all participants were physically active adults
who were free of shoulder injuries and did not regularly participate in any sporting
activity that required them to throw a projectile at maximum velocity. Therefore, the
findings of this project cannot be applied to highly skilled throwers and further
research is required to determine if highly skilled throwers react in the same way as
was observed in these studies. Furthermore, the throws analysed in this project were
not sport-specific.
Another limitation was the simplified shoulder model used in Chapter 4. The
shoulder complex was reduced to a single joint, the glenohumeral joint. This method
is used in the majority of throwing-related studies (Fleisig et al., 1996; Hirashima,
Kudo, Watarai, et al., 2007; Hong et al., 2001; Hore et al., 2011; Keeley et al., 2012;
Roach & Lieberman, 2014) due to the difficulties in tracking the scapula movement
(Veeger et al., 2003). A recent study on Dutch baseball pitchers managed to analyse
191
overarm throwing with a more accurate shoulder model (Gasparutto et al., 2015).
Future research on overarm throwing should therefore use shoulder models that
allow movement about all three joints.
Another limitation of the current project was the estimation of the participant’s
upper arm mass using data by de Leva (1996). This method estimates the body
segment mass from the total body mass, I decided to use this method as an athlete’s
upper arm mass can quickly be determined at the beginning of data collection. Even
though there are more accurate methods available (Furlong, 2010), the majority are
more time-consuming. However, future research should use a more accurate
method to determine the participant’s arm segment masses.
6.3. Applications
The main aim of the present project was to determine the athlete’s optimal
upper arm mass that results in the highest ball release speed in overarm throwing.
The findings of the three studies confirm that some athletes could benefit from
increasing their upper arm mass in order to optimise the transfer of angular
momentum between the arm segments. However, as the optimal upper arm mass
varied between participants and not every participant benefited from additional upper
arm mass, it is crucial for coaches to identify an athlete’s optimal upper arm mass in
order to avoid the heavier upper arm mass having a negative effect on performance
or increase the risk of injury.
The simulations performed in Chapter 5 suggest that an athlete that is able to
generate a similar internal shoulder rotation angular velocity with a heavier upper
arm mass should benefit from increasing their upper arm mass. This finding implies
192
that future training programs could focus on increasing upper arm muscle mass
through strength training and combining it with throwing-specific training that
emphasises the generation of a high internal shoulder rotation angular velocity.
However, further research is required in order to design sport-specific training
programs that aim to optimise an athlete’s upper arm mass.
6.4. Further Work
Southard (1998) observed an increase in ball release speed in overarm
throwing with additional mass attached to the participant’s upper arm. Even though
his findings suggest that athletes could employ this concept in order to improve their
performance, this area of research has attracted very limited attention so far. Apart
from the current project, only the studies by Kim et al. (2008) and Linthorne et al.
(n.d.) have focussed on optimising the athlete’s upper arm mass. However, there are
still many questions that future research could focus on.
First of all, more research is required with highly skilled throwers in order to
see if they could benefit from a heavier upper arm mass or if they have already
reached their optimal upper arm mass through their training routine. As baseball
pitchers have a higher upper arm muscle volume compared to athletes from other
sports (Yamada, Yamashita, et al., 2013; Yamada, Masuo, et al., 2013), it remains to
be seen if they can further increase their ball release speed.
Further work is also required to analyse how changes in upper arm mass
affect an athlete’s ability to accurately release the ball and what affect their timing of
ball release has on ball release speed (Jegede et al., 2005). Previous studies found
that interaction torques act on the wrist joint in order to control ball release
193
(Hirashima et al., 2003). Therefore, future research could quantify the interaction
torques in order to determine how they are affected by additional upper arm mass.
In order for throwing athletes to benefit from the current findings, training
programs would have to be tested that include hypertrophy exercise focussing on
increasing the athlete’s upper arm mass. As such an intervention would also affect
muscle strength, it could be challenging to determine if improvements in throwing
performance are cause by the heavier upper arm mass or by the increased muscle
strength.
6.5. Conclusions
The current project provides further evidence that some athletes can benefit
from increasing their upper arm mass in order to increase their ball release speed in
overarm throwing. The optimal upper arm mass varies between athletes and
depends on the forearm mass and the skill level of the athlete. Furthermore, the
results of the present project suggest that a heavier upper arm mass does not
substantially increase the loads on the shoulder joint and elbow joint, and thus there
is no evidence in the current project that a heavier upper arm mass increases the
risk of injury. However, as an increase in ball release speed with a heavier upper
arm mass could not be observed for every participant in the present project, athletes
should be cautious when attempting to optimise their upper arm mass.
194
References
Aguinaldo, A. L., Buttermore, J., & Chambers, H. (2007). Effects of upper trunk
rotation on shoulder joint torque among baseball pitchers of various levels.
Journal of Applied Biomechanics, 23, 42–51.
Aguinaldo, A. L., & Chambers, H. (2009). Correlation of throwing mechanics with
elbow valgus load in adult baseball pitchers. The American Journal of Sports
Medicine, 37, 2043–2048.
Alaways, L. W., Mish, S. P., & Hubbard, M. (2001). Identification of release
conditions and aerodynamic forces in pitched-baseball trajectories. Journal of
Applied Biomechanics, 17, 63–76.
Anderson, F. C., & Pandy, M. G. (1999). A dynamic optimization solution for vertical
jumping in three dimensions. Computer Methods in Biomechanics and
Biomedical Engineering, 2, 201–231.
Anderson, F. C., & Pandy, M. G. (2001). Dynamic optimization of human walking.
Journal of Biomechanical Engineering, 123, 381–390.
Anz, A. W., Bushnell, B. D., Griffin, L. P., Noonan, T. J., Torry, M. R., & Hawkins, R.
J. (2010). Correlation of torque and elbow injury in professional baseball
pitchers. The American Journal of Sports Medicine, 38, 1368–1374.
Barrentine, S. W., Matsuo, T., Escamilla, R. F., Fleisig, G. S., & Andrews, J. R.
(1998). Kinematic analysis of the wrist and forearm during baseball pitching.
Journal of Applied Biomechanics, 14, 24–39.
195
Bartlett, R. M. (2000). Principles of throwing. In Biomechanics in Sport: Performance
Improvement and Injury Prevention (pp. 365–380).
Bartlett, R. M., Stockill, N. P., Elliott, B. C., & Burnett, A. F. (1996). The
biomechanics of fast bowling in men’s cricket: A review. Journal of Sports
Sciences, 14, 403–424.
Bartlett, R. M., Wheat, J., & Robins, M. (2007). Is movement variability important for
sports biomechanists? Sports Biomechanics, 6, 224–243.
Bates, B. T., James, C. R., & Dufek, J. S. (2004). Single-subject analysis. In N.
Stergiou (Ed.), Innovative Analysis of Human Movement (pp. 3–28).
Champaign, IL, USA: Human Kinetics.
Batterham, A. M., & Hopkins, W. G. (2006). Making meaningful inferences about
magnitudes. International Journal of Sports Physiology and Performance, 1, 50–
57.
Blana, D., Hincapie, J. G., Chadwick, E. K. J., & Kirsch, R. F. (2008). A
musculoskeletal model of the upper extremity for use in the development of
neuroprosthetic systems. Journal of Biomechanics, 41, 1714–1721.
Blazevich, A. (2007). Sports biomechanics the basic: optimising human
performance. Bloomsbury Publishing.
Borsa, P. A., Wilk, K. E., Jacobson, J. A., Scibek, J. S., Dover, G. C., Reinold, M. M.,
& Andrews, J. R. (2005). Correlation of range of motion and glenohumeral
translation in professional baseball pitchers. American Journal of Sports
Medicine, 33, 1392–1399.
196
Bramble, D. M., & Lieberman, D. E. (2004). Endurance running and the evolution of
Homo. Nature, 432, 345–352.
Brancazio, P. J. (1981). Physics of basketball. American Journal of Physics, 49,
356–365.
Buffi, J. H., Werner, K., Kepple, T., & Murray, W. M. (2015). Computing muscle,
ligament, and osseous contributions to the elbow varus moment during baseball
pitching. Annals of Biomedical Engineering, 43, 404–415.
Calvin, W. H. (1982). Did throwing stones shape hominid brain evolution? Ethology
and Sociobiology, 3, 115–124.
Chalmers, P. N., Wimmer, M. A., Verma, N. N., Cole, B. J., Romeo, A. A.,
Cvetanovich, G. L., & Pearl, M. L. (2017). The relationship between pitching
mechanics and injury. Sports Health, 9, 216–221.
Chen, H.-H., Liu, C., & Yang, W.-W. (2016). Coordination pattern of baseball pitching
among young pitchers of various ages and velocity levels. Journal of Sports
Sciences, 1–9.
Chowdhary, A. G., & Challis, J. H. (1999). Timing accuracy in human throwing.
Journal of Theoretical Biology, 201, 219–229.
Chowdhary, A. G., & Challis, J. H. (2001). The biomechanics of an overarm throwing
task: a simulation model examination of optimal timing of muscle activations.
Journal of Theoretical Biology, 211, 39–53.
Chu, S. K., Jayabalan, P., Kibler, W. B., & Press, J. M. (2016). The kinetic chain
197
revisited: New concepts on throwing mechanics and injury. PM&R, 8, S69–S77.
Clauser, C. E., McConville, J. T., & Young, J. W. (1969). Weight, volume, and center
of mass of segments of the human body. National Technical Information
Service, 1–112.
Cohen, J. (1988). Statistical power analysis for the behavioral sciences. Lawrence
Erlbaum (Vol. 2nd). Hillsdale, NJ.
Conte, S., Requa, R. K., & Garrick, J. G. (2001). Disability days in major league
baseball. American Journal of Sports Medicine, 29, 431–436.
Cook, D. P., & Strike, S. C. (2000). Throwing in cricket. Journal of Sports Sciences,
18, 965–973.
Cork, A., Justham, L., & West, A. (2012). Three-dimensional vision analysis to
measure the release characteristics of elite bowlers in cricket. Journal of Sports
Engineering and Technology, 227, 116–127.
Cross, R. (2004). Physics of overarm throwing. American Journal of Physics, 72,
305–312.
Cross, R. (2011). A double pendulum model of tennis strokes. American Journal of
Physics, 79, 470–476.
Crotin, R. L., Bhan, S., & Ramsey, D. K. (2015). An inferential investigation into how
stride length influences temporal parameters within the baseball pitching
delivery. Human Movement Science, 41, 127–135.
de Leva, P. (1996). Adjustments to Zatsiorsky-Seluyanov’s segment inertia
198
parameters. Journal of Biomechanics, 29, 1223–1230.
de Lussanet, M. H., & Alexander, R. M. (1997). A simple model for fast planar arm
movements; optimising mechanical activation and moment-arms of uniarticular
and biarticular arm muscles. Journal of Theoretical Biology, 184, 187–201.
Debicki, D. B., Watts, S., Gribble, P. L., & Hore, J. (2010). A novel shoulder–elbow
mechanism for increasing speed in a multijoint arm movement. Experimental
Brain Research, 203, 601–613.
Delp, S. L., Anderson, F. C., Arnold, A. S., Loan, J. P., Habib, A., John, C. T., …
Thelen, D. G. (2007). OpenSim: Open-source software to create and analyze
dynamic simulations of movement. IEEE Transactions on Biomedical
Engineering, 54, 1940–1950.
Delp, S. L., Loan, J. P., Hoy, M. G., Zajac, F. E., Topp, E. L., Rosen, J. M., … Alto,
P. (1990). An interactive graphics-based model of the lower extremity to study
orthopaedic surgical procedures. IEEE Transactions on Biomedical Engineering,
37, 757–67.
Dempster, W. T. (1955). Space requirements of the seated operator: geometrical,
kinematic, and mechanical aspects of the body, with special reference to the
limbs.
DeRenne, C., Ho, K. W., & Murphy, J. C. (2001). Effects of general, special, and
specific resistance training on throwing velocity in baseball: A brief review.
Journal of Strength and Conditioning Research, 15, 148–56.
Dick, R., Sauers, E. L., Agel, J., Keuter, G., Marshall, S. W., McCarty, K., &
199
McFarland, E. (2007). Descriptive epidemiology of collegiate men’s baseball
injuries : National Collegiate Athletic Association injury surveillance system ,
1988–1989 through 2003–2004. Journal of Athletic Training, 42, 183–193.
Dillman, C. J., Fleisig, G. S., & Andrews, J. R. (1993). Biomechanics of pitching with
emphasis upon shoulder kinematics. Journal of Orthopaedic & Sports Physical
Therapy, 18, 402–408.
Dowling, B., Pearl, C., Laughlin, W. A., Tubbs, T. G., & Fleisig, G. S. (2016).
Relationship of pelvic and trunk kinematics to ball velocity in professional
baseball pitchers. In 40th Annual Meeting of the American Society of
Biomechanics. Raleigh, NC, USA.
Dun, S., Fleisig, G. S., Loftice, J., Kingsley, D. S., & Andrews, J. R. (2007). The
relationship between age and baseball pitching kinematics in professional
baseball pitchers. Journal of Biomechanics, 40, 265–270.
Ehl, T., Roberton, M. A., & Langendorfer, S. J. (2005). Does the throwing ‘gender
gap’ occur in Germany? Research Quarterly for Exercise and Sport, 76, 488–
493.
Escamilla, R. F., Barrentine, S. W., Fleisig, G. S., Zheng, N., Takada, Y., Kingsley,
D. S., & Andrews, J. R. (2007). Pitching biomechanics as a pitcher approaches
muscular fatigue during a simulated baseball game. The American Journal of
Sports Medicine, 35, 23–33.
Feltner, M. E. (1989). Three-dimensional interactions in a two-segment kinetic chain.
Part II: Application to the throwing arm in baseball pitching. International Journal
200
of Sport Biomechanics, 5, 420–450.
Feltner, M. E., & Dapena, J. (1986). Dynamics of the shoulder and elbow joints of the
throwing arm during a baseball pitch. International Journal of Sports
Biomechanics, 2, 235–259.
Fieseler, G., Jungermann, P., Koke, A., Delank, K.-S., & Schwesig, R. (2014).
Beweglichkeit der Wurfarmschulter sowie isometrische Kraftentwicklung und
ihre Veränderungen unter Trainings- und Saisonbedingungen beim semi-
/professionellen Handballsportler Teil I: Veränderungen in der
Saisonvorbereitungsphase. Sports Orthopaedics and Traumatology, 30, 238–
248.
Fleisig, G. S., Andrews, J. R., Dillman, C. J., & Escamilla, R. F. (1995). Kinetics of
baseball pitching with implications about injury mechanisms. The American
Journal of Sports Medicine, 23, 233–239.
Fleisig, G. S., Barrentine, S. W., Zheng, N., Escamilla, R. F., & Andrews, J. R.
(1999). Kinematic and kinetic comparison of baseball pitching among various
levels of development. Journal of Biomechanics, 32, 1371–1375.
Fleisig, G. S., Chu, Y., Weber, A., & Andrews, J. (2009). Variability in baseball
pitching biomechanics among various levels of competition. Sports
Biomechanics, 8, 10–21.
Fleisig, G. S., & Escamilla, R. F. (1996). Biomechanics of the elbow in the throwing
athlete. Operative Techniques in Sports Medicine, 4, 62–68.
Fleisig, G. S., Escamilla, R. F., Andrews, J. R., Matsuo, T., Satterwhite, Y., &
201
Barrentine, S. W. (1996). Kinematic and kinetic comparison between baseball
pitching and football passing. Journal of Applied Biomechanics, 12, 207–224.
Fleisig, G. S., Hsu, W. K., Fortenbaugh, D., Cordover, A., & Press, J. M. (2013).
Trunk axial rotation in baseball pitching and batting. Sports Biomechanics, 12,
324–333.
Fleisig, G. S., Kingsley, D. S., Loftice, J. W., Dinnen, K. P., Ranganathan, R., Dun,
S., … Andrews, J. R. (2006). Kinetic comparison among the fastball, curveball,
change-up, and slider in collegiate baseball pitchers. The American Journal of
Sports Medicine, 34, 423–430.
Fortenbaugh, D., & Fleisig, G. S. (2009). Mechanical efficiency in baseball pitching.
In ISBS-Conference Proceedings 2009. Limerick, Ireland.
Fortenbaugh, D., Fleisig, G. S., & Andrews, J. R. (2009). Baseball pitching
biomechanics in relation to injury risk and performance. Sports Health, 1, 314–
320.
Freeston, J., Ferdinands, R. E. D., & Rooney, K. (2015). The launch window
hypothesis and the speed-accuracy trade-off in baseball throwing. Perceptual
and Motor Skills, 121, 135–148.
Freeston, J., & Rooney, K. (2014). Throwing speed and accuracy in baseball and
cricket players. Perceptual and Motor Skills, 118, 637–650.
Furlong, L.-A. (2010). Evolution of the measurement of body segment inertial
parameters since the 1970s. The Undergraduate Journal of Ireland and
Northern Ireland, 1, 465–477.
202
Gasparutto, X., van der Graaff, E., van der Helm, F. C. T., & Veeger, H. E. J. (2015).
Shoulder joint velocity during fastball pitching in baseball. In ISBS-Conference
Proceedings 2015. Poitiers, France.
Gray, S., Watts, S., Debicki, D. B., & Hore, J. (2006). Comparison of kinematics in
skilled and unskilled arms of the same recreational baseball players. Journal of
Sports Sciences, 24, 1183–1194.
Hamner, S. R., Seth, A., & Delp, S. L. (2010). Muscle contributions to propulsion and
support during running. Journal of Biomechanics, 43, 2709–2716.
Hansen, C., Martin, C., Rezzoug, N., Gorce, P., Bideau, B., & Isableu, B. (2017).
Sequence-dependent rotation axis changes in tennis. Sports Biomechanics,
3141, 1–13.
Hay, J. G. (1985). The Biomechanics of Sports Techniques. Prentice Hall.
Herring, R. M., & Chapman, A. E. (1992). Effects of changes in segmental values
and timing of both torque and torque reversal in simulated throws. Journal of
Biomechanics, 25, 1173–1184.
Hicks, J. L., Uchida, T. K., Seth, A., Rajagopal, A., & Delp, S. L. (2015). Is my model
good enough? Best practices for verification and validation of musculoskeletal
models and simulations of human movement. Journal of Biomechanical
Engineering, 137, 20905.
Hirashima, M. (2002). Utilization and compensation of interaction torques during ball-
throwing movements. Journal of Neurophysiology, 89, 1784–1796.
203
Hirashima, M., Kudo, K., & Ohtsuki, T. (2007). A new non-orthogonal decomposition
method to determine effective torques for three-dimensional joint rotation.
Journal of Biomechanics, 40, 871–882.
Hirashima, M., Kudo, K., Watarai, K., & Ohtsuki, T. (2007). Control of 3D limb
dynamics in unconstrained overarm throws of different speeds performed by
skilled baseball players. Journal of Neurophysiology, 97, 680–691.
Hirashima, M., Ohgane, K., Kudo, K., Hase, K., & Ohtsuki, T. (2003). Counteractive
relationship between the interaction torque and muscle torque at the wrist is
predestined in ball-throwing. Journal of Neurophysiology, 90, 1449–1463.
Hirashima, M., & Ohtsuki, T. (2008). Exploring the mechanism of skilled overarm
throwing. Exercise and Sport Sciences Reviews, 36, 205–211.
Hirashima, M., Yamane, K., Nakamura, Y., & Ohtsuki, T. (2008). Kinetic chain of
overarm throwing in terms of joint rotations revealed by induced acceleration
analysis. Journal of Biomechanics, 41, 2874–2883.
Holzbaur, K. R. S., Murray, W. M., & Delp, S. L. (2005). A model of the upper
extremity for simulating musculoskeletal surgery and analyzing neuromuscular
control. Annals of Biomedical Engineering, 33, 829–840.
Hong, D. A., Cheung, T. K., & Roberts, E. M. (2001). A three-dimensional, six-
segment chain analysis of forceful overarm throwing. Journal of
Electromyography and Kinesiology, 11, 95–112.
Hootman, J. M., Dick, R., & Agel, J. (2007). Epidemiology of collegiate injuries for 15
sports: Summary and recommendations for injury prevention initiatives. Journal
204
of Athletic Training, 42, 311–319.
Hopkins, W. G. (2000). Measures of reliability in sports medicine and science. Sports
Medicine, 30, 1–15.
Hopkins, W. G. (2007). A spreadsheet for deriving a confidence interval, mechanistic
inference and clinical inference from a p value. Sportscience, 11, 16–20.
Hore, J., Debicki, D. B., Gribble, P. L., & Watts, S. (2011). Deliberate utilization of
interaction torques brakes elbow extension in a fast throwing motion.
Experimental Brain Research, 211, 63–72.
Hore, J., Watts, S., Leschuk, M., & MacDougall, A. (2001). Control of finger grip
forces in overarm throws made by skilled throwers. Journal of Neurophysiology,
86, 2678–2689.
Hore, J., Watts, S., Martin, J., & Miller, B. (1995). Timing of finger opening and ball
release in fast and accurate overarm throws. Experimental Brain Research, 103,
277–286.
Hore, J., Watts, S., & Tweed, D. (1996). Errors in the control of joint rotations
associated with inaccuracies in overarm throws. Journal of Neurophysiology, 75,
1013–1025.
Isaac, B. (1987). Throwing and human evolution. The African Archaeological
Review, 5, 3–17.
Ishida, K., Murata, M., & Hirano, Y. (2006). Shoulder and elbow kinematics in
throwing of young baseball players. Sports Biomechanics, 5, 183–196.
205
Jegede, E., Watts, S., Stitt, L., & Hore, J. (2005). Timing of ball release in overarm
throws affects ball speed in unskilled but not skilled individuals. Journal of
Sports Sciences, 23, 805–816.
Kageyama, M., Sugiyama, T., Kanehisa, H., & Maeda, A. (2015). Difference between
adolescent and collegiate baseball pitchers in the kinematics and kinetics of the
lower limbs and trunk during pitching motion. Journal of Sports Science and
Medicine, 14, 246–255.
Kageyama, M., Sugiyama, T., Takai, Y., Kanehisa, H., & Maeda, A. (2014).
Kinematic and kinetic profiles of trunk and lower limbs during baseball pitching
in collegiate pitchers. Journal of Sports Science and Medicine, 13, 742–750.
Keeley, D. W., Oliver, G. D., & Dougherty, C. P. (2012). Shoulder kinematics during
pitching: Comparing the slide step and traditional stretch deliveries. Human
Movement Science, 31, 1191–1199.
Kentel, B. B., King, M. A., & Mitchell, S. R. (2011). Evaluation of a subject-specific,
torque-driven computer simulation model of one-handed tennis backhand
ground strokes. Journal of Applied Biomechanics, 27, 345–354.
Kim, Y.-K., Dounskaia, N., Hinrichs, R. N., & Richard, H. (2008). Does an extra mass
improve the arm swing speed? In ISBS-Conference Proceedings 2008. Seoul,
Korea.
King, M. A., & Yeadon, M. R. (2015). Advances in the development of whole body
computer simulation modelling of sports technique. Movement & Sport
Sciences, 4, 55–67.
206
Knowledge Revolution. (2006). Working Model 2D User’s Manual. San Mateo, CA.
Langendorfer, S. J., & Roberton, M. A. (2002). Individual pathways in the
development of forceful throwing. Research Quarterly for Exercise and Sport,
73, 245–256.
Larson, S. G. (2015). Humeral torsion and throwing proficiency in early human
evolution. Journal of Human Evolution, 85, 198–205.
Lin, H.-T., Su, F.-C., Nakamura, M., & Chao, E. Y. S. (2003). Complex chain of
momentum transfer of body segments in the baseball pitching motion. Journal of
the Chinese Institute of Engineers, 26, 861–868.
Linthorne, N. P. (2001). Optimum release angle in the shot put. Journal of Sports
Sciences, 19, 359–372.
Linthorne, N. P. (2006). Throwing and jumping for maximum horizontal range.
Linthorne, N. P., & Everett, D. J. (2006). Release angle for attaining maximum
distance in the soccer throw-in. Sports Biomechanics, 5, 243–260.
Linthorne, N. P., Heys, M., Reynolds, T. J., & Eckardt, N. (n.d.). Optimising the mass
of the upper arm can increase throw distance in a modified javelin throw.
Linthorne, N. P., & Stokes, T. G. (2014). Optimum projection angle for attaining
maximum distance in a rugby place kick. Journal of Sports Science and
Medicine, 13, 211–216.
Lorson, K. M., & Goodway, J. D. (2008). Gender differences in throwing form of
children ages 6-8 years during a throwing game. Research Quarterly for
207
Exercise and Sport, 79, 174–182.
Lorson, K. M., Stodden, D. F., Langendorfer, S. J., & Goodway, J. D. (2013). Age
and gender differences in adolescent and adult overarm throwing. Research
Quarterly for Exercise and Sport, 84, 239–244.
Marques, M. C., Liberal, S. M., Costa, A. M., van den Tillaar, R., Sánchez-Medina,
L., Martins, J. C., & Marinho, D. A. (2012). Effects of two different training
programs with same workload on throwing velocity by experienced water polo
players. Perceptual and Motor Skills, 115, 895–902.
Matsuo, T., Escamilla, R. F., Fleisig, G. S., Barrentine, S. W., & Andrews, J. R.
(2001). Comparison of kinematic and temporal parameters between different
pitch velocity groups. Journal of Applied Biomechanics, 17, 1–13.
Matsuo, T., Matsumoto, T., Mochizuki, Y., Takada, Y., & Saito, K. (2002). Optimal
shoulder abduction angles during baseball pitching from maximal wrist velocity
and minimal kinetics viewpoints. Journal of Applied Biomechanics, 18, 306–320.
Matsuo, T., Matsumoto, T., Takada, Y., & Mochizuki, Y. (1999). Influence of different
shoulder abduction angels during baseball pitching on throwing performance
and joint kinetics. In ISBS-Conference Proceedings 1999. Perth, Australia.
Matsuo, T., Takada, Y., Matsumoto, T., & Saito, K. (2000). Biomechanical
characteristics of sidearm and underhand baseball pitching: comparison with
those of overhand and three-quarter-hand pitching. Japanese Journal of
Biomechanics in Sports & Exercise, 4, 243–252.
McConville, J. T., Churchill, T., Kaleps, I., Clauser, C. E., & Cuzzi, J. (1980).
208
Anthropometric relationships of body and body segment moments of inertia.
Technical Report AFAMRL-TR-80-119, Wright Patterson Air Force Base, Ohio,
1–113.
McNally, M. P., Borstad, J. D., Onate, J. A., & Chaudhari, A. M. W. (2015). Stride leg
ground reaction forces predict throwing velocity in adult recreational baseball
pitchers. Journal of Strength & Conditioning Research, 29, 2708–2715.
Meyer, K. E., Saether, E. E., Soiney, E. K., Shebeck, M. S., Paddock, K. L., &
Ludewig, P. M. (2008). Three-dimensional scapular kinematics during the
throwing motion. Journal of Applied Biomechanics, 24, 24–34.
Miyashita, K., Kobayashi, H., Koshida, S., & Urabe, Y. (2010). Glenohumeral,
scapular, and thoracic angles at maximum shoulder external rotation in
throwing. The American Journal of Sports Medicine, 38, 363–368.
Motulsky, H. (2013). Intuitive biostatistics: a nonmathematical guide to statistical
thinking. Oxford University Press. Oxford, UK.
Motulsky, H., & Christopoulos, A. (2003). Fitting models to biological data using
linear and nonlinear regression. Oxford University Press. Oxford, UK.
Myers, J. B., Laudner, K. G., Pasquale, M. R., Bradley, J. P., & Lephart, S. M.
(2005). Scapular position and orientation in throwing athletes. The American
Journal of Sports Medicine, 33, 263–271.
Naito, K., & Maruyama, T. (2008). Contributions of the muscular torques and motion-
dependent torques to generate rapid elbow extension during overhand baseball
pitching. Sports Engineering, 11, 47–56.
209
Nissen, C. W., Solomito, M., Garibay, E., Westwell, M., Ounpuu, S., & Westwell, M.
(2013). A biomechanical comparison of pitching from a mound versus flat
ground in adolescent baseball pitchers. Sports Health, 5, 530–536.
Oliver, G. D., Lohse, K., & Gascon, S. (2015). Kinematics and kinetics of youth
baseball catchers and pitchers. Sports, 3, 246–257.
Oliver, G. D., Plummer, H. A., & Keeley, D. W. (2011). Muscle activation patterns of
the upper and lower extermity during the windmill softball pitch. Journal of
Strength and Conditioning Research, 25, 1653–1658.
Oliver, G. D., & Weimar, W. H. (2015). Scapula kinematics of youth baseball players.
Journal of Human Kinetics, 49, 47–54.
Pandy, M. G. (2001). Computer Modeling and Simulation of Human Movement.
Annual Review of Biomedical Engineering, 3, 245–273.
Pappas, A. M., Zawacki, R. M., & Sullivan, T. J. (1985). Biomechanics of baseball
pitching: A preliminary report. The American Journal of Sports Medicine, 13,
216–22.
Petersen, C. J., Wilson, B. D., & Hopkins, W. G. (2004). Effects of modified-
implement training on fast bowling in cricket. Journal of Sports Sciences, 22,
1035–1039.
Phadke, V., Braman, J. P., LaPrade, R. F., & Ludewig, P. M. (2011). Comparison of
glenohumeral motion using different rotation sequences. Journal of
Biomechanics, 44, 700–705.
210
Plummer, H. A., & Oliver, G. D. (2014). Descriptive analysis of kinematics and
kinetics of catchers throwing to second base from their knees. Journal of
Electromyography and Kinesiology, 37–41.
Posner, M., Cameron, K. L., Wolf, J. M., Belmont, P. J., & Owens, B. D. (2011).
Epidemiology of Major League Baseball injuries. The American Journal of
Sports Medicine, 39, 1676–1680.
Putnam, C. A. (1991). A segment interaction analysis of proximal-to-distal sequential
segment motion patterns. Medicine & Science in Sports & Exercise, 23, 130–
144.
Putnam, C. A. (1993). Sequential motions of body segments in striking and throwing
skills: Descriptions and explanations. Journal of Biomechanics, 26, 125–135.
Ramsey, D. K., & Crotin, R. L. (2016). Effect of stride length on overarm throwing
delivery: Part II: An angular momentum response. Human Movement Science,
46, 30–38.
Ramsey, D. K., Crotin, R. L., & White, S. (2014). Effect of stride length on overarm
throwing delivery: A linear momentum response. Human Movement Science,
38, 185–196.
Reich, J., & Daunicht, W. J. (2000). A rigid body model of the forearm. Journal of
Biomechanics, 33, 1159–1168.
Roach, N. T., & Lieberman, D. E. (2014). Upper body contributions to power
generation during rapid, overhand throwing in humans. Journal of Experimental
Biology, 217, 2139–2149.
211
Roach, N. T., Lieberman, D. E., Gill, T. J., Palmer, W. E., & Gill, T. J. (2012). The
effect of humeral torsion on rotational range of motion in the shoulder and
throwing performance. Journal of Anatomy, 220, 293–301.
Roach, N. T., & Richmond, B. G. (2015a). Clavicle length, throwing performance and
the reconstruction of the Homo erectus shoulder. Journal of Human Evolution,
80, 107–113.
Roach, N. T., & Richmond, B. G. (2015b). Humeral torsion does not dictate shoulder
position, but does influence throwing speed. Journal of Human Evolution, 85,
206–211.
Roach, N. T., Venkadesan, M., Rainbow, M. J., & Lieberman, D. E. (2013). Elastic
energy storage in the shoulder and the evolution of high-speed throwing in
Homo. Nature, 498, 483–486.
Roberton, M. A., & Konczak, J. (2001). Predicting children’s overarm throw ball
velocities from their developmental levels in throwing. Research Quarterly for
Exercise and Sport, 72, 91–103.
Sabick, M. B., Torry, M. R., Kim, Y.-K., & Hawkins, R. J. (2004). Humeral torque in
professional baseball pitchers. The American Journal of Sports Medicine, 32,
892–898.
Sabick, M. B., Torry, M. R., Lawton, R. L., & Hawkins, R. J. (2004). Valgus torque in
youth baseball pitchers: A biomechanical study. Journal of Shoulder and Elbow
Surgery, 13, 349–355.
Sainburg, R. L. (2002). Evidence for a dynamic-dominance hypothesis of
212
handedness. Experimental Brain Research, 142, 241–258.
Saul, K. R., Hu, X., Goehler, C. M., Vidt, M. E., Daly, M., Velisar, A., & Murray, W. M.
(2014). Benchmarking of dynamic simulation predictions in two software
platforms using an upper limb musculoskeletal model. Computer Methods in
Biomechanics and Biomedical Engineering, 18, 1445–1458.
Šenk, M., & Chèze, L. (2006). Rotation sequence as an important factor in shoulder
kinematics. Clinical Biomechanics, 21, S3–S8.
Seroyer, S. T., Nho, S. J., Bach, B. R., Bush-Joseph, C. A., Nicholson, G. P., &
Romeo, A. A. (2010). The kinetic chain in overhand pitching: Its potential role for
performance enhancement and injury prevention. Sports Health, 2, 135–46.
Serrien, B., & Baeyens, J.-P. (2017). The proximal-to-distal sequence in upper-limb
motions on multiple levels and time scales. Human Movement Science, 55,
156–171.
Serrien, B., Clijsen, R., Blondeel, J., Goossens, M., & Baeyens, J.-P. (2015).
Differences in ball speed and three-dimensional kinematics between male and
female handball players during a standing throw with run-up. BMC Sports
Science, Medicine and Rehabilitation, 7, 1–12.
Sgroi, T., Chalmers, P. N., Riff, A. J., Lesniak, M., Sayegh, E. T., Wimmer, M. A., …
Romeo, A. A. (2015). Predictors of throwing velocity in youth and adolescent
pitchers. Journal of Shoulder and Elbow Surgery, 24, 1339–1345.
Southard, D. (1998). Mass and velocity: Control parameters for throwing patterns.
Research Quarterly for Exercise and Sport, 69, 355–367.
213
Southard, D. (2009). Throwing pattern: Changes in timing of joint lag according to
age between and within skill level. Research Quarterly for Exercise and Sport,
80, 213–222.
Štirn, I., Carruthers, J., Šibila, M., & Pori, P. (2017). Frequent immediate knowledge
of results enhances the increase of throwing velocity in overarm handball
performance. Journal of Human Kinetics, 56, 197–205.
Stodden, D. F., Fleisig, G. S., McLean, S. P., & Andrews, J. R. (2005). Relationship
of biomechanical factors to baseball pitching velocity: Within pitcher variation.
Journal of Applied Biomechanics, 21, 44–56.
Stodden, D. F., Fleisig, G. S., McLean, S. P., Lyman, S. L., & Andrews, J. R. (2001).
Relationship of pelvis and upper torso kinematics to pitched baseball velocity.
Journal of Applied Biomechanics, 17, 164–172.
Stodden, D. F., Langendorfer, S. J., Fleisig, G. S., & Andrews, J. R. (2006).
Kinematic constraints associated with the acquisition of overarm throwing part II:
Upper extremity actions. Research Quarterly for Exercise and Sport, 77, 428–
436.
Taylor, R. E., Zheng, C., Jackson, R. P., Doll, J. C., Chen, J. C., Holzbaur, K. R. S.,
… Kuhl, E. (2009). The phenomenon of twisted growth: humeral torsion in
dominant arms of high performance tennis players. Computer Methods in
Biomechanics and Biomedical Engineering, 12, 83–93.
Terry, G. C., & Chopp, T. M. (2000). Functional anatomy of the shoulder. Journal of
Athletic Training, 35, 248–255.
214
Theobalt, C., Albrecht, I., Haber, J., Magnor, M., & Seidel, H. (2004). Pitching a
baseball: Tracking high-speed motion with multi-exposure images. ACM
Transactions on Graphics, 3, 540–547.
Thomas, J. R., Alderson, J. A., Thomas, K. T., Campbell, A. C., & Elliott, B. C.
(2010). Developmental gender differences for overhand throwing in Aboriginal
Australian children. Research Quarterly for Exercise and Sport, 81, 432–441.
Toyoshima, S., Hoshikawa, T., Miyashita, M., & Oguri, T. (1974). Contribution of the
body parts to throwing performance. International Series on Sports Sciences, 1,
169–174.
Urbin, M. A., Fleisig, G. S., Abebe, A., & Andrews, J. R. (2013). Associations
between timing in the baseball pitch and shoulder kinetics, elbow kinetics, and
ball speed. The American Journal of Sports Medicine, 41, 336–342.
Urbin, M. A., Stodden, D. F., & Fleisig, G. S. (2013). Overarm throwing variability as
a function of trunk action. Journal of Motor Learning and Development, 1, 89–
95.
van den Tillaar, R. (2004). Effect of different training programs on the velocity of
overarm throwing: A brief review. The Journal of Strength and Conditioning
Research, 18, 388–396.
van den Tillaar, R., & Ettema, G. (2009). Is there a proximal-to-distal sequence in
overarm throwing in team handball? Journal of Sports Sciences, 27, 949–955.
van der Graaff, E., Hoozemans, M., Nijhoff, M., Davidson, M., Hoezen, M., & Veeger,
H. E. J. (2016). The role of pelvis and thorax velocity in baseball pitching. In
215
ISBS-Conference Proceedings 2016. Tsukuba, Japan.
Veeger, H. E. J., Chadwick, E. K. J., & Magermans, D. (2003). Toward standardized
procedures for recording and describing 3-D shoulder movements, 35, 440–446.
Veeger, H. E. J., & van der Helm, F. C. T. (2007). Shoulder function: The perfect
compromise between mobility and stability. Journal of Biomechanics, 40, 2119–
2129.
Wagner, H., Buchecker, M., Von Duvillard, S. P., & Müller, E. (2010). Kinematic
comparison of team handball throwing with two different arm positions.
International Journal of Sports Physiology and Performance, 5, 469–483.
Werner, S. L., Fleisig, G. S., Dillman, C. J., & Andrews, J. R. (1993). Biomechanics
of the elbow during baseball pitching. The Journal of Orthopaedic and Sports
Physical Therapy, 17, 274–278.
Werner, S. L., Gill, T. J., Murray, T. A., Cook, T. D., & Hawkins, R. J. (2001).
Relationships between throwing mechanics and shoulder distraction in
professional baseball pitchers. The American Journal of Sports Medicine, 29,
354–358.
Werner, S. L., Guido, J. A., Stewart, G. W., McNeice, R. P., VanDyke, T., & Jones,
D. G. (2007). Relationships between throwing mechanics and shoulder
distraction in collegiate baseball pitchers. Journal of Shoulder and Elbow
Surgery, 16, 37–42.
Werner, S. L., Murray, T. A., Hawkins, R. J., & Gill, T. J. (2002). Relationship
between throwing mechanics and elbow valgus in professional baseball
216
pitchers. Journal of Shoulder and Elbow Surgery, 11, 151–155.
Werner, S. L., Suri, M., Guido, J. A., Meister, K., & Jones, D. G. (2008).
Relationships between ball velocity and throwing mechanics in collegiate
baseball pitchers. Journal of Shoulder and Elbow Surgery, 17, 905–908.
Whiteley, R. (2007). Baseball throwing mechanics as they relate to pathology and
performance - A review. Journal of Sports Science and Medicine, 6, 1–20.
Whiteside, D., Martini, D. N., Zernicke, R. F., & Goulet, G. C. (2016). Ball speed and
release consistency predict pitching success in Major League Baseball. Journal
of Strength and Conditioning Research, 30, 1787–1795.
Wicke, J., Keeley, D. W., & Oliver, G. D. (2013). Comparison of pitching kinematics
between youth and adult baseball pitchers: A meta-analytic approach. Sports
Biomechanics, 12, 315–323.
Wickington, K., & Linthorne, N. P. (2017). Effect of ball weight on speed, accuracy,
and mechanics in cricket fast bowling. Sports, 5, 1–14.
Winter, D. A. (2009). Biomechanics and Motor Control of Human Movement. John
Wiley & Sons (Vol. 2nd).
Worthington, P. J., King, M. A., & Ranson, C. A. (2013). Relationships between fast
bowling technique and ball release speed in cricket. Journal of Applied
Biomechanics, 29, 78–84.
Wu, G., van der Helm, F. C. T., Veeger, H. E. J., Makhsous, M., Van Roy, P., Anglin,
C., … Buchholz, B. (2005). ISB recommendation on definitions of joint
217
coordinate systems of various joints for the reporting of human joint motion -
Part II: Shoulder, elbow, wrist and hand. Journal of Biomechanics, 38, 981–992.
Yamada, Y., Masuo, Y., Nakamura, E., & Oda, S. (2013). Inter-sport variability of
muscle volume distribution identified by segmental bioelectrical impedance
analysis in four ball sports. Open Access Journal of Sports Medicine, 4, 97–108.
Yamada, Y., Yamashita, D., Yamamoto, S., Matsui, T., Seo, K., Azuma, Y., …
Kimura, M. (2013). Whole-body and segmental muscle volume are associated
with ball velocity in high school baseball pitchers. Open Access Journal of
Sports Medicine, 4, 89–95.
Yamaguchi, G. T., & Zajac, F. E. (1989). A planar model of the knee joint to
characterize the knee extensor mechanism. Journal of Biomechanics, 22, 1–10.
Yan, J. H., Payne, V. G., & Thomas, J. R. (2000). Developmental kinematics of
young girls’ overarm throwing. Research Quarterly for Exercise and Sport, 71,
92–98.
Yeadon, M. R., & King, M. A. (2008). Computer simulation modelling in sport. In C.
Payton & R. Bartlett (Eds.), Biomechanical Evaluation of Movement: The British
Association of Sport and Exercise Siences Guidelines (pp. 176–205). London:
Routledge,.
Yeadon, M. R., King, M. A., & Wilson, C. (2006). Modelling the maximum voluntary
joint torque/angular velocity relationship in human movement. Journal of
Biomechanics. doi:10.1016/j.jbiomech.2004.12.012
Young, R. W. (2003). Evolution of the human hand: the role of throwing and
218
clubbing. Journal of Anatomy, 202, 165–174.
Young, R. W. (2009). The ontogeny of throwing and striking. Human Ontogenetics,
3, 19–31.
Zhang, Y., Unka, J., & Liu, G. (2011). Contributions of joint rotations to ball release
speed during cricket bowling: A three-dimensional kinematic analysis. Journal of
Sports Sciences, 29, 1293–1300.

219
Appendices

220
Appendix 1: Calculating Akaike’s Information Criterion (AIC)
Akaike’s Information Criterion is a method of comparing the fit of two models
to a set of data points (Motulsky & Christopoulos, 2003). This method quantifies how
much more likely one model fits the data compared to the other model. In order to
calculate which model fits the data better, an information criterion (AIC) is calculated:
𝐴𝐼𝐶 = 𝑁 ∙ 𝑙𝑛 (𝑆𝑆
𝑁) + 2𝐾
where N is the number of data points, K is the number of parameters fit by the
regression plus one, and SS is the sum of the square of the vertical distances of the
points from the curve.
However, with a low number of data points, it is recommended to use a
corrected AIC value:
𝐴𝐼𝐶𝑐 = 𝐴𝐼𝐶 +2𝐾(𝐾 + 1)
𝑁 − 𝐾 − 1
Comparing the AIC (or corrected AIC) values obtained for each model
provides information about which of the two models fits the data better. The model
with the lowest AIC value is the most likely to be correct. In order to quantify how
much more likely one model fits the data better compared to the other, we can
calculate the probability:
∆𝐴𝐼𝐶 = 𝐴𝐼𝐶𝐵 − 𝐴𝐼𝐶𝐴
𝑝𝑟𝑜𝑏𝑎𝑏𝑖𝑙𝑖𝑡𝑦 =𝑒−0.5∆
1 + 𝑒−0.5∆
This method only provides information about which one of the two models
tested is a better fit. The method does not exclude that a different model could be
even better.
221
Appendix 2: Ethics Approval