maximizing metabolite extraction for comprehensive metabolomics
TRANSCRIPT
Authors
Theodore Sana and Steve Fischer
Agilent Technologies, Inc., Santa Clara, CA, USA
Maximizing Metabolite Extraction for Comprehensive MetabolomicsStudies of Erythrocytes
Application Note
Abstract
Metabolomics is the comparative analysis of metabolites found in sets of
similar biological samples. Since metabolites play vital roles in biological
systems, metabolomics can be useful for finding and identifying biomarkers, or
for obtaining a better understanding of the effects of drugs or diseases on both
known and unexpected biological pathways.
Successful metabolomic research requires effective metabolite extraction. For
non-targeted metabolomics, extraction methods need to capture a broad range
of cellular and biofluid metabolites, while excluding components such as
proteins that are not intended for analysis. Extraction is made more challenging
by the physico-chemical diversity of metabolites and by metabolite abun-
dances that can vary by many orders of magnitude.
Biphasic, liquid-liquid extraction is often used to extract metabolites. The
nature of the organic and aqueous solvents, their volumes, solvent ratios, and
aqueous solvent pH, however, must be considered carefully. They can signi-
ficantly affect the total number of metabolites extracted and experimental
reproducibility.
This application note describes a method for liquid-liquid extraction of metabo-
lites from erythrocytes. It demonstrates the importance of adjusting the aqueous/
organic ratio to favor biphasic separation. It also demonstrates the effect of
aqueous-phase pH on the number of metabolites extracted and shows that to
obtain as many metabolites as possible, extractions need to be performed at
multiple pHs.
Similarly, in the presence of a weak acid, compounds
containing basic groups form a soluble salt and become more
water soluble (Figure 3). Adding a dilute acid such as dilute
formic acid (HCOOH) to the aqueous phase can improve
extraction of compounds with organic base groups. Formic
acid is well suited to this application because it is miscible
with water and with most polar organic solvents that might
be used as aqueous phase co-solvents.
Formic acid and ammonium hydroxide are good choices for
adjusting the pH of the aqueous phase because they are
volatile and compatible with downstream LC/MS applications.
2
M E T A B O L O M I C SO N C H N S C O H P C N S H C O
BackgroundExtraction is the process by which compounds, such as
metabolites, are selectively separated from other, often
undesired, compounds. One of the most common extraction
methods is liquid-liquid extraction, which takes advantage
of differential solvent solubility and solvent immiscibility.
Compounds are transferred from one liquid phase to another
liquid phase by adding to the original solution an immiscible
solvent in which the compounds are more soluble.
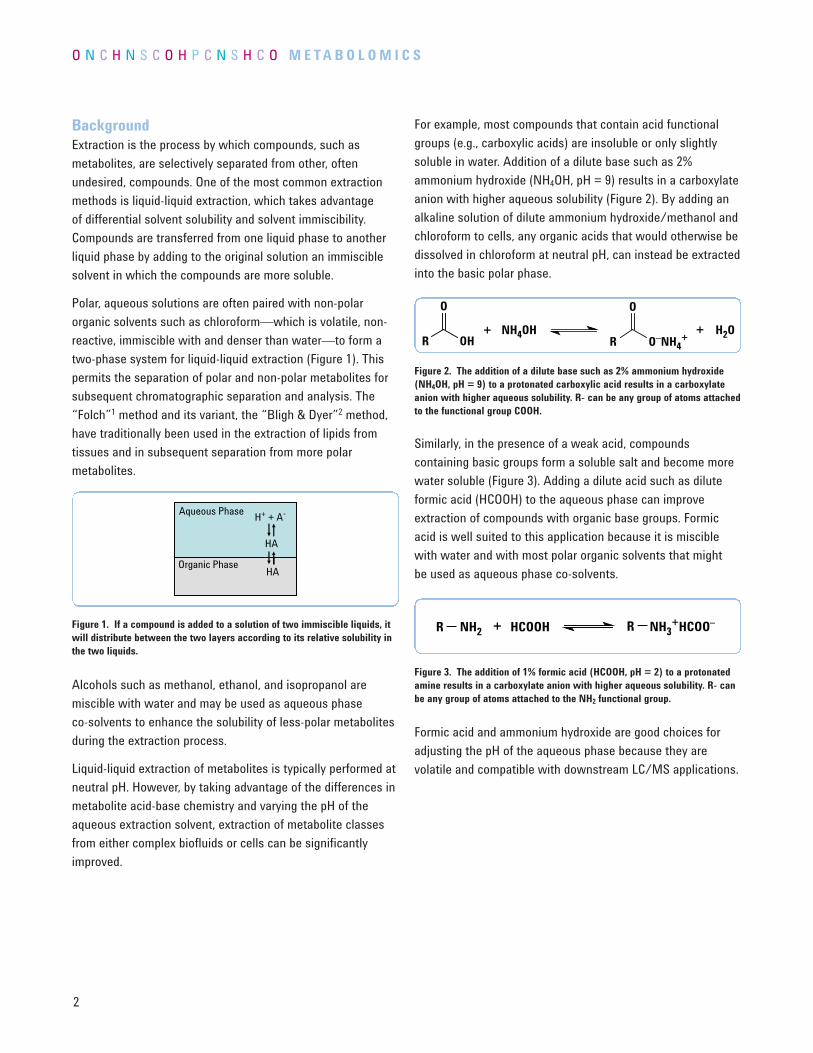
Polar, aqueous solutions are often paired with non-polar
organic solvents such as chloroform—which is volatile, non-
reactive, immiscible with and denser than water—to form a
two-phase system for liquid-liquid extraction (Figure 1). This
permits the separation of polar and non-polar metabolites for
subsequent chromatographic separation and analysis. The
“Folch”1 method and its variant, the “Bligh & Dyer”2 method,
have traditionally been used in the extraction of lipids from
tissues and in subsequent separation from more polar
metabolites.
Alcohols such as methanol, ethanol, and isopropanol are
miscible with water and may be used as aqueous phase
co-solvents to enhance the solubility of less-polar metabolites
during the extraction process.
Liquid-liquid extraction of metabolites is typically performed at
neutral pH. However, by taking advantage of the differences in
metabolite acid-base chemistry and varying the pH of the
aqueous extraction solvent, extraction of metabolite classes
from either complex biofluids or cells can be significantly
improved.
For example, most compounds that contain acid functional
groups (e.g., carboxylic acids) are insoluble or only slightly
soluble in water. Addition of a dilute base such as 2%
ammonium hydroxide (NH4OH, pH = 9) results in a carboxylate
anion with higher aqueous solubility (Figure 2). By adding an
alkaline solution of dilute ammonium hydroxide/methanol and
chloroform to cells, any organic acids that would otherwise be
dissolved in chloroform at neutral pH, can instead be extracted
into the basic polar phase.
Organic Phase
Aqueous Phase
HA
HA
H+ + A-Aqueous Phase
HA
H+ + A-
Figure 1. If a compound is added to a solution of two immiscible liquids, itwill distribute between the two layers according to its relative solubility inthe two liquids.
R
O
OHNH4OH+
R
O
O–NH4+
H2O+
Figure 2. The addition of a dilute base such as 2% ammonium hydroxide(NH4OH, pH = 9) to a protonated carboxylic acid results in a carboxylateanion with higher aqueous solubility. R- can be any group of atoms attachedto the functional group COOH.
NH2 HCOOH R+ NH3+HCOO–R
Figure 3. The addition of 1% formic acid (HCOOH, pH = 2) to a protonatedamine results in a carboxylate anion with higher aqueous solubility. R- canbe any group of atoms attached to the NH2 functional group.
phase was increased by about 10% due to methanol miscibility
in that phase. Hence, some non-polar compounds would be
expected to appear in the aqueous phase as well.
Test extraction
The next experiment applied the aqueous/organic ratio
determined previously to the extraction of metabolites from
erythrocytes. The experiment followed the workflow shown in
Figure 5.
0.5 mL aliquots of human donor erythrocytes (Stanford
University Blood Center) that had been pre-treated with
sodium citrate anti-coagulant were placed in six 1.7 mL
microcentrifuge tubes. They were centrifuged at 1000 g
and 4 °C for 2 minutes, and then placed on ice while the
supernatant was aspirated.
A wash cycle involving resuspension of the cells in phosphate
buffered saline (PBS), centrifugation, and aspiration of the
supernatant can be included at this point, although it was not
in this experiment. The wash cycle removes non-erythrocyte
metabolites and other compounds that may still be present
outside the cells, but it also delays quenching and lysing, and
may leave residual traces of phosphate salts.
www.agilent.com/chem/metabolomics 3
Application Note Maximizing Metabolite Extraction for Comprehensive Metabolomics Studies of Erythrocytes
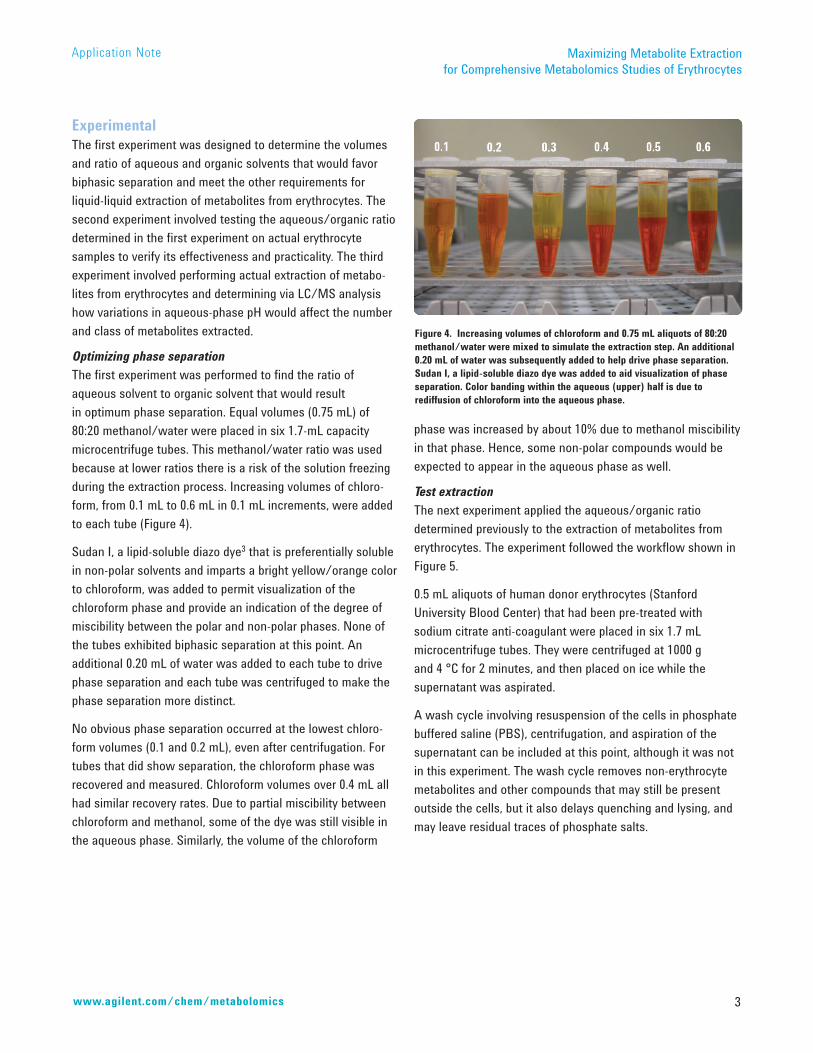
ExperimentalThe first experiment was designed to determine the volumes
and ratio of aqueous and organic solvents that would favor
biphasic separation and meet the other requirements for
liquid-liquid extraction of metabolites from erythrocytes. The
second experiment involved testing the aqueous/organic ratio
determined in the first experiment on actual erythrocyte
samples to verify its effectiveness and practicality. The third
experiment involved performing actual extraction of metabo-
lites from erythrocytes and determining via LC/MS analysis
how variations in aqueous-phase pH would affect the number
and class of metabolites extracted.
Optimizing phase separation
The first experiment was performed to find the ratio of
aqueous solvent to organic solvent that would result
in optimum phase separation. Equal volumes (0.75 mL) of
80:20 methanol/water were placed in six 1.7-mL capacity
microcentrifuge tubes. This methanol/water ratio was used
because at lower ratios there is a risk of the solution freezing
during the extraction process. Increasing volumes of chloro-
form, from 0.1 mL to 0.6 mL in 0.1 mL increments, were added
to each tube (Figure 4).
Sudan I, a lipid-soluble diazo dye3 that is preferentially soluble
in non-polar solvents and imparts a bright yellow/orange color
to chloroform, was added to permit visualization of the
chloroform phase and provide an indication of the degree of
miscibility between the polar and non-polar phases. None of
the tubes exhibited biphasic separation at this point. An
additional 0.20 mL of water was added to each tube to drive
phase separation and each tube was centrifuged to make the
phase separation more distinct.
No obvious phase separation occurred at the lowest chloro-
form volumes (0.1 and 0.2 mL), even after centrifugation. For
tubes that did show separation, the chloroform phase was
recovered and measured. Chloroform volumes over 0.4 mL all
had similar recovery rates. Due to partial miscibility between
chloroform and methanol, some of the dye was still visible in
the aqueous phase. Similarly, the volume of the chloroform
Figure 4. Increasing volumes of chloroform and 0.75 mL aliquots of 80:20methanol/water were mixed to simulate the extraction step. An additional0.20 mL of water was subsequently added to help drive phase separation.Sudan I, a lipid-soluble diazo dye was added to aid visualization of phaseseparation. Color banding within the aqueous (upper) half is due torediffusion of chloroform into the aqueous phase.
4
M E T A B O L O M I C SO N C H N S C O H P C N S H C O
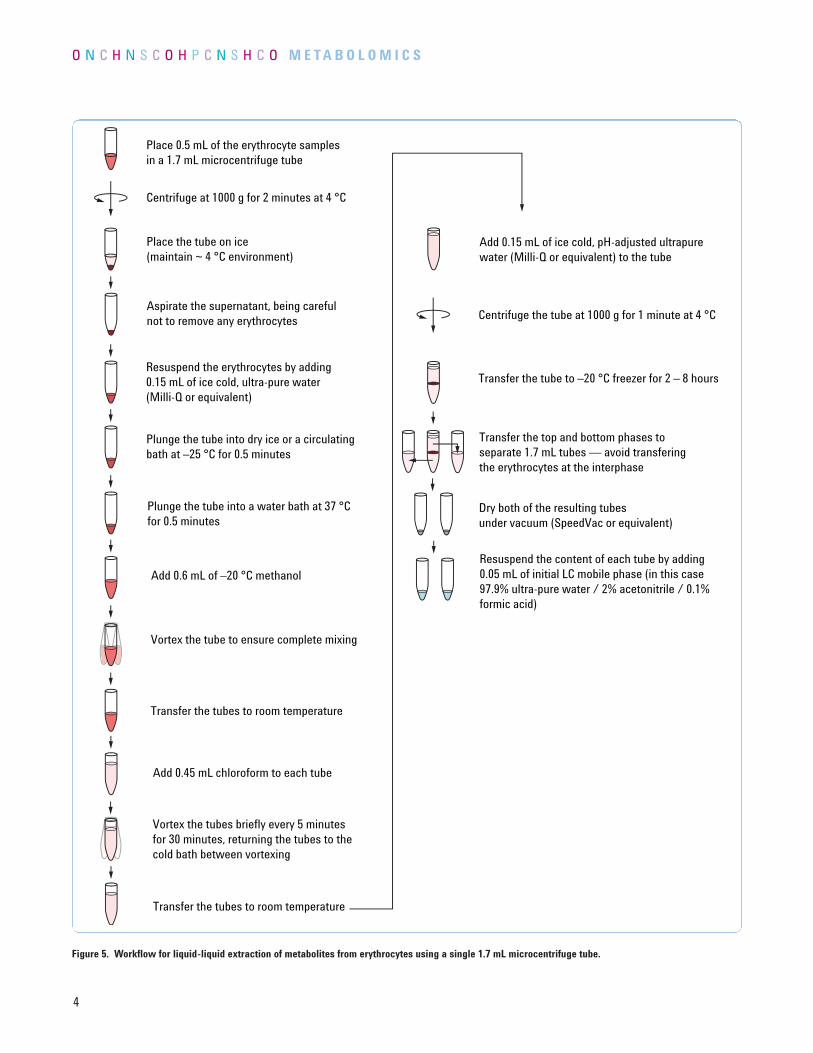
Figure 5. Workflow for liquid-liquid extraction of metabolites from erythrocytes using a single 1.7 mL microcentrifuge tube.
Place 0.5 mL of the erythrocyte samples in a 1.7 mL microcentrifuge tube
Centrifuge at 1000 g for 2 minutes at 4 °C
Plunge the tube into dry ice or a circulatingbath at –25 °C for 0.5 minutes
Place the tube on ice (maintain ~ 4 °C environment)
Plunge the tube into a water bath at 37 °C for 0.5 minutes
Aspirate the supernatant, being careful not to remove any erythrocytes
Resuspend the erythrocytes by adding 0.15 mL of ice cold, ultra-pure water(Milli-Q or equivalent)
Add 0.6 mL of –20 °C methanol
Vortex the tube to ensure complete mixing
Add 0.45 mL chloroform to each tube
Vortex the tubes briefly every 5 minutesfor 30 minutes, returning the tubes to the cold bath between vortexing
Transfer the tubes to room temperature
Centrifuge the tube at 1000 g for 1 minute at 4 °C
Transfer the tube to –20 °C freezer for 2 – 8 hours
Transfer the top and bottom phases to separate 1.7 mL tubes — avoid transferingthe erythrocytes at the interphase
Transfer the tubes to room temperature
Add 0.15 mL of ice cold, pH-adjusted ultrapure water (Milli-Q or equivalent) to the tube
Resuspend the content of each tube by adding 0.05 mL of initial LC mobile phase (in this case 97.9% ultra-pure water / 2% acetonitrile / 0.1% formic acid)
Dry both of the resulting tubes under vacuum (SpeedVac or equivalent)
www.agilent.com/chem/metabolomics 5
Application Note Maximizing Metabolite Extraction for Comprehensive Metabolomics Studies of Erythrocytes
0.15 mL of ice cold, ultrapure (Milli-Q) water was added to
each tube to resuspend the erythrocytes. The tubes were
plunged into a circulating bath at –25 °C for 0.5 minutes and
then into a water bath at 37 °C for 0.5 minutes to quench
metabolism and lyse the cells.
0.6 mL of –20 °C methanol was added to each tube and the
tubes were vortexed to ensure complete mixing. The tubes
were transferred to a circulating bath at –25 °C. Differing
amounts of chloroform, from 0.35 mL to 0.60 mL in 0.05 mL
increments, were added to each tube (Table 1). The tubes
were vortexed briefly every 5 minutes for 30 minutes, returning
the tubes to the cold bath between vortexings. The tubes were
transferred to room temperature and 0.15 mL of ice cold,
ultrapure water was added to each tube to drive the phase
separation. 0.15 mL was used instead of the 0.2 mL specified
in the first experiment, because the erythrocytes take up
volume in the tubes. The tubes were centrifuged at 1000 g for
1 minute at 4 °C so a clear separation of the two phases could
be observed above and below the compact disk of erythro-
cytes. The tubes were transferred to a –20 °C freezer and kept
there overnight to allow residual chloroform to precipitate out
of the aqueous methanol phase.
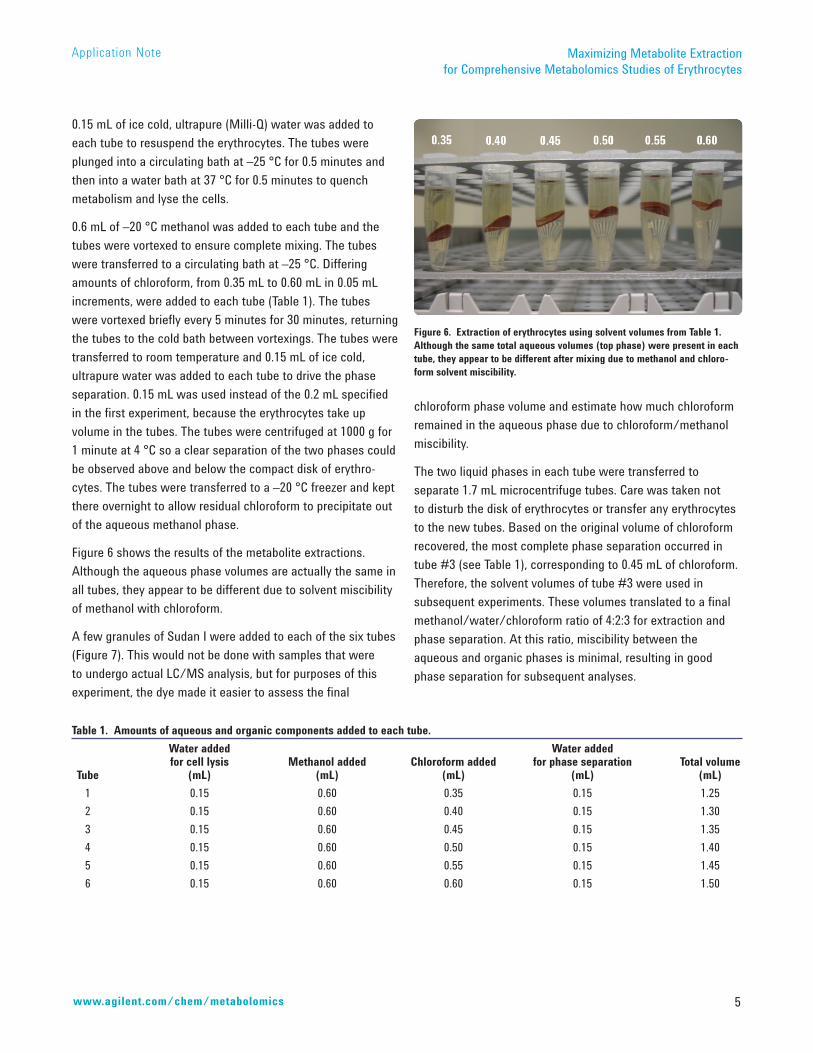
Figure 6 shows the results of the metabolite extractions.
Although the aqueous phase volumes are actually the same in
all tubes, they appear to be different due to solvent miscibility
of methanol with chloroform.
A few granules of Sudan I were added to each of the six tubes
(Figure 7). This would not be done with samples that were
to undergo actual LC/MS analysis, but for purposes of this
experiment, the dye made it easier to assess the final
Table 1. Amounts of aqueous and organic components added to each tube.
Water added Water added for cell lysis Methanol added Chloroform added for phase separation Total volume
Tube (mL) (mL) (mL) (mL) (mL)
1 0.15 0.60 0.35 0.15 1.25
2 0.15 0.60 0.40 0.15 1.30
3 0.15 0.60 0.45 0.15 1.35
4 0.15 0.60 0.50 0.15 1.40
5 0.15 0.60 0.55 0.15 1.45
6 0.15 0.60 0.60 0.15 1.50
chloroform phase volume and estimate how much chloroform
remained in the aqueous phase due to chloroform/methanol
miscibility.
The two liquid phases in each tube were transferred to
separate 1.7 mL microcentrifuge tubes. Care was taken not
to disturb the disk of erythrocytes or transfer any erythrocytes
to the new tubes. Based on the original volume of chloroform
recovered, the most complete phase separation occurred in
tube #3 (see Table 1), corresponding to 0.45 mL of chloroform.
Therefore, the solvent volumes of tube #3 were used in
subsequent experiments. These volumes translated to a final
methanol/water/chloroform ratio of 4:2:3 for extraction and
phase separation. At this ratio, miscibility between the
aqueous and organic phases is minimal, resulting in good
phase separation for subsequent analyses.
Figure 6. Extraction of erythrocytes using solvent volumes from Table 1.Although the same total aqueous volumes (top phase) were present in eachtube, they appear to be different after mixing due to methanol and chloro-form solvent miscibility.

6
M E T A B O L O M I C SO N C H N S C O H P C N S H C O
Figure 7. Sudan I was added to the tubes to help visualize the chloroformphase and estimate the extent of mixing with methanol/water.
The test samples in experiment 2 did not undergo further
analysis by LC/MS, but for actual samples, at this point the
two tubes would undergo drying under vacuum. The contents
would then be resuspended in the initial LC mobile phase.
Extraction at multiple aqueous-phase pHs
The third experiment was performed to determine the extent
to which aqueous-phase pH affects extraction of non-targeted
metabolites, and to determine if performing extractions at
multiple pH levels could improve metabolite coverage.
Three 50 mL Erlenmeyer flasks were filled with ultrapure
(Milli-Q) water. One of the flasks was acidified with concen-
trated formic acid to achieve a final 1% formic acid con-
centration at pH 2. Similarly, in the second flask, a 30%
concentrated solution of ammonium hydroxide was diluted
with ultrapure water to a final concentration of 2% ammonium
hydroxide, yielding pH 9. The third flask was left at an
uncontrolled neutral pH 7.
Three erythrocyte samples were prepared using the workflow
outlined in Figure 5. The solvent volumes and ratios previously
determined to provide optimum separation were used. During
initial resuspension (step 4), one sample was resuspended
with 0.15 mL of the water and formic acid at pH 2. One sample
was resuspended with 0.15 mL of ultrapure water at neutral
pH. One sample was resuspended with 0.15 mL of water and
ammonium hydroxide at pH 9.
At the end of the extraction and phase separation process, the
aqueous phase of each sample was dried under vacuum and
then reconstituted in the initial LC mobile phase for analysis.
Data acquisition and analysis
All three samples were analyzed using an LC/MS system
consisting of an Agilent 1100 Series liquid chromatograph
coupled to an Agilent 6210 Time-of-Flight LC/MS equipped
with an electrospray ion source. The TOF system used external
reference mass correction with ions at m/z 121.050873 and
m/z 922.009798 to ensure the best possible mass accuracy.
The molecular feature extraction (MFE) algorithm in the
Agilent MassHunter Workstation software was used to find
the molecular features—unidentified, untargeted compounds
—in each of the three data files. The MFE algorithm looks for
mass signals (ions) that are co-variant in time, considers likely
chemical relationships (isotopes, adducts, dimers, multiple
charge states), and generates an extracted compound chroma-
togram and compound mass spectrum for each molecular
feature. This approach finds compounds that are poorly
resolved chromatographically and increases the total number
of compounds found. The result was a list of features
(compounds) in each sample, with related chromatograms
and mass spectra for all features.
LC Conditions
Column: Zorbax SB-Aq, 2.1 x 150 µm, 3.5 µm
Flow rate: 0.4 mL/min
Column temperature: 20 °C
Injection volume: 2.0 µL
Mobile phase: A: 0.1% formic acid in water
B: 0.1% formic acid in acetonitrile
Gradient: 2% B at 0.0 min
100% B at 28.0 min
Stop Run at 30.0 min
MS Conditions
Ionization mode: Positive electrospray
Drying gas flow: 10 L/min
Drying gas temp.: 250 °C
Nebulizer: 40 psig
Vcap: 4000 V
Max mass: 1700
Ref. mass flow rate: 10 µL/min
Scan range: m/z 50–1000
Acquisition rate: 2 Hz
www.agilent.com/chem/metabolomics 7
Application Note Maximizing Metabolite Extraction for Comprehensive Metabolomics Studies of Erythrocytes
To identify the solvent-extracted compounds in each sample,
the three feature lists were queried against Agilent’s METLIN
Personal metabolite database. The METLIN database,
compiled by the Center for Mass Spectrometry at the Scripps
Research Institute, contains mass spectral data, chemical
formulas, and structures for over 15,000 endogenous and
exogenous metabolites, as well as di- and tri-peptides.
Compounds that generated matches (mass agreement closer
than 10 ppm) in the METLIN database, were imported into a
Microsoft Excel spreadsheet.
Figure 8 shows a bar graph of the total number of compounds
extracted at each pH. There was a significant difference in the
number of extracted compounds, particularly between pH 7
and pH 9, which exhibited a two-fold increase in the number
of compounds found. The raw numbers in Figure 8 reflect
some redundancies, including instances where a feature
matched multiple compounds with identical masses in the
METLIN database. Each of the three compound (mass) lists
was filtered separately in Microsoft Excel to remove such
redundancies. The result was three compound lists in which
a particular compound (mass) appeared only once per pH list.
This enabled direct 1:1 comparison of compounds extracted at
more than one pH.
Next, the three compound lists were merged to create a single
non-redundant compound library. The library was imported
into Agilent’s GeneSpring MS data analysis software along
with the three lists containing the compounds extracted at
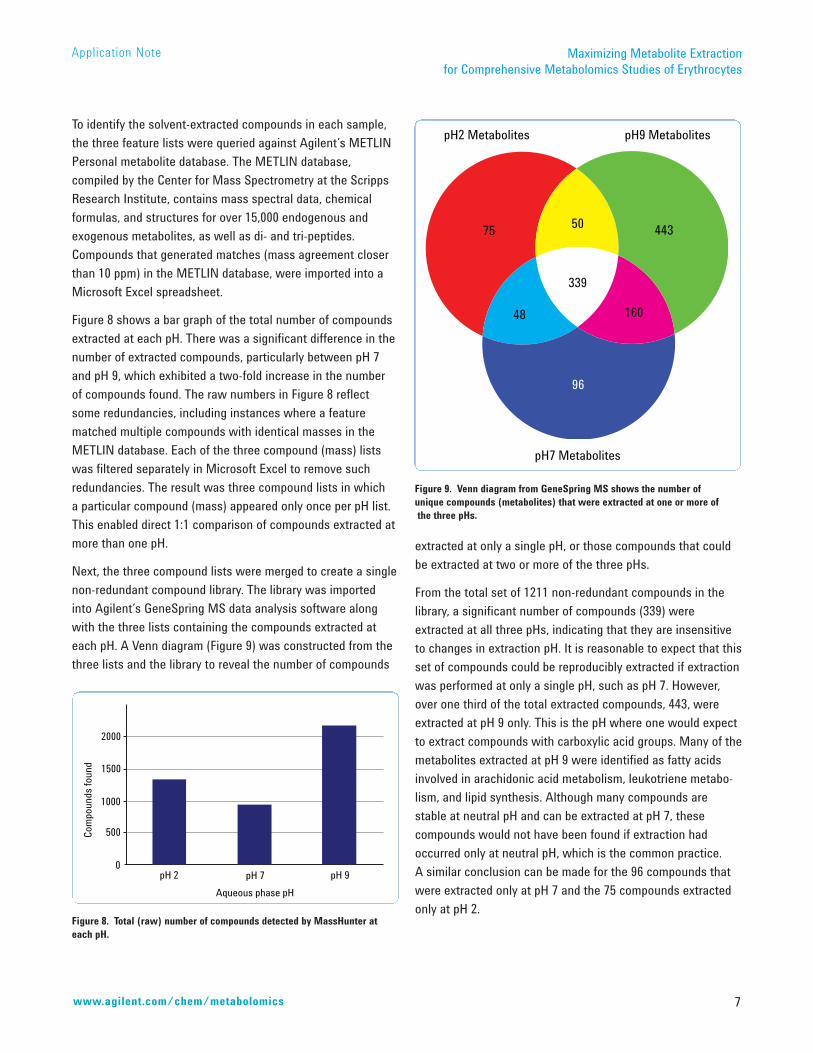
each pH. A Venn diagram (Figure 9) was constructed from the
three lists and the library to reveal the number of compounds
extracted at only a single pH, or those compounds that could
be extracted at two or more of the three pHs.
From the total set of 1211 non-redundant compounds in the
library, a significant number of compounds (339) were
extracted at all three pHs, indicating that they are insensitive
to changes in extraction pH. It is reasonable to expect that this
set of compounds could be reproducibly extracted if extraction
was performed at only a single pH, such as pH 7. However,
over one third of the total extracted compounds, 443, were
extracted at pH 9 only. This is the pH where one would expect
to extract compounds with carboxylic acid groups. Many of the
metabolites extracted at pH 9 were identified as fatty acids
involved in arachidonic acid metabolism, leukotriene metabo-
lism, and lipid synthesis. Although many compounds are
stable at neutral pH and can be extracted at pH 7, these
compounds would not have been found if extraction had
occurred only at neutral pH, which is the common practice.
A similar conclusion can be made for the 96 compounds that
were extracted only at pH 7 and the 75 compounds extracted
only at pH 2.
1000
2000
1500
500
0pH 2 pH 7 pH 9
Aqueous phase pH
Com
poun
ds fo
und
Figure 8. Total (raw) number of compounds detected by MassHunter ateach pH.
75 50 443
48
339
160
96
pH2 Metabolites pH9 Metabolites
pH7 Metabolites
Figure 9. Venn diagram from GeneSpring MS shows the number of unique compounds (metabolites) that were extracted at one or more ofthe three pHs.

M E T A B O L O M I C SO N C H N S C O H P C N S H C O Application Note
About Agilent Technologies
Agilent Technologies is a leading supplier of life science
research systems that enable scientists to understand
complex biological processes, determine disease
mechanisms, and speed drug discovery. Engineered for
sensitivity, reproducibility, and workflow productivity,
Agilent's life science solutions include instrumentation,
microfluidics, software, microarrays, consumables, and
services for genomics, proteomics, and metabolomics
applications.
Learn more:www.agilent.com/chem/metabolomics
Buy online:www.agilent.com/chem/store
Find an Agilent customer center in your country:www.agilent.com/chem/contactus
U.S. and Canada [email protected]
Asia [email protected]
For Research Use Only. Not for use in diagnostic procedures. Information, descriptions, and specifications in this publication are subject to change without notice.
Agilent Technologies shall not be liable for errors contained herein or for incidental or consequential damages in connection with the furnishing, performance or use of this material.
© Agilent Technologies, Inc. 2007
Printed in the U.S.A. October 31, 2007
5989-7407EN
ConclusionThis work demonstrates a liquid-liquid extraction protocol in
microcentrifuge tubes as a viable approach to the extraction
of metabolites from erythrocytes. The correct ratio of aqueous
and organic solvents is essential to achieving a good balance
between quenching metabolism at a high organic solvent ratio
and biphasic solvent partitioning after the addition of extra
water. Biphasic partitioning allows polar and non-polar
metabolites to be recovered separately. Finally, extraction of
metabolites at multiple pHs (e.g. pH 2, 7, and 9) dramatically
increases the number of unique metabolites found. For this
particular sample, over 45% of the unique metabolites
extracted would not have been recovered if the extraction had
been performed only at a single, neutral pH—the common
practice in the field today.
References1. Folch, J., Lees, M. and Stanley, G.H.S. Preparation of lipid
extracts from brain tissue. J. Biol. Chem., 226, 497–509
(1957).
2. Bligh, E.G. and Dyer, W.J. A rapid method of total lipid
extraction and purification. Can. J. Biochem. Physiol., 37,
911–917 (1959).
3. Green, Floyd J., The Sigma-Aldrich Handbook of Stains, Dyes,
and Indicators, ©1990, Aldrich Chemical Company, Inc.,
Milwaukee, Wisconsin.