mcgill university pension plan · pdf fileuniversity pension plan (“plan”) for the...
TRANSCRIPT

McGill UniversityPension PlanAnnual ReportDecember 31, 2012
Members of the Pensionadministration committee ccommitteeProfessor Reuven Brenner Representing Academic Staff
Mr. Étienne Brodeur Independent Member (until October 2012)
Ms. Lynne B. Gervais (Chair) Representing the Principal & Chair of the Board
Ms. Kim Holden Representing the Board of Governors
Mr. Michael Keenan Representing the Board of Governors
Mr. Pierre Lavigne Independent Member (from January 1, 2013)
Professor Gerald Ratzer Representing Academic Staff
Dr. Saul Ticktin Representing Administrative & Support Staff
Ms. Cristiane Tinmouth Representing the Principal & Chair of the Board
Ms. Kathleen Tobin Representing Administrative & Support Staff
Annual Report and Financial Report for the fiscal year ended December 31, 2012

Table ofcontents
NOTICE OF ANNUAL MEETING 1
INTRODUCTION 2
FUND INVESTMENTS 3
THE ACCUMULATION FUND 3 Asset Allocation 3 Investment Management 6 Market and Fund Performance 6 Investment Manager Performance 8 • Equity Pool 8 • Fixed Income Pool 13 • Socially Responsible Investment Pool 14 • Money Market Pool 15 Unit Values 16
THE PENSIONER FUND 17 Asset Allocation 17 Investment Management 17 Performance 18
BENEFITS AND ADMINISTRATIVE MATTERS 19 Plan Amendments 19 2012 Benefit Payments 19 Annuity Dividends 19 Annuity Dividend Valuation 20 Actuarial Valuation of the Plan 21 Administration 21 Contact Us 22
APPENDIX I – RETIREMENTS 24
APPENDIX II – DEATHS 25
APPENDIX III – UNIT VALUE HISTORY 27
APPENDIX IV – EXECUTIVE SUMMARY OF THE ACTUARIAL VALUATION 29
APPENDIX V – GLOSSARY 31
INDEPENDENT AUDITORS’ REPORT 34
FINANCIAL REPORT 36

1
M c G I L L U N I V E R S I T Y P E N S I O N P L A N
McGill UniversityPension PLanNotice of Annual Meeting of Pension Plan MembersThe Annual Meeting of Members of the McGill University Pension Plan will be held in Room 232 of the Stephen Leacock Building, 855 Sherbrooke Street West, Montreal, Quebec on Friday, the 3rd day of May, 2013 at noon for the purposes of:
(a) tallying and announcing the voting results – continuance of voting procedures;
(b) electing one Academic Staff representative, who is a member of the Plan as of December 31, 2012 to the Pension Administration Committee;
(c) electing one Administrative & Support Staff representative, who is a member of the Plan as of December 31, 2012 to the Pension Administration Committee;
(d) receiving the financial report of the McGill University Pension Plan for the year ended December 31, 2012 and the independent auditor’s report thereon;
(e) receiving the stewardship report of the Pension Administration Committee;
(f) receiving the investment performance report of the McGill University Pension Plan for the year ended December 31, 2012, including the: • Accumulation Fund; • Pensioner Fund; and
(g) conducting such other business as shall be properly brought before the assembly.
Attendance at the meeting shall be restricted to active and inactive members of the Plan, including beneficiaries. All attendees are requested to bring one of the following valid pieces of identification:
u McGill University Identification Card
u Personal Statement of Holdings as of December 31, 2012
u Personal Mail Ballot/Proxy Form
If you have not executed and returned the personal Mail Ballot/Proxy Form issued in your name, you are requested to bring this document to the meeting with you for identification and voting purposes.
John D’Agata Secretary, Pension Administration Committee April 2013

2
M c G I L L U N I V E R S I T Y P E N S I O N P L A N
Introduction41st annUaL rePort
This Annual Report reviews and highlights the investment and administrative activities of the Pension Administration Committee (“PAC”) of the McGill University Pension Plan (“Plan”) for the fiscal year ended December 31st, 2012.
StructureThe Committee is composed of nine members, of which four are elected by the members of the Plan, two are designated by the Board of Governors and two are designated by the Principal and the Chair of the Board. One independent member is appointed by the Board of Governors acting upon the recommendation of the PAC.
PAC Membership Changes in 2012The following changes occurred in the membership of the PAC during the year. At the Annual Meeting held on May 4th, 2012, Professor Reuven Brenner was acclaimed to a new three-year term as Academic Staff Representative. In March 2012, Mr. Warren Simpson’s term as Board of Governors Representative ended and he was replaced by Mr. Michael Keenan. In October 2012, Mr. Étienne Brodeur, the Independent Member resigned his position and was replaced by Mr. Pierre Lavigne in January 2013.
ResponsibilitiesAs trustees of the Pension Plan, the members of the PAC have fiduciary responsibility for ensuring that investments are made on a prudent basis and in accordance with the demographic profile of its members and the financial needs of the membership. The PAC is also responsible for all administrative matters pertaining to the provision of benefits as set forth in the Plan Document and acts within the framework of legislation and regulations issued under the Supplemental Pension Plans Act of the Province of Quebec and the Income Tax Act of Canada. These responsibilities are discharged through regular meetings of the PAC and through a network of external advisors, consultants and the staff of Pension Administration and the Office of Investments. During 2012, there were eight meetings of the full PAC and a number of informal working group meetings. An internal support staff acting under the direction and guidance of the PAC carry out the daily investment and administrative operations of the Plan.
Pension Investment Committee (“PIC”)The fundamental role of the PIC is to develop detailed investment policies and set investment strategy that is recommended to the PAC for approval.
The PIC is responsible for overseeing the implementation of investment policy. It consists of two non-voting members from the PAC, the Chair of the PAC as ex-officio and five independent external members who are not part of McGill (“University”) administration or staff and who are not members of another decision-making body within the pension plan governance structure.
3
M c G I L L U N I V E R S I T Y P E N S I O N P L A N
The current members of the PIC are: Mr. Mark Smith, Chair; Professor Reuven Brenner (PAC); Mr. Stephen Cotsman; Ms. Lynne B. Gervais (Chair of PAC); Mr. Russell Hiscock; Ms. Kim Holden (PAC); and Mr. Scott Taylor. PIC members, who are appointed by the PAC, serve a first term of three years, renewable for a second term of two years and are limited to a maximum of two consecutive terms.
In 2013, Mr. François Lemarchand will be appointed to the PIC replacing Ms. Maureen Farrow whose term ended in 2012.
The PAC and the PIC would like to express their sincere appreciation and thanks to Ms. Farrow for her contributions to the PIC.
During 2012, there were five regular meetings of the PIC as well as two teleconference calls.
Fund investments The assets of the Pension Fund are invested in three separate investment portfolios in accordance with the three liability segments of the Plan:
u assets in respect of active staff members are invested prior to retirement in the Accumulation Fund,
u assets in respect of retired members who have opted for an internal settlement are invested in the Pensioner Fund, and
u University contributions necessary to provide any supplementary pensions required to meet the provisions of the Defined Benefit Minimum Provision as well as to ensure adequate funding of the Pension Fund are invested in the Supplemental Fund.
The PAC has adopted a comprehensive Statement of Investment Policy which addresses such issues as investment objectives, risk tolerance, asset allocation, permissible asset classes, investment diversification, liquidity requirements, expected rates of return, valuation procedures and other issues relevant to the investment process, thereby establishing a framework within which all the investment managers must operate.
The policy is reviewed on a regular basis and updated when necessary to ensure that it continues to meet legal standards and the investment requirements of the membership. A copy of the policy, most recently updated in November 2012, can be found on the Plan’s website at: http://www.mcgill.ca/hr/bp/pensions/invest/SIP or can be viewed in the offices of the PAC, during normal business hours.
The Accumulation fUndThe Accumulation Fund, consisting of an Equity Pool, a Fixed Income Pool, a Socially Responsible Investment (SRI) Pool, and a Money Market Pool, is the section of the Pension Fund in which the assets of active members are invested prior to retirement. This structure offers a wide range of possible financial strategies and will allow mem-bers to create the specific investment strate gies that will best respond to their financial needs.
The PAC also maintains a Balanced Account that consists of allocations to the Equity Pool and the Fixed Income Pool. The current policy target provides that 65% of the assets of the Balanced Account are allocated to the Equity Pool and
35% are allocated to the Fixed Income Pool. The calculation of the Defined Benefit Minimum Provision, as applicable, is compared to the performance of the Balanced Account.
The investment objectives for the Equity Pool, Fixed Income Pool, SRI Pool, Money Market Pool, as well as the Balanced Account are disclosed in Appendix V.
Asset AllocationThe strategic asset allocation for the Balanced Account as well as the other investment pools is reviewed and adjusted periodically by the PAC

4
M c G I L L U N I V E R S I T Y P E N S I O N P L A N
(as recommended by the PIC) on the basis of a continuing review of the economic, political and financial factors which influence investment markets.
As the performances of individual managers and markets cause the asset classes to deviate from the strategic asset allocation, the assets are rebalanced regularly to bring the asset classes back within the parameters of the strategic asset allocation. Such rebalancing is achieved through directed cash flow or by actively transferring funds among managers when specified trigger points are reached.
Plan members allocate the majority of their assets to the Balanced Account. Schedule 1 provides the strategic asset allocation policy of the Balanced Account. The actual allocation of the Balanced
Account at December 31, 2012, was 67.8% to the Equity Pool and 32.2% to the Fixed Income Pool. Related benchmarks and the actual asset allocation of the Balanced Account at December 31, 2012 are also shown in Schedule 1.
The benchmarks for cash and cash equivalents, equity, fixed income and gold asset classes were selected because all are publicly available and readily investable indices. The real estate benchmark is an absolute return expectation in excess of the rate of inflation. The private equity benchmark reflects the additional return that private equity is expected to achieve over and above the public equity markets. The absolute return strategies benchmark reflects the additional return the asset class is expected to achieve in excess of the DEX 30-Day T-Bill return.
Balanced Account – Asset Allocation as at December 31, 2012 Strategic Actual Asset Balanced Allocation Account Asset Class Benchmark (%) (%) MIN% MID% MAX%
Equity Pool
Cash & Cash Equivalents: DEX 30-Day T-Bill 0 0.1 0 0 5
Currency Forward Contracts: Not applicable - 0.1 - - -
Canadian Equities: S&P/TSX Composite 15 15.2 12 15 18
US Equities: S&P 500 11 11.0 9 11 13
Non-North American Equities: MSCI EAFE 5 6.3 3 5 7 MSCI EM 6 7.4 4 6 8
Global Equities: MSCI World High Dividend 8 8.4 4 8 12
Alternative Equities: Real Estate 4% + CPI 5 3.9 3 5 7 Private Equity (2/3 S&P500 + 1/3 MSCI Europe) + 5% 8 5.0 4 8 10 Absolute Return Strategies DEX 30-Day T-Bill + 5% 7 7.9 4 7 10 Gold London Gold Spot Price 0 2.5 - - -
65% 67.8% 65%
Fixed Income Pool
Cash & Cash Equivalents: DEX 30-Day T-Bill 0 0.8 0 0 5
Bonds: DEX Universe Bond 25 23.9 15 25 35 DEX Real Return 5 4.9 2 5 8 ML Global HY (hedged) 5 2.6 2 5 8
35% 32.2% 35%
Balanced Account 100% 100.0% 100%
sche
dULe
1
sche
dULe
2

5
M c G I L L U N I V E R S I T Y P E N S I O N P L A N
The actual asset allocations within the Accumu-lation Fund at any particular time will reflect the strate gic asset allocation policy with respect to the Balanced Account and the separate asset allocation policies followed by members who utilize an investment strategy other than the Balanced Account.
The actual management and asset allocation structure of the Accumulation Fund as at December 31, 2012 are shown in Schedule 2.
Accumulation Fund – Asset Allocation and Manager Structure – December 31, 2012 Amount % of PoolAsset Class Manager (millions) Holdings
Equity Pool
Cash & Cash Equivalents: TD Asset Management $ 3.2 0.5%
Currency Forward Contracts: TD Asset Management 0.6 0.1%
Canadian Equities: State Street Global Advisors 78.1 11.5% Pyramis Global Advisors 29.4 4.3% Van Berkom & Associates 43.8 6.5%
US Equities: State Street Global Advisors 110.0 16.3%
Non-North American Equities: Hexavest 34.5 5.1% William Blair & Company 35.9 5.3% Aberdeen Asset Management 61.8 9.1% Internal 4.4 0.6%
Global Equities: State Street Global Advisors 83.4 12.3%
Real Estate: External 39.4 5.8%Private Equity: External 49.2 7.3%Absolute Return Strategies: External 79.0 11.7% Gold: Internal 24.4 3.6%
Total Equity Pool: $ 677.1 100.0%
Fixed Income Pool
Cash & Cash Equivalents: TD Asset Management $ 9.4 2.7%
Real-Return Bonds: Phillips, Hager & North 52.1 15.2%
High-Yield Bonds: Phillips, Hager & North 27.6 8.0%DEX Universe Bonds: Phillips, Hager & North 124.0 36.1% TD Asset Management 85.4 24.8%
DEX Corporate Bonds: Canso Investment Counsel 45.2 13.2%
Total Fixed Income Pool: $ 343.7 100.0%
SRI Pool Guardian Ethical Management $ 15.5 100.0%
Money Market Pool
Cash & Cash Equivalents: TD Asset Management $ 16.7 100.0%
Total Accumulation Fund: $ 1,053.0
sche
dULe
2

6
M c G I L L U N I V E R S I T Y P E N S I O N P L A N
Investment Management The following investment manager changes were made in 2012:
In January 2012, a new Gold asset class was established with the purchase of units of a gold-exchange traded fund.
From January through June 2012, an additional $43.3 million was allocated to six new investments managers in the Absolute Return Strategies asset class.
In June 2012, Jarislowsky Fraser’s Canadian equity mandate was eliminated and the assets were used to fund State Street Global Advisor’s indexed mandate in the newly created Global Equity asset class.
In July 2012, Phillips, Hager & North’s short-term bond mandate was replaced with an active DEX Universe bond mandate.
In November 2012, the Plan’s holdings in MAV II notes were sold.
In December 2012, commitments in the amounts of € 15 million and US $20 million respectively were made to two private equity funds investing in leveraged buyouts and mezzanine securities, respectively.
PerformanceMARket PeRFoRMAnce
Public market performance returns, when expressed in Canadian dollars, were generally positive in 2012. The S&P/TSX Composite Index returned 7.2% for the year. Seven out of the ten Canadian sectors recorded positive returns, with the Financials sector accounting for more than two-thirds of the positive performance. The S&P/TSX SmallCap Index, the measure of small cap performance, was down 2.2% during the year. The DEX Universe Bond Index gained 3.6%, while the DEX Real-Return Bond Index gained 2.9% for the year.
The Canadian dollar appreciated 3.0% versus the US dollar during the year, after depreciating 2.4% in 2011. In Canadian dollar terms, the S&P 500 returned 13.4% for the year outperforming the Canadian market for a second year in a row. Non-North American markets represented by the MSCI EAFE Index and the MSCI EM Index
finished the year, in Canadian dollar terms, with returns of 15.3% and 16.0%, respectively.
FunD PeRFoRMAnce
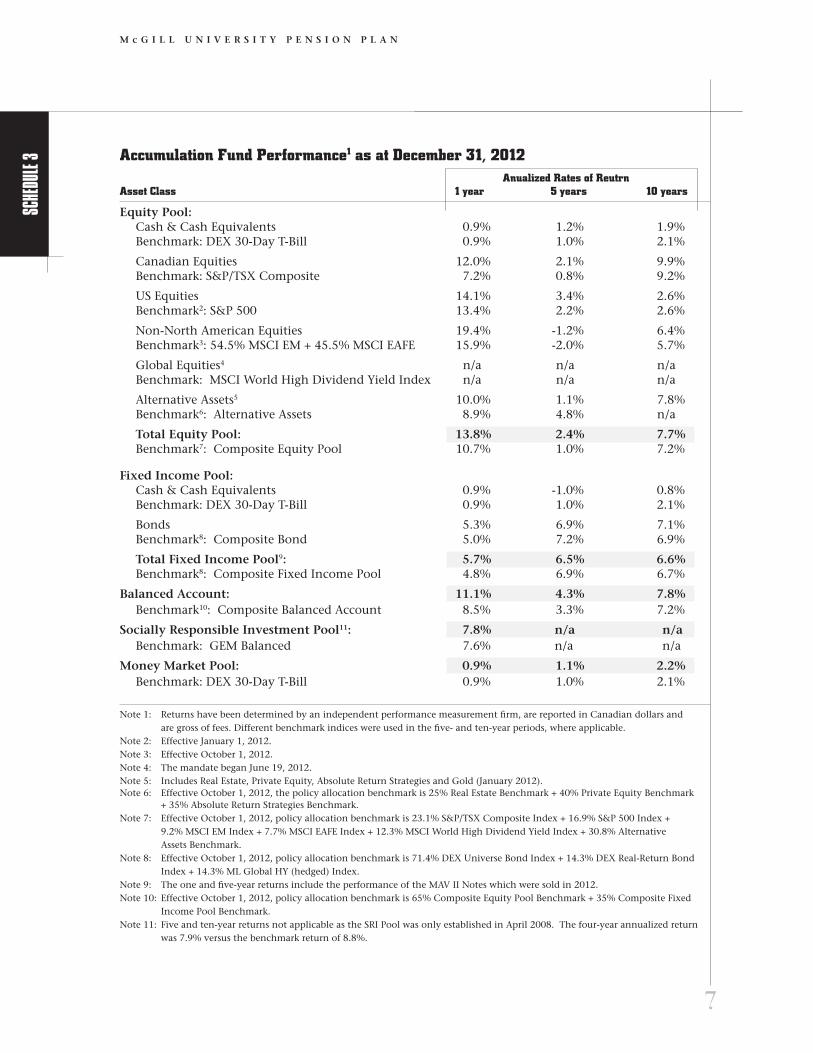
Schedule 3 shows the gross rates of market returns achieved by the various asset classes comprising each of the investment pools and by the Balanced Account for the one, five and ten year periods ended December 31, 2012. The applicable bench-mark performance for each asset class is also noted in Schedule 3.
The Equity Pool returned 13.8% for the year in comparison to its composite benchmark of 10.7%. The Canadian equity performance of 12.0% was significantly above the S&P/TSX Composite Index benchmark of 7.2%. The US equity performance of 14.1% was above the S&P 500 benchmark perfor mance of 13.4% for the year, while the non-North American equity performance of 19.4%, was ahead of its composite benchmark of 15.9%. The perfor-mance of alter native equity assets at 10.0% out-performed its composite benchmark of 8.9%.
A global equity asset class was introduced in June 2012. The return for the last six months of 2012 was 6.4% versus the 6.1% return of its benchmark, the MSCI World High Dividend Index.
The Fixed Income Pool returned 5.7% for the year, surpassing the 4.8% return of its composite benchmark.
The Balanced Account’s performance of 11.1% for the year outperformed its composite benchmark return of 8.5%.
The SRI Pool’s performance of 7.8% in 2012 slightly exceeded the 7.6% return of its benchmark, the GEM Balanced Benchmark.
The Money Market Pool returned 0.9% for the year, equalling the return of the DEX 30-Day T-Bill Index.
sche
dULe
3
7
M c G I L L U N I V E R S I T Y P E N S I O N P L A N
Accumulation Fund Performance1 as at December 31, 2012 Anualized Rates of Reutrn Asset Class 1 year 5 years 10 years
Equity Pool:Cash & Cash Equivalents 0.9% 1.2% 1.9% Benchmark: DEX 30-Day T-Bill 0.9% 1.0% 2.1%
Canadian Equities 12.0% 2.1% 9.9% Benchmark: S&P/TSX Composite 7.2% 0.8% 9.2%
US Equities 14.1% 3.4% 2.6% Benchmark2: S&P 500 13.4% 2.2% 2.6%
Non-North American Equities 19.4% -1.2% 6.4% Benchmark3: 54.5% MSCI EM + 45.5% MSCI EAFE 15.9% -2.0% 5.7%
Global Equities4 n/a n/a n/a Benchmark: MSCI World High Dividend Yield Index n/a n/a n/a
Alternative Assets5 10.0% 1.1% 7.8% Benchmark6: Alternative Assets 8.9% 4.8% n/a
Total Equity Pool: 13.8% 2.4% 7.7% Benchmark7: Composite Equity Pool 10.7% 1.0% 7.2%
Fixed Income Pool:Cash & Cash Equivalents 0.9% -1.0% 0.8% Benchmark: DEX 30-Day T-Bill 0.9% 1.0% 2.1%
Bonds 5.3% 6.9% 7.1% Benchmark8: Composite Bond 5.0% 7.2% 6.9%
Total Fixed Income Pool9: 5.7% 6.5% 6.6% Benchmark8: Composite Fixed Income Pool 4.8% 6.9% 6.7%
Balanced Account: 11.1% 4.3% 7.8% Benchmark10: Composite Balanced Account 8.5% 3.3% 7.2%
Socially Responsible Investment Pool11: 7.8% n/a n/a Benchmark: GEM Balanced 7.6% n/a n/a
Money Market Pool: 0.9% 1.1% 2.2% Benchmark: DEX 30-Day T-Bill 0.9% 1.0% 2.1%
Note 1: Returns have been determined by an independent performance measurement firm, are reported in Canadian dollars and are gross of fees. Different benchmark indices were used in the five- and ten-year periods, where applicable.Note 2: Effective January 1, 2012.Note 3: Effective October 1, 2012.Note 4: The mandate began June 19, 2012.Note 5: Includes Real Estate, Private Equity, Absolute Return Strategies and Gold (January 2012).Note 6: Effective October 1, 2012, the policy allocation benchmark is 25% Real Estate Benchmark + 40% Private Equity Benchmark + 35% Absolute Return Strategies Benchmark.Note 7: Effective October 1, 2012, policy allocation benchmark is 23.1% S&P/TSX Composite Index + 16.9% S&P 500 Index + 9.2% MSCI EM Index + 7.7% MSCI EAFE Index + 12.3% MSCI World High Dividend Yield Index + 30.8% Alternative Assets Benchmark.Note 8: Effective October 1, 2012, policy allocation benchmark is 71.4% DEX Universe Bond Index + 14.3% DEX Real-Return Bond
Index + 14.3% ML Global HY (hedged) Index.Note 9: The one and five-year returns include the performance of the MAV II Notes which were sold in 2012.Note 10: Effective October 1, 2012, policy allocation benchmark is 65% Composite Equity Pool Benchmark + 35% Composite Fixed
Income Pool Benchmark.Note 11: Five and ten-year returns not applicable as the SRI Pool was only established in April 2008. The four-year annualized return was 7.9% versus the benchmark return of 8.8%.
sche
dULe
3
8
M c G I L L U N I V E R S I T Y P E N S I O N P L A N
The key to performance is meeting the long-term investment objectives that are specific to the Pension Fund.
As shown in the following table, the perfor-mances of the Equity Pool, Fixed Income Pool, Balanced Account and Money Market Pool
surpassed their respective long-term objectives as at December 31, 2012, measured over no less than ten years.
For the four-year period ending December 31, 2012, the SRI Pool returned 7.9% versus its long-term objective of 5.0% for the same period.
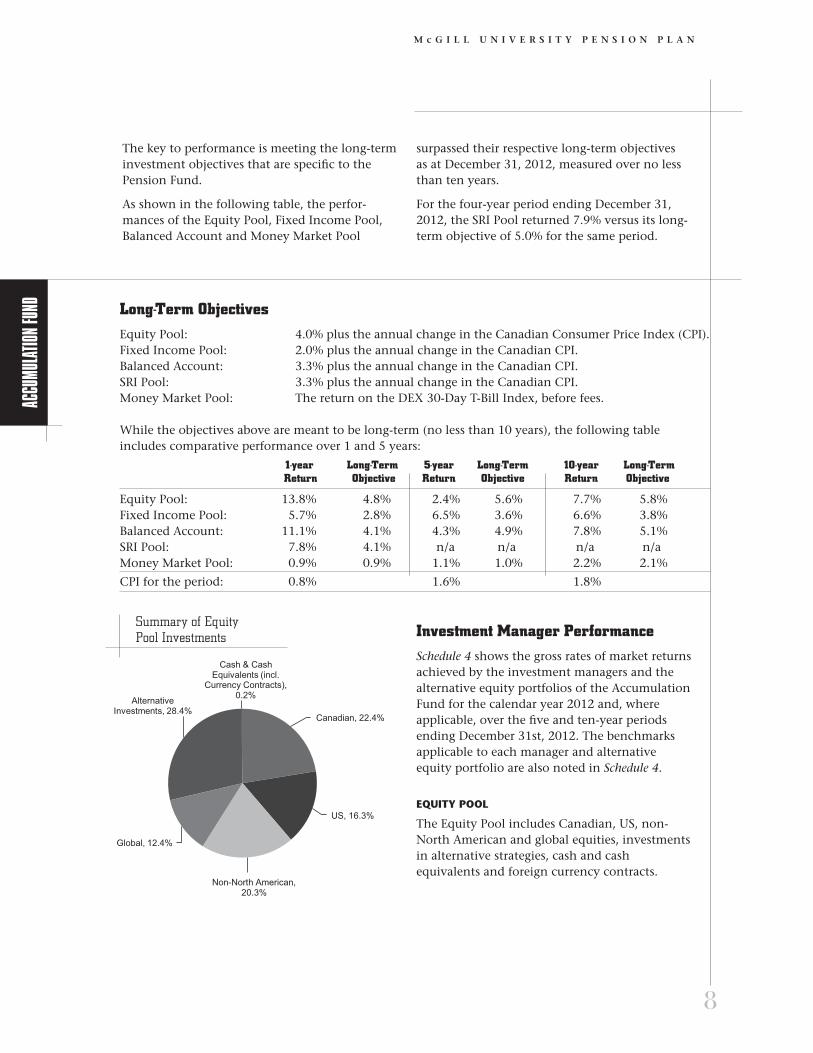
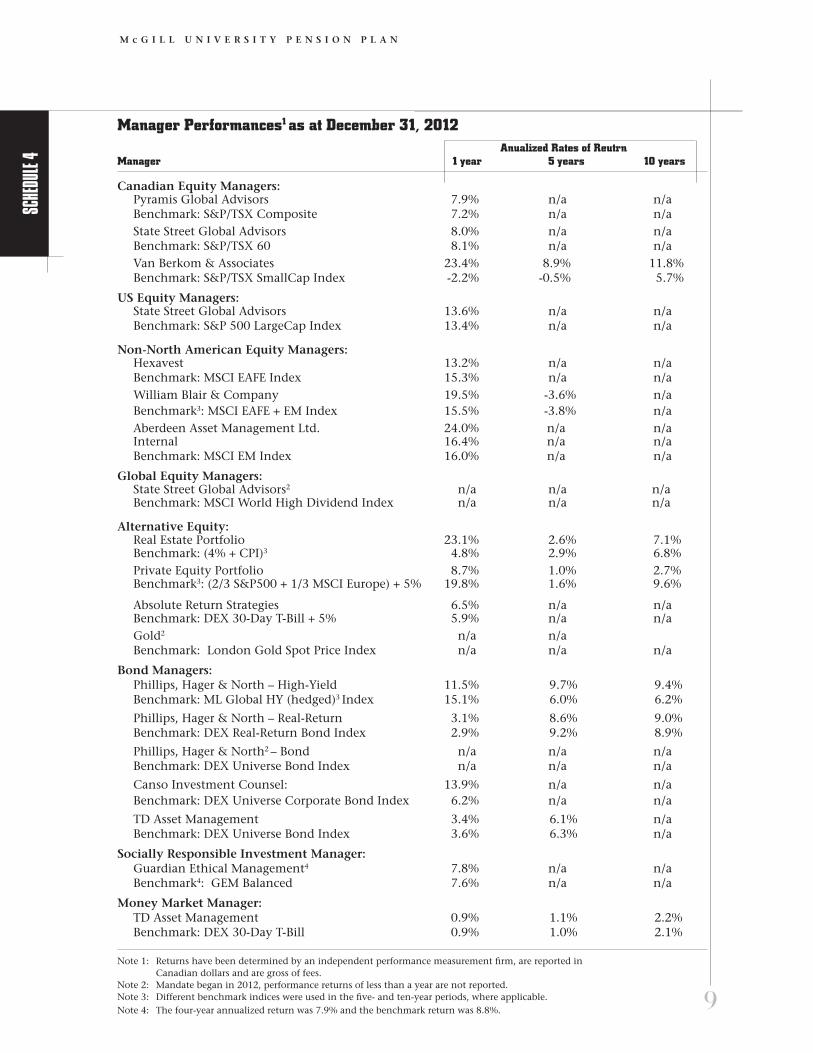
Investment Manager PerformanceSchedule 4 shows the gross rates of market returns achieved by the investment managers and the alternative equity portfolios of the Accumulation Fund for the calendar year 2012 and, where applicable, over the five and ten-year periods ending December 31st, 2012. The benchmarks applicable to each manager and alternative equity portfolio are also noted in Schedule 4.
equity PooL
The Equity Pool includes Canadian, US, non-North American and global equities, investments in alternative strategies, cash and cash equivalents and foreign currency contracts.
accU
mULa
tion f
Und
Long-Term ObjectivesEquity Pool: 4.0% plus the annual change in the Canadian Consumer Price Index (CPI).Fixed Income Pool: 2.0% plus the annual change in the Canadian CPI.Balanced Account: 3.3% plus the annual change in the Canadian CPI.SRI Pool: 3.3% plus the annual change in the Canadian CPI.Money Market Pool: The return on the DEX 30-Day T-Bill Index, before fees.
While the objectives above are meant to be long-term (no less than 10 years), the following tableincludes comparative performance over 1 and 5 years:
1-year Long-Term 5-year Long-Term 10-year Long-Term Return Objective Return Objective Return Objective
Equity Pool: 13.8% 4.8% 2.4% 5.6% 7.7% 5.8%Fixed Income Pool: 5.7% 2.8% 6.5% 3.6% 6.6% 3.8%Balanced Account: 11.1% 4.1% 4.3% 4.9% 7.8% 5.1%SRI Pool: 7.8% 4.1% n/a n/a n/a n/aMoney Market Pool: 0.9% 0.9% 1.1% 1.0% 2.2% 2.1%
CPI for the period: 0.8% 1.6% 1.8%
Summary of Equity Pool Investments
sche
dULe
4
Canadian, 22.4%
US, 16.3%
Non-North American, 20.3%
Global, 12.4%
Alternative Investments, 28.4%
Cash & Cash Equivalents (incl.
Currency Contracts), 0.2%
9
M c G I L L U N I V E R S I T Y P E N S I O N P L A N
Manager Performances1 as at December 31, 2012 Anualized Rates of Reutrn Manager 1 year 5 years 10 years
Canadian Equity Managers:Pyramis Global Advisors 7.9% n/a n/a Benchmark: S&P/TSX Composite 7.2% n/a n/aState Street Global Advisors 8.0% n/a n/a Benchmark: S&P/TSX 60 8.1% n/a n/aVan Berkom & Associates 23.4% 8.9% 11.8% Benchmark: S&P/TSX SmallCap Index -2.2% -0.5% 5.7%
US Equity Managers:State Street Global Advisors 13.6% n/a n/a Benchmark: S&P 500 LargeCap Index 13.4% n/a n/a
Non-North American Equity Managers:Hexavest 13.2% n/a n/a Benchmark: MSCI EAFE Index 15.3% n/a n/aWilliam Blair & Company 19.5% -3.6% n/a Benchmark3: MSCI EAFE + EM Index 15.5% -3.8% n/aAberdeen Asset Management Ltd. 24.0% n/a n/a Internal 16.4% n/a n/a Benchmark: MSCI EM Index 16.0% n/a n/a
Global Equity Managers:State Street Global Advisors2 n/a n/a n/a Benchmark: MSCI World High Dividend Index n/a n/a n/a
Alternative Equity:Real Estate Portfolio 23.1% 2.6% 7.1% Benchmark: (4% + CPI)3 4.8% 2.9% 6.8%Private Equity Portfolio 8.7% 1.0% 2.7% Benchmark3: (2/3 S&P500 + 1/3 MSCI Europe) + 5% 19.8% 1.6% 9.6%
Absolute Return Strategies 6.5% n/a n/a Benchmark: DEX 30-Day T-Bill + 5% 5.9% n/a n/a Gold2 n/a n/a Benchmark: London Gold Spot Price Index n/a n/a n/a
Bond Managers:Phillips, Hager & North – High-Yield 11.5% 9.7% 9.4% Benchmark: ML Global HY (hedged)3 Index 15.1% 6.0% 6.2%
Phillips, Hager & North – Real-Return 3.1% 8.6% 9.0% Benchmark: DEX Real-Return Bond Index 2.9% 9.2% 8.9%
Phillips, Hager & North2 – Bond n/a n/a n/a Benchmark: DEX Universe Bond Index n/a n/a n/a
Canso Investment Counsel: 13.9% n/a n/a Benchmark: DEX Universe Corporate Bond Index 6.2% n/a n/a
TD Asset Management 3.4% 6.1% n/a Benchmark: DEX Universe Bond Index 3.6% 6.3% n/a
Socially Responsible Investment Manager:Guardian Ethical Management4 7.8% n/a n/a Benchmark4: GEM Balanced 7.6% n/a n/a
Money Market Manager:TD Asset Management 0.9% 1.1% 2.2% Benchmark: DEX 30-Day T-Bill 0.9% 1.0% 2.1%
Note 1: Returns have been determined by an independent performance measurement firm, are reported in Canadian dollars and are gross of fees.Note 2: Mandate began in 2012, performance returns of less than a year are not reported. Note 3: Different benchmark indices were used in the five- and ten-year periods, where applicable.Note 4: The four-year annualized return was 7.9% and the benchmark return was 8.8%.
sche
dULe
4

10
M c G I L L U N I V E R S I T Y P E N S I O N P L A N
Pyramis Global Advisors, 19.4%
Van Berkom & Associates, 29.0%
State Street Global Advisors, 51.6%
cAnADiAn equity investMents
The Equity Pool’s holdings in Canadian equities ($151.5 million at year-end) were invested in Canadian equities through index and fully active strategies. For the year, Pyramis Global Advisors, employing a fully active investment approach, returned 7.9%, compared to the S&P/TSX Composite return of 7.2%. The performance of Van Berkom & Associates who actively manage a small cap mandate was 23.4% for the year, well above its S&P/TSX SmallCap Index benchmark performance of -2.2%. State Street Global Advisors’ indexed mandate return of 8.0% slightly underperformed the S&P/TSX 60 Index return of 8.1%.
At December 31, 2012, approximately 52% of the Canadian equity portfolio was invested in an
index strategy, versus 42% as at December 31, 2011. The entire Canadian equity portfolio was managed externally at year-end.
us equity investMents
The Equity Pool’s holdings in US equities ($110.0 million at year-end) were allocated entirely to index strategies.
State Street Global Advisors following a largecap index mandate, returned 13.6% slightly above the S&P500 Index benchmark of 13.4%.
At December 31, 2012, all of the US equity portfolio was invested in an index strategy versus 86% as at December 31, 2011.
The entire US equity portfolio was managed externally at year end.
Management Structure in Canadian Equities
Ten Largest Canadian Publicly Traded Equity Holdings in the Equity Pool as at December 31, 2012 Market Value % of % of Balanced Security Name (in millions) Equity Pool Account
Toronto Dominion Bank $8.8 1.3% 0.9%Royal Bank of Canada $8.5 1.3% 0.9%The Bank of Nova Scotia $6.0 0.9% 0.6%Suncor Energy $5.0 0.7% 0.5%Bank of Montreal $4.5 0.7% 0.5%Canadian National Railway $3.7 0.6% 0.4%Enbridge $3.7 0.6% 0.4%Potash Corporation of Saskatchewan $3.7 0.5% 0.4%Transcanada $3.6 0.5% 0.4%Cenovus Energy $3.0 0.4% 0.3%
Management Structure in US Equities
State Street Global Advisors,
100.0%
11
M c G I L L U N I V E R S I T Y P E N S I O N P L A N
Hexavest, 25.3%
iShares Emerging Market ETF, 3.2%
William Blair, 26.3%
Aberdeen, 45.2%
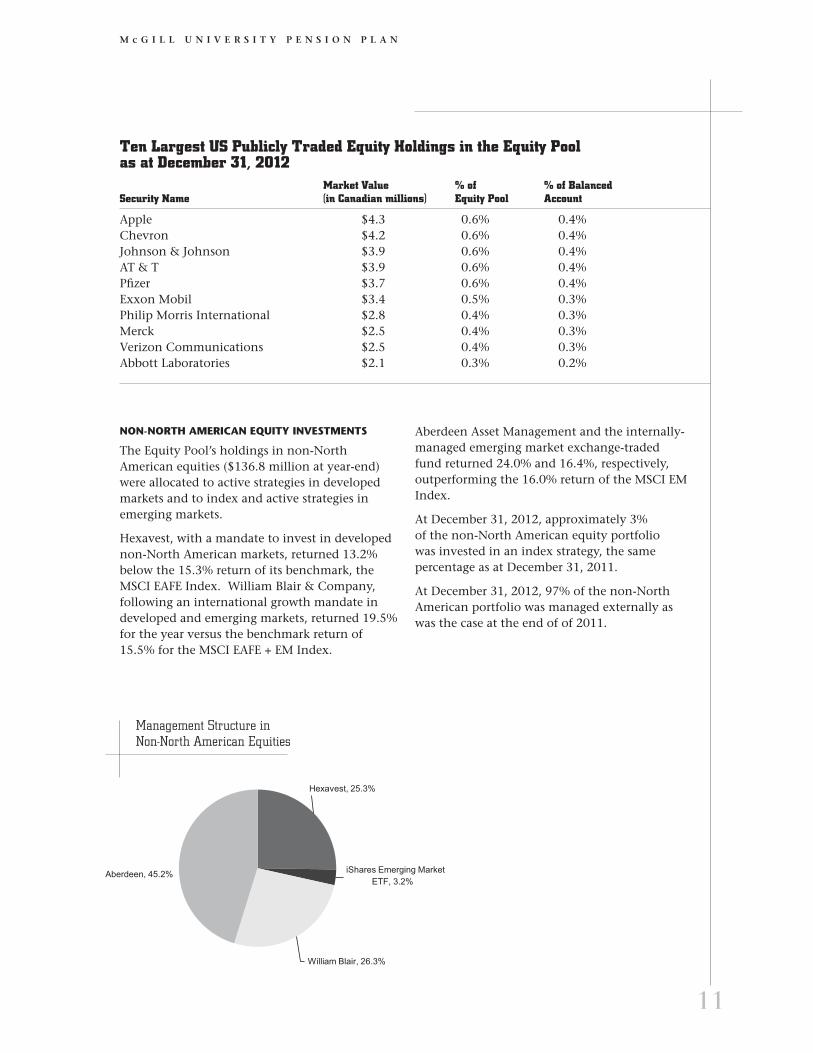
non-noRth AMeRicAn equity investMents
The Equity Pool’s holdings in non-North American equities ($136.8 million at year-end) were allocated to active strategies in developed markets and to index and active strategies in emerging markets.
Hexavest, with a mandate to invest in developed non-North American markets, returned 13.2% below the 15.3% return of its benchmark, the MSCI EAFE Index. William Blair & Company, following an international growth mandate in developed and emerging markets, returned 19.5% for the year versus the benchmark return of 15.5% for the MSCI EAFE + EM Index.
Aberdeen Asset Management and the internally-managed emerging market exchange-traded fund returned 24.0% and 16.4%, respectively, outperforming the 16.0% return of the MSCI EM Index.
At December 31, 2012, approximately 3% of the non-North American equity portfolio was invested in an index strategy, the same percentage as at December 31, 2011.
At December 31, 2012, 97% of the non-North American portfolio was managed externally as was the case at the end of of 2011.
Management Structure in Non-North American Equities
Ten Largest US Publicly Traded Equity Holdings in the Equity Pool as at December 31, 2012 Market Value % of % of Balanced Security Name (in Canadian millions) Equity Pool Account
Apple $4.3 0.6% 0.4%Chevron $4.2 0.6% 0.4%Johnson & Johnson $3.9 0.6% 0.4%AT & T $3.9 0.6% 0.4%Pfizer $3.7 0.6% 0.4%Exxon Mobil $3.4 0.5% 0.3%Philip Morris International $2.8 0.4% 0.3%Merck $2.5 0.4% 0.3%Verizon Communications $2.5 0.4% 0.3%Abbott Laboratories $2.1 0.3% 0.2%

12
M c G I L L U N I V E R S I T Y P E N S I O N P L A N
Real Estate, 20.3%
Private Equity, 25.9%Absolute Return Strategies, 41.1%
Gold, 12.7%
GLoBAL equity
The Equity Pool’s holdings in global equities ($83.5 million at year-end) were allocated entirely to an index strategy.
State Street Global Advisors, following a high-dividend yield mandate in developed markets returned 6.4% for the six-months ending December 31, 2012 versus the 6.1% return of its benchmark, the MSCI World High Dividend Yield Index.
At December 31, 2012, 100% of the global equity portfolio was invested in an index strategy and managed externally.
ALteRnAtive equity investMents
The Equity Pool’s holdings in alternative strategies ($192.1 million at year-end) are meant to provide diversification relative to the publicly-traded equity and fixed income markets. The alternative equity investments include allocations to real estate, private equity, absolute return strategies and gold.
The real estate porfolio return of 23.1% was significantly higher than the 4.8% return of its benchmark which is 4% + CPI. The real estate portfolio is entirely invested in privately-held Canadian real estate.
The private equity portfolio returned 8.7% versus the 19.8% return of its benchmark which is a blend of the S&P500 and MSCI Europe Index returns plus 5%.
The absolute return strategies returned 6.5% for the year versus the 5.9% benchmark return of the DEX 30-day T-Bill + 5%.
Management Structure in Global Equity Investments
Ten Largest Non-North American Publicly Traded Equity Holdings in the Equity Pool as at December 31, 2012 Market Value % of % of Balanced Security Name (in Cdn $ millions) Equity Pool Account
Royal Dutch Shell (United Kingdom) $3.6 0.5% 0.4%Petrochina (Hong Kong) $3.5 0.5% 0.4%Nestle (Switzerland) $3.2 0.5% 0.3%China Mobile (Hong Kong) $2.8 0.4% 0.3%Sanofi (France) $2.6 0.4% 0.3%Taiwan Semiconductor MFG (Taiwan) $2.5 0.4% 0.2%Novartis (Switzerland) $2.3 0.3% 0.2%Roche Holdings (Switzerland) $2.2 0.3% 0.2%Fomento Economico Mexicano (Mexico) $2.2 0.3% 0.2%Grupo Financiero Banorte (Mexico) $2.1 0.3% 0.2%
Management Structure in Alternative Equity Investments
State Street Global Advisors,
100.0%

13
M c G I L L U N I V E R S I T Y P E N S I O N P L A N
Real Return Bonds, 15.2%
High Yield Bonds, 8.0%
Nominal Bonds, 74.1%
Cash & Cash Equivalents, 2.7%
Phillips, Hager & North, 59.3%
Canso, 13.2%
TD Asset Management, 27.5%
FixeD incoMe PooL
The Fixed Income Pool’s holdings ($343.9 million at year-end) include allocations to bonds, corporate bonds, high-yield bonds, real-return bonds and cash and cash equivalents. The Fixed Income Pool’s holdings are primarily Canadian securities denominated in Canadian dollars.
TD Asset Management, which manages an indexed bond mandate, returned 3.4% for the year versus the DEX Universe Bond Index return of 3.6%. Phillips, Hager & North’s mandate to manage a high-yield bond fund provided a 3.1% return versus the ML Global HY (hedged) Index
return of 2.9%, while Phillips, Hager & North’s real-return mandate returned 3.1% outperforming the 2.9% return of its benchmark, the DEX Real-Return Bond Index. Canso Investment Counsel’s corporate bond mandate returned 13.9% far surpassing the DEX Universe Corporate Index return of 6.2%.
In July 2012, Phillips, Hager & North was allocated a DEX universe bond mandate which returned 1.4% for the last five months of the year versus the 0.9% return for its benchmark during the same period.
Summary of Fixed Income Pool Investments
Management Structure in Fixed Income Investments
Ten Largest Fixed Income Pool Holdings as at December 31, 2012 Market Value % of Fixed % of Balanced Security Name (in Cdn $ millions) Income Pool Account
Gov’t of Canada 4% 2031/12/01 Real Return $26.6 7.7% 2.5%Gov’t of Canada 4.25% 2026/12/01 Real Return $17.6 5.1% 1.7%Province of Ontario 7.60% 2027/06/02 $9.3 2.7% 0.9%Gov’t of Canada 4.25% 2021/12/01 Real Return $7.7 2.2% 0.7%Province of Ontario 5.60% 2035/06/02 $4.2 1.2% 0.4%Province of Ontario 4.60% 2039/06/02 $3.8 1.1% 0.4%Gov’t of Canada 1.50% 2017/09/01 $3.7 1.1% 0.3%Province of Quebec 3.50% 2022/12/01 $3.6 1.1% 0.3%Province of Ontario 6.20% 2031/06/02 $3.4 1.0% 0.3%Province of Ontario 6.50% 2029/03/08 $3.4 1.0% 0.3%

14
M c G I L L U N I V E R S I T Y P E N S I O N P L A N
Canadian Equity, 37.8%
US Equity, 7.5%Non -North American
Equity, 16.0%
Canadian Fixed Income, 35.0%
Cash & Cash Equivalents, 3.7%
sociALLy-ResPonsiBLe investMent (“sRi”) PooL
The SRI Pool was established on April 1, 2008. The SRI Pool has a minimum ongoing threshold of $8 million, set by the PAC, as a condition of maintaining this investment option under the Plan. At December 31, 2012, the SRI Pool had $15.5 million in assets.
The SRI Pool invests in the Guardian Ethical Management (“GEM”) Balanced Pool. GEM is equally owned by Guardian Capital L.P. and
The Northwest & Ethical Investments L.P. (“NEI”), both established leaders in their respective fields of expertise. Guardian Capital L.P. focuses on investment manage ment governed by a sustainable discipline, whereas NEI focuses on ongoing shareholder engagement and the evaluation of environmental, social and governance performance of holdings and investment prospects.
The GEM Balanced Pool, and in turn the SRI Pool, invests in Canadian equities, US equities, non-North American equities, Canadian fixed income and cash and cash equivalents. The actual SRI Pool asset class allocations as at December 31, 2012 are shown in the “Summary of SRI Pool Investments” pie chart.
Guardian Ethical Management, which has a “socially responsible” investment mandate, returned 7.8% for the year ending December 31, 2012 versus its benchmark return of 7.6%.
At December 31, 2012, the entire SRI Pool was managed externally by Guardian Ethical Management.
Summary of SRI Pool Investments
Ten Largest Socially-Responsible Investment (SRI) Pool Holdings in the Equity Pool as at December 31, 2012 Market Value % of Security Name (in Cdn $) SRI Pool
Canada Housing Trust 3.35% 2020/12/15 $524,000 3.4%Gov’t of Canada 5.75% 2033/06/01 $458,000 3.0%The Bank of Nova Scotia $334,000 2.2%Royal Bank of Canada $316,000 2.0%Toronto Dominion Bank $285,000 1.8%Suncor Energy $285,000 1.8%Canada Housing Trust 1.85% 2016/12/15 $256,000 1.7%Gov’t of Canada 5.75% 2029/06/01 $245,000 1.6%Canadian National Railway $237,000 1.5%Canada Housing Trust 2.75% 2015/12/15 $224,000 1.4%

15
M c G I L L U N I V E R S I T Y P E N S I O N P L A N
Money MARket PooL
The Money Market Pool’s holdings ($16.7 million at year-end) consisted of allocations to cash and cash equivalents. Cash equivalents may include Federal and Provincial Government issues, Banker’s Acceptances and term deposits.
The externally-managed investments are invested in TD Asset Management’s TD Emerald Government of Canada Fund.
The Money Market Pool generated a return of 0.9% for the year equal to the 0.9% generated by its benchmark, the DEX 30-Day T-Bill Index.
Money Market Pool Holdings as at December 31, 2012 Market Value % of Money Security Name (in Cdn $ millions) Market Pool
Gov’t of Canada T-Bill 2013/01/02 $5.1 30.5%Gov’t of Canada T-Bill 2013/02/28 $2.2 13.2%Gov’t of Canada T-Bill 2013/01/04 $2.1 12.5%Gov’t of Canada T-Bill 2013/02/14 $2.0 12.0%Gov’t of Canada T-Bill 2013/01/17 $1.9 11.4%Gov’t of Canada T-Bill 2013/01/31 $1.7 10.2%Gov’t of Canada T-Bill 2013/03/14 $1.0 6.0%Gov’t of Canada T-Bill 2013/03/28 $0.5 3.0%Gov’t of Canada T-Bill 2013/05/09 $0.2 1.2%
Summary of Money Market Pool Investments
* Includes 31.5% allocation to a reverse repurchase agreement with a Canadian
Schedule A chartered bank which matures on January 2, 2013. A reverse repurchase
agreement is the immediate purchase of securities (i.e. Government of Canada
T-Bills) and a simultaneous agreement to resell these securities at a later date and
agreed upon price.
Cash0.8%
Government Issued T-Bills99.2%*

16
M c G I L L U N I V E R S I T Y P E N S I O N P L A N
Unit Values Unit values are calculated on a single-month basis with a one-month lag (i.e. units valued at December were based on the market value in effect in November). In addition, the unit values are net of all investment and administration expenses and fluctuate (subject to increase or decrease) based on prevailing market conditions. Consequently, the unit value returns can be quite different from the market performance returns set out in Schedule 3, which are reported gross of fees and on a calendar basis.
The annual rates of return achieved by investors in the various pools over the last 10 years, measured on the basis of unit values as at December 31st of each year, calculated as described above, are shown in Schedule 5.
The actual rate of return earned during the year by a member’s account will, of course, vary according to the mix of investments chosen by the member. For members who have changed their asset mix strategies from time to time over the years, their long-term rate of return will
also reflect the gains and/or losses that were achieved as a result of such changes. As noted earlier, only the performance of the Balanced Account is taken into account in the calculation of the Defined Benefit Minimum Provision, if applicable. If you have participated in any of the other investment pools, your Defined Benefit Minimum Provision will be adjusted to reflect the impact of the investment gains or losses achieved under those pools rela tive to the performance of the Balanced Account.
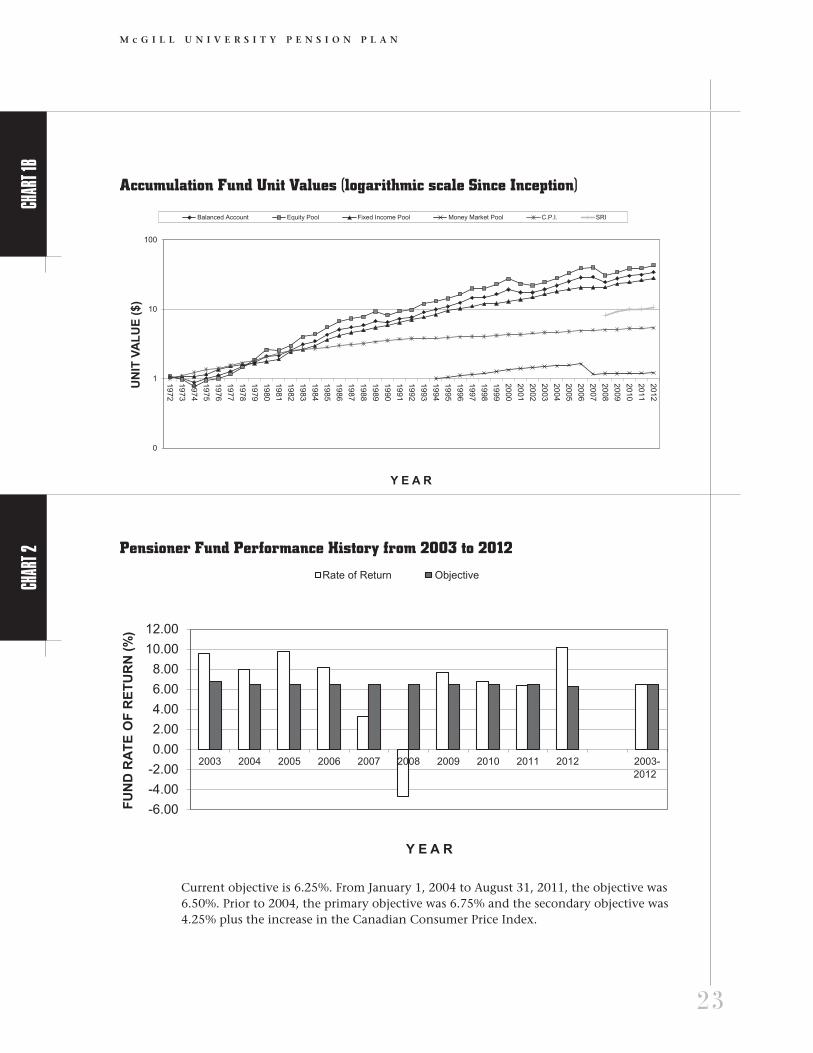
Charts 1A (on page 22) and IB (on page 23) illustrate the historical progress of the unit values from inception of the Plan in 1972 until December 31, 2012. A listing of unit values for the past 10 years is shown in Appendix III.
Unit Values - Historic Performance1
Fixed Socially Money Balanced Equity Income Responsible MarketYear Account Pool Pool Investment Pool
2003 11.80% 11.78% 10.77% 3.02%2004 12.53% 13.75% 10.01% 2.36%2005 14.97% 18.13% 7.96% 2.70%2006 13.81% 17.89% 4.73% 3.99%2007 2.23% 2.52% 0.94% 4.43%2008 -15.68% -23.62% 0.32% -17.90%2 2.78%2009 12.57% 12.26% 11.89% 14.01% 0.29%2010 9.44% 12.31% 6.05% 7.46% 0.19%2011 3.63% 1.38% 6.73% 0.20% 0.65%2012 9.23% 10.12% 6.98% 5.15% 0.65%
10-Year AnnualizedRate of Return: 7.06% 6.92% 6.57% n/a 2.10%
Note 1: Unit values are calculated on a monthly basis with a one-month lag. For market performance on a calendar-year basis please refer to Schedule 3 on page 7.
Note 2: 8 months only – Socially Responsible Investment Pool was established in April 2008.
Unit values and current performance numbers are updated monthly and can be viewed on our web site: www.mcgill.ca/hr/bp/pensions/unithistory
Updatesonthe web
sche
dULe
5
sche
dULe
6

17
M c G I L L U N I V E R S I T Y P E N S I O N P L A N
The Pensioner fUndThe Pensioner Fund is the section of the Pension Fund that contains the assets required to finance the benefits for retired staff who opted for an internal pension settlement prior to January 1, 2011. The investment objective of the Pensioner Fund is to optimize the return of the fund over the long term in such a manner as to provide high security for pensions in progress, to provide enhance ments of pension amounts in accordance with the Plan Document and to minimize the possibility of actuarial deficiencies. It seeks to achieve this objective by investing in a diversified portfolio of fixed income and equity investments.
Asset AllocationDuring 2012, the PAC completed the re-design of the Pensioner Fund’s asset allocation. The strategic long-term asset mix was modified to a 35% equity and 65% fixed income allocation. The allocations to short-term bonds, real-return bonds and mortgages were eliminated.
The mortgage loans were issued by Aylmer & Sherbrooke Investments Inc., a corporation wholly-owned by the McGill University Pension Plan.
At December 31, 2012, 100% of the Pensioner Fund’s portfolio was managed externally versus 93% in 2011.
As the performances of individual managers and markets move the assets of the Pensioner Fund away from the strategic asset allocation policy established by the PAC, consideration is given to rebalancing the assets back to policy.
Schedule 6 compares the actual Pensioner Fund holdings to the policy allocation on the basis of market values as at December 31, 2012.
Investment ManagementThe following investment manager changes were made in 2012 in the Pensioner Fund:
In March 2012, Standard Life Investments were hired for a Liability-Driven Investment (“LDI”) mandate. LDI is an investment strategy that seeks to better match the cash flows generated by the Pensioner Fund’s assets to its pension payment obligations.
Pensioner Fund - Asset Allocation Policy December 31,2012
Amount % ofAsset Class (in Millions) Total Fund MIN% MID% MAX%
Cash & Cash Equivalents 19.2 8.4 0 0 10Fixed Income 114.0 50.0 45 65 75Real Estate 38.6 16.8 0 0 15Equity 56.6 24.8 25 35 45
Total Pensioner Fund: $228.4 100.0% 100.0%
sche
dULe
6

18
M c G I L L U N I V E R S I T Y P E N S I O N P L A N
In July 2012, the final mortgage loan was repaid to the fund and the Plan subsequently dissolved its wholly-owned mortgage corporation, Aylmer & Sherbrooke Investments Inc.
In November 2012, the Plan sold its holdings of Master Asset Vehicle II notes that were in the portfolio since the 2009 restructuring of its non-bank asset-backed commercial paper holdings.
PerformanceIn 2012, the Pensioner Fund had a rate of return of 10.2% for the year, above the long-term objective of 6.25%. The performance was strongly impacted by the real estate return of 20.2% and by the equity return of 12.5%.
The return on fixed income investments was 6.7% while cash and cash equivalents returned 0.9%.
Schedule 7 shows the gross rates of market returns achieved by the various asset classes and managers for the one, five and ten-year periods ending December 31, 2012. The applicable benchmark performance for each asset class and manager is also noted in Schedule 7.
Chart 2 on page 23 illustrates the historical performance of the Pensioner Fund for the past ten years as com pared against the long-term objective.
Pensioner Fund Performance1 as at December 31, 2012
Annualized Rates of Return
Asset Class/Manager 1 year 5 years 10 years
Cash & Cash Equivalents 0.9% -1.8% -0.1%Benchmark: DEX T-Bills 30-Day 0.9% 1.0% 2.1%
Canadian Equity: Phillips, Hager & North 12.5% 2.8% 8.2%Benchmark: S&P/TSX Composite 7.2% 0.8% 9.2%
Real Estate Porfolio 20.2% 7.3% 11.2%Benchmark: 4% + CPI 4.8% 6.4% 10.1%
Fixed Income: 6.7% n/a n/aBenchmark: DEX Universe Bond Index 3.6% n/a n/a Standard Life Investments2 n/a n/a n/a Benchmark: Customized Liability n/a n/a n/a
Canso Investment Counsel 15.0% n/a n/a Benchmark: DEX Universe Corporate Bond Index 6.2% n/a n/a TD Asset Management 3.5% n/a n/a Benchmark: DEX Universe Bond Index 3.6% n/a n/a
TOTAL PENSIONER FUND: 10.2% 5.2% 6.4%
Note 1: Returns have been determined by an independent performance measurement firm, are reported in Canadian dollars and are gross of fees.
Note 2: Mandate began in March 2012, performance returns of less than one year are not reported.
sche
dULe
7

19
M c G I L L U N I V E R S I T Y P E N S I O N P L A N
Plan AmendmentsIn 2011, Amendment No. 24 with varying effective dates was announced.
Amendment No. 24 amended the Plan in order to comply with applicable legislation, to harmonize the Plan Document with current practices as well as to include other changes of an administrative nature.
The most significant changes introduced in Amendment No. 24 are:
• Effective January 1, 2012, required University and member contributions to the Plan will cease at the earlier of the member’s Normal Retirement Date (month end coinciding with the member’s 65th birthday) or the date a member ceases to be an active member of the Plan.
• Effective January 1, 2012, for Part A members only, stipends will no longer be recognized under the defined benefit minimum provision and will only be eligible for member and University contributions under the defined contribution component of the Plan.
• Effective January 1, 2013, required member contributions for members aged 40-49 will increase to 7% and required member contributions for members aged 50-65 will increase to 8%.
• Effective January 1, 2014, subsequent to the results of actuarial valuations to the Plan, in situations where additional contributions are necessary to offset funding deficiencies, Part A members (those who joined or were eligible to join prior to January 1, 2009) will assume an equal share of the additional funding requirements.
Members are reminded that the text of the current Plan Document and all formal amendments may be examined during normal business hours (Monday to Friday from 9:00 a.m. to 5:00 p.m.) at the offices of the Pension Administration Commitee located at: 688 Sherbrooke Street West, Suite 1420, Montreal, Quebec, H3A 3R1.
Benefits andadministrative matters
2012 Benefit Payments During 2012, 374 individual benefit settlements were transacted under the Plan totalling $92,537,869. The types of settlement transactions processed and the benefit amounts paid out of the Plan during 2012 are summarized in Schedule 8.
In 2012, 135 members of the Plan retired. The new retirees who consented to have their names included in this Report are listed in Appendix I.
As at December 31, 2012, there were 1297 retired members and beneficiaries receiving pensions from the Pensioner Fund. Of these, 833 are in the Old Pool with an average age of 82.6 years and 464 are in the New Pool with an average age of 70.4 years. The total of such pensions payments amounted to $32,359,961 in 2012.
During the year, 71 deaths were recorded among members of the Plan, of which 11 were active members, 55 were retired members from the Old Pool and 5 were retired members from the New Pool (see Appendix II).
Annuity DividendsHistorically, Plan Annuity Rates have been set on the basis of assumptions with respect to interest earnings and mortality rates in order to include provision for potential increases in pension payments. When surplus earnings emerge in the Pensioner Fund as a result of mortality experience or investment returns that are more favorable than the rates required to cover current pension payments; or when the present value of assets exceed the present value of liabilities as a result of changes in interest rates, these amounts can be set aside to provide increases in the form of “Annuity Dividends” to pensions currently in the course of payment. Annuity Dividends are granted on the advice of the Plan’s actuary and are subject to there being sufficient assets in the Pensioner Fund to cover the future cost of pensions purchased. The last time an Annuity Dividend was declared was in 1997.

20
M c G I L L U N I V E R S I T Y P E N S I O N P L A N
In 2000, the Pensioner Fund was notionally separated into two accounts. One account represents the assets and liabilities in respect of the pensioners who purchased their pensions on the “old” rate basis (prior to January 1, 2000); the other covers the pensioners who annuitized under the “new” rate basis. Separate dividend distributions apply to each group. The new annuity rates, which came into effect on January 1, 2000, are based on revised mortality and interest rate assumptions. To view the full history of the Annuity Dividends that have been granted since the inception of this program and the impact dividends have had on the benefits paid to the McGill pensioners over the years, please refer to our website: www.mcgill.ca/hr/bp/pensions/.
The amount and frequency of each Annuity Dividend is determined by the PAC following an annual actuarial valuation of the liabilities of the Pensioner Fund. All Annuity Dividends are calculated and paid on an actuarial basis that is designed to distribute the benefits evenly over the remaining lifetimes of all pensioners, within the respective pools. Each new dividend is allocated on a compounded basis in which the benefit is expressed as a percentage increase to be applied to the total of the initial base pension plus all past dividends granted.
Once an Annuity Dividend has been granted it forms part of the contractual lifetime benefit
and the member’s pension can never be reduced below this amount in the future. Nevertheless, it is important to note that although past divi-dends are guaranteed, future dividend increases are entirely dependent on the ability of the Pensioner Fund to continue to generate surplus earnings; there can be no guarantee that this will be the case.
Subsequent to changes in the Supplemental Pension Plans Act, pension plans must establish a reserve when the plan is in a surplus position. As a result of this change, the Plan must be 100% solvent and must have funded the reserve prior to using any surplus to fund a dividend, thus, severely decreasing the likelihood of future annuity dividend increases.
Annuity Dividend ValuationThe December 31, 2009 actuarial valuation of the Pensioner Fund confirmed an excess of liabilities over assets of $65,841,000 on a solvency valuation basis. Consequently, no Annuity Dividends could be declared.
As a result of the significant deficit which existed in the Pensioner Fund, a separate annuity dividend valuation was not performed in 2012.
The PAC will advise all members who elected to purchase an internal annuity from the Plan, if surplus earnings emerge in the Pensioner Fund.
External Settlements Paid in 2012
Number Total Amount Average Payment
Transfers to LIFs: 77 $32,523,803 $ 422,387Transfers to LIRAs: 150 49,797,983 331,987Death Benefits: 16 2,574,015 160,876External Annuity Purchases: 14 4,709,034 336,360Lump-Sum Payments: 87 1,012,006 11,632Transfers to other Pension Plans: 5 799,520 159,904Marriage Breakdown Settlements: 5 913,676 182,735Other1: 20 207,832 10,392Total: 374 $92,537,869 $ 247,4271 Includes transfers to RRSPs and RIFs
sche
dULe
8
sche
dULe
9

21
M c G I L L U N I V E R S I T Y P E N S I O N P L A N
Actuarial Valuation of the PlanThe Plan is required to provide information and actuarial certification at least every three years. Plan actuaries, Eckler Ltd, in their December 31, 2009 valuation report, established the financial position of the Plan.
The actuarial valuation of the Plan as a whole, established that a funding deficiency of $46,313,000 existed as at December 31, 2009.
The degree of solvency is described as the ratio of solvency assets to the solvency liabilities. As at December 31, 2009, the degree of solvency, excluding the defined contribution balances for those members who would not have been entitled to receive any benefits under the defined benefit minimum provision of the Plan, had the Plan been terminated on December 31, 2009 was 84.0%. Under the Supplemental Pension Plans Act, as of January 2007, university and municipal pension plans are no longer required to make contributions to amortize solvency deficits.
The Executive Summary of the Actuarial Valuation as at December 31, 2009, as prepared by the Plan actuary, Eckler Inc., can be found in Appendix IV.
The next triennial actuarial valuation of the Plan will be performed as at December 31, 2012 and will be filed with the Régie des rentes du Québec no later than September 30, 2013.
AdministrationThe day-to-day administration of the Plan is performed by the staff of Pension Administration and the Office of Investments on the basis of policies and procedures established and monitored by the Pension Administration Committee.
The total fees for the investment options in the Accumulation Fund, as well as the total fees for the Pensioner Fund, are presented in Schedule 9.
Administrative and Investment Management Fees as a Percentage of Average Assets
ACCUMULATION FUND 2012 2011
Balanced Account 0.66% 0.53%
Equity Pool 0.81% 0.65%
Fixed Income Pool 0.38% 0.32%
Socially Responsible Investment Pool 0.97% 0.94%
Money Market Pool 0.32% 0.26%
PENSIONER FUND 0.52% 0.55%
sche
dULe
9

22
M c G I L L U N I V E R S I T Y P E N S I O N P L A N
The offices of the Pension Administration Committee, Pension Administration and the Office of Investments are located at:
688 Sherbrooke Street West, Suite 1420 Montreal, Quebec H3A 3R1 Tel: 514-398-6250, Fax: (514) 398-6889
A copy of this annual report and other documents can also be accessed through our web site at http://www.mcgill.ca/hr/bp/pensions.
Staff DirectoryPension Administration
General Information (514) 398-4747 (HRHR)
John D’Agata Director – Pension Administration 514-398-6250
Karen Rasinger Communications and Administrative Officer 514-398-6250
Joanne St-Denis, Pensions and Benefits Officer 514-398-2748
Celine Garrocho, Pensions and Benefits Officer 514-398-2098
Filomena Ferrara, Pension Coordinator 514-398-4747 (HRHR)
Office of Investments
General Information 514-398-6040
Dave Brochet, Director – Office of Investments 514-398-2648
Robert Hall, Senior Manager Compliance & Reporting 514-398-1383
La version française de ce rapport est disponible sur demande.
Accumulation Fund Unit Values Since Inception
contact Us
char
t 1a
char
t 1B
char
t 2
23
M c G I L L U N I V E R S I T Y P E N S I O N P L A N
Accumulation Fund Unit Values (logarithmic scale Since Inception)
Pensioner Fund Performance History from 2003 to 2012
Current objective is 6.25%. From January 1, 2004 to August 31, 2011, the objective was 6.50%. Prior to 2004, the primary objective was 6.75% and the secondary objective was 4.25% plus the increase in the Canadian Consumer Price Index.
char
t 1B
char
t 2

24
M c G I L L U N I V E R S I T Y P E N S I O N P L A N
Appendix I2012 retirementsName Department or Faculty
Abbott/Frances V./Dr. Psychiatry
Angenot/Marcel Marc/Prof. French
Beaven/Dorothy/Mrs. McGill-Queen’s University Press
Bellefleur/Johanne/Ms. Human Resources
Bergevin/Maryse/Ms. Student Aid Office
Besso/Erica/Dr. Science
Blachford/Gregg/Mr. McGill Career Planning Service
Brijodhan/Bhanmattie/Mrs. Libraries
Brisson/Marie-Laure/Dr. Pathology
Campbell/Helen/Mrs. Mining & Materials Engineering
Carreno/Jose/Mr. Macdonald Campus
Chodan/Olga/Ms. Dentistry
Crescenzi/Dante/Mr. Facilities Management
Dixon/Ingrid/Miss Libraries
Emery/Sandra/Ms. Libraries
Farookhi/Riaz/Dr. Physiology, Obstetrics & Gynecology
Finlay-Virus/Rosalind/Ms. Management
Franklin/Keith/Dr. Psychology
Gardecka/Krystyna/Ms. Financial Services
Gillett/Peter/Dr. [2011] Obstetrics & Gynecology
Gladu/Jean-Paul/Mr. Macdonald Campus
Griffith/Irvin/Mr. Information Systems Resources
Hechtman/Peter/Dr. Biology, Pediatrics & Human Genetics
Hellauer/Karen E./Miss Medicine
Henry/Stanley/Mr. Electrical & Computer Engineering
Hinds/Julle/Mr. Residences
Holland/Paul C./Dr. Neurology
Hood/David A./Mr. Network & Communications Services
Ippersiel/Andree/Ms. Teaching & Learning Services
Julien/Nola A./Mrs. Libraries
Kingsley/Ellen/Ms. Risk Management & Insurance
Kluck/Alfred/Mr. Chemistry
Kopp/Georges/Mr. Chemistry
Langlois/Pierre/Mr. Network & Communications Services
Large/J. Andrew/Dr. School of Information Studies
Marshall/William D./Dr. Food Science & Agricultural Chemistry
McElroy/Kathleen M/Miss Integrated Studies in Education
McGillivray/David L./Dr. Pediatric Emergency Medicine
McKay/Kenneth/Mr. Facilities Management
Mui/Ming Yine Joseph/Mr. Electrical & Computer Engineering
Mullen/David/Mr. Facilities Management
Nathanson/Paul/Dr. Religious Studies
Ota/Yuzo/Prof. History & Classical Studies
Peltola/Paul/Mr. Electrical & Computer Engineering
Pharand/Serge/Mr. Macdonald Campus
Pilla/Eva/Mrs. Medicine

25
M c G I L L U N I V E R S I T Y P E N S I O N P L A N
Appendix II2012 deaths
Active Plan Members whose deaths occurred in 2012:
Name Department or Faculty
Bedard/Luc/Mr. New Residence Hall
Brestovac/Zoran/Mr. Enrolment Services
Darrigan/Danny Albert/Mr. Integrated Studies in Education
Gagnon/Claude/Dr. Medicine
Kiaerbye-Hansen/Elisabeth/Dr. Deferred Annuitant
Lachance/Gaetan/Mr. Facilities Management
Lacroix/David/Mr. Education
Morai/Linda/Mrs. Biology
Rothwell/Frank/Mr. Chemistry
Sadovnick/Joseph M./Mr. Information Systems Resources
Whaite/Peter/Mr. Center for Intelligent Machines
Retired Plan Members whose deaths occurred in 2012:
Name Department or Faculty
Armour/John/Mr. Administration
Barthakur/Nayana N./Prof. Natural Resource Science
Baxter/Donald W./Dr. Montreal Neurological Hospital
Beaulieu/Gordon/Mr. Macdonald Campus
Bergmann/Rosemarie/Prof. Art History
Blanchette/Onil/Mr. Facilities Management
Boorman/John Arthur/Prof. Religious Studies
Bright/Joan/Mrs. Macdonald Campus
Brook/Pamela/Miss Registrar’s Office
Name Department or Faculty
Prashad/Juliet/Mrs. Libraries
Préfontaine/Johanne/Miss Ancillary Services
Reid/Gregory D./Dr. Kinesiology & Physical Education
Riley/Vivian/Ms. Human Resources
Sandoe/Anne D./Ms. Dentistry
Savoie/Louise A./Ms. Education
Shapiro/Stanley H./Dr. Epidemiology & Biostatistics
Simon/Mary/Mrs. Libraries
Sutherland/Mary E./Miss Biochemistry
Szittner/Rose/Mrs. Biochemistry
Thomson/Robert G./Mr. Electrical & Computer Engineering
Thomson/Vince/Prof. [2011] Mechanical Engineering
Ugolik/Claudia/Mrs. Montreal Neurological Institute
Van Eyk/Helen/Ms. Management
Van de Voort/Frederik/Dr. Food Science & Agricultural Chemistry
Walton/Katherine/Ms. Enrolment Services
Warn/Thomas/Dr. Atmospheric & Oceanic Sciences
Wood/Patricia/Mrs. Secretariat
Workman/Richard/Mr. Facilities Management
Appendix I – Retirements (continued)

26
M c G I L L U N I V E R S I T Y P E N S I O N P L A N
Appendix II – Deaths (continued)
Name Department or Faculty
Brown-Naylor/Joan M./Ms. Administration
Cavalieri-D’Oro/N/Mr. Building Services
Chiavazza/Sebastien/Mr. Macdonald Campus
Coirazza/Rosario/Mr. Facilities Management
Cornish/Richard John/Mr. Macdonald Campus
Corrado/Carmine/Mr. Physical Plant
Deery/Clare/Mrs. Admissions
Dellow/William/Mr. Continuing Education
De Luca/Carmine/Mr. Building Services
Demers/Bertha/Mrs. Payroll
Eatman/Shirley/Ms. Montreal Neurological Hospital
Evans/Kenneth J./Mr. Power House
Fazio/Giovanni/Mr. Physical Plant
Fowle/Alice Jean/Mrs. Student Aid
Fraser/Murray Judson/Prof. Biochemistry
Gallati/Ernst/Prof. German Studies
Gilpin/Elizabeth/Mrs. Medicine
Giroux/Madeleine/Ms. Nutrition & Food Science
Kozlowski/R.J./Mrs. Pharmacology & Therapeutics
Lachance/Gisèle/Mrs. Microbiology & Immunology
Lahaye/Raymond/Mr. Gault Estate
Langleben/M. Phillip/Prof. Physics
Lavoie/Edward/Mr. Macdonald Campus
Legrand/Albert/Mr. Macdonald Campus
Lemon/Robert E./Prof. Biology
Mariano/Giuseppe/Mr. Physical Plant
McGuire/Olive/Mrs. Dentistry
Murphy/Sheila/Mrs. Physiology
Muszkatel/Bronislawa/Mrs. Jewish Studies
Okubo/Tanjiro/Prof. Science
Patel/Popat-Lal/Prof. Physics
Poser/Ernest G./Prof. Psychology
Prince/Raymond Harold/Prof. Psychiatry
Rabotin/Maurice/Prof. French Language & Litterature
Ranger/Leo/Mr. Facilities Management
Riddell/M.V./Mr. Facilities Management
Rose/Marjorie/Miss Psychology
Ross/Alvin F./Mr. Plant Science
Rostaing/Andrew J./Mr. Physical Plant
Schmitt/Elisabeth/Mrs. Pensioner
Schultz/Kathleen/Mrs. Accounting
Scrimgeour/Patricia/Mrs. Accounting
Smith/Ronald Menzies/Mr. Librairies
Steigerwald/Madeline/Mrs. Biochemistry
Thompson/George Robert/Mr. Physical Plant
Tremblay/Gilles/Dr. Pathology
Tweddell/Edna Grace/Mrs. Macdonald Campus
Wall/Marianne/Mrs. Microbiology & Immunology
Westley/William A./Prof. Sociology
Willis/Lila Jane/Mrs. Arts & Science
Wiseman/Olga Ow/Mrs. Librairies
27
M c G I L L U N I V E R S I T Y P E N S I O N P L A N
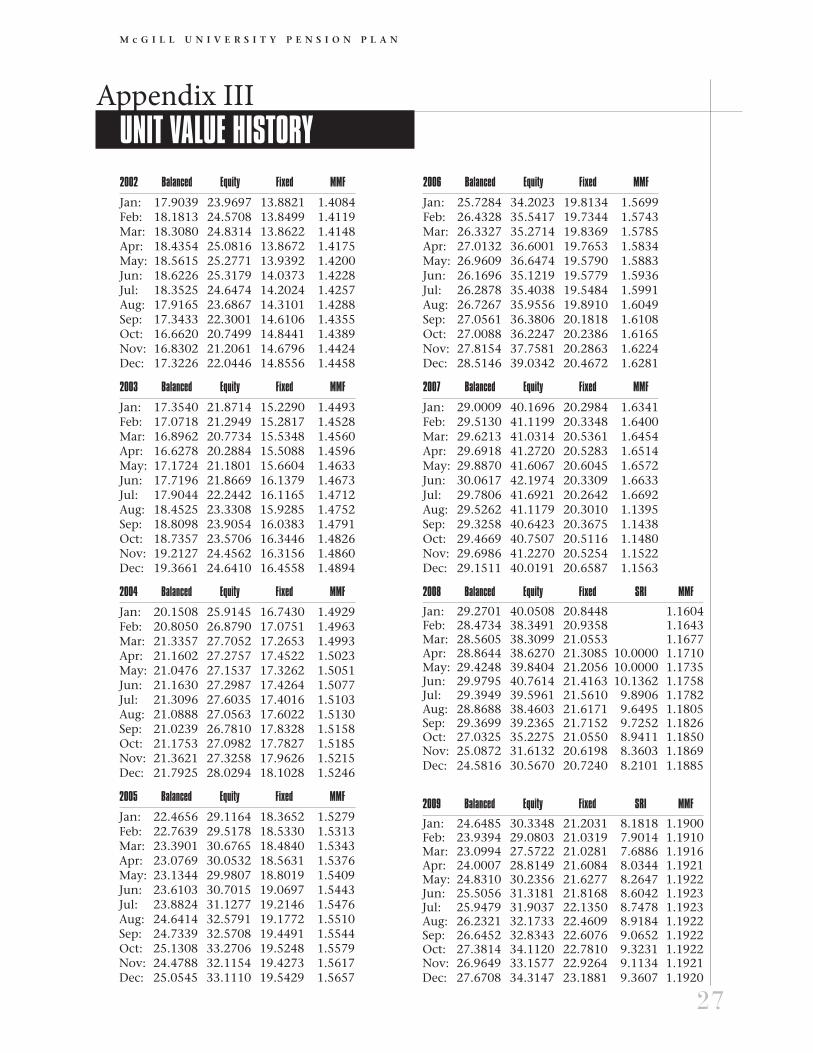
Appendix IIIUnit vaLUe history2002 Balanced equity fixed mmf
Jan: 17.9039 23.9697 13.8821 1.4084Feb: 18.1813 24.5708 13.8499 1.4119Mar: 18.3080 24.8314 13.8622 1.4148Apr: 18.4354 25.0816 13.8672 1.4175May: 18.5615 25.2771 13.9392 1.4200Jun: 18.6226 25.3179 14.0373 1.4228Jul: 18.3525 24.6474 14.2024 1.4257Aug: 17.9165 23.6867 14.3101 1.4288Sep: 17.3433 22.3001 14.6106 1.4355Oct: 16.6620 20.7499 14.8441 1.4389Nov: 16.8302 21.2061 14.6796 1.4424Dec: 17.3226 22.0446 14.8556 1.4458
2003 Balanced equity fixed mmf
Jan: 17.3540 21.8714 15.2290 1.4493Feb: 17.0718 21.2949 15.2817 1.4528Mar: 16.8962 20.7734 15.5348 1.4560Apr: 16.6278 20.2884 15.5088 1.4596May: 17.1724 21.1801 15.6604 1.4633Jun: 17.7196 21.8669 16.1379 1.4673Jul: 17.9044 22.2442 16.1165 1.4712Aug: 18.4525 23.3308 15.9285 1.4752Sep: 18.8098 23.9054 16.0383 1.4791Oct: 18.7357 23.5706 16.3446 1.4826Nov: 19.2127 24.4562 16.3156 1.4860Dec: 19.3661 24.6410 16.4558 1.4894
2004 Balanced equity fixed mmf
Jan: 20.1508 25.9145 16.7430 1.4929Feb: 20.8050 26.8790 17.0751 1.4963Mar: 21.3357 27.7052 17.2653 1.4993Apr: 21.1602 27.2757 17.4522 1.5023May: 21.0476 27.1537 17.3262 1.5051Jun: 21.1630 27.2987 17.4264 1.5077Jul: 21.3096 27.6035 17.4016 1.5103Aug: 21.0888 27.0563 17.6022 1.5130Sep: 21.0239 26.7810 17.8328 1.5158Oct: 21.1753 27.0982 17.7827 1.5185Nov: 21.3621 27.3258 17.9626 1.5215Dec: 21.7925 28.0294 18.1028 1.5246
2005 Balanced equity fixed mmf
Jan: 22.4656 29.1164 18.3652 1.5279Feb: 22.7639 29.5178 18.5330 1.5313Mar: 23.3901 30.6765 18.4840 1.5343Apr: 23.0769 30.0532 18.5631 1.5376May: 23.1344 29.9807 18.8019 1.5409Jun: 23.6103 30.7015 19.0697 1.5443Jul: 23.8824 31.1277 19.2146 1.5476Aug: 24.6414 32.5791 19.1772 1.5510Sep: 24.7339 32.5708 19.4491 1.5544Oct: 25.1308 33.2706 19.5248 1.5579Nov: 24.4788 32.1154 19.4273 1.5617Dec: 25.0545 33.1110 19.5429 1.5657
2006 Balanced equity fixed mmf
Jan: 25.7284 34.2023 19.8134 1.5699Feb: 26.4328 35.5417 19.7344 1.5743Mar: 26.3327 35.2714 19.8369 1.5785Apr: 27.0132 36.6001 19.7653 1.5834May: 26.9609 36.6474 19.5790 1.5883Jun: 26.1696 35.1219 19.5779 1.5936Jul: 26.2878 35.4038 19.5484 1.5991Aug: 26.7267 35.9556 19.8910 1.6049Sep: 27.0561 36.3806 20.1818 1.6108Oct: 27.0088 36.2247 20.2386 1.6165Nov: 27.8154 37.7581 20.2863 1.6224Dec: 28.5146 39.0342 20.4672 1.6281
2007 Balanced equity fixed mmf
Jan: 29.0009 40.1696 20.2984 1.6341Feb: 29.5130 41.1199 20.3348 1.6400Mar: 29.6213 41.0314 20.5361 1.6454Apr: 29.6918 41.2720 20.5283 1.6514May: 29.8870 41.6067 20.6045 1.6572Jun: 30.0617 42.1974 20.3309 1.6633Jul: 29.7806 41.6921 20.2642 1.6692Aug: 29.5262 41.1179 20.3010 1.1395Sep: 29.3258 40.6423 20.3675 1.1438 Oct: 29.4669 40.7507 20.5116 1.1480 Nov: 29.6986 41.2270 20.5254 1.1522 Dec: 29.1511 40.0191 20.6587 1.1563
2008 Balanced equity fixed sri mmf
Jan: 29.2701 40.0508 20.8448 1.1604Feb: 28.4734 38.3491 20.9358 1.1643Mar: 28.5605 38.3099 21.0553 1.1677Apr: 28.8644 38.6270 21.3085 10.0000 1.1710May: 29.4248 39.8404 21.2056 10.0000 1.1735Jun: 29.9795 40.7614 21.4163 10.1362 1.1758Jul: 29.3949 39.5961 21.5610 9.8906 1.1782Aug: 28.8688 38.4603 21.6171 9.6495 1.1805Sep: 29.3699 39.2365 21.7152 9.7252 1.1826Oct: 27.0325 35.2275 21.0550 8.9411 1.1850Nov: 25.0872 31.6132 20.6198 8.3603 1.1869Dec: 24.5816 30.5670 20.7240 8.2101 1.1885
2009 Balanced equity fixed sri mmf
Jan: 24.6485 30.3348 21.2031 8.1818 1.1900Feb: 23.9394 29.0803 21.0319 7.9014 1.1910Mar: 23.0994 27.5722 21.0281 7.6886 1.1916Apr: 24.0007 28.8149 21.6084 8.0344 1.1921May: 24.8310 30.2356 21.6277 8.2647 1.1922Jun: 25.5056 31.3181 21.8168 8.6042 1.1923Jul: 25.9479 31.9037 22.1350 8.7478 1.1923Aug: 26.2321 32.1733 22.4609 8.9184 1.1922Sep: 26.6452 32.8343 22.6076 9.0652 1.1922Oct: 27.3814 34.1120 22.7810 9.3231 1.1922Nov: 26.9649 33.1577 22.9264 9.1134 1.1921Dec: 27.6708 34.3147 23.1881 9.3607 1.1920

28
M c G I L L U N I V E R S I T Y P E N S I O N P L A N
2010 Balanced equity fixed sri mmf
Jan: 27.9925 35.1812 23.1049 9.4469 1.1919Feb: 27.5468 33.9080 23.4454 9.1742 1.1918Mar: 27.9945 34.8452 23.4323 9.3701 1.1918Apr: 28.5410 35.9659 23.3807 9.5375 1.1918May: 28.7819 36.4000 23.4525 9.5888 1.1917Jun: 28.0353 34.7846 23.5627 9.3351 1.1917Jul: 27.7862 34.0024 23.8925 9.2101 1.1919Aug: 28.5234 35.3850 23.9792 9.4233 1.1921Sep: 28.6518 35.2457 24.4096 9.4983 1.1925Oct: 29.7124 37.2280 24.6385 9.8056 1.1931Nov: 30.2207 38.2701 24.7590 10.0093 1.1936Dec: 30.2819 38.5385 24.5906 10.0590 1.1943
2011 Balanced equity fixed sri mmf
Jan: 31.1035 40.1866 24.5805 10.2667 1.1949Feb: 31.3358 40.6712 24.4686 10.3562 1.1957Mar: 31.8950 41.6112 24.6412 10.5420 1.1964Apr: 32.0751 41.9069 24.7040 10.5398 1.1972May: 32.3290 42.1546 25.0129 10.5606 1.1978Jun: 32.3476 41.9536 25.3029 10.5437 1.1986Jul: 31.9769 41.2628 25.2718 10.3627 1.1994Aug: 31.7965 40.4194 25.7409 10.2033 1.1998Sep: 31.2198 39.1932 25.7702 10.0512 1.2005Oct: 30.4366 37.3901 25.9824 9.7724 1.2011Nov: 31.4336 39.3131 26.1067 10.0260 1.2015Dec: 31.3803 39.0696 26.2454 10.0794 1.2021
2012 Balanced equity fixed sri mmf
Jan: 31.4659 38.9022 26.6652 9.9977 1.2025Feb: 32.4169 40.5399 26.8916 10.3106 1.2032Mar: 32.7868 41.3342 26.8569 10.4463 1.2038Apr: 33.0225 41.7668 26.8655 10.4928 1.2045May: 32.8858 41.4637 26.9038 10.4387 1.2051Jun: 32.4764 40.2358 27.3800 10.1960 1.2058Jul: 32.9679 41.1695 27.3701 10.3133 1.2065Aug: 33.1362 41.3076 27.6435 10.3706 1.2071Sep: 33.2695 41.5425 27.6226 10.4475 1.2078Oct: 33.9243 42.5644 27.8772 10.6136 1.2085Nov: 34.1678 42.9773 27.9126 10.6306 1.2092Dec: 34.2756 43.0220 28.0763 10.5985 1.2099
Appendix III – Unit Value History (continued)
A complete listing of all unit values since the inception of the Plan in 1972 is available on our website at: www.mcgill.ca/hr/bp/pensions/unithistory
29
M c G I L L U N I V E R S I T Y P E N S I O N P L A N
Appendix IVeXecUtive sUmmary of the actUariaL vaLUationHighlights of the Actuarial Valuation as at December 31, 2009
At the request of the Pension Administration Committee, we have performed an actuarial valuation of the McGill University Pension Plan as at December 31, 2009. The results of such valuation were presented in a formal report dated October 7, 2010, which has been filed with the government authorities. This document summarizes the process and results of this actuarial valuation.
The main objectives of the actuarial valuation are to determine the funded position of the Plan as at the valuation date, under both the funding and solvency bases, and to establish the contributions that are required to be made by the University to comply with the applicable legislation for the three-year period following the valuation date.
Funding valuation – Process and Results
For the funding valuation, the Plan’s actuarial liabilities are first compared with the market value of assets as at the valuation date. For the defined contribution provisions (“DC Segment”), actuarial liabilities correspond, by definition, to accumulated contributions and no funding surplus/deficiency can exist thereon. Conversely, for the defined benefit provisions, i.e. defined benefit minimum provision under Part A (“DB Minimum Segment”) and pensions in course of payment (“Pensioner Segment”), funding surplus/deficiency may exist. If a funding deficiency is revealed, it must be funded over a maximum period of 15 years by the University. In addition, the University must make contributions on account of current service; these contributions include those required under the DC provisions of the Plan and also those required on account of the DB Minimum Segment.
For the DB segments, actuarial liabilities and current service cost are a function of actuarial assumptions underlying the valuation process. A comprehensive review of actuarial assumptions was made in preparation for this valuation. The main assumptions used are: (a) a rate of interest of 5¾% per annum (“p.a.”), net of expenses, to value liabilities for pensioners; (b) a rate of interest of 6½% p.a., net of expenses, coupled with a wage inflation allowance of 3¼ % p.a., to value liabilities on account of the DB Minimum Segment; (c) the mortality table known as the “UP1994@2020”; and (d) tables of retirement rates based on the actual experience of the Plan in the period 2000-2009, separately for Academics and Non-Academics Members.
The main results of the funding valuation are as follows:
• The actuarial liabilities were $1,279,986,000 as at December 31, 2009 (i.e. $957,866,000 under the DC Segment, $298,807,000 under the Pensioner Segment and $23,313,000 under the DB Minimum Segment). The market value of the Pension Fund was $1,233,673,000 and there was therefore a funding deficiency of $46,313,000 as at the valuation date.
• As at the date of the preceding valuation (i.e. December 31, 2006), there was a funding surplus of $33,597,000; the main factors which contributed to the deterioration of the funded position since the preceding valuation are the investment return of the Fund which was below the actuarial assumptions (negative effects of $50.4M), the changes made to actuarial assumptions (increase in liabilities of $29.6M) and an increase of $7.6M in the liabilities on account of the DB Minimum Segment.
30
M c G I L L U N I V E R S I T Y P E N S I O N P L A N
• The minimum past service payments to be made by the University to amortize the funding deficiency over 15 years are calculated at $4,684,800 per annum; however, given temporary funding relief measures introduced under the Quebec pension legislation for 2010 and 2011 and extended for 2012 and 2013, the payments to be made could be reduced to 20% of the above level, i.e. $937,000. The University has elected to use the funding relief measures for 2010 and 2011, but not for 2012.
• With respect to current service, University contributions with respect to the DB Minimum Segment are calculated at $1,549,100 for 2010; these contributions are in addition to those required under the DC Segment, which are estimated at $26,220,000 for 2010.
Solvency valuation – Process and Results
The solvency valuation simulates what would have been the funded position of the Plan as at the valuation date had the Plan been terminated as at that date. The actuarial assumptions are largely dictated by legislation. As at December 31, 2009, solvency liabilities were calculated at $1,348,138,000 while assets were $1,233,297,000, for a solvency deficiency of $114,841,000 and a solvency ratio of 91.5%.
The results of the solvency valuation do not have any direct impact on the funding requirements under the Plan; however, additional University contributions may be required for external settlements to be made in totality, such additional contributions representing the unfunded portion of the settlements under the solvency basis.
Minimum University contributions for 2010-2012
In view of the results of the actuarial valuation as at December 31, 2009, the minimum contributions required to be made by the University until the next valuation are as follows:
With respect to the DC Segment:
• Determined in accordance with the provisions of the Plan; based on earnings as at the valuation date, University contributions to the DC Segment are estimated at $26,220,000 per annum for 2010
With respect to the DB Segments:
Year 2010 Year 2011 Year 2012
• University current service contributions $1,549,100 $1,599,400 $1,651,400 in respect of the DB Minimum Segment
• Minimum University contributions $937,000 $937,000 $4,684,800 to amortize the funding deficiency
• Total – DB Segments $2,486,100 $2,536,400 $6,336,200
The next required actuarial valuation is due no later than December 31, 2012 and needs to be filed with governmental authorities before the regulatory deadline of September 30, 2013. For 2013, the University will continue to contribute based on the December 31, 2009 valuation report until the filing of the December 31, 2012 actuarial valuation report, at which time the University will adjust its 2013 contributions retroactively to reflect the funding requirements revealed under that valuation. Early in 2013, the University has instructed the Pension Administration Committee that it has elected to take advantage of the funding relief measures for 2013.
Respectfully submitted,
Gilles Bouchard, FSA, FCIA, CFA Dany Desgagnés, FSA, FCIA
Appendix IV – Executive Summary (continued)

31
M c G I L L U N I V E R S I T Y P E N S I O N P L A N
Appendix VGLossaryAbsolute Return Strategies: An investment strategy that seeks to earn a positive return by using a variety of investment management techniques.
Active Management: A management style whereby a manager selects individual investments with the goal of earning a return higher than a comparative benchmark.
Actuary: An independent professional who calculates pension plan liabilities and compares them to pension plan assets in order to determine the financial status of a pension plan.
Annualized Rate of Return: A rate of return expressed over one year, although the actual rates of return being annualized are for periods longer or equal to one year.
Annuity: A series of payments of a fixed amount for a specified period of time.
Asset Allocation: The proportion of assets invested in different asset classes such as cash and equivalents, fixed-income securities and equities.
Asset-backed commercial paper (ABCP): ABCPs are issued by banks and non-bank financial companies and is backed by longer term assets such as car loans, mortgage loans, credit card balances and other interest-bearing assets.
Balanced Account: The investment option established by the Pension Administration Committee and which consists of allocations to the Equity and Fixed Income Pools in such proportions as shall be determined from time to time by the Committee.
Benchmark: A standard against which rates of return can be measured, such as stock and bond market indices.
Bonds: Evidence of a debt on which the issuer promises to pay the holder a specified amount of interest for a specified length of time and to repay the indebtedness at maturity.
Commercial paper: Commercial paper is short-term debt, usually maturing in under a year but frequently in as little as a month.
Common shares: Securities representing ownership in a company, usually carrying voting privileges. Common shareholders share in growth through capital appreciation and may also be entitled to dividends, at the company’s discretion.
Consumer Price Index (CPI): An inflationary indicator provided by Statistics Canada that measures the change in the price of a fixed basket of goods and services. The basket is supposed to reflect the average needs of a family.
Currency Forward Contracts: A contract that locks in the price at which an entity will buy or sell a specified amount of a foreign currency at a future date.
Defined Benefit Minimum Provision: Based on a formula that takes into account the plan member’s credited service and highest 60-consecutive months of earnings. Applicable to members enrolled in the Plan or eligible to enroll in the Plan prior to January 1, 2009.
DEX 30-day Treasury Bills Index: Measures the performance return attributable to 30-day Treasury Bills of the provincial and federal governments.
DEX Real-Return Bond Index: Measures the performance return of Canadian real-return bonds.
DEX Universe Bond Index: Designed to be a broad measure of the Canadian investment-grade fixed income market. The Universe Index is divided into a variety of sub-indices (e.g. Short, Mid, Long) according to term and credit quality and also consists of four main credit or borrower categories: bonds issued by the Government of Canada (including Crown Corporations), Provincial bonds (including provincially-guaranteed securities), Municipal Bonds, and Corporate Bonds.
DEX Universe Corporate Bond Index: A subset of the DEX Universe Bond Index containing only corporate bonds from major industry groups.
Diversification: A strategy to spread investment risk among different asset classes, different types of assets, among securities, among economic sectors, and among different countries.
Duration: A measure of the interest rate sensitivity of a bond’s market price taking into consideration its coupon and maturity date.
Emerging Markets: Markets in developing countries as defined by the International Finance Corporation (IFC) on the basis of Gross National Product (GNP) per capita. Countries classified as low or middle-income by the World Bank are considered developing or emerging countries.

32
M c G I L L U N I V E R S I T Y P E N S I O N P L A N
Appendix V – Glossary (continued)
Equity Pool: Those holdings of common and preferred shares and other such holdings which are generally considered to be equity securities. Equity Pool may hold cash and cash equivalents from time to time.
ETFs (Exchange-Traded Funds): A security that tracks an index or a basket of assets, but trades like a stock on an exchange.
Fixed Income Pool: Those holdings of bonds, debentures, mortgage loans, notes and other such holdings which are considered to be debt instruments. The Fixed Income Pool may hold cash and cash equivalents from time to time.
Funding Surplus: Means the amount, if any, by which the sum of the assets exceed the actuarial liabilities, as determined on a funding valuation basis.
Funding Deficiency: Means the amount, if any, by which the sum of the actuarial liabilities, as determined on a funding valuation basis, exceed the assets.
Funding Valuation: Assumes that the Plan will remain in effect indefinitely and is, therefore, based on long-term actuarial assumptions and methods.
High-Yield Bonds: A corporate bond that has been assigned a rating below investment grade by a rating agency reflecting lower credit quality of the issue.
Index Funds: An investment fund that closely replicates the composition of a particular market index (e.g. S&P 500 Index Fund).
Inflation: The term used to describe rising prices of goods and services within an economy. The purchasing power of the monetary unit declines when inflation is present.
Investment Objective – Balanced Account: To optimize capital accumulation over the long-term through allocations to the Equity and Fixed Income Pools with a target asset mix of 65% equity securities and 35% fixed income securities.
Investment Objective – Equity Pool: To provide long-term capital appreciation and dividend income by investing in a diversified portfolio of Canadian and foreign equity securities.
Investment Objective – Fixed Income Pool: To provide a predictable source of interest income, reduced volatility of investment returns and a hedge against deflation, by investing in a diversified portfolio of primarily Canadian fixed income securities. An allocation to real-return bonds will provide a hedge against inflation.
Investment Objective – Money Market Pool: To preserve capital, provide stable returns and maintain liquidity.
Investment Objective – SRI Pool: To optimize capital accumulation over the long-term in a “socially responsible” manner through allocations to equity and fixed income investments with a target asset mix of 65% equity securities and 35% fixed income securities including a maximum cash limit of 10%.
Liquidity: The ability to buy or sell an asset quickly with a minimal price impact.
London Gold Spot Price: A price per ounce of gold as determined daily by a sub-committee of the London Bullion Market Association.
Market Value: The price at which an investment can be bought or sold from/to non-related third parties.
Master Asset Vehicle II Notes (MAV II): Longer-term notes which were issued as part of the restructuring of Canadian non-bank asset-backed commercial paper.
Merrill Lynch Global High Yield (Hedged) Index: Measures the performance of below investment grade Canadian and US dollar-denominated bonds (i.e. rated BBB and lower) of Canadian domiciled corporate issuers. The index is fully hedged to eliminate the impact of the US dollar on US dollar-denominated issues.
MSCI EAFE: The Morgan Stanley Capital Inc. EAFE® Index (Europe, Australasia, Far East) is a free float adjusted (i.e. the equity of a company available to international investors) market capitalization index that is designed to measure the equity market performance of 22 developed markets, excluding the US & Canada.
MSCI EM: The Morgan Stanley Capital Inc. Emerging Market Index is a free float-adjusted market capitalization index that is designed to measure the equity market performance of 21 emerging markets.
MSCI World High Dividend Index: Derived from the MSCI World Index and includes large and midcap stocks across 24 developed market countries. The index in designed to reflect the performance of equities with higher than average dividend yields that are both sustainable and persistent.
Money Market Pool: Those holdings of cash, short-term investments and other such securities with maturities less than a year which are generally considered to be money market instruments.

33
M c G I L L U N I V E R S I T Y P E N S I O N P L A N
New Pool: Represents plan members who purchased their pensions on or after January 1, 2000 on the “new” rate basis.
Non-North American Investments: Investments made in securities of companies generally Domiciled outside of Canada or the United States.
Old Pool: Represents plan members who purchased their pensions on the “old” rate basis prior to January 1, 2000.
Pension Fund: Consists of employee and employer contributions into the Pension Plan plus the income, gains and/or losses derived from fund investments. In addition, the pension fund disburses all benefit payments provided by the Pension Plan and pays Pension Plan administration expenses.
Plan: Shall mean the McGill University Pension Plan as described in the Plan Document, as amended from time to time. The Pension Plan has been established for the purpose of providing retirement, death and termination benefits for employees and their beneficiaries.
Plan Document: The text of the McGill University Pension Plan as amended to January 1, 2012 and which is available for viewing by members at the offices of the Pension Administration Committee.
Private Equity: Equity capital invested in a private company and which may include, among others, investments in venture capital, corporate buyouts and mezzanine financing.
Rate of Return: The income earned (i.e. yield) plus/minus any realized and unrealized capital gains/losses for a particular period, usually expressed as a percentage.
Realized Gains/Losses: Capital gains/losses that result when an appreciated/depreciated asset is sold.
Real-Return Bonds: Evidence of a debt on which the issuer promises to pay the holder a periodic amount of interest for a specified length of time based on a real rate of interest and actual inflation. The bond’s principal or indebtedness is repaid on maturity.
Rebalancing: An investment approach by which the investor or manager maintains an investment mix by reallocating funds periodically over time.
S&P 500 LargeCap: A US index consisting of 500 stocks chosen for market size, liquidity, and
industry group representation. It is a market value weighted index, with each stock’s weight in the Index proportionate to its market value.
S&P/TSX 60: An index consisting of the 60 largest stocks listed on the Toronto Stock Exchange.
S&P/TSX Canadian SmallCap: An index of smaller Canadian companies that have been included in the S&P/TSX Composite index, but are not members of the S&P/TSX 60 or the S&P/TSX Canadian MidCap Indices.
S&P/TSX Composite: The principal broad market measure for Canadian equity markets.
Socially-Responsible Investment (“SRI”) Pool: Those equity and fixed income holdings and other such securities which are managed within a socially responsible investment framework. The SRI Pool may hold cash and cash equivalents from time to time.
Solvency deficiency: Means the amount by which the sum of the actuarial liabilities, as determined on a solvency basis, exceeds the sum of the assets. A solvency valuation is based on the assumption that the Plan is being terminated.
T-Bills: Treasury bills are short-term government debt, which do not pay interest but are sold at a discount to reflect short-term interest rates and mature at par value. The difference between the purchase price and the proceeds at maturity represents investment income.
Unit Value: The value/cost of each unit in a particular investment pool. Unit values for all the pools are calculated on a fair-value basis on the last business day of each month with a one-month lag. (e.g. the December unit values were based on the market values in effect on November 30th). Unit values are net of all investment and administrative expenses and fluctuate (subject to increase or decrease) on a monthly basis in accordance with prevailing market conditions.
Yield: A ratio obtained by dividing the annual income (dividends, interest, rent) by the current market price of an investment, generally expressed as a percentage.
Appendix V – Glossary (continued)

34
M c G I L L U N I V E R S I T Y P E N S I O N P L A N
Independent Auditor’srePort
To the Pension Administration Committee of the McGill University Pension Plan
We have audited the accompanying Financial Report of the McGill University Pension Plan, which comprises the statement of net assets available for benefits as at December 31, 2012 and the statement of changes in net assets available for benefits for the year then ended, and a summary of significant accounting policies and other explanatory information. The Financial Report has been prepared by management based on the financial reporting provisions described in the 2012 Guide to the Annual Information Return issued by the Régie des rentes du Québec relating to the preparation of a Financial Report under Section 161 of the Supplemental Pension Plans Act (Québec).
Management’s Responsibility for the Financial Report
Management is responsible for the preparation and fair presentation of this Financial Report based on the financial reporting provisions described in the 2012 Guide to the Annual Information Return issued by the Régie des rentes du Québec relating to the preparation of a Financial Report under Section 161 of the Supplemental Pension Plans Act (Québec), and for such internal control as management determines is necessary to enable the preparation of a Financial Report that is free from material misstatement, whether due to fraud or error.
Auditor’s Responsibility
Our responsibility is to express an opinion on this Financial Report based on our audit. We conducted our audit in accordance with Canadian generally accepted auditing standards. Those standards require that we comply with ethical requirements and plan and perform the audit to obtain reasonable assurance about whether the Financial Report is free from material misstatement.
An audit involves performing procedures to obtain audit evidence about the amounts and disclosures in the Financial Report. The procedures selected depend on the auditor’s judgment, including the assessment of the risks of material misstatement of the Financial Report, whether due to fraud or error. In making those risk assessments, the auditor considers internal control relevant to the entity’s preparation and fair presentation of the Financial Report in order to design audit procedures that are appropriate in the circumstances, but not for the purpose of expressing an opinion on the effectiveness of the entity’s internal control. An audit also includes evaluating the appropriateness of accounting policies used and the reasonableness of accounting estimates made by management, as well as evaluating the overall presentation of the Financial Report.
We believe that the audit evidence we have obtained is sufficient and appropriate to provide a basis for our audit opinion.

35
M c G I L L U N I V E R S I T Y P E N S I O N P L A N
Opinion
In our opinion, the Financial Report presents fairly, in all material respects, the net assets available for benefits of the McGill University Pension Plan as at December 31, 2012, and the changes in net assets available for benefits for the year then ended in accordance with the financial reporting provisions set out in the 2012 Guide to the Annual Information Return issued by the Régie des rentes du Québec relating to the preparation of a Financial Report under Section 161 of the Supplemental Pension Plans Act (Québec).
Basis of Accounting and Restrictions on Use
Without modifying our opinion, we draw attention to Note 2 to the Financial Report, which describes the basis of accounting. The Financial Report is prepared to assist the Pension Administration Committee of the McGill University Pension Plan to comply with the financial reporting requirements of the Régie des rentes du Québec. As a result, the Financial Report may not be suitable for another purpose. Our report is intended solely for the Pension Administration Committee of the McGill University Pension Plan and the Régie des rentes du Québec and should not be used by parties other than the Pension Administration Committee of the McGill University Pension Plan and the Régie des rentes du Québec.
Montreal, Quebec March 13th, 2013
________________________________
1CPA Auditor, CA, public accountancy permit No. 125888
Independent Auditor’s Report (continued)

36
M c G I L L U N I V E R S I T Y P E N S I O N P L A N
Accumulation Fund
ASSETS 2012 2011
Investments (Note 3) $1,043,527,554 $981,862,621Cash 7,082,068 5,376,212Currency contracts (Note 6) 656,527 2,247,507Accrued investment income 1,850,644 2,596,226Accounts receivable 1,411,731 677,944McGill University contributions receivable - 698,865Due from Pensioner Fund (Note 5) 89,524 106,864
1,054,618,048 993,566,239
LIABILITIES
Currency contracts (Note 6) 68,104 218,884Owing to former members 3,940,601 6,557,731McGill University over-contributions 57,399 -Accounts payable and accruals 1,736,366 1,595,623
5,802,470 8,372,238
Net assets available for benefits 1,048,815,578 985,194,001
Pensioner Fund
ASSETS
Investments (Note 3) 225,897,005 238,229,365Cash 1,762,367 1,894,827Currency contracts (Note 6) - 4,304Accrued investment income 752,337 588,105Accounts receivable - 268Due from McGill University 182,531 9,003
228,594,240 240,725,872
LIABILITIES
Currency contracts (Note 6) 10,289 -Accounts payable and accruals 64,039 72,130Due to Accumulation Fund (Note 5) 89,524 106,864
163,852 178,994
Net assets available for benefits 228,430,388 240,546,878
Total net assets available for benefits $1,277,245,966 $1,225,740,879
Statement of Net AssetsavaiLaBLe for BenefitsAs at December 31, 2012
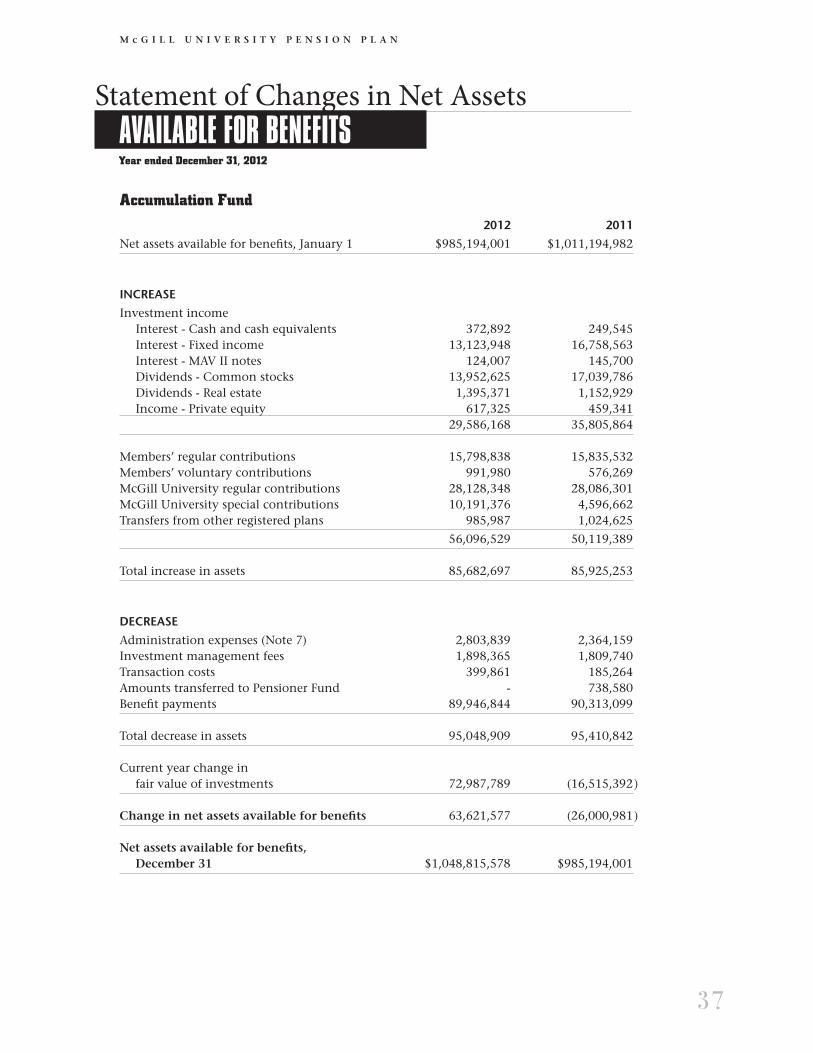
37
M c G I L L U N I V E R S I T Y P E N S I O N P L A N
Statement of Changes in Net AssetsavaiLaBLe for BenefitsYear ended December 31, 2012
Accumulation Fund 2012 2011
Net assets available for benefits, January 1 $985,194,001 $1,011,194,982
INCREASE
Investment income Interest - Cash and cash equivalents 372,892 249,545 Interest - Fixed income 13,123,948 16,758,563 Interest - MAV II notes 124,007 145,700 Dividends - Common stocks 13,952,625 17,039,786 Dividends - Real estate 1,395,371 1,152,929 Income - Private equity 617,325 459,341 29,586,168 35,805,864
Members’ regular contributions 15,798,838 15,835,532Members’ voluntary contributions 991,980 576,269McGill University regular contributions 28,128,348 28,086,301McGill University special contributions 10,191,376 4,596,662Transfers from other registered plans 985,987 1,024,625
56,096,529 50,119,389
Total increase in assets 85,682,697 85,925,253
DECREASE
Administration expenses (Note 7) 2,803,839 2,364,159Investment management fees 1,898,365 1,809,740Transaction costs 399,861 185,264Amounts transferred to Pensioner Fund - 738,580Benefit payments 89,946,844 90,313,099
Total decrease in assets 95,048,909 95,410,842
Current year change in fair value of investments 72,987,789 (16,515,392 )
Change in net assets available for benefits 63,621,577 (26,000,981 )
Net assets available for benefits, December 31 $1,048,815,578 $985,194,001

38
M c G I L L U N I V E R S I T Y P E N S I O N P L A N
Pensioner Fund 2012 2011
Net assets available for benefits, January 1 $240,546,878 $256,470,321
INCREASE
Investment income Interest - Cash and cash equivalents 174,233 173,893 Interest - Mortgage loans 99,734 1,500,626 Interest - Fixed income 4,441,224 1,870,180 Interest - MAV II notes 118,037 116,252 Dividends - Common stocks 1,621,378 1,321,150 Dividends - Real estate 1,818,924 1,760,509 8,273,530 6,742,610
Amounts transferred from Accumulation Fund - 738,580
Total increase in assets 8,273,530 7,481,190
DECREASE
Administration expenses (Note 7) 659,151 622,506Investment management fees 222,982 196,848Pension payments 32,359,961 33,452,650
Total decrease in assets 33,242,094 34,272,004
Current year change in fair value of investments 12,852,074 10,867,371
Change in net assets available for benefits (12,116,490) (15,923,443 )
Net assets available for benefits, December 31 $228,430,388 $240,546,878
Statement of Changes in Net AssetsavaiLaBLe for BenefitsYear ended December 31, 2012

39
M c G I L L U N I V E R S I T Y P E N S I O N P L A N
Notes to thefinanciaL rePortYear ended December 31, 2012
1. Summary Description of the Plan(A) GENERAL
The McGill University Pension Plan (“Plan”) is a retirement benefit arrangement for eligible employees (“Member”) of McGill University (“University”). The Plan is a Registered Pension Plan Trust as defined in the Income Tax Act and is not subject to income taxes. The pension for each Member is determined in accordance with the accumulated value of the Member’s pension account at retirement under a defined contribution arrangement, supplemented, as applicable, by a Defined Benefit Minimum Provision.
(B) FUNDING POLICY
Geographic Full-Time University staff (“GFT-U”)are required to contribute 5.5% of Basic Earnings, as defined in the Plan Document, less 1.8% of the portion of Basic Earnings that is subject to a Quebec Pension Plan contribution. All other Members are required to contribute 5.0% of Basic Earnings less 1.8% of the portion of Basic Earnings that is subject to a Quebec Pension Plan contribution. Effective January 1, 2013, these rates will increase by 2 percentage points for members aged 40 to 49 and by 3 percentage points for members aged 50 to 65.
The University is required to make regular monthly contributions to the Plan equal to a percentage of Basic Earnings determined according to the following table, less 1.8% of the portion of Basic Earnings subject to a required employer contribution to the Quebec Pension Plan:
University Regular Contributions as a Percentage of Basic Earnings
Members’ age at end of preceding GFT-U Othermonth Members Members
39 or less 5.8% 5.0%40 through 49 8.3% 7.5%50 to 65 (2011 - age 69) 10.8% 10.0%
For those Members enrolled in the Plan or eligible to enroll in the Plan prior to January 1, 2009, there is a Defined Benefit Minimum Provision determined according to a highest average earnings formula.
The University is required to make additional contributions as may be necessary to fund the cost of the Defined Benefit Minimum Provision, as well as other payments as required by law.
(C) RETIREMENT BENEFITS
The retirement benefit for each Member is determined in accordance with the accumulated value of the Member’s pension account at retirement including, if applicable, the Defined Benefit Minimum Provision.
(D) TERMINATION BENEFITS
A termination benefit is payable when a Member ceases to be employed. The value of the termination benefit is determined in accordance with the accumulated value of the Member’s pension account including, if applicable, the Defined Benefit Minimum Provision.
(E) DEATH BENEFITS
In the event of death before retirement, a lump sum death benefit equal to the accumulated value of the Member’s pension account, including, if applicable, the Defined Benefit Minimum Provision, is paid to the beneficiary or beneficiaries entitled thereto.
In the event of death after retirement, the death benefit, if any, is determined according to the settlement option chosen at retirement.
(F) ACCUMULATION FUND
The Accumulation Fund is composed of an Equity Pool, a Fixed Income Pool, a Socially-Responsible Investment Pool and a Money Market Pool. A Balanced Account is also available, composed of allocations to the Equity Pool and the Fixed Income Pool in proportions determined from time to time by the Pension Administration Committee (“PAC”).

40
M c G I L L U N I V E R S I T Y P E N S I O N P L A N
Notes to the Financial Report
Year ended December 31, 2012
1. Summary Description of the Plan (continued)
(F) ACCUMULATION FUND (continued)This structure offers a wide range of possible investment strategies permitting Members to create specific strategies that best respond to their individual financial needs.
All defined contribution assets of the Accumulation Fund are allocated to individual accounts and all investment income, gains and losses are distributed accordingly. Assets are, by definition, equal to liabilities and there can be no defined contribution surplus or deficit in the fund.
The Supplemental Fund holds University contributions arising from the Defined Benefit Minimum Provision, as well as the University’s funding related to actuarial valuation needs.
Any actuarial overfunding existing in the Supplemental Fund is the property of the University to be applied in such fashion as the University shall determine, including, but not limited to, the payment of University contributions otherwise required under the Plan.
Any actuarial underfunding arising from the Defined Benefit Minimum Provision or from actuarial valuation needs is the responsibility of the University, to be funded by University contributions.
The assets of the Supplemental Fund are invested in the Balanced Account and are included in the Accumulation Fund.
(G) PENSIONER FUND
The Pensioner Fund holds the assets required to secure the obligation for retired staff who opted for an internal pension settlement prior to January 1, 2011. Commencing January 1, 2011, Members can no longer opt for an internal settlement.
2. Significant Accounting PoliciesBASIS OF PRESENTATION AND
ACCOUNTING FRAMEWORK
The Financial Report has been prepared by management in accordance with the accounting framework for the preparation of a Financial Report mentioned in the 2012 Guide to the
Annual Information Return published by the Régie des rentes du Québec (“Régie”). The basis of accounting used in this Financial Report materially differs from Accounting Standards for Pension Plans because it excludes the pension obligations of the Plan and its related disclosures.
The Plan applies Section 4600, Pension Plans, of Part IV of the Canadian Institute of Chartered Accountants (“CICA”) Handbook. Section 4600 is the underlying accounting standard to the framework prescribed by the Régie. Accounting Standards for Private Enterprises in Part II of the CICA Handbook have been chosen for accounting policies that do not relate to the Plan’s investment portfolio, to the extent that those standards do not conflict with the requirements of Section 4600.
The Plan has also applied IFRS 13, Fair Value Measurement. Investments as at December 31, 2012 have been valued using the closing price.
The Financial Report is prepared on a going concern basis and presents the aggregate financial position of the Plan as a separate financial reporting entity independent of the University.
The Financial Report includes the accounts of Aylmer & Sherbrooke Investments Inc., a wholly-owned subsidiary until its dissolution on December 20, 2012. Aylmer & Sherbrooke Investments Inc. administered mortgage investments for the Pensioner Fund.
The Financial Report includes the following significant accounting policies:

41
M c G I L L U N I V E R S I T Y P E N S I O N P L A N
2. Significant Accounting Policies (continued)
INVESTMENTS
Investments are recorded as of the trade date and are carried at fair value. Fair value is the amount of the consideration that would be agreed upon in an arm’s length transaction between knowledgeable, willing parties who are under no compulsion to act.
The fair value of investments is determined as follows:
(a) Cash equivalents are valued using the amortized cost approach which accrues for interest income.
(b) Currency contracts are valued using year-end foreign exchange rates.
(c) Bond investments are valued using price or yield equivalent quotations supplied by third-party vendors.
(d) Common stock investments are valued at quoted market prices.
(e) Mortgage investments are valued at the present value of the future payments using current market yields of financial instruments of similar maturity and credit rating.
(f) Real estate investment valuations are based on periodic appraisals for privately-held real estate.
(g) Private equity investments are valued at management’s best estimate of current fair values. Management’s estimate is primarily derived from the most recent financial statements pertaining to the Plan’s private equity investments, adjusted for cash flows and foreign currency, as applicable.
(h) Gold investments are valued at quoted market prices.
(i) Absolute return strategies are valued by the investment managers’ fund administrator.
INCOME RECOGNITION
Investment income is recorded using the accrual method. Dividends and fund distributions are recorded when declared.
CURRENT YEAR CHANGE IN FAIR VALUE OF INVESTMENTS
The current year change in fair value of investments comprises both realized and unrealized gains and losses.
FOREIGN EXCHANGE
Transactions denominated in foreign currencies are translated into Canadian dollars at the rates of exchange in effect on the dates of the transactions. At each reporting date, the market value of foreign currency denominated assets and liabilities is translated using the rates of exchange at that date. The resulting gains and losses from changes in these rates are recorded as part of the current year change in fair value of investments in the Statement of Changes in Net Assets Available for Benefits.
USE OF ESTIMATES
The preparation of the Financial Report requires management to make estimates and assumptions that affect the reported amounts of assets and liabilities and disclosures of contingent assets and liabilities at the date of the Financial Report and the reported amounts of revenue and expenses during the reporting period. Actual results could differ from these estimates.
3. Investments(A) TERMS AND CONDITIONS
The terms and conditions of the investments are described as follows:
Cash and Cash Equivalents
Cash equivalent investments, primarily securities issued or guaranteed by Canadian governments, have an average term to maturity of 33 days in the Accumulation Fund (2011 - 19 days) and 30 days in the Pensioner Fund (2011 - 27 days).
Bonds
In the Accumulation Fund, bonds, 51% of which are guaranteed by the federal or provincial governments (2011 - 56%), have a weighted average yield to maturity of 2.94% (2011 - 2.93%) and an average duration of 6.9 years (2011 - 6.7 years). In the Pensioner Fund, bonds, 48% of which are guaranteed by the federal or provincial governments (2011 - 56%), have a weighted average yield to maturity of 3.79% (2011 - 2.82%) and an average duration of 6.9 years (2011 - 6.8 years).
Notes to the Financial Report
Year ended December 31, 2012
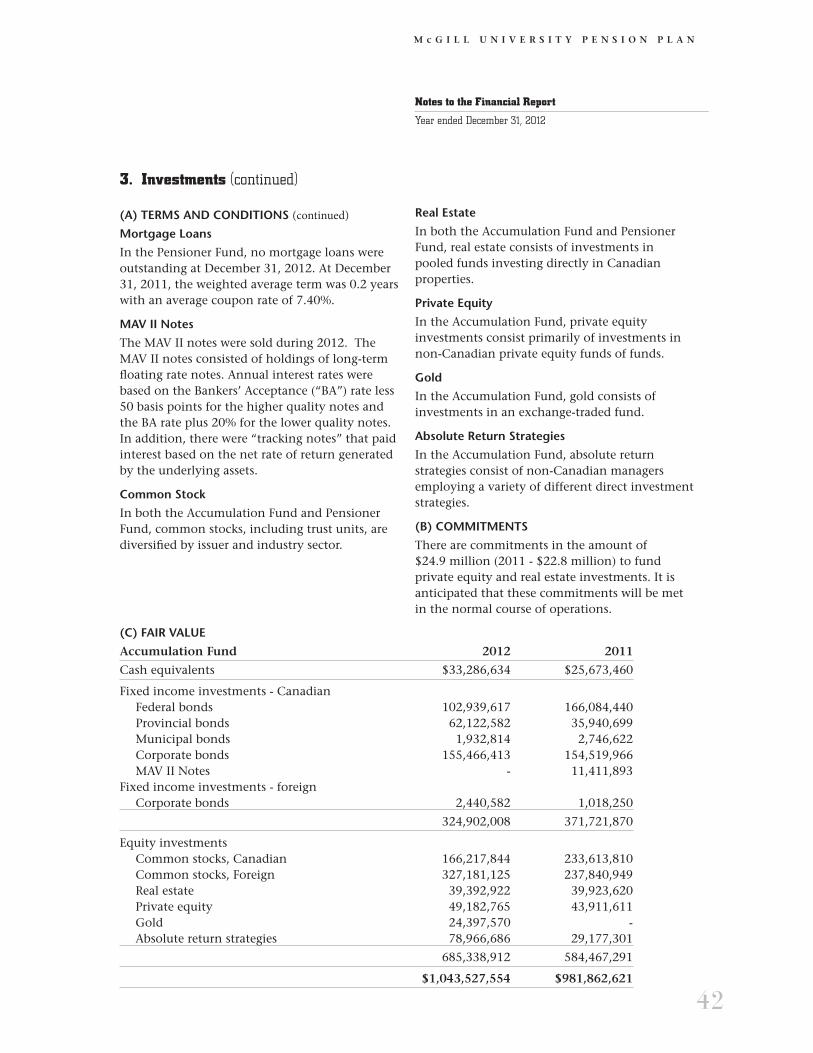
42
M c G I L L U N I V E R S I T Y P E N S I O N P L A N
3. Investments (continued)
(A) TERMS AND CONDITIONS (continued)Mortgage Loans
In the Pensioner Fund, no mortgage loans were outstanding at December 31, 2012. At December 31, 2011, the weighted average term was 0.2 years with an average coupon rate of 7.40%.
MAV II Notes
The MAV II notes were sold during 2012. The MAV II notes consisted of holdings of long-term floating rate notes. Annual interest rates were based on the Bankers’ Acceptance (“BA”) rate less 50 basis points for the higher quality notes and the BA rate plus 20% for the lower quality notes. In addition, there were “tracking notes” that paid interest based on the net rate of return generated by the underlying assets.
Common Stock
In both the Accumulation Fund and Pensioner Fund, common stocks, including trust units, are diversified by issuer and industry sector.
Real Estate
In both the Accumulation Fund and Pensioner Fund, real estate consists of investments in pooled funds investing directly in Canadian properties.
Private Equity
In the Accumulation Fund, private equity investments consist primarily of investments in non-Canadian private equity funds of funds.
Gold
In the Accumulation Fund, gold consists of investments in an exchange-traded fund.
Absolute Return Strategies
In the Accumulation Fund, absolute return strategies consist of non-Canadian managers employing a variety of different direct investment strategies.
(B) COMMITMENTS
There are commitments in the amount of $24.9 million (2011 - $22.8 million) to fund private equity and real estate investments. It is anticipated that these commitments will be met in the normal course of operations.
Notes to the Financial Report
Year ended December 31, 2012
(C) FAIR VALUE
Accumulation Fund 2012 2011
Cash equivalents $33,286,634 $25,673,460
Fixed income investments - Canadian Federal bonds 102,939,617 166,084,440 Provincial bonds 62,122,582 35,940,699 Municipal bonds 1,932,814 2,746,622 Corporate bonds 155,466,413 154,519,966 MAV II Notes - 11,411,893Fixed income investments - foreign Corporate bonds 2,440,582 1,018,250
324,902,008 371,721,870
Equity investments Common stocks, Canadian 166,217,844 233,613,810 Common stocks, Foreign 327,181,125 237,840,949 Real estate 39,392,922 39,923,620 Private equity 49,182,765 43,911,611 Gold 24,397,570 - Absolute return strategies 78,966,686 29,177,301
685,338,912 584,467,291
$1,043,527,554 $981,862,621

43
M c G I L L U N I V E R S I T Y P E N S I O N P L A N
Notes to the Financial Report
Year ended December 31, 2012
3. Investments (continued)
(C) FAIR VALUE (continued)Pensioner Fund 2012 2011
Cash equivalents $16,649,098 $24,375,332
Mortgage loans Conventional mortgage loans - 4,541,562
- 4,541,562
Fixed income investments - Canadian Federal bonds 17,997,125 47,130,104 Provincial bonds 36,207,934 10,384,624 Municipal bonds 1,643,251 779,811 Corporate bonds 57,075,838 44,581,502 MAV II notes - 11,326,893Fixed income investments - foreign Corporate bonds 1,110,995 432,760 114,035,143 114,635,694Equity investments Common stocks, Canadian 56,569,609 52,553,693 Real estate 38,643,155 42,123,084 95,212,764 94,676,777
$225,897,005 $238,229,365
4. Financial Instruments
(A) CREDIT RISK
Credit risk arises from the potential for a bond issuer or mortgagor to default on its contractual obligations to the Plan. Although the Plan policy permits investments in below investment grade securities, it provides limits on such investments. The credit risk of mortgagors is minimized by dealing with borrowers considered to be of high quality and by monitoring their credit risk. Investments are recorded at fair value. This represents the maximum credit risk exposure of the Plan. At December 31, 2012, no mortgage loans were past due (2011 - $2.2 million).
(B) INTEREST RATE RISK
Interest rate risk refers to the impact of interest rate changes on the Plan’s financial position. Interest rate changes directly impact the fair value of fixed income securities held in the Plan. Interest rate changes will also have an indirect impact on the remaining assets in the Plan. Duration is a measure used to approximate
the impact on the fair value of fixed income securities for a given change in interest rates. Using this measure, it is estimated that a 1% increase (decrease) in interest rates would decrease (increase) the fair value of fixed income investments by $22.4 million in the Accumulation Fund and by $7.9 million in the Pensioner Fund as at December 31, 2012 ($24.1 million and $7.0 million respectively as at December 31, 2011). To manage this risk, the duration of the Plan’s fixed income securities are monitored and adjusted, as appropriate.
(C) LIQUIDITY RISK
Liquidity risk refers to the rist that the Plan does not have sufficient cash to meet its liabilities, commitments, benefit payments and any other expected and unexpected cash flow requirements. The liquidity position of the Plan is analyzed regularly to ensure the Plan has sufficient liquid assets such as cash and money market securities. The Plan also maintains a portfolio of highly marketable assets that can be sold on a timely basis as protection against any unforeseen interruption to the cash flow requirements of the Plan.
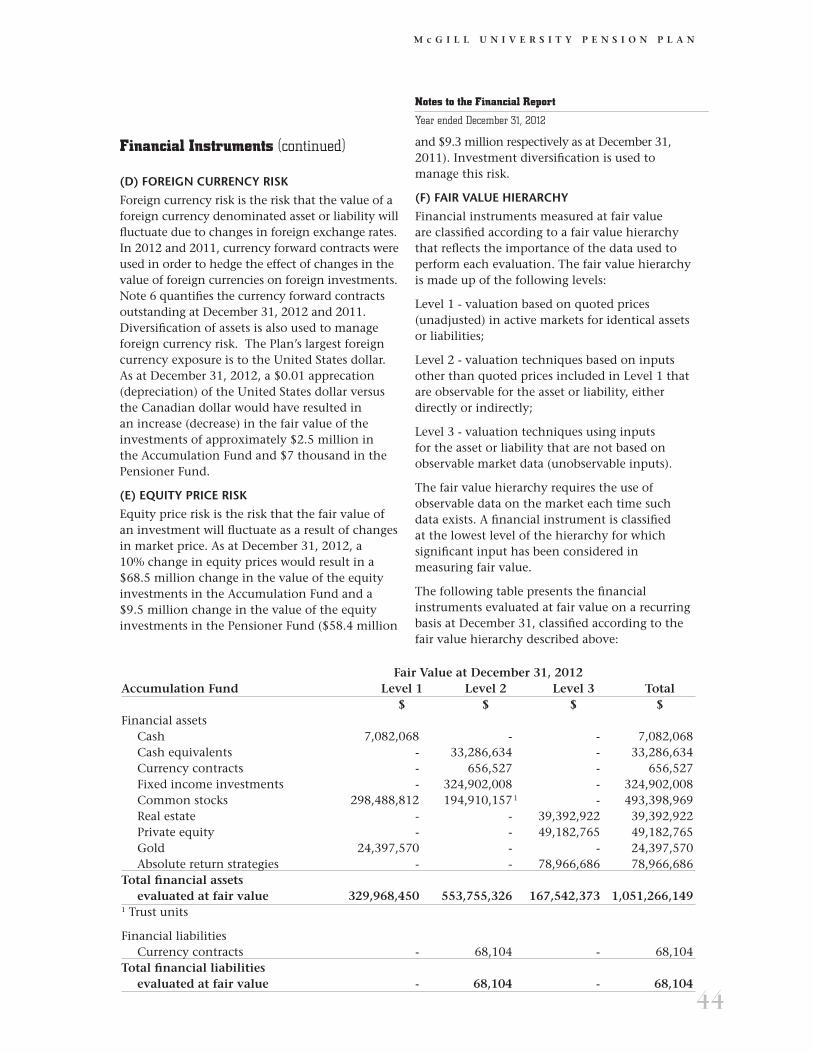
44
M c G I L L U N I V E R S I T Y P E N S I O N P L A N
Financial Instruments (continued)
(D) FOREIGN CURRENCY RISK
Foreign currency risk is the risk that the value of a foreign currency denominated asset or liability will fluctuate due to changes in foreign exchange rates. In 2012 and 2011, currency forward contracts were used in order to hedge the effect of changes in the value of foreign currencies on foreign investments. Note 6 quantifies the currency forward contracts outstanding at December 31, 2012 and 2011. Diversification of assets is also used to manage foreign currency risk. The Plan’s largest foreign currency exposure is to the United States dollar. As at December 31, 2012, a $0.01 apprecation (depreciation) of the United States dollar versus the Canadian dollar would have resulted in an increase (decrease) in the fair value of the investments of approximately $2.5 million in the Accumulation Fund and $7 thousand in the Pensioner Fund.
(E) EQUITY PRICE RISK
Equity price risk is the risk that the fair value of an investment will fluctuate as a result of changes in market price. As at December 31, 2012, a 10% change in equity prices would result in a $68.5 million change in the value of the equity investments in the Accumulation Fund and a $9.5 million change in the value of the equity investments in the Pensioner Fund ($58.4 million
and $9.3 million respectively as at December 31, 2011). Investment diversification is used to manage this risk.
(F) FAIR VALUE HIERARCHY
Financial instruments measured at fair value are classified according to a fair value hierarchy that reflects the importance of the data used to perform each evaluation. The fair value hierarchy is made up of the following levels:
Level 1 - valuation based on quoted prices (unadjusted) in active markets for identical assets or liabilities;
Level 2 - valuation techniques based on inputs other than quoted prices included in Level 1 that are observable for the asset or liability, either directly or indirectly;
Level 3 - valuation techniques using inputs for the asset or liability that are not based on observable market data (unobservable inputs).
The fair value hierarchy requires the use of observable data on the market each time such data exists. A financial instrument is classified at the lowest level of the hierarchy for which significant input has been considered in measuring fair value.
The following table presents the financial instruments evaluated at fair value on a recurring basis at December 31, classified according to the fair value hierarchy described above:
Notes to the Financial Report
Year ended December 31, 2012
Fair Value at December 31, 2012 Accumulation Fund Level 1 Level 2 Level 3 Total $ $ $ $Financial assets Cash 7,082,068 - - 7,082,068 Cash equivalents - 33,286,634 - 33,286,634 Currency contracts - 656,527 - 656,527 Fixed income investments - 324,902,008 - 324,902,008 Common stocks 298,488,812 194,910,157 1 - 493,398,969 Real estate - - 39,392,922 39,392,922 Private equity - - 49,182,765 49,182,765 Gold 24,397,570 - - 24,397,570 Absolute return strategies - - 78,966,686 78,966,686Total financial assets evaluated at fair value 329,968,450 553,755,326 167,542,373 1,051,266,1491 Trust units
Financial liabilities Currency contracts - 68,104 - 68,104Total financial liabilities evaluated at fair value - 68,104 - 68,104

45
M c G I L L U N I V E R S I T Y P E N S I O N P L A N
4. Financial Instruments (continued)
(F) FAIR VALUE HIERARCHY (continued) Fair Value at December 31, 2011 Accumulation Fund Level 1 Level 2 Level 3 Total $ $ $ $Financial assets Cash 5,376,212 - - 5,376,212 Cash equivalents - 25,673,460 - 25,673,460 Currency contracts - 2,247,507 - 2,247,507 Fixed income investments - 360,309,977 - 360,309,977 MAV II notes - - 11,411,893 11,411,893 Common stocks 295,699,915 175,754,8441 - 471,454,759 Real estate - - 39,923,620 39,923,620 Private equity - - 43,911,611 43,911,611 Absolute return strategies - - 29,177,301 29,177,301Total financial assets evaluated at fair value 301,076,127 563,985,788 124,424,425 989,486,3401Trust units
Financial liabilities Currency contracts - 218,884 - 218,884Total financial liabilities evaluated at fair value - 218,884 - 218,884
During 2012 and 2011, there has been no transfer of amounts between Level 1 and Level 2 or to or fromLevel 3. Fair Value at December 31, 2012 Pensioner Fund Level 1 Level 2 Level 3 Total $ $ $ $Financial assets Cash 1,762,367 - - 1,762,367 Cash equivalents - 16,649,098 - 16,649,098 Fixed income investments - 114,035,143 - 114,035,143 Common stocks - 56,569,609 1 - 56,569,609 Real estate - - 38,643,155 38,643,155Total financial assets evaluated at fair value 1,762,367 187,253,850 38,643,155 227,659,3721Trust units
Financial liabilities Currency contracts - 10,289 - 10,289Total financial liabilities evaluated at fair value - 10,289 - 10,289
Notes to the Financial Report
Year ended December 31, 2012

46
M c G I L L U N I V E R S I T Y P E N S I O N P L A N
Notes to the Financial Report
Year ended December 31, 2012
4. Financial Instruments (continued)
(F) FAIR VALUE HIERARCHY (continued)
Fair Value at December 31, 2011 Pensioner Fund Level 1 Level 2 Level 3 Total $ $ $ $Financial assets Cash 1,894,827 - - 1,894,827 Cash equivalents - 24,375,332 - 24,375,332 Currency contracts - 4,304 - 4,304 Mortgage loans - 4,541,562 - 4,541,562 Fixed income investments - 103,308,801 - 103,308,801 MAV II notes - - 11,326,893 11,326,893 Common stocks - 52,553,693 1 - 52,553,693 Real estate - - 42,123,084 42,123,084Total financial assets evaluated at fair value 1,894,827 184,783,692 53,449,977 240,128,4961Trust units
During 2012 and 2011, there has been no transfer of amounts between Level 1 and Level 2 or to or from Level 3.
The following table summarizes movements in the fair value of financial instrumentsclassified as Level 3 from the beginning balance to the ending balance:
Accumulation Fund Pensioner Fund
Fair value, January 1, 2011 $86,970,805 $45,368,369Purchases 37,550,695 4,721,933Sales (13,372,302 ) (2,619,338 )Change in fair value 13,275,227 5,979,013
Fair value, December 31, 2011 $124,424,425 $53,449,977
Purchases 63,960,721 2,598,359Sales (31,433,090 ) (22,165,883 )Change in fair value 10,590,317 4,760,702
Fair value, December 31, 2012 $167,542,373 $38,643,155
5. Due from Pensioner Fund/Due to Accumulation Fund
At December 31, 2012, $89,524 (2011 - $106,864) was the amount of the interfund account between the Accumulation Fund and the Pensioner Fund. The amount relates to an accrual for administrative expenses.
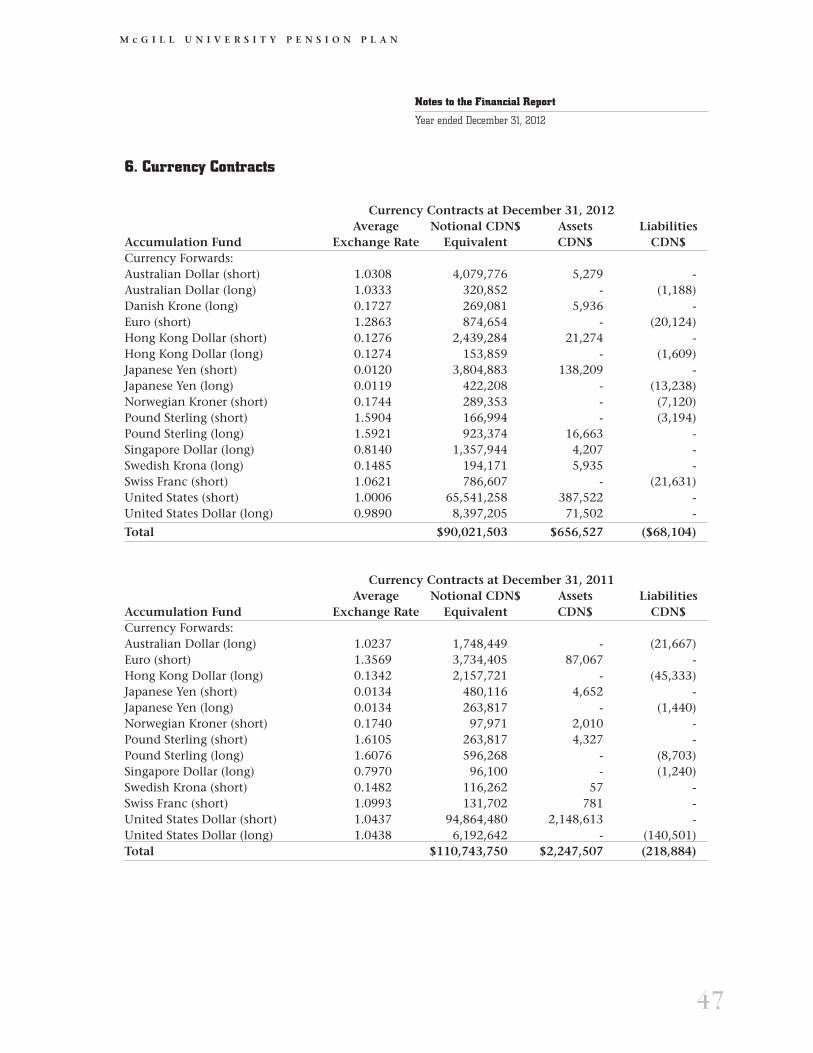
47
M c G I L L U N I V E R S I T Y P E N S I O N P L A N
6. Currency Contracts
Currency Contracts at December 31, 2012 Average Notional CDN$ Assets LiabilitiesAccumulation Fund Exchange Rate Equivalent CDN$ CDN$Currency Forwards:Australian Dollar (short) 1.0308 4,079,776 5,279 - Australian Dollar (long) 1.0333 320,852 - (1,188) Danish Krone (long) 0.1727 269,081 5,936 - Euro (short) 1.2863 874,654 - (20,124)Hong Kong Dollar (short) 0.1276 2,439,284 21,274 - Hong Kong Dollar (long) 0.1274 153,859 - (1,609) Japanese Yen (short) 0.0120 3,804,883 138,209 -Japanese Yen (long) 0.0119 422,208 - (13,238) Norwegian Kroner (short) 0.1744 289,353 - (7,120)Pound Sterling (short) 1.5904 166,994 - (3,194)Pound Sterling (long) 1.5921 923,374 16,663 -Singapore Dollar (long) 0.8140 1,357,944 4,207 -Swedish Krona (long) 0.1485 194,171 5,935 -Swiss Franc (short) 1.0621 786,607 - (21,631) United States (short) 1.0006 65,541,258 387,522 - United States Dollar (long) 0.9890 8,397,205 71,502 -
Total $90,021,503 $656,527 ($68,104)
Currency Contracts at December 31, 2011 Average Notional CDN$ Assets LiabilitiesAccumulation Fund Exchange Rate Equivalent CDN$ CDN$Currency Forwards:Australian Dollar (long) 1.0237 1,748,449 - (21,667)Euro (short) 1.3569 3,734,405 87,067 -Hong Kong Dollar (long) 0.1342 2,157,721 - (45,333)Japanese Yen (short) 0.0134 480,116 4,652 -Japanese Yen (long) 0.0134 263,817 - (1,440)Norwegian Kroner (short) 0.1740 97,971 2,010 -Pound Sterling (short) 1.6105 263,817 4,327 -Pound Sterling (long) 1.6076 596,268 - (8,703)Singapore Dollar (long) 0.7970 96,100 - (1,240)Swedish Krona (short) 0.1482 116,262 57 -Swiss Franc (short) 1.0993 131,702 781 -United States Dollar (short) 1.0437 94,864,480 2,148,613 -United States Dollar (long) 1.0438 6,192,642 - (140,501)Total $110,743,750 $2,247,507 (218,884)
Notes to the Financial Report
Year ended December 31, 2012
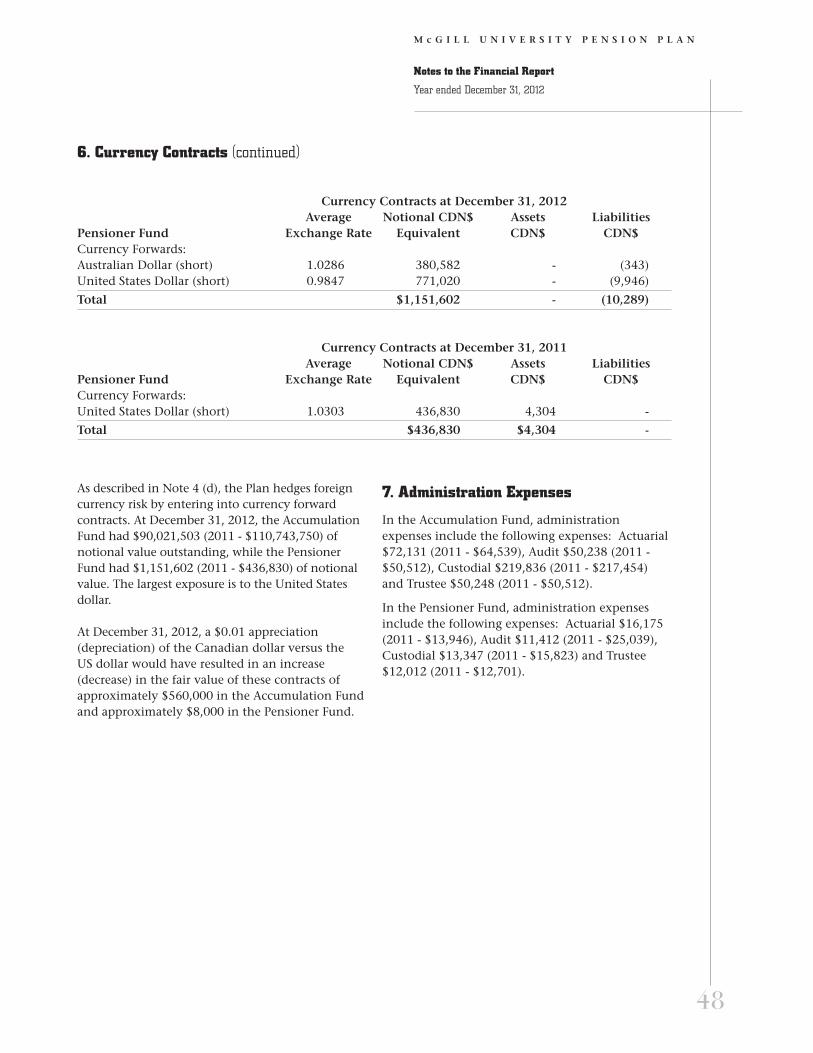
48
M c G I L L U N I V E R S I T Y P E N S I O N P L A N
As described in Note 4 (d), the Plan hedges foreign currency risk by entering into currency forward contracts. At December 31, 2012, the Accumulation Fund had $90,021,503 (2011 - $110,743,750) of notional value outstanding, while the Pensioner Fund had $1,151,602 (2011 - $436,830) of notional value. The largest exposure is to the United States dollar.
At December 31, 2012, a $0.01 appreciation (depreciation) of the Canadian dollar versus the US dollar would have resulted in an increase (decrease) in the fair value of these contracts of approximately $560,000 in the Accumulation Fund and approximately $8,000 in the Pensioner Fund.
7. Administration Expenses
In the Accumulation Fund, administration expenses include the following expenses: Actuarial $72,131 (2011 - $64,539), Audit $50,238 (2011 - $50,512), Custodial $219,836 (2011 - $217,454) and Trustee $50,248 (2011 - $50,512).
In the Pensioner Fund, administration expenses include the following expenses: Actuarial $16,175 (2011 - $13,946), Audit $11,412 (2011 - $25,039), Custodial $13,347 (2011 - $15,823) and Trustee $12,012 (2011 - $12,701).
Notes to the Financial Report
Year ended December 31, 2012
6. Currency Contracts (continued)
Currency Contracts at December 31, 2012 Average Notional CDN$ Assets LiabilitiesPensioner Fund Exchange Rate Equivalent CDN$ CDN$Currency Forwards:Australian Dollar (short) 1.0286 380,582 - (343) United States Dollar (short) 0.9847 771,020 - (9,946)
Total $1,151,602 - (10,289)
Currency Contracts at December 31, 2011 Average Notional CDN$ Assets LiabilitiesPensioner Fund Exchange Rate Equivalent CDN$ CDN$Currency Forwards:United States Dollar (short) 1.0303 436,830 4,304 -
Total $436,830 $4,304 -