meander valley council 2019-20 annual report
TRANSCRIPT

1 Working TogetherMeander Valley Council
Meander Valley Council2019-20 Annual Report

Photo credits: Meander Valley Council
DisclaimerThe Meander Valley Council Annual Report 2019-20 has been prepared with all due care and diligence, using the best available information at the time of publication. Meander Valley Council holds no responsibility for any errors or omissions within the document. Any decisions made by other parties based on this report are the responsibility of those parties.
Produced and published by Meander Valley Council, December, 2020

Message from Mayor Wayne Johnston 4Message from the General Manager 5About Meander Valley 6Meander Valley Councillors 8Organisational Structure 10
Strategy Implementation and Reporting 11 Annual Plan Performance Governance 12Corporate Services 13Community and Development Services 15Infrastructure Services 18Department of Works 21Capital Works Program Summary 22
Annual Disclosures Reporting of Legislative Requirements 25Overview of Financial Performance 30Financial Reports 35
Contents

4
Message from MayorWayne JohnstonOn behalf of Council, I would like to congratulate the Meander Valley community for your patience, understanding and remarkable resilience in the latter half of the financial year.
Council is immensely grateful for the incredible support received from a number of volunteer organisations and the broader community to assist us to facilitate transport, meals and other essential services to those most vulnerable in what have been difficult times.
Despite the practical challenges that come with managing operations amid the COVID-19 pandemic, Council has continued to maintain service delivery and complete a number of key projects including the new Westbury Recreation Ground Club Rooms and Function Centre, upgrades to the heating system at the Deloraine Swimming Pool, construction of the Westbury Road roundabout and the completion of a number of footpath projects that have greatly improved pedestrian connectivity.
Council has also completed significant upgrades at Blackstone Park. Informed by community
feedback, this new recreational space includes more activities for broader age ranges and an all-abilities basket swing and dual flying fox. In response to community need, Council also delivered a $1.7m Community and Business Support Package to assist Meander Valley to recover from the effects of the pandemic.
As we head towards 2021, we do so with optimism and an eagerness to continue to deliver the best outcomes for the community and with the community.
I would like to thank the team of staff that I know do their best to provide exceptional service and I would also like to thank all residents in Meander Valley for the support you provide to Council and each other.
Wayne Johnston, Mayor

5
Message fromGeneral Manager
We delivered a range of significant projectsand although the year ahead will continue to be marked by challenges and uncertainty, we remain clear about our priorities and the role Council must play in providing services to the community.
Having commenced my role as General Manager in January, this is my first Annual Report and, as I reflect upon the past year, I am extremely proud of how our Councillors, staff and the community have worked together in response to the challenges of the health crisis.
Despite being a small organisation, Meander Valley Council has great resilience and capability and I look forward to the future with immense optimism.
The past year has also been one of transition with the retirement of several long standing and well regarded employees. On behalf of the organisation I thank you all for your valuable contributions.
Finally, I would like to thank Mayor Wayne Johnston, Councillors and the executive team for their leadership throughout the year and Council staff for their support and for maintaining services to the community throughout challenging times.
It has been a year defined by the COVID-19 health crisis which has added an unforeseen layer of complexity. This presented widespread challenges to our community and operations of Council.
Council has remained proactive in addressing these challenges, quickly changing focus to prioritise assistance in response to the pandemic and the declared state of emergency.
Our $1.7 million Community and Business Recovery package delivered a raft of initiatives to help businesses, sporting and community organisations to keep operating or to reopen after lockdown. Support included rates and fee relief, small business and community grants, a freeze on any increases to rates and fees, the introduction of special hardship provisions for outstanding rates and service delivery support for Council’s community cars.
Not surprisingly and as reflected in this report, the COVID-19 health crisis has had a detrimental impact on Council finances, with reduced revenues and increased costs likely to continue into at least the next year.
While Council retains a healthy financial position, adjustment is needed. Council will review its long term financial plan and capacity to deliver value and provide the services and infrastructure expected by our customers. Despite the COVID-19 health crisis, Council has performed well delivering 90 percent of actions and targets set out in our Annual Plan.
John Jordan, General Manager

6
About the Meander Valley Region
Meander Valley has some of the State’s best walking trails, cycling routes, trout fishing and gourmet food producers.
The region’s central location and close proximity to major airports and transport routes are attractive to investors and a number of agricultural, manufacturing and logistics businesses are based in Meander Valley.
Those who live and work in Meander Valley enjoy a rural lifestyle set amongst some of Tasmania’s best world heritage listed wilderness and historic English style villages that are centrally located, well serviced and an easy commute to both Devonport and Launceston.
LauncestonDevonport
Hobart
$20,396,936
$19,963,152
$10,742,199
19,68613
36
63
8
ResidentsPublic Halls
Playgroundsand Fitness
Stations
Parks and Reserves
SportingGrounds
Total Operating Revenue
Total Operating Expenditure
Capital Expenditure
Square Kilometres of
Land Area
3,821
10,340RateableAssessments

7
821 411,700Local
BusinessesKilometres of
Road NetworksSportingFacilities
6,500Kerbside
CollectionServices
9Elected
Members
Municipal Swimming Pools BridgesMunicipal
Waste Facilities2 1933

8
Meander Valley CouncillorsMeander Valley Council consists of nine Councillors, including the Mayor and the Deputy Mayor. The entire municipality votes to elect Councillors, the Mayor and the Deputy Mayor for a term of four years.
The role of the Mayor and Councillors is to represent the community. Councillors undertake a range of duties not limited to; providing leadership, informing policy and making decisions on behalf of the community that comply with legislation. Elected members work closely with Council’s management team on a range of plans and strategies that guide the delivery of projects and services across the municipality.
Representation by Councillors on Committees and Community Organisations 2019-20
Committee or Organisation Representative/sAudit Panel Councillor Frank Nott
Councillor Susie BowerMVC Emergency Management and Community Recovery Committee
Mayor Wayne Johnston Councillor Andrew Sherriff
TasWater Mayor Wayne JohnstonDeputy Mayor Michael Kelly
Great Western Tiers Tourism Association Councillor John Temple
Northern Tasmania Regional Development Board
Mayor Wayne Johnston
Local Government Association of Tasmania Mayor Wayne JohnstonDeputy Mayor Michael Kelly
Australia Day Awards Committee Deputy Mayor Michael KellyCouncillor Susie Bower
Community Grants Committee Councillor Tanya KingCouncillor Stephanie Cameron
Development Assessment Group Mayor Wayne Johnston, Deputy Mayor Michael Kelly, Councillor Stephanie Cameron, Councillor Frank Nott, Councillor Susie Bower, Councillor Rodney Synfield, Councillor Tanya King, Councillor John Temple, Councillor Andrew Sherriff.

9
Mayor Wayne Johnston
Deputy Mayor Michael Kelly
CouncillorStephanie Cameron
Councillor Susie Bower
Councillor Rodney Synfield
Councillor Tanya King
Councillor Frank Nott
Councillor John Temple
Councillor Andrew Sherriff

10
Director, Community & Development Services Lynette While
Organisational Structure
Director Corporate Services Jonathon Harmey
Director Infrastructure Services Dino De Paoli
DirectorWorks Matthew Millwood
Meander Valley Council’s senior management, under the direction of the General Manager provide leadership to maintain good governance, achieve excellence in service delivery and deliver the strategic outcomes determined by Council.
General Manager John Jordan
General Manager
Elected Mayor, Deputy Mayor & Councillors
Executive Services
Customer Service Finance & RatesHuman ResourcesIT & Information ManagementGreat Western TiersVisitor Information Centre
PlanningBuildingCommunity DevelopmentPublic & Environmental HealthSport & Recreation
Transport InfrastructureBuilding & Recreational InfrastructureAsset ManagementProperty ManagementWaste ManagementEmergency Management
Parks, Reserves & Recreation Ground Operations Road & Drainage OperationsPublic Amenities & Street CleaningDepot & Plant Management
CommunicationsRisk, Health & Safety
DirectorCorporate Services
Director Community &
Development ServicesDirector
Infrastructure ServicesDirectorWorks

11
Strategy Implementation and Reporting
Key Measures of Performance 2019-20
This report documents our performance against the Annual Plan. It serves as an assessment of progress towards the implementation of the Community Strategic Plan 2014-2024 and celebrates a broad range of achievements. The Annual Report contains details about:
• Our key performance measures against what was set out in the Annual Plan• Results of actioning the operational plans set out in the Annual Plan• Details of the services that have been provided to the community• Transparency and accountability• Reports required by legislation• Financial performance and financial reports
$10.7mCapital Works Projects
Annual Plan Targets Achieved 2% Cancelled, 4% Deferred
Customer Service RequestResponse Rate
Community Grants,Sponsorships
COVID-19 Community and Business Support Package
Value of Building Applications Processed
Customer Service Requests Received
90% 99.82%
$66,961
$1.7m
$33.1m1,085

12
GovernanceThe 2019-20 financial year marked a changing of the guard in Council’s Governance department. Following the departure of former General Manager Martin Gill in 2019, Director, Corporate Services Jonathan Harmey stepped up as Acting General Manager for a period of five months while a recruitment process was undertaken. John Jordan joined Council as incoming General Manager in February 2020.
The key responsibility of the General Manager’s office and Governance department at Council is to oversee both strategic direction and executive leadership within Council, and to liaise with elected representatives to ensure effective execution of Council policy. This safeguards Council’s trajectory on a path toward continual improvement and service excellence.
Despite the disruption of leadership change during this financial year, several constants ensured that Council’s Governance department could maintain its high service standards. This included delivery of high level communications to keep Council in tune with its community, by adopting traditional methods of outreach alongside development of more future-focused communication methods (incorporating website
Annual Plan PerformanceActivity Action ResultSecretarial and Administration SupportUndertake functions to ensure compliance with legislative requirements.
Deliver Annual PlanPrepare Annual Report and Conduct AGMReview Community Strategic PlanInvestigation development of a Community Consultation Policy
AchievedAchievedDeferredDeferred
Risk Management Minimise risk to our people and the public
Implement Risk Management FrameworkImplement Internal Audit Program
AchievedIn Progress
Employee Health & Safety ManagementProvide a safe place of work for our people and to measure and monitor our employer obligations
WHS and Risk Committee to meet regularly to monitor the performance and operation of the WHS systems and Risk managementDeliver a Health and Wellbeing Program Workplace Consultative Committee operation
All Achieved
Economic DevelopmentTo create an investment ready environment in the Meander Valley Local Government Area
Promote investment in Meander Valley to support the growth of identified industry sectorsSignage strategy
In Progress
In Progress
upgrades and an increased social media presence). The Governance team also delivered Council’s Annual Plan, quarterly reporting and Annual Report, as well coordinating and preparing all required Council agendas, minutes and reports (both for meetings and Council workshops). This is in addition to hosting routine citizenship ceremonies and Council’s formal Australia Day celebrations.
Finally, Council’s Risk and Work Health Safety (WHS) function maintained an up-to-date risk register and coordinated internal audit processes.Council also initiated a comprehensive COVID-19 technical response. This service supported community groups and event organisers to navigate the complexities of managing COVID-safe activities.
An additional role was created in the Governance department to proactively support economic and social recovery. This role joined forces with Council’s delivery of existing business support and community grants services to coordinate and bolster community assistance after a difficult period.
13
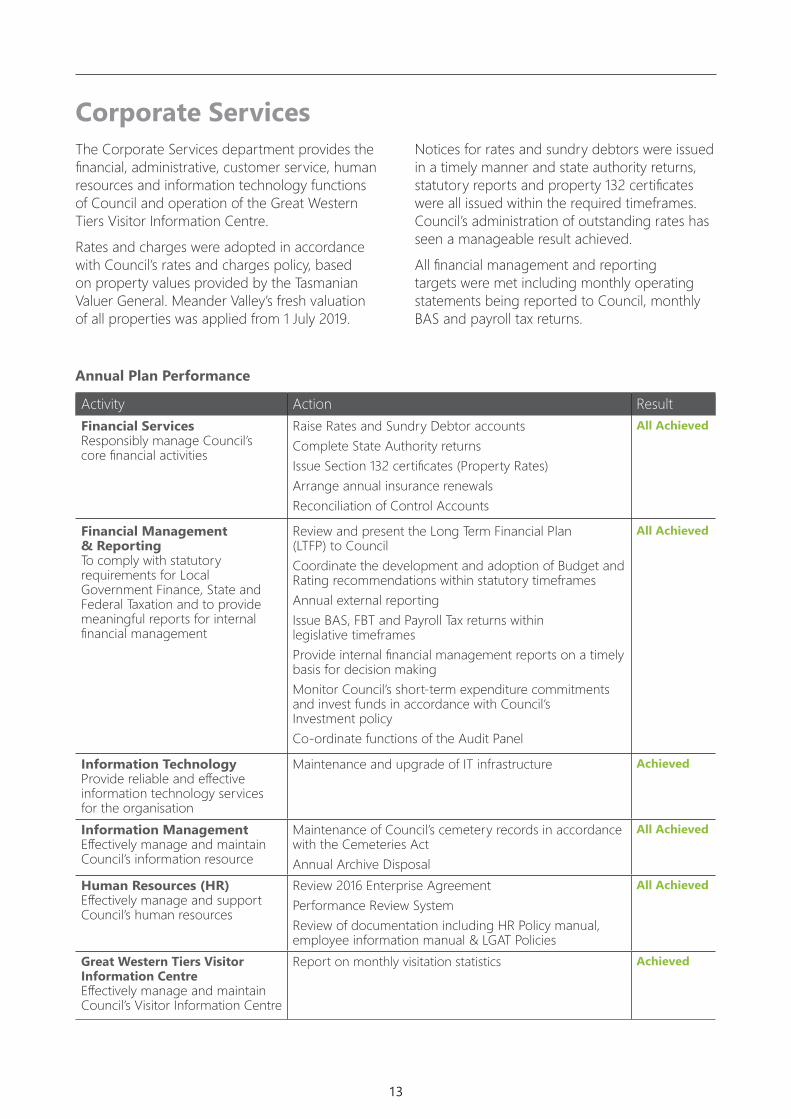
Corporate ServicesThe Corporate Services department provides the financial, administrative, customer service, human resources and information technology functions of Council and operation of the Great Western Tiers Visitor Information Centre.
Rates and charges were adopted in accordance with Council’s rates and charges policy, based on property values provided by the Tasmanian Valuer General. Meander Valley’s fresh valuation of all properties was applied from 1 July 2019.
Notices for rates and sundry debtors were issued in a timely manner and state authority returns, statutory reports and property 132 certificates were all issued within the required timeframes. Council’s administration of outstanding rates has seen a manageable result achieved.
All financial management and reporting targets were met including monthly operating statements being reported to Council, monthly BAS and payroll tax returns.
Annual Plan Performance
Activity Action ResultFinancial ServicesResponsibly manage Council’s core financial activities
Raise Rates and Sundry Debtor accountsComplete State Authority returnsIssue Section 132 certificates (Property Rates)Arrange annual insurance renewalsReconciliation of Control Accounts
All Achieved
Financial Management & ReportingTo comply with statutory requirements for Local Government Finance, State and Federal Taxation and to provide meaningful reports for internal financial management
Review and present the Long Term Financial Plan (LTFP) to CouncilCoordinate the development and adoption of Budget and Rating recommendations within statutory timeframesAnnual external reportingIssue BAS, FBT and Payroll Tax returns within legislative timeframesProvide internal financial management reports on a timely basis for decision makingMonitor Council’s short-term expenditure commitments and invest funds in accordance with Council’s Investment policyCo-ordinate functions of the Audit Panel
All Achieved
Information TechnologyProvide reliable and effective information technology services for the organisation
Maintenance and upgrade of IT infrastructure Achieved
Information ManagementEffectively manage and maintain Council’s information resource
Maintenance of Council’s cemetery records in accordance with the Cemeteries ActAnnual Archive Disposal
All Achieved
Human Resources (HR)Effectively manage and support Council’s human resources
Review 2016 Enterprise AgreementPerformance Review SystemReview of documentation including HR Policy manual, employee information manual & LGAT Policies
All Achieved
Great Western Tiers Visitor Information Centre Effectively manage and maintain Council’s Visitor Information Centre
Report on monthly visitation statistics Achieved

14
2019-20 Snapshots
Play Space Upgrades, Blackstone Park
Footpath Construction Projects, Westbury
Westbury Recreation Ground Sports Pavilion Redevelopment Delivered • December 2019
Bradys Creek Tributary, Maloneys Road
Delivered • January 2020 Delivered • October 2019
Delivered • June 2020

15
Community and Development ServicesCommunity ServicesIt has been a year of challenges and change for our community services team.
COVID-19 and the ensuing state of emergency declaration certainly impacted the way we were able to engage with the community and as a result, a range of scheduled activities were either cancelled or postponed. This included the renewal of the Community Strategic Plan.
Despite this, the team quickly transitioned to provide direct and indirect support to the community to ensure services continued to be provided to those most vulnerable. This included interim management of the Deloraine and Westbury community cars and expanding the service to include essential deliveries throughout periods of lockdown.
Throughout April and May, the Department worked hard to administer a range of grant opportunities that were released as part of Council’s $1.7m COVID-19 Community and Business Support Package.
Grants were well subscribed and provided immediate assistance to enable businesses to re-open and begin to recover from the economic impacts of the pandemic.
We look to the future with more dynamic and adaptive skills that will assist us to better engage with and support the community.
Development Services Development Services has seen an overall trend of increase in workload, both in quantity and complexity, across the board over the past five years.
In 2019-20, we saw a continuation of this trend in building and plumbing applications, evident from a 5% increase in the total number of building and plumbing applications. Costs of associated building work was lower (value of building works having decreased by 25% on the previous financial year) and more minor in nature.
Council’s Permit Authority has continued to deal with a large number of illegal building work matters, especially in response to issues arising during house sales and contract settlement. The increasing complexity of the building legislation continues to add a level of non-compliance within the community.
The number of outstanding building permits has been further decreased by 55% which is in excess of the targeted decrease of 10% per quarter. The planning team processed 287 applications for planning permits during this financial year which is a very minor decrease in the number of planning permit applications processed by Council in the corresponding period in 2018-19. However, this year’s statistics represent a 9% increase on the average number of planning applications over the past five financial years.
Of the planning applications processed, 203 were discretionary applications. When no further information was required and the statutory clock did not stop applications were processed, on average, within 33 days. This is 9 days shorter than the 42 day statutory period provided within the Land Use Planning and Approvals Act 1993. A total of 21 discretionary planning applications were presented to Council as the Planning Authority for determination.
Environmental Health Statement The Meander Valley Council recognises the importance of protecting the health and safety of its residents and visitors. Council is required to undertake numerous inspection and monitoring programs to ensure compliance with the Public Health Act 1997, Food Act 2003 and associated regulations and guidelines. Approximately $270,000 was spent on environmental health projects and services during 2019-20, including the employment of two full-time Environmental Health Officers.

16
Council’s core Environmental Health functions are:• Food safety, including registration and inspection of food businesses and education;
• Disease prevention and control, including immunisations, notifiable disease investigations, education, and sharps disposal service;
• Water quality monitoring, including recreational water, public pools/spas and private water suppliers;
• Licencing and inspection of Places of Assembly (specific events);
• Licencing and inspection of premises where public health risk activities are carried out; • On-site wastewater management system assessment and installation inspections; and
• Public health and environmental complaints.
The following summarises the activities carried out during the financial year 2019-20:Activities under Public Health Act 1997:
• Eight (8) Place of Assembly (Specific Events) Licences issued and two (2) Place of Assembly (Specific Events) inspected;
• Four (4) recreational water sites sampled on a weekly basis from December to the end of March, totaling 68 samples;
• Eight (8) public pools/spas were sampled on a monthly basis, totaling 71 samples;
• 27 private water suppliers/water carriers registered and 39 private water supplier samples undertaken;
• Two (2) premises where public health risk activities are carried out licenced and two (2) premises where public health risk activities are carried out inspected;
• Three (3) regulated systems registered;
• Four (4) unhealthy premises investigations undertaken;
• Five (5) notifiable disease investigations completed;
• Immunisation sessions were held at Deloraine High School and Giant Steps Tasmania in September 2019 and March 2020. Immunisations were provided in accordance with the National Immunisation Program Schedule and included diphtheria, tetanus and pertussis (whooping cough) (dTpa), human papilloma virus (HPV), in addition to Meningococcal ACWY vaccinations provided for 15-19 year olds under the Tasmanian Government Meningococcal W Program. 162 vaccines were administered at the school sessions during the year. Immunisations against seasonal influenza were also offered to all Meander Valley Council Staff.
Activities under Food Act 2003:• Council implemented the State Government’s Food Business Classification System (RCS) which took effect statewide in July 2019. Each food business has been assigned a risk category based on food types and food handling activities, and subsequently an inspection frequency for each has been designated in accordance with the RCS;
• 179 food premises and 33 statewide mobile businesses were registered and 70 food businesses notified under the Food Act 2003;
• 177 inspections were completed for premises registered or notified under the Food Act 2003;
• 66 temporary food stall applications were registered and 88 inspections of statewide mobile businesses or temporary food stalls were conducted, including 68 inspections at the Tasmanian Craft Fair 2019;
• Six (6) complaints relating to food premises investigated.
Other Activities:• 88 environmental complaints investigated (e.g. noise, water quality and air pollution);
• 49 on-site wastewater management system assessments completed and 49 on-site wastewater management system installation inspections undertaken;
• 191 development application referrals completed.

17
Annual Plan Performance
Activity Action ResultLand Use and PlanningCarry out planning duties and prepare policies for the sustainable development of the local government area
Process development applications in accordance with delegated authorityProcess Planning Scheme amendments
All Achieved
Building , Plumbing and Permit AuthorityCarry out statutory responsibilities for the administration and enforcement of the Building Act 2016 and the Building Regulations 2016
Permit Authority – Issue Permits for Category 4 Building worksProcess Notifiable Building worksManage outstanding Building completions and illegal worksConduct inspections and process applications for plumbing permitsProcess Notifiable Plumbing works
All Achieved
Environmental HealthManage Council’s statutory obligations in relation to Environmental Protection and Preventative Health
Monitor and sample water quality of recreational watersInspect and register food premises annuallyCo-ordinate immunisation clinics
All Achieved
General InspectorTo carry out statutory responsibilities for the administration and enforcement of the Dog Control Act 2000, Fire Services Act 1979 and the Local Government Act 1993
Annual Audit of Dog RegistrationsFire Abatement ManagementInvestigate incidents and complaints regarding animal control
All Achieved
Natural Resource ManagementFacilitate Natural Resource Management for Council and Community
Review and implement NRM strategiesMonitor and assess implementation of the Town Common Management Plan
All Achieved
Community DevelopmentWorking with the community for the benefit of all
Facilitate the operation of Council Community ForumsDeliver the Community Grants ProgramConduct GWTTA Art ExhibitionConduct a Festival of Small Halls concertProduce a user-friendly Event Management Guide
Achieved
Achieved
Achieved
AchievedDeferred
Services to Young PeopleTo address and support the needs of young people through responsive and participatory approaches
Conduct School Holiday ProgramConduct Stepping Stones CampsConduct ‘National Youth Week’ Event (April)
Conduct Youth Liaison workshop with Council
Achieved until COVID-19 cancellation
Achieved
Recreation Facilities ManagementTo provide indoor facilities for recreational, social and community based activities that are safe, comfortable and fit for purpose
Review of Sport and Recreation PlanImplement promotion and marketing of indoor recreation facilities to current and prospective usersProduce a user guide for individual indoor facilities
CancelledDeferred
Deferred
Business EngagementWorking with the small business community to increase participation, innovation and partnership
Establish a Small Business DirectoryEstablish a regular Small Business BulletinDevelop a ‘Chamber of Commerce’ strategy for Meander Valley
DeferredDeferredDeferred

18
Infrastructure ServicesThe construction of the Westbury Recreation Ground clubrooms and changeroom project was the most significant capital works project completed during the year with the total cost in excess of $2m. The new building provides the local community and sporting clubs with a much needed asset for many years to come.
Other significant building work undertaken during the year included roof replacement and foyer upgrade works at the Meander Valley Performing Arts Centre building and an upgrade to Council’s customer service area at our office in Westbury.
Major roadwork projects completed during the year included a new roundabout on Westbury Road ($1m) and safety improvements to Mt Leslie Road in Prospect Vale adjacent to St Patricks College. The construction of the roundabout was identified in Council’s long term strategy for improvements to traffic amenity and will be the future point of access into the Prospect Vale Park sports complex. Council also awarded the construction contract for road safety improvements at the intersection of County Club Avenue and Las Vegas Drive in Prospect Vale.
Council invested significantly in the improvement of infrastructure in Blackstone Heights with the completion of footpath work in Blackstone and Kelsey Roads, the piping of a section of open drain in Panorama Road, and installation of new playground equipment at Blackstone Park.
Five bridge renewal projects were completed during the year at a combined cost of $700,000.
The bridges were delivered under design and construction contracts with Tas-Span Pty Ltd, with three bridges in Jackeys Marsh, one in Meander and one in Parkham.
Work is ongoing to secure the major infrastructure upgrades necessary for the Hadspen Urban Growth Area development and recent benefits of Council’s strategic development planning has seen 39 lots released to the market with an application for the next 190 lots currently underway.
Strategic planning work during the year has been dominated by the Tasmanian Planning Commission process to assess Council’s Local Provisions Schedule as part of the implementation of the Tasmanian Planning Scheme.
Several applications for planning scheme amendments have progressed to facilitate significant urban development at Prospect Vale and Blackstone Heights, which are currently in various stages of assessment. In addition, Council has progressed its own rezoning application to provide for urban residential growth at Westbury to meet increasing demand for housing.
The strategic projects team continues to progress opportunities to support economic growth and urban improvements, and be involved in regional projects including the Greater Launceston Transport Vision and the Northern Tasmania Regional Land Use Strategy.

19
Activity Action ResultWaste Management & Resource RecoveryTo provide adequate, efficient, and affordable waste services within the local government area
Provision of kerbside collection contracts for waste, recyclables and organicsProvision of landfill, waste transfer stations and resource recovery operations contractProvision of hard waste collectionDesign, document, procurement, and supervision of contracts as per the specific projects listed in the 2019-20 Capital Works ProgramOperational compliance with Environment Protection Notice for Westbury and Deloraine landfill sites
All Achieved
Stormwater ManagementTo minimise the risk of flooding and provide clean water into the region’s waterways. Council, through the Urban Drains Act and the Local Government (Highways) Act aims to provide piped stormwater networks in line with current local government standards and major stormwater networks capable of meeting a 1% AEP.
Develop stormwater system management plans in line with legislationDesign, document, procurement, and supervision of contracts as per specific projects listed in the 2019-20 Capital Works Program
All Achieved
Sustainable DevelopmentDevelop sustainable practices within our organisation and community through leading, supporting and encouraging staff, contractors and community to use energy, water and non-renewable resources more productively. Promote and support sustainable economic development initiatives.
Westbury Residential Rezoning
Undertake projects to support implementation of the Prospect Vale, Blackstone Heights Structure Plan
Support the progress of land developments including Valley Central and the Hadspen Urban Growth Area
In Progress
In Progress
In Progress
Emergency ServicesTo build capacity and resilience in the community and ensure Council is prepared to assist with emergency services in the response to emergencies and lead in the recovery
Coordinate the Municipal Emergency Management and Social Recovery Committee (MEMSRC)Support the operation of the Meander Valley SES unit through ongoing management of the MOUConduct emergency management training exercise facilitated by Red Cross
1 Cancelled 1 Achieved
Achieved
Cancelled
TransportMaintain the serviceability and integrity of Council’s transport network
Deliver the bridge inspection and maintenance programDesign, document, procurement, and supervision of contracts as per the specific projects listed in the 2019-20 Capital Works ProgramUndertake footpath proactive defect inspections
All Achieved
Annual Plan Performance

20
Activity Action ResultProperty ServicesOperate property services in a safe and effective manner to satisfy public demand
Operate Deloraine Swimming Pool and provide support to community swimming pool at CavesideCoordinate building maintenance – general, reactive and programmedDesign, document, procurement, and supervision of contracts as per the specific projects listed in the 2019-20 Capital Works Program
All Achieved
Parks & RecreationTo provide and maintain parks and recreation facilities throughout the local government area
Undertake inspections and condition assessments of all equipment and facilitiesDesign, document, procurement, and supervision of contracts as per the specific projects listed in the 2019-20 Capital Works Program
All Achieved
Asset Management & GISProvision of Asset and GIS services to assist the operations of Council
Co-ordinate Asset Management Group and Strategic Asset Management Plan Improvement Plans- Review Strategic Asset Management Plan - Review Asset Management PlansPrepare 2020-21 Capital Works ProgramUpdate asset information, including- Capitalisation of assets in Conquest- Undertake building and storm water revaluation
All Achieved
2019-20 Snapshots
Footpath Development, Blackstone Heights
Jackey’s Marsh Road Bridge Reconstruction
Delivered • April 2020 Delivered • December 2019

21
Department of WorksThe Works department has thirty employees who are based across three depots located at Prospect Vale, Westbury and Deloraine.
The team takes pride in providing safe, fit for purpose and well-presented assets. A number of public activities and externally organised community events are supported over the course of the year. During 2019-20, the department successfully completed approximately $3.2m of capital construction projects in addition to day-to-day maintenance functions. These projects were largely renewal and/or new infrastructure across road, footpath and drainage asset classes.
The scale of this achievement validates the capability and adaptability of the team which also provides cost efficient outcomes for the community.
During the reporting period, the department received and completed 748 Customer Service Requests (CSRs). Most CSRs represent queries or complaints from the public.
The Works department was responsible for 68.9% of the total CSRs managed across Council.
This year’s figure is, on average, 15% lower than the number of CSRs received by the Works department each year between 2009 and 2014.
CSRs have been relatively consistent over the last three years and demonstrates a reasonably proportionate relationship between available budget, service delivery and community expectation.
Going forward, succession planning and depot rationalisation remain to be areas of focus and will be further progressed across 2021-22.
Activity Action ResultParks, Reserves, Sports Grounds and CemeteriesTo ensure that Councils parks, reserves, cemeteries and sports grounds are suitably maintained to provide a safe, clean and inviting experience to community and sporting organisations
Undertake maintenance works that achieve the program objectivePlan and deliver capital works projects
All Achieved
RoadsTo construct and maintain a safe and effective road network to meet the needs of road users and the community
Undertake maintenance works that achieve the program objectivePlan and deliver capital work projects
All Achieved
Toilets, Street Cleaning and Litter CollectionTo ensure public toilets and streets are maintained in a clean and tidy condition and meet the needs of the community.
Undertake maintenance works that achieve the program objective
All Achieved
Urban StormwaterTo provide and maintain an effective urban storm water drainage system
Undertake maintenance works that achieve the program objective Plan and deliver capital work projects
All Achieved
PlantTo provide plant and equipment that suits Councils activities and is financially sustainable
Manage plant to achieve the program objectiveUndertake plant purchases in accordance with the approved budget
All Achieved
Annual Plan Performance

22
Capital Works Program Summary (Works over $20,000)
Roads & Streets AmountWiiteena Rd - Jackeys Marsh (Gravelling) $25,450 Sugar Loaf Rd - Jackeys Marsh (Gravelling) $57,033 Brocks - Montana (Gravelling) $20,171 Long Ridge Rd - Montana (Gravelling) $46,789 Louisa St - Bracknell $29,164 Church St - Carrick (Resealing) $21,734 Emu Bay Rd - Deloraine $60,792 Moriarty St - Deloraine $26,905 Westbury Pl East - Deloraine $59,536 Beefeater St - Deloraine $41,535 Winifred Jane Cres - Hadspen $26,585 Angela Ct - Prospect Vale (Resealing) $21,213 Richard St - Prospect Vale (Resealing) $159,181 Crockford Ct - Prospect Vale (Resealing) $33,764 Kelsey Rd - Blackstone Heights $63,444 Meander Valley Highway, Westbury $149,530 Meander Valley Highway - Carrick $100,584 Pioneer Dve - Mole Creek (Resealing) $46,185 Oaks Rd - Bracknell (Resealing) $87,503 Dairy Plains Rd Cheshunt (Resealing) $31,367
Dunorlan Rd - Dunorlan $65,962 Exton Rd - Exton (Resealing) $73,501 Golden Valley - Golden Valley (Resealing) $52,083 Railton Main Rd - Moltema (Resealing) $254,549 Osmaston Rd - Osmaston (Resealing) $180,916 Osmaston Rd - Osmaston $787,568 Bogan Rd - Quamby Brook (Resealing) $187,409 Pateena Rd - Travellers Rest $35,508 Weegena Rd - Weegena $77,191 Dexter St - Jones to Five Acre - Westbury $68,802 Marriott St Moore To Lyttleton St $42,475 King St Mary to Marriott St - Westbury $23,255 Railton Rd - Kimberley $161,408 Footpath Developments - Blackstone Heights $696,558 Westbury Rd - PVP Entrance Roundabout $1,395,261 Mt Leslie Rd - St Patricks Parking Improvements
$246,258
Nutt St - Deloraine $60,180
Swimming Pools AmountDeloraine Swimming PoolChlorine Dosing & Heating Unit
$89,670
Storm Water Drainage AmountMt Leslie Rd Prospect Vale $20,411 Panorama Rd Blackstone Heights $105,165 Meander Valley Rd Carrick $91,659 Westbury Rd Prospect Vale $130,117 Blackstone Rd Blackstone Heights $71,440 Church St Carrick $47,443 Meander Valley Hwy, Westbury $207,352 Taylor St, Westbury $60,216 Main Rd, Meander $52,441
Bridges AmountWarners Creek Sugarloaf Rd $178,110 Burnies Creek Sugarloaf Rd $92,319 Spearhill Creek Quamby Brook Rd $38,590 Jackeys Creek Williams Rd $174,581 Leiths Creek Barbers Rd $154,708 Brady Creek Tribulet Maloneys Rd $116,393 Limestone Creek Walters Rd $79,332 Chittys Creek Barbers Rd $127,123 Ritchies Creek Botts Rd $117,342 Reids Creek Rayey Rd $105,347
Recreation Grounds & Sports Facilities
Amount
Westbury Recreation Ground Building Design & Upgrade
$1,601,561
Deloraine Community Complex Netball Courts
$28,101
Westbury Recreation GroundCricket Block Renewal
$51,155
Prospect Vale Park - New Pathway $27,473
Sundry Cultural Activities AmountMeander Valley Performing Arts Centre - Deloraine (Roof Upgrade)
$29,602
Public Halls AmountBracknell Hall - Bracing Building Structure $22,890
Tourism & Area Promotion AmountYarns Exhibition Lighting Replacement $33,968
Administration AmountCouncil Chambers: Office Expansion & Foyer Refurbishment
$288,679
IT Workstations Replacements $32,219 IT Software and Upgrades $49,502 Conquest Software Upgrade $26,272 Municipal Property Revaluation $41,641

23
Cemeteries AmountDeloraine Lawn Cemetery Shelter $39,824
Management & Indirect Overheads AmountWorks Depot Land Purchase $48,400
Parks & Reserves AmountBlackstone Park Playground Equipment $50,619 Hadspen Bull Run - Seating & Shade $24,125
Waste AmountWestbury landfill Site - Cell Expansion $57,290 Mobile Garbage Bin Replacements $40,220
Tenders and Contracts(Local Government (General) Regulations, 2015)In accordance with the reporting requirements under Regulation 29(1) Council entered into the following contracts for the supply of goods or services exceeding $250,000 (excluding GST)
Council extended the following contract under the provisions of Regulation 23(5)(b):
Contractor Value (excl.GST) DetailsAndrew Walter Constructions Pty. Ltd.4 Whitestone Drive, Granton Tas 7030
$1,046,237 Roundabout constructionWestbury Road, Prospect Vale
Hardings Hotmix Pty. Ltd.30 Industrial Drive, Ulverstone Tas 7315
$525,465 2019-20 asphalt resurfacing
Fulton Hogan Industries Pty. Ltd. 11 Cavalry Road, Mowbray Tas 7248
$329,865
MPH Builders Pty. Ltd.65 Meander Valley Road, Prospect Vale Tas 7250
$362,540 Meander Valley Council office upgrades and foyer refurbishment, Westbury
Contractor Value (excl.GST) DetailsJustwaste ConsultingSuite 26, 17 Paterson Street, Launceston Tas 7250
$503,481 Contract No.167-2015-2016; management and operation of the Deloraine and Cluan refuse disposal sites and the Mole Creek transfer station
In accordance with the reporting requirements under Regulation 29(2) Council tendered and entered into the following contracts under Regulation 27(i) for the supply of goods or services exceeding $250,000 (excluding GST) due to the unavailability of competitive or reliable tenders:
Contractor Value (excl.GST) DetailsTas-Span Pty. Ltd.27-28 Faulkner Drive, Latrobe Tas 7307
$465,375 Design and construction for bridge reconstruction projects at Warners Creek, Burnies Creek, Jackeys Creek and Jackeys Marsh
Contractor Value (excl.GST) DetailsThe Baker Group (Tas) Pty. Ltd.9 Hudson Fysh Drive, Western Junction Tas 7212
$203,139 Road safety improvements, Mt Leslie Road, Prospect Vale
Crossroads Civil Contracting Pty. Ltd.73-79 Lilydale Road, Rocherlea Tas 7248
$175,573 Intersection upgrades between Country Club Avenue and Las Vegas Drive, Prospect Vale
Tas-Span Pty. Ltd.27-28 Faulkner Drive, Latrobe Tas 7307
$109,525 Design and construction for bridge reconstruction projects at Brady Creek Tributary, Parkham
Tas-Span Pty. Ltd.27-28 Faulkner Drive, Latrobe Tas 7307
$119,717 Design and construction for bridge reconstruction project at Chittys Creek, Meander
In accordance with the reporting requirements under Regulation 29(3) Council entered into the following contracts for the supply of goods or services valued at or exceeding $100,000 (excluding GST) but less than $250,000:

24
2019-20 Snapshots
$1.7m COVID-19 Community & BusinessSupport Package
Delivered • April 2020
Pumped Heating System at Deloraine Swimming Pool
Delivered • February 2020
Westbury Road Roundabout Construction, Prospect ValeParking Bay Construction, Hadspen
Stormwater Infrastructure,Westbury
Delivered • October 2020Delivered • June 2020
Delivered • December 2019
Osmaston Road Reconstruction, Westbury
Delivered • December 2019

25
Councillor Meeting AttendanceThe table below shows meeting attendance for all Councillors and the Mayor. During the 2019-20 financial year, Council held twelve Ordinary Meetings, twelve Closed Meetings and one Special Meeting. Nine elected members were in attendance at the Annual General Meeting.
Customer Service Complaints (Local Government Act 1993)There was one complaint received and considered under Section 339F, Sub-section (5) of the Local Government Act 1993.
Code of Conduct Complaints(Local Government Act 1993)There have been no code of conduct complaints received during the preceding financial year, under Division 3A of Part 3.
Elected Member Allowances and Expenses (Local Government Act 1993 and Council Policy No 24)In 2019-20 Council provided allowances and reimbursements for reasonable expenses to the Mayor, Deputy Mayor and Councillors. This includes telephone and communication equipment, child care and motor vehicle expenses. The total amount of these allowances and expenses is shown below (to the nearest dollar):
Number of business items transacted by Council in 2019-20: 245
Elected Member AttendanceMayor Wayne Johnston 14Cr Michael Kelly (Deputy Mayor) 12Cr Stephanie Cameron 14Cr Tanya King 14Cr Rodney Synfield 14Cr John Temple 13Cr Susie Bower 13Cr Frank Nott 12Cr Andrew Sherriff 14
Allowances Expenses$191,464 $17,847
Donation of Land(Local Government Act 1993)Council has made no donations of land.
Public Interest Disclosures Statement (Public Interest Disclosures Act 2002)There have been no disclosures either raised or determined during 2019-20 under the Public Interest Disclosures Act 2002.
Enterprise Powers Statement (Section 72(1)(ca) (Local Government Act 1993)
Northern Tasmania Development Corporation LtdCouncil is a member and shareholder of Northern Tasmania Development Corporation Ltd (NTDC).NTDC is a not-for-profit public company limited by guarantee. The primary objectives of NTDC are to: a) provide pro-active, engaged and strategic regional economic leadership; b) consolidate an agreed vision for the development, sustainability and prosperity of the geographic region that the Organisation’s Members encompass; c) implement a strategic economic action plan based on the Northern Regional Futures Plan framework or similar; and d) provide effective representation and advocacy to State and Federal Government and other stakeholders.NTDC is currently engaged in a number of initiatives including the delivery of the Regional Economic Development Plan. This plan focuses on six key themes: Industry development, investment transaction, population growth, place-making, innovation and culture, and human capacity.It is considered that Council, the municipality and ratepayers generally, benefit from the investment in NTDC. The organisation will effect direct and material economic, employment, and investment outcomes, and contribute indirectly to social and community benefits as a consequence of NTDC achieving the objectives that it will be set up to achieve. Council’s shareholding is based on annual funding contributions calculated using a formula based on municipality population.
Council’s annual membership fee for 2019-20 was $66,244 (2018-19: $64,881).
Environmental Health StatementSee page 15 of this report.
Reporting on Legislative Requirements
26
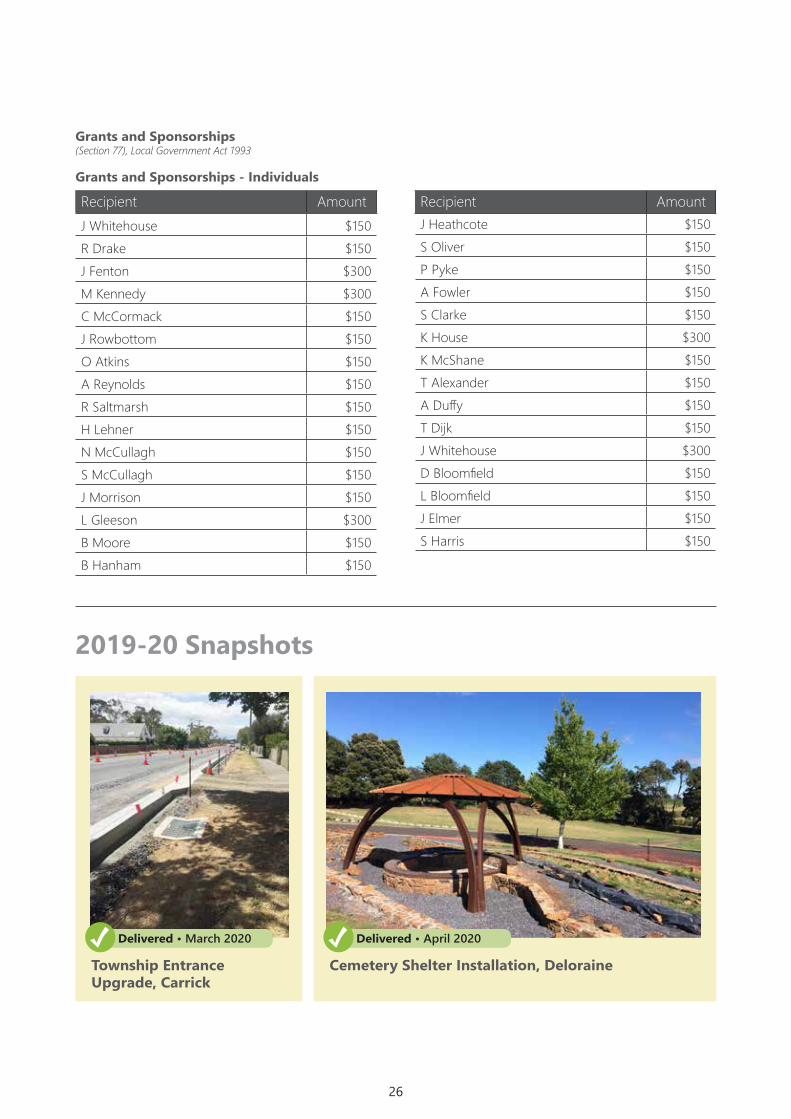
J Heathcote $150S Oliver $150P Pyke $150A Fowler $150S Clarke $150K House $300K McShane $150T Alexander $150A Duffy $150T Dijk $150J Whitehouse $300D Bloomfield $150L Bloomfield $150J Elmer $150S Harris $150
Grants and Sponsorships(Section 77), Local Government Act 1993
Grants and Sponsorships - Individuals
Recipient AmountJ Whitehouse $150R Drake $150J Fenton $300M Kennedy $300C McCormack $150J Rowbottom $150O Atkins $150A Reynolds $150R Saltmarsh $150H Lehner $150N McCullagh $150S McCullagh $150J Morrison $150L Gleeson $300B Moore $150B Hanham $150
Recipient Amount
2019-20 Snapshots
Township Entrance Upgrade, Carrick
Cemetery Shelter Installation, Deloraine
Delivered • March 2020 Delivered • April 2020

27
Recipient AmountAged Care Deloraine Auxiliary $2,500 AIC Tennis Club $514 Blackstone Heights Community News Association Inc.
$1,836
Children First Foundation $360 Deloraine District Pony Club Inc $2,000Deloraine Football Club Inc $2,000Deloraine House Inc $617Deloraine House Inc $700Deloraine Tennis Club Inc $2,500Edmund Rice Camps Tasmania $2,000Georgina Galloway $1,200Hagley Community Cemetery Trust $250Harveydale Rodeo Association Inc $3,000 Launceston City Football Club Inc $2,660Lions Club of Deloraine Inc $2,750Lions Club of Hadspen South Esk Inc $1,500 Lions Club of Riverside Inc $300Meander Valley Community Radio Inc $300Meander Valley Indoor Skaters Association
$250
Meander Valley Netball Club Inc $1,194 Meander Valley Suns Football Club Inc $121 Mole Creek & District Community Shed
$250
Recipient Amount
Grants and Sponsorships - Organisations
Mole Creek & District Community Shed
$2,782
Mole Creek Swimming Centre Association Inc
$3,000
Prospect Park Sports Club (1) $1,257Prospect Park Sports Club Inc $3,000 Rotary Club of Central Launceston Inc $360 Rotary Club of Deloraine Inc $2,440 Rotary Club of Deloraine Inc $2,500Rotary Club of Westbury Inc $2,872 Tas Mountain Cattlemens Association $2,000 Tasmanian Country Music Federation Inc
$2,110
Tasmanian Garlic & Tomato Festival Inc.
$2,600
Westbury Cricket Club Inc $2,000 Westbury Health Inc $1,000Westbury Pistol Club $2,000 Westbury Primary School P & F Association Inc
$3,000
Westbury RSL Sub-Branch $2,000Westbury Scout Group $1,738 Westbury St Patricks Festival Steering Group
$1,500
Grants and Sponsorships - Schools
Recipient AmountProspect Vale High School Eagle Awards $300
Hagley Primary School 2019 Awards $50
Westbury Primary School Awards $100Mole Creek Primary School Awards $100
Recipient AmountBracknell Primary School Awards $100
Deloraine Primary School Awards $100Deloraine High School Awards $100

28
Eloise, J 4/318 Wiiteena Rd, Jackeys Marsh
$21
Forrest, K & C 143 Felmingham Rd, Parkham
$216
Gerondakis, A 75 Wiiteena Rd, Jackeys Marsh
$222
Gore, A 1/318 Wiiteena Rd, Jackeys Marsh
$21
Harris, J 144 South Mole Creek Rd, Mole Creek
$69
Hart J & BLV Lawson 199 Samuel St, Elizabeth Town
$57
Hawkes, M & J 464 Larcombes Rd, Reedy Marsh
$411
Hayward, J & L 54 Harts Lane, Weegena
$116
Hayward, J & L 179 Dynans Bridge Rd, Weegena
$261
Hentschel, W 761 Jackeys Marsh Rd, Jackeys Marsh
$127
Herron, M & Howard, M
709 Jackeys Marsh Rd, Jackeys Marsh
$162
Hoffman, N 450 Larcombes Rd, Reedy Marsh
$320
Howard, P & S Larcombes Rd, Reedy Marsh
$352
Irwin, Estate K 244 Blairs Rd, Mole Creek
$108
Jane, A & Long, P Liena Rd, Mole Creek
$202
Jones, E & K Hamptons Rd, Meander
$93
Jones, G 1401 Bogan Rd, Golden Valley
$125
Jones, S Baldocks Rd, Mole Creek
$148
Knowles, K Huntsman Rd, Meander
$94
Krahenbuhl, R & J 13326 Highland Lakes Rd, Golden Valley
$221
Lee, J 49 Dairy Plains Rd $142
Leis, J 75 Saddlers Run Rd, Reedy Marsh
$106
Conservation Covenant Incentive Scheme(Council Policy No.74)This grants Scheme is provided in recognition of private property owners’ contribution to long-term conservation of significant natural values within the Meander Valley. Seventy five property owners benefited from the Scheme in 2019-20 with a total grant value of $11,243 being provided as follows:
Property Owner Location GrantAnderson, N 279 Mayberry Rd
Mayberry $135
Animal Rescue Inc. Samuel St, Elizabeth Town
$70
Anitam Pty. Ltd. “Hatherley”, 1425 Illawarra Rd, Carrick
$568
Berne, T 222 East Meander Rd, Meander
$169
Bierens, E 1012 Bogan Rd, Golden Valley
$57
Bramich, K & D 70 Stephens Rd, Mayberry
$97
Brown, M Sugarloaf Rd, Jackeys Marsh
$117
Burgess, G & K 496 East Meander Rd, Meander
$57
Burke, A 8/318 Wiiteena Rd, Jackeys Marsh
$21
Burke, A 7/318 Wiiteena Rd, Jackeys Marsh
$21
Cadman, S & Norwood, R
669 Jackeys Marsh Rd, Jackeys Marsh
$104
Camilleri, J Highlands Lake Rd, Golden Valley
$131
Chesworth, G 9 Bensemanns Rd, Birralee
$57
Cocks, R & Trowbridge, K
13185 Highland Lakes Rd, Golden Valley
$169
Cole, M Liffey Rd, Liffey $57
Cooper, R & S 750 Jackeys Marsh Rd, Jackeys Marsh
$163
Crowley, S 380 Sugarloaf Rd, Jackeys Marsh
$103
Dan, R 531 Larcombes Rd, Reedy Marsh
$57
Dr & Cb Durham Pty. Ltd.
Den Rd, Mole Creek $568
Dr & Cb Durham Pty. Ltd.
Den Rd, Mole Creek $232
Durham, D 57 Big Den Rd, Mole Creek
$57
Eleven Cubed Pty. Ltd.
9/318 Wiiteena Rd, Jackeys Marsh
$21
Property Owner Location Grant

29
Seilhorst, J North St, Elizabeth Town
$57
Sharma, S, L & M 2/318 Wiiteena Rd, Jackeys Marsh
$21
Swan, Estate I 1210 Birralee Rd, Birralee
$568
The Trust Company Pty. Ltd.
59 Bradys Creek Rd, Parkham
$568
Thinking Frog Pty Ltd Stephens Rd, Mayberry
$205
Tillack, G 6/318 Wiiteena Rd, Jackeys Marsh
$21
Tunks, C & Kuperstein, L
10/318 Wiiteena Rd, Jackeys Marsh
$21
Walker, G & Ashburn Holdings Pty. Ltd.
160 Oaks Rd, Carrick $568
Westley, S Larcombes Rd, Reedy Marsh
$109
Whiteley, T 1171 Bogan Rd, Golden Valley
$112
Wild, D 5 North St, Elizabeth Town
$57
Wood, D & Zournazis, H
746 Jackeys Marsh Rd, Jackeys Marsh
$74
Woodward, A 780 Larcombes Rd, Reedy Marsh
$85
Property Owner Location GrantLemaire, M 3/318 Wiiteena Rd,
Jackeys Marsh $21
Lloyd, S & Nagorka, R 999 Denmans Rd, Birralee
$107
Lloyd, S & Nagorka, R 999 Denmans Rd, Birralee
$153
Mackinnon, A & R 494 Selbourne Rd, Selbourne
$103
Macrow, C 4 North St, Elizabeth Town
$57
McDonald R & V 497 Riversdale Rd, Liffey
$99
Mcleod, S 28 Camerons Rd, Mole Creek
$434
Nicholson, C 175 Dynans Bridge Rd, Weegena
$80
O'leary, S & Breen, K
256 Sugarloaf Rd, Jackeys Marsh
$57
Peacock, D & S 5/318 Wiiteena Rd, Jackeys Marsh
$21
Pearce, N & Bennett, E
Larcombes Rd, Reedy Marsh
$57
Pennicott, G & G 100 Silver Wattle Dr, Reedy Marsh
$58
Ricketts, A 780 Larcombes Rd, Reedy Marsh
$267
Robin, J Jackeys Marsh Rd, Jackeys Marsh
$152
Saldana, A & M 20 Gulf Rd, Liffey $88
Property Owner Location Grant
Recipient AmountDeloraine House Inc. $560
Recipient AmountGalloway, A & G $1,200
Recipient AmountMMM Investments $1,518
Council Reimbursement Grant(Council Policy No.82)
Industrial Land Development General Rates Incentive Grant(Council Policy No.76)Nil.
Industrial Development Rates Incentive Grants(Council Policy No.86)
Other Rate RemissionsA partial remission of rates amounting to $2,260 was granted for 152 and 154 Blackstone Road, Blackstone Heights following a request from the owner E. Griffiths on the grounds the Council had issued an order prohibiting occupancy of these properties.
Townscape Incentive Grant(Council Policy No.82)

30
Overview of Financial PerformanceThe following information is provided to assist readers of the Financial Report.
Statement of Comprehensive IncomeOperating ResultCouncil reported a net surplus of $3,475,546 in the 2020 financial year. After adjusting for non-operating items the Underlying Surplus achieved was $433,784. Notable items removed were Capital Grants totalling $2,059,185, and Subdivision Assets taken over by Council totalling $638,576. The effects of a number of income and expenditure items are further detailed in the itemised summaries.
IncomeRates and ChargesIncome from rates and charges is slightly below budget, due to a remission of general rate charge provided to Commercial and Sport & Recreation properties due to the COVID-19 pandemic.
InterestThis includes interest from invested funds, loaned funds and interest on rate debtors. Overall interest was slightly below budget, due to declining interest rates on offer from financial institutions, offset by the average cash balance being greater than anticipated.
Reimbursements and Contributions Monetary AssetsRevenue is higher than budget by $144,264 (59%). Additional revenue was received which included: community contributions towards construction of new infrastructure, public open space contributions and contributions from special committees of Council.
Underlying Surplus Ratio8.00%7.00%6.00%5.00%4.00%3.00%2.00%1.00%0.00%
2017 2018 2019 2020
The Underlying Surplus Ratio compares Council’s Operating Income as a percentage of its Operating Expenses. This indicates that Council generated sufficient revenue to fulfill its operating requirements, including depreciation charges. Note the prepayment of the Financial Assistance Grants has been removed to recognise the grant in the correct year.
User Fees and Charges This revenue is derived from a range of services including property sales certificates, development application fees and use of the sport and recreation facilities. This item is within budget but was impacted by the closure of Council facilities during the COVID-19 pandemic.
Operational GrantsOperational grants revenue is above budget. The Commonwealth Government prepaid $2,217,893 (50%) of the 2021 Financial Assistance Grants in advance with the amount being received as income in 2020.
Profit on Disposal of AssetsIncludes profit on disposal of fleet vehicles and major plant items, less the expense recognition for the write off of the remaining book value of infrastructure assets replaced during the year in accordance with the capital works program.
Investment Revenue from Water CorporationThis revenue is in the form of dividends and tax equivalent payments received from TasWater. Total received for the year ($278,000) was only 50% of theannual allocation due to resolutions made by TasWater in light of COVID-19.
Capital GrantsIncludes $874,333 from the Commonwealth Government for the Roads to Recovery program, $240,000 towards the Westbury Recreation Ground Function Centre, $200,000 towards the new roundabout on Westbury Road, Prospect Vale and a number of less substantial grants.
Subdivision Assets Taken OverIncludes road and stormwater infrastructure received from two separate subdivisions constructed in Westbury, one in Deloraine and one in Carrick.
Capital Contributions Monetary Assets This consists of third party contributions received towards two separate capital projects.
Profit on Disposal of Land and BuildingsThis is the net profit from the disposal of two Council owned properties in Prospect Vale.
ExpensesEmployee CostsEmployee costs were slightly above budget by $59,951 (1%). This reflects no change in the total number of full time equivalents for the year and some additional periods of leave taken during COVID-19.
Materials and Contracts

31
Expenditure was slightly below budget by $35,269 (-1%) due to a combination of variances across operational functions. Areas of note are as follows:
Community Amenities: Expenses were over budget by $51,208 largely due to increased maintenance required at public toilets, in particular vandalism at Deloraine Train Park, and additional cleaning required at all facilities due to COVID-19.
Public Halls: Expenses were over budget by $40,012 due primarily to repairs, maintenance and minor upgrades undertaken on the Chudleigh, Meander and Mole Creek Halls.
Economic Services: Expenses were over budget by $29,435 largely due to expenditure on the Meander Valley Road intersection project at Hadspen. A corresponding grant was received by Council for this.
Recreation Grounds & Sports Facilities: Expenses were over budget by $133,805 largely due to maintenance and upgrades at the Deloraine Recreation Ground and as part of the Deloraine Football Club Demountable Change Rooms project.
A corresponding grant was received by Council for this.
Depreciation and AmortisationDepreciation and Amortisation overall was slightly below budget by $19,848. Variances were experienced across a number of asset classes however, with the most significant being Plant & Equipment ($205,371 under budget) and Land Improvements ($297,642 over budget).
Finance CostsFinance Costs include interest charges of $211,320 paid to Tascorp for loaned funds along with the recognition of twelve months expense for unwinding of the Westbury and Deloraine tip rehabilitation provision liabilities, which was in line with the budget for the year.
Other Expenses Other Expenses are grants provided to community organisations and external audit fees. Grants were under budget for the year, largely due to the cancellation and postponement of events due to COVID-19.
Revenue Comparison 2017 % 2018 % 2019 % 2020 % 2020 $Rates & Charges 45.9 45.0 54.6 54.6 12,803,314Interest 3.8 3.4 4.3 3.5 823,968Contributions Monetary Assets 1.8 2.1 1.7 1.7 388,464User Fees & Charges 5.2 5.0 5.8 5.4 1,254,089Operational Grants 25.6 17.1 21.1 20.8 4,883,869Investment Distributions Water Corporation 3.3 3.1 2.4 1.2 278,000Subdivisions Taken Over 1.6 3.2 0.6 2.7 638,576Contributions Non-Monetary Assets 2.7 N/A N/A N/A -Capital Grants 9.2 9.0 7.9 8.8 2,059,185Natural Disaster Relief Grants N/A 12.0 1.1 N/A -Profit on Disposal of Land & Buildings N/A N/A N/A 1.2 293,878Other 0.9 0.1 0.5 0.1 15,355
Sources of Income - Revenue Comparison
Rates and Charges InterestContributions Monetary AssetsUser Fees and Charges Operational GrantsOtherInvestment Distributions Water Corp. Subdivisions Taken Over Capital Grants Profit on Dsiposal of Land and Buildings
32
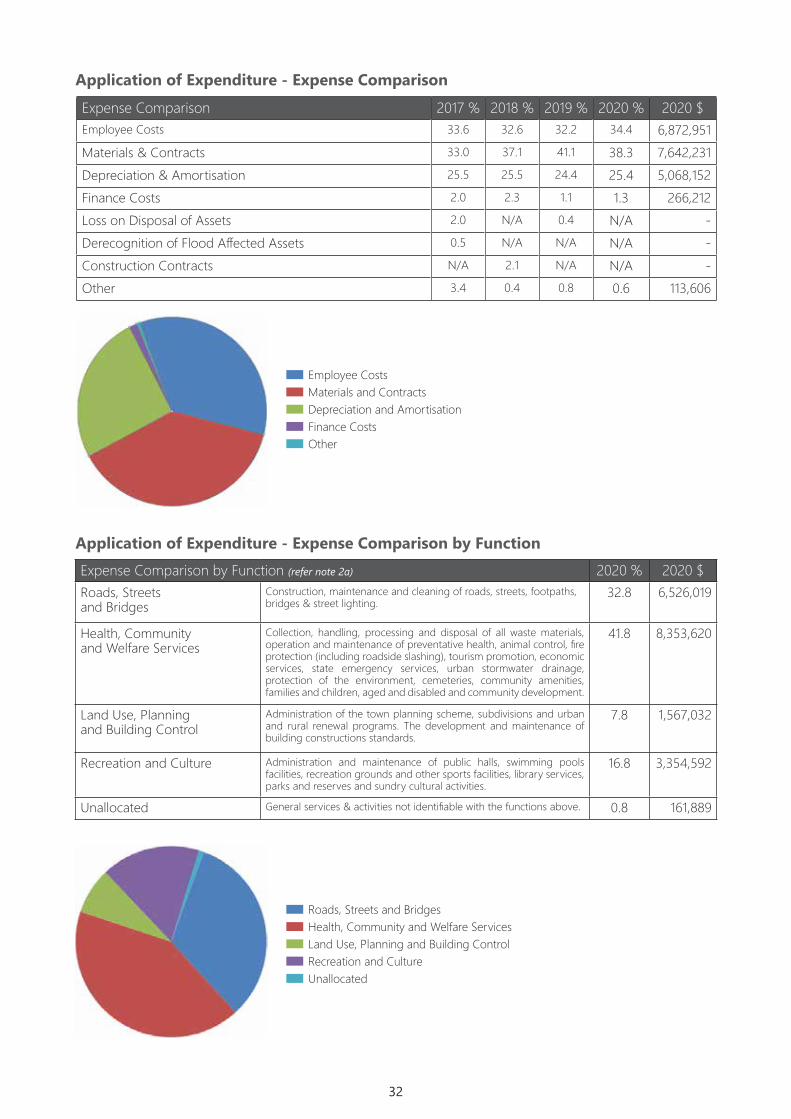
Application of Expenditure - Expense ComparisonExpense Comparison 2017 % 2018 % 2019 % 2020 % 2020 $Employee Costs 33.6 32.6 32.2 34.4 6,872,951Materials & Contracts 33.0 37.1 41.1 38.3 7,642,231Depreciation & Amortisation 25.5 25.5 24.4 25.4 5,068,152Finance Costs 2.0 2.3 1.1 1.3 266,212Loss on Disposal of Assets 2.0 N/A 0.4 N/A -Derecognition of Flood Affected Assets 0.5 N/A N/A N/A -Construction Contracts N/A 2.1 N/A N/A -Other 3.4 0.4 0.8 0.6 113,606
Employee CostsMaterials and ContractsDepreciation and AmortisationFinance CostsOther
Roads, Streets and BridgesHealth, Community and Welfare ServicesLand Use, Planning and Building ControlRecreation and CultureUnallocated
Application of Expenditure - Expense Comparison by FunctionExpense Comparison by Function (refer note 2a) 2020 % 2020 $Roads, Streetsand Bridges
Construction, maintenance and cleaning of roads, streets, footpaths, bridges & street lighting.
32.8 6,526,019
Health, Community and Welfare Services
Collection, handling, processing and disposal of all waste materials, operation and maintenance of preventative health, animal control, fire protection (including roadside slashing), tourism promotion, economic services, state emergency services, urban stormwater drainage, protection of the environment, cemeteries, community amenities, families and children, aged and disabled and community development.
41.8 8,353,620
Land Use, Planning and Building Control
Administration of the town planning scheme, subdivisions and urban and rural renewal programs. The development and maintenance of building constructions standards.
7.8 1,567,032
Recreation and Culture Administration and maintenance of public halls, swimming pools facilities, recreation grounds and other sports facilities, library services, parks and reserves and sundry cultural activities.
16.8 3,354,592
Unallocated General services & activities not identifiable with the functions above. 0.8 161,889
33
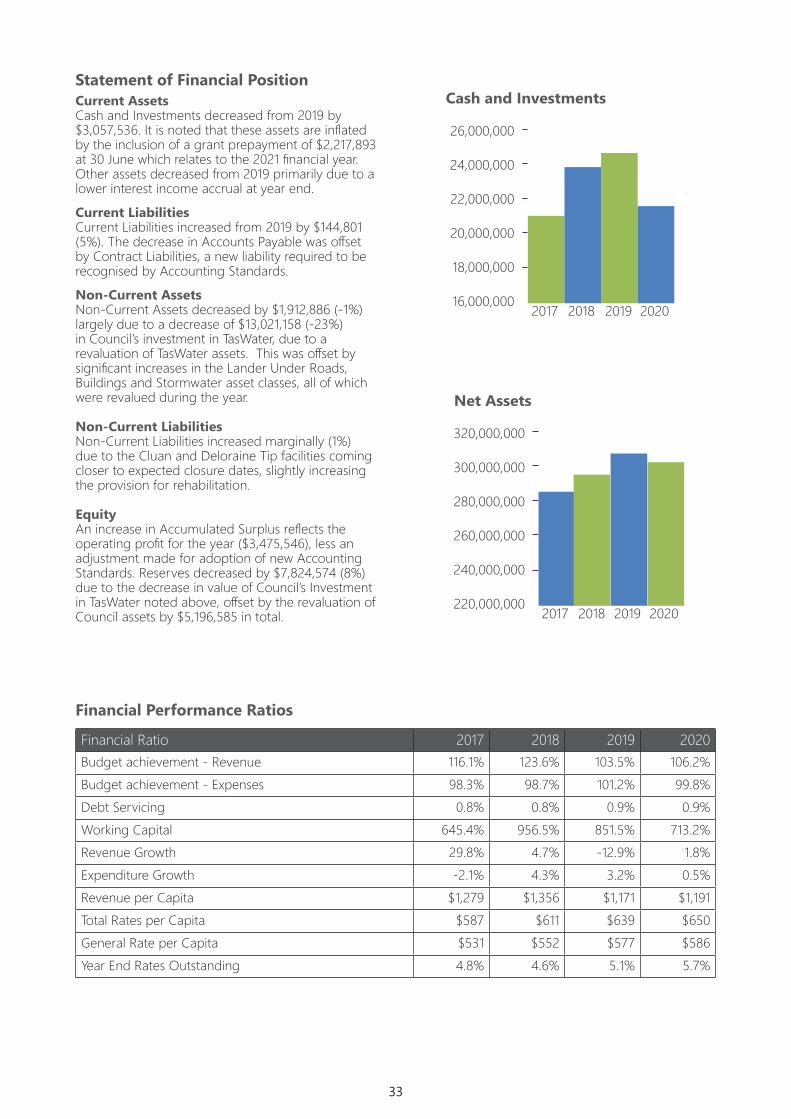
Statement of Financial PositionCurrent AssetsCash and Investments decreased from 2019 by $3,057,536. It is noted that these assets are inflated by the inclusion of a grant prepayment of $2,217,893 at 30 June which relates to the 2021 financial year. Other assets decreased from 2019 primarily due to a lower interest income accrual at year end.
Current Liabilities Current Liabilities increased from 2019 by $144,801 (5%). The decrease in Accounts Payable was offset by Contract Liabilities, a new liability required to be recognised by Accounting Standards.
Non-Current Assets Non-Current Assets decreased by $1,912,886 (-1%) largely due to a decrease of $13,021,158 (-23%) in Council’s investment in TasWater, due to a revaluation of TasWater assets. This was offset by significant increases in the Lander Under Roads, Buildings and Stormwater asset classes, all of which were revalued during the year.
Non-Current Liabilities Non-Current Liabilities increased marginally (1%) due to the Cluan and Deloraine Tip facilities coming closer to expected closure dates, slightly increasing the provision for rehabilitation.
Equity An increase in Accumulated Surplus reflects the operating profit for the year ($3,475,546), less an adjustment made for adoption of new Accounting Standards. Reserves decreased by $7,824,574 (8%) due to the decrease in value of Council’s Investment in TasWater noted above, offset by the revaluation of Council assets by $5,196,585 in total.
Cash and Investments
26,000,000
24,000,000
22,000,000
20,000,000
18,000,000
16,000,0002017 2018 20202019
Net Assets
320,000,000
300,000,000
280,000,000
260,000,000
240,000,000
220,000,00020202017 2018 2019
Financial Ratio 2017 2018 2019 2020Budget achievement - Revenue 116.1% 123.6% 103.5% 106.2%Budget achievement - Expenses 98.3% 98.7% 101.2% 99.8%Debt Servicing 0.8% 0.8% 0.9% 0.9%Working Capital 645.4% 956.5% 851.5% 713.2%Revenue Growth 29.8% 4.7% -12.9% 1.8%Expenditure Growth -2.1% 4.3% 3.2% 0.5%Revenue per Capita $1,279 $1,356 $1,171 $1,191Total Rates per Capita $587 $611 $639 $650General Rate per Capita $531 $552 $577 $586Year End Rates Outstanding 4.8% 4.6% 5.1% 5.7%
Financial Performance Ratios

34

Meander Valley Council ANNUAL REPORT 2019 7
Financial Report
Year Ended 30 June 2019 Year Ended 30 June 2020

36
TABLE OF CONTENTS
Statement of Comprehensive Income for the year ended 30 June 2020 1Statement of Financial Position as at 30 June 2020 2Statement of Changes in Equity for the year ended 30 June 2020 3Statement of Cash Flows for the year ended 30 June 2020 4Notes to and forming part of the Financial Report:
1. Significant Accounting Policies(a) Basis of Accounting 5(b) Revenue Recognition 6(c) Expense Recognition 6(d) Concessionary Leases 6
2. Functions/Activities of the Council 73. Interest 94. Government Grants 95. Employee Costs 106. Materials and Contracts 107. Depreciation and Amortisation Expense 118. Finance Costs 119. Other Expenses 1210. Disposal & Derecognition of Assets 1211. Cash and Cash Equivalents 1212. Trade and Other Receivables 1213. Investments 1314. Other 1315. Trade and Other Payables 1316. Provisions 1317. Contract Liabilities 1318. Investment in Water Corporation 1419. Loans and Other Receivables 1420. Work in Progress 1421. Land 1422. Land Under Roads 1423. Land Improvements 1424. Buildings 1425. Roads and Streets 1426. Bridges 1527. Stormwater 1528. Plant and Equipment 1529. Heritage 1530. Computer Software 1531. Valuations 1532. Reconciliation of Movements in Non-Current Assets 1633. Borrowings 2034. Provisions 2035. Reserves 2136. Special Committees 2237. Commitments for Expenditure 2238. Superannuation 2239. Reconciliation of Surplus/(Deficit) to Statement of Cash Flow 2440. Credit Standby Arrangements 2441. Related Party Disclosures 2542. Financial Instruments 2743. Management Indicators 3244. Fair Value Measurement 3545. Other Significant Accounting Policies and New Accounting Standards 38
Page Number

37
TABLE OF CONTENTS
Statement of Comprehensive Income for the year ended 30 June 2020 1Statement of Financial Position as at 30 June 2020 2Statement of Changes in Equity for the year ended 30 June 2020 3Statement of Cash Flows for the year ended 30 June 2020 4Notes to and forming part of the Financial Report:
1. Significant Accounting Policies(a) Basis of Accounting 5(b) Revenue Recognition 6(c) Expense Recognition 6(d) Concessionary Leases 6
2. Functions/Activities of the Council 73. Interest 94. Government Grants 95. Employee Costs 106. Materials and Contracts 107. Depreciation and Amortisation Expense 118. Finance Costs 119. Other Expenses 1210. Disposal & Derecognition of Assets 1211. Cash and Cash Equivalents 1212. Trade and Other Receivables 1213. Investments 1314. Other 1315. Trade and Other Payables 1316. Provisions 1317. Contract Liabilities 1318. Investment in Water Corporation 1419. Loans and Other Receivables 1420. Work in Progress 1421. Land 1422. Land Under Roads 1423. Land Improvements 1424. Buildings 1425. Roads and Streets 1426. Bridges 1527. Stormwater 1528. Plant and Equipment 1529. Heritage 1530. Computer Software 1531. Valuations 1532. Reconciliation of Movements in Non-Current Assets 1633. Borrowings 2034. Provisions 2035. Reserves 2136. Special Committees 2237. Commitments for Expenditure 2238. Superannuation 2239. Reconciliation of Surplus/(Deficit) to Statement of Cash Flow 2440. Credit Standby Arrangements 2441. Related Party Disclosures 2542. Financial Instruments 2743. Management Indicators 3244. Fair Value Measurement 3545. Other Significant Accounting Policies and New Accounting Standards 38
Page Number

38
Statement of Comprehensive IncomeFor the Year Ended 30 June 2020
Budget Actual Actual2020 2020 2019
Note $ $ $INCOME FROM CONTINUING OPERATIONS
Recurrent IncomeRates and Charges 12,966,400 12,803,314 12,591,692 Interest 3 835,600 823,968 1,000,469 Reimbursements and Contributions Monetary Assets 244,200 388,464 393,962 User Fees and Charges 1,255,000 1,254,089 1,332,370 Operational Grants 4 4,441,200 4,883,869 4,873,148 Profit/(Loss) on Disposal of Assets 10 (124,200) 2,236 (70,387) Investment Revenue from Water Corporation 556,000 278,000 556,000
20,174,200 20,433,940 20,677,254
Capital & Non-Recurrent IncomeCapital Grants 4 1,384,300 2,059,185 2,083,194 Subdivision Assets Taken Over 300,000 638,576 140,914 Contributions Monetary Assets - 13,119 16,905 Profit/(Loss) on Disposal of Land & Buildings 10 216,000 293,878 - Vested Sale of Land for Unpaid Rates - - 96,707
1,900,300 3,004,758 2,337,720
TOTAL INCOME FROM CONTINUING OPERATIONS 22,074,500 23,438,698 23,014,974
EXPENSES FROM CONTINUING OPERATIONS
Recurrent ExpenditureEmployee Costs 5 6,813,000 6,872,951 6,425,753 Materials and Contracts 6 7,677,500 7,642,231 8,188,265 Depreciation and Amortisation 7 5,088,000 5,068,152 4,868,786 Finance Costs 8 266,000 266,212 226,406 Other Expenses 9 162,600 113,606 149,267
20,007,100 19,963,152 19,858,477
TOTAL EXPENSES FROM CONTINUING OPERATIONS 20,007,100 19,963,152 19,858,477
OPERATING RESULT FROM CONTINUING OPERATIONS 2(a) 2,067,400 3,475,546 3,156,497
OPERATING RESULT FROM DISCONTINUED OPERATIONS - - -
NET OPERATING RESULT FOR THE YEAR 2,067,400 3,475,546 3,156,497
OTHER COMPREHENSIVE INCOME
Items that will not be reclassified subsequently to net resultFair value adjustments on equity investment assets 18 - (13,021,159) 7,102,181 Revaluation Increment/(Decrement) for Roads & Streets 35 - - 1,822,916 Revaluation Increment/(Decrement) for Land 35 - 3,006,262 - Revaluation Increment/(Decrement) for Buildings 35 - 1,218,012 - Revaluation Increment/(Decrement) for Stormwater 35 - 972,311 -
TOTAL OTHER COMPREHENSIVE INCOME - (7,824,574) 8,925,097
TOTAL COMPREHENSIVE RESULT 2,067,400 (4,349,028) 12,081,594
The above Statement of Comprehensive Income should be read in conjunction with the accompanying notesPage 1 of 40
Statement of Financial PositionAs at 30 June 2020
Actual Actual2020 2019
Note $ $
CURRENT ASSETSCash and Cash Equivalents 11 3,114,679 3,387,617 Trade and Other Receivables 12 958,739 974,685 Investments 13 18,469,868 21,254,466 Other 14 182,188 282,084
Total Current Assets 2(b) 22,725,474 25,898,852
NON-CURRENT ASSETSInvestment in Water Corporation 18 42,570,596 55,591,754 Loans and Other Receivables 19 4,686,887 4,626,816 Work in Progress 20 819,400 1,642,466 Land 21 8,600,000 8,518,455 Land Under Roads 22 28,994,771 26,169,270 Land Improvements 23 7,500,247 7,778,692 Buildings 24 21,466,143 18,392,042 Roads and Streets 25 122,080,776 118,199,041 Bridges 26 28,746,622 27,910,212 Stormwater 27 21,290,349 19,876,162 Plant and Equipment 28 2,958,462 3,006,141 Heritage 29 19,483 19,765 Computer Software 30 153,878 84,600 Valuations 31 147,794 132,878
Total Non-Current Assets 2(b) 290,035,408 291,948,294
TOTAL ASSETS 312,760,882 317,847,146
CURRENT LIABILITIESTrade and Other Payables 15 1,395,206 1,603,818 Provisions 16 1,443,346 1,437,767 Contract Liabilities 17 347,834 -
Total Current Liabilities 3,186,386 3,041,585
NON-CURRENT LIABILITIESBorrowings 33 3,600,000 3,600,000 Provisions 34 4,438,906 4,376,575
Total Non-Current Liabilities 8,038,906 7,976,575
TOTAL LIABILITIES 11,225,292 11,018,160
NET ASSETS 301,535,590 306,828,986
EQUITYAccumulated Surplus 215,210,382 212,679,204 Reserves 35 86,325,208 94,149,782
TOTAL EQUITY 301,535,590 306,828,986
The above Statement of Financial Position should be read in conjunction with the accompanying notesPage 2 of 40

39
Statement of Comprehensive IncomeFor the Year Ended 30 June 2020
Budget Actual Actual2020 2020 2019
Note $ $ $INCOME FROM CONTINUING OPERATIONS
Recurrent IncomeRates and Charges 12,966,400 12,803,314 12,591,692 Interest 3 835,600 823,968 1,000,469 Reimbursements and Contributions Monetary Assets 244,200 388,464 393,962 User Fees and Charges 1,255,000 1,254,089 1,332,370 Operational Grants 4 4,441,200 4,883,869 4,873,148 Profit/(Loss) on Disposal of Assets 10 (124,200) 2,236 (70,387) Investment Revenue from Water Corporation 556,000 278,000 556,000
20,174,200 20,433,940 20,677,254
Capital & Non-Recurrent IncomeCapital Grants 4 1,384,300 2,059,185 2,083,194 Subdivision Assets Taken Over 300,000 638,576 140,914 Contributions Monetary Assets - 13,119 16,905 Profit/(Loss) on Disposal of Land & Buildings 10 216,000 293,878 - Vested Sale of Land for Unpaid Rates - - 96,707
1,900,300 3,004,758 2,337,720
TOTAL INCOME FROM CONTINUING OPERATIONS 22,074,500 23,438,698 23,014,974
EXPENSES FROM CONTINUING OPERATIONS
Recurrent ExpenditureEmployee Costs 5 6,813,000 6,872,951 6,425,753 Materials and Contracts 6 7,677,500 7,642,231 8,188,265 Depreciation and Amortisation 7 5,088,000 5,068,152 4,868,786 Finance Costs 8 266,000 266,212 226,406 Other Expenses 9 162,600 113,606 149,267
20,007,100 19,963,152 19,858,477
TOTAL EXPENSES FROM CONTINUING OPERATIONS 20,007,100 19,963,152 19,858,477
OPERATING RESULT FROM CONTINUING OPERATIONS 2(a) 2,067,400 3,475,546 3,156,497
OPERATING RESULT FROM DISCONTINUED OPERATIONS - - -
NET OPERATING RESULT FOR THE YEAR 2,067,400 3,475,546 3,156,497
OTHER COMPREHENSIVE INCOME
Items that will not be reclassified subsequently to net resultFair value adjustments on equity investment assets 18 - (13,021,159) 7,102,181 Revaluation Increment/(Decrement) for Roads & Streets 35 - - 1,822,916 Revaluation Increment/(Decrement) for Land 35 - 3,006,262 - Revaluation Increment/(Decrement) for Buildings 35 - 1,218,012 - Revaluation Increment/(Decrement) for Stormwater 35 - 972,311 -
TOTAL OTHER COMPREHENSIVE INCOME - (7,824,574) 8,925,097
TOTAL COMPREHENSIVE RESULT 2,067,400 (4,349,028) 12,081,594
The above Statement of Comprehensive Income should be read in conjunction with the accompanying notesPage 1 of 40
Statement of Financial PositionAs at 30 June 2020
Actual Actual2020 2019
Note $ $
CURRENT ASSETSCash and Cash Equivalents 11 3,114,679 3,387,617 Trade and Other Receivables 12 958,739 974,685 Investments 13 18,469,868 21,254,466 Other 14 182,188 282,084
Total Current Assets 2(b) 22,725,474 25,898,852
NON-CURRENT ASSETSInvestment in Water Corporation 18 42,570,596 55,591,754 Loans and Other Receivables 19 4,686,887 4,626,816 Work in Progress 20 819,400 1,642,466 Land 21 8,600,000 8,518,455 Land Under Roads 22 28,994,771 26,169,270 Land Improvements 23 7,500,247 7,778,692 Buildings 24 21,466,143 18,392,042 Roads and Streets 25 122,080,776 118,199,041 Bridges 26 28,746,622 27,910,212 Stormwater 27 21,290,349 19,876,162 Plant and Equipment 28 2,958,462 3,006,141 Heritage 29 19,483 19,765 Computer Software 30 153,878 84,600 Valuations 31 147,794 132,878
Total Non-Current Assets 2(b) 290,035,408 291,948,294
TOTAL ASSETS 312,760,882 317,847,146
CURRENT LIABILITIESTrade and Other Payables 15 1,395,206 1,603,818 Provisions 16 1,443,346 1,437,767 Contract Liabilities 17 347,834 -
Total Current Liabilities 3,186,386 3,041,585
NON-CURRENT LIABILITIESBorrowings 33 3,600,000 3,600,000 Provisions 34 4,438,906 4,376,575
Total Non-Current Liabilities 8,038,906 7,976,575
TOTAL LIABILITIES 11,225,292 11,018,160
NET ASSETS 301,535,590 306,828,986
EQUITYAccumulated Surplus 215,210,382 212,679,204 Reserves 35 86,325,208 94,149,782
TOTAL EQUITY 301,535,590 306,828,986
The above Statement of Financial Position should be read in conjunction with the accompanying notesPage 2 of 40

40
Statement of Changes in EquityFor the Year Ended 30 June 2020
Asset Total Accumulated Revaluation Fair Value2020 Surplus Reserves Reserve
Note $ $ $ $
Balance at beginning of the financial year 306,828,986 212,679,204 90,245,103 3,904,679 Adjustment due to AASB 1058 adoption 45 (944,368) (944,368) - -
Restated opening balance 305,884,618 211,734,836 90,245,103 3,904,679 Net Operating Result for the Year 3,475,546 3,475,546 - - Other Comprehensive Income: Fair Value adjustment to Investment in Water Corp. 18 (13,021,159) - - (13,021,159) Net asset revaluation increment/(decrement) 35 5,196,585 - 5,196,585 -
Balance at end of the financial year 301,535,590 215,210,382 95,441,688 (9,116,480)
Asset Total Accumulated Revaluation Fair Value2019 Surplus Reserves Reserve
$ $ $ $
Balance at beginning of the financial year 294,747,392 209,522,707 88,422,187 (3,197,502) Net Operating Result for the Year 3,156,497 3,156,497 - - Other Comprehensive Income: Fair Value adjustment to Investment in Water Corp. 18 7,102,181 - - 7,102,181 Net asset revaluation increment/(decrement) 35 1,822,916 - 1,822,916 -
Balance at end of the financial year 306,828,986 212,679,204 90,245,103 3,904,679
2020
2019
The above Statement of Changes in Equity should be read in conjunction with the accompanying notesPage 3 of 40

41
Statement of Changes in EquityFor the Year Ended 30 June 2020
Asset Total Accumulated Revaluation Fair Value2020 Surplus Reserves Reserve
Note $ $ $ $
Balance at beginning of the financial year 306,828,986 212,679,204 90,245,103 3,904,679 Adjustment due to AASB 1058 adoption 45 (944,368) (944,368) - -
Restated opening balance 305,884,618 211,734,836 90,245,103 3,904,679 Net Operating Result for the Year 3,475,546 3,475,546 - - Other Comprehensive Income: Fair Value adjustment to Investment in Water Corp. 18 (13,021,159) - - (13,021,159) Net asset revaluation increment/(decrement) 35 5,196,585 - 5,196,585 -
Balance at end of the financial year 301,535,590 215,210,382 95,441,688 (9,116,480)
Asset Total Accumulated Revaluation Fair Value2019 Surplus Reserves Reserve
$ $ $ $
Balance at beginning of the financial year 294,747,392 209,522,707 88,422,187 (3,197,502) Net Operating Result for the Year 3,156,497 3,156,497 - - Other Comprehensive Income: Fair Value adjustment to Investment in Water Corp. 18 7,102,181 - - 7,102,181 Net asset revaluation increment/(decrement) 35 1,822,916 - 1,822,916 -
Balance at end of the financial year 306,828,986 212,679,204 90,245,103 3,904,679
2020
2019
The above Statement of Changes in Equity should be read in conjunction with the accompanying notesPage 3 of 40
Statement of Cash FlowsFor the Year Ended 30 June 2020
Actual Actual2020 2019
Note $ $Inflows
(Outflows)Inflows
(Outflows)
Cash Flows from Operating Activities
ReceiptsRates and Charges 12,841,497 12,504,043 Interest Received 853,450 951,703 Reimbursements and Contributions 388,464 393,962 User Fees and Charges 1,526,873 1,373,351 Operational Grants 4,883,869 4,873,148 Distributions from Water Corporation 278,000 556,000 Refunds from Australian Tax Office 1,400,735 1,065,762
22,172,888 21,717,969 Payments
Employee Costs (6,864,823) (6,299,366) Materials and Contracts (9,413,594) (9,040,595) Interest Expense (211,320) (211,320) Other Expenses (113,606) (149,267)
(16,603,343) (15,700,548)
Net cash provided by Operating Activities 39 5,569,545 6,017,421
Cash Flows from Investing Activities
Proceeds fromSale of Property, Plant and Equipment 762,010 53,091 Capital Grants 1,339,989 2,083,194 Capital Contributions 13,119 16,905 Investments 2,784,598 -
4,899,716 2,153,190 Payments for
Property, Plant and Equipment (10,742,199) (7,351,331) Investments - (230,384)
(10,742,199) (7,581,715)
Net cash used in Investing Activities (5,842,483) (5,428,525)
Net Increase/(Decrease) in cash held (272,938) 588,896 Cash at the beginning of the year 3,387,617 2,798,721
Cash and Cash Equivalents at end of the financial year 11 3,114,679 3,387,617
The above Statement of Cash Flows should be read in conjunction with the accompanying notesPage 4 of 40

42
Introduction
1. SIGNIFICANT ACCOUNTING POLICIES
(a) Basis of Accounting
This general purpose financial report of the Meander Valley Council consists of Statements of Comprehensive Income, Financial Position, Changes in Equity, Cash Flows, and Notes accompanying the financial statements. The general purpose financial report complies with Australian Accounting Standards, other authoritative pronouncements of the Australian Accounting Standards Board (AASB), and the Local Government Act 1993 (LGA1993) (as amended). Council has determined that it does not have profit generation as a prime objective. Consequently, where appropriate, Council has elected to apply options and exemptions within accounting standards that are applicable to not-for-profit entities.
This financial report has been prepared on the accrual and going concern basis.
This financial report has been prepared under the historical cost convention, except where specifically stated in the Notes.
In the application of Australian Accounting Standards, Council is required to make judgements, estimates and assumptions about carrying values of assets and liabilities that are not readily apparent from other sources. Estimates and associated assumptions are based on historical experience and various other factors that are believed to be reasonable under the circumstance, the results of which form the basis of making the judgements. Actual results may differ from these estimates.
Assumptions and judgements are utilised in determining the fair value of Council’s property, plant and equipment including useful lives, depreciation rates and impairment of assets. These assumptions are discussed in Note 44.
Fair value of property, plant & equipment
All funds where Council controls resources to carry on its functions have been included in this financial report. All entities controlled by Council that have material assets or liabilities, such as Special Committees of Council, have been included in this financial report. In the process of reporting on Council as a single unit, all transactions and balances between those funds (for example, loans and transfers between funds) have been eliminated in full.
Amounts received as tender deposits and retention amounts controlled by Council are included in the amounts disclosed as "Trade and Other Payables" within current liabilities until they are refunded or forfeited.
Estimates and underlying assumptions are reviewed on an ongoing basis. Revisions to accounting estimates are recognised in the period in which the estimate is revised if the revision affects only that period, or in the period of the revision and future periods if the revision affects both current and future periods.
Council has made no assumptions concerning the future that may cause a material adjustment to the carrying amounts of assets and liabilities within the next reporting period. Judgements made by Council that have significant effects on the financial report are disclosed in the relevant notes as follows:
Employee entitlements
Actuarial assumptions are utilised in the determination of Council’s defined benefit superannuation fund obligations. These assumptions are discussed in Note 38.
Defined benefit superannuation fund obligations
Assumptions are utilised in the determination of Council’s employee entitlement provisions. These assumptions are discussed in Note 34.
Investment in Water Corporation
Assumptions utilised in the determination of Council’s valuation of its investment in TasWater are discussed in Note 18.
Tip Rehabilitation
Assumptions and judgements are utilised in determining Council’s valuation of its Provision for Tip Rehabilitation are discussed in Note 34.
Notes to and forming part of the Financial ReportPage 5 of 40

43
Introduction
1. SIGNIFICANT ACCOUNTING POLICIES
(a) Basis of Accounting
This general purpose financial report of the Meander Valley Council consists of Statements of Comprehensive Income, Financial Position, Changes in Equity, Cash Flows, and Notes accompanying the financial statements. The general purpose financial report complies with Australian Accounting Standards, other authoritative pronouncements of the Australian Accounting Standards Board (AASB), and the Local Government Act 1993 (LGA1993) (as amended). Council has determined that it does not have profit generation as a prime objective. Consequently, where appropriate, Council has elected to apply options and exemptions within accounting standards that are applicable to not-for-profit entities.
This financial report has been prepared on the accrual and going concern basis.
This financial report has been prepared under the historical cost convention, except where specifically stated in the Notes.
In the application of Australian Accounting Standards, Council is required to make judgements, estimates and assumptions about carrying values of assets and liabilities that are not readily apparent from other sources. Estimates and associated assumptions are based on historical experience and various other factors that are believed to be reasonable under the circumstance, the results of which form the basis of making the judgements. Actual results may differ from these estimates.
Assumptions and judgements are utilised in determining the fair value of Council’s property, plant and equipment including useful lives, depreciation rates and impairment of assets. These assumptions are discussed in Note 44.
Fair value of property, plant & equipment
All funds where Council controls resources to carry on its functions have been included in this financial report. All entities controlled by Council that have material assets or liabilities, such as Special Committees of Council, have been included in this financial report. In the process of reporting on Council as a single unit, all transactions and balances between those funds (for example, loans and transfers between funds) have been eliminated in full.
Amounts received as tender deposits and retention amounts controlled by Council are included in the amounts disclosed as "Trade and Other Payables" within current liabilities until they are refunded or forfeited.
Estimates and underlying assumptions are reviewed on an ongoing basis. Revisions to accounting estimates are recognised in the period in which the estimate is revised if the revision affects only that period, or in the period of the revision and future periods if the revision affects both current and future periods.
Council has made no assumptions concerning the future that may cause a material adjustment to the carrying amounts of assets and liabilities within the next reporting period. Judgements made by Council that have significant effects on the financial report are disclosed in the relevant notes as follows:
Employee entitlements
Actuarial assumptions are utilised in the determination of Council’s defined benefit superannuation fund obligations. These assumptions are discussed in Note 38.
Defined benefit superannuation fund obligations
Assumptions are utilised in the determination of Council’s employee entitlement provisions. These assumptions are discussed in Note 34.
Investment in Water Corporation
Assumptions utilised in the determination of Council’s valuation of its investment in TasWater are discussed in Note 18.
Tip Rehabilitation
Assumptions and judgements are utilised in determining Council’s valuation of its Provision for Tip Rehabilitation are discussed in Note 34.
Notes to and forming part of the Financial ReportPage 5 of 40
(b) Revenue Recognition
Rates, Grants, Reimbursements and Contributions of Monetary Assets, and Contributions of Non-Monetary Assets
User Fees and charges
Dividends
(c) Expense Recognition
(d) Concessionary Leases
Expenses are recognised in the Statement of Comprehensive Income when a decrease in future economic benefits related to a decrease in asset or an increase of a liability has arisen that can be measured reliably.
Council has elected to measure concessionary leases for land at cost, which equated to nil value.
Dividend revenue is recognised when Council's right to receive payment is established.
Council recognises revenue from user fees and charges when or as the performance obligation is completed and the customer receives the benefit of the goods / services being provided.
Council recognises untied grant revenue and those without performance obligations when received. In cases where funding includes specific performance obligations or is to acquire or construct a recognisable non-financial asset, a liability is recognised for funds received in advance and income is recognised as obligations are fulfilled.
Council recognises contributions without performance obligations when received. In cases where the contributions is for a specific purpose to acquire or construct a recognisable non-financial asset, a liability is recognised for funds received in advance and income recognised as obligations are fulfilled.
Unreceived contributions over which Council has control are recognised as receivables.
Non-monetary contributions and Subdivision Assets Taken Over with a value in excess of the recognition thresholds, are recognised as revenue and as non-current assets. Non-monetary contributions below the thresholds are recorded as revenue.
Revenue is measured at fair value of the consideration received or receivable. Revenue is measured on major income categories including the following:
Council recognises revenue from rates and annual charges for the amount it is expected to be entitled to at the beginning of the rating period to which they relate, or when the charge has been applied. Rates and charges in advance are recognised as a financial liability until the beginning of the rating period to which they relate.
Licences granted by Council are all either short-term or low value and all revenue is recognised at the time that the licence is granted rather than the term of the licence.
Notes to and forming part of the Financial ReportPage 6 of 40

44
2. FUNCTIO
NS/ACTIVITIES O
F THE CO
UNCIL
(a) Expenses, revenues and assets have been attributed to the following functions/activities, descriptions of which are set out in Note 2(c).
ROAD
S,H
EALTH,
LAND
USERECREATIO
NUN
ALLOCATED
TOTAL
STREETSCO
MM
UNITY
PLANN
ING
& CULTURE
& UN
CLASSIFIED&
BRIDGES
& W
ELFARE SERVICES&
BUILDIN
G CON
TROL
20202019
20202019
20202019
20202019
20202019
20202019
RevenuesGrants
3,516,897
2,777,727
522,245
527,822
-
-
796,543
1,489,364
2,107,368
2,161,429
6,943,053
6,956,342
Rates-
-
2,794,113
2,672,863
-
-
-
-
10,009,200
9,918,829
12,803,313
12,591,692
Other
472,599
120,355
758,273
898,148
545,103
508,812
440,489
322,619
1,475,868
1,617,006
3,692,332
3,466,940
Total3,989,496
$ 2,898,082
$ 4,074,631
$ 4,098,833
$ 545,103
$ 508,812
$ 1,237,032
$ 1,811,983
$ 13,592,436
$ 13,697,264
$ 23,438,698
$ 23,014,974
$ Expenses
6,526,019$
6,520,751$
8,353,620$
8,373,093$
1,567,032$
1,626,669$
3,354,592$
3,135,613$
161,889$
202,351$
19,963,152$
19,858,477$
%32.69%
32.84%41.85%
42.16%7.85%
8.19%16.80%
15.79%0.81%
1.02%100.00%
100.00%
(2,536,523)$
(3,622,669)$
(4,278,989)$
(4,274,260)$
(1,021,929)$
(1,117,857)$
(2,117,560)$
(1,323,630)$
13,430,547$
13,494,913$
3,475,546$
3,156,497$
Assets Note 2(b)
150,472,825$
146,297,381$
32,047,260$
30,701,249$
51,065$
80,842$
28,612,211$
26,265,695$
101,577,521$
114,501,979$
312,760,882$
317,847,146$
Net Surplus/(D
eficit)
Notes to and form
ing part of the Financial ReportPage 7 of 40
2. F
UNCT
ION
S/AC
TIVI
TIES
OF
THE
COUN
CIL
(a)
Expe
nses
, rev
enue
s and
ass
ets h
ave
been
attr
ibut
ed to
the
follo
wing
func
tions
/act
ivitie
s, de
scrip
tions
of w
hich
are
set o
ut in
Not
e 2(
c).
ROAD
S,H
EALT
H,
LAN
D U
SERE
CREA
TIO
NUN
ALLO
CATE
DTO
TAL
STRE
ETS
COM
MUN
ITY
PLAN
NIN
G&
CUL
TURE
& U
NCL
ASSI
FIED
& B
RID
GES
& W
ELFA
RE S
ERVI
CES
& B
UILD
ING
CON
TRO
L20
2020
1920
2020
1920
2020
1920
2020
1920
2020
1920
2020
19Re
venu
esGr
ants
3,51
6,89
7
2,77
7,72
7
522,
245
52
7,82
2
-
-
796,
543
1,
489,
364
2,10
7,36
8
2,
161,
429
6,94
3,05
3
6,95
6,34
2
Rate
s-
-
2,
794,
113
2,67
2,86
3
-
-
-
-
10
,009
,200
9,91
8,82
9
12
,803
,313
12,5
91,6
92
Oth
er47
2,59
9
12
0,35
5
75
8,27
3
898,
148
54
5,10
3
508,
812
44
0,48
9
322,
619
1,
475,
868
1,61
7,00
6
3,
692,
332
3,
466,
940
To
tal
3,98
9,49
6$
2,89
8,08
2$
4,07
4,63
1$
4,
098,
833
$
545,
103
$
50
8,81
2$
1,23
7,03
2$
1,
811,
983
$
13,5
92,4
36$
13
,697
,264
$
23,4
38,6
98$
23
,014
,974
$
Expe
nses
6,52
6,01
9$
6,52
0,75
1$
8,35
3,62
0$
8,37
3,09
3$
1,56
7,03
2$
1,
626,
669
$
3,35
4,59
2$
3,13
5,61
3$
161,
889
$
202,
351
$
19,9
63,1
52$
19,8
58,4
77$
%32
.69%
32.8
4%41
.85%
42.1
6%7.
85%
8.19
%16
.80%
15.7
9%0.
81%
1.02
%10
0.00
%10
0.00
%
(2,5
36,5
23)
$
(3
,622
,669
)$
(4,2
78,9
89)
$
(4,2
74,2
60)
$
(1,0
21,9
29)
$
(1,1
17,8
57)
$
(2,1
17,5
60)
$
(1,3
23,6
30)
$
13,4
30,5
47$
13
,494
,913
$
3,47
5,54
6$
3,15
6,49
7$
Asse
ts N
ote
2(b)
150,
472,
825
$
146,
297,
381
$
32,0
47,2
60$
30
,701
,249
$
51,0
65$
80
,842
$
28,6
12,2
11$
26
,265
,695
$
101,
577,
521
$ 11
4,50
1,97
9$
312,
760,
882
$
317,
847,
146
$
Net
Sur
plus
/(D
efic
it)
Not
es to
and
form
ing
part
of th
e Fi
nanc
ial R
epor
tPa
ge 7
of 4
0
Actual Actual2020 2019
$ $2. FUNCTIONS/ACTIVITIES OF THE COUNCIL (CONT.)
Current Assets 22,725,474 25,898,852Non-Current Assets 290,035,408 291,948,294
312,760,882 317,847,146
Roads, Streets and Bridges
Health, Community and Welfare Services
Land Use Planning and Building Control
Recreation and Culture
Unallocated and Unclassified
General rates and charges, general services and activities not identifiable with the foregoing functions, including private works and stock.
(b) Total assets shown in Note 2(a) are reconciled with the amounts shown for assets in the Statement of Financial Position:
(c) The activities of the Council are categorised into the following broad functions:
Construction, maintenance and cleaning of road, streets, footpaths, bridges, parking facilities and street lighting.
Collection, handling, processing and disposal of all waste materials, operation and maintenance of preventative health, animal control, fire protection, tourism promotion, sundry economic services, state emergency services, urban stormwater drainage, protection of the environment, cemeteries, community amenities, families and children, aged and disabled, and community development.
Administration of the town planning scheme, subdivisions and urban and rural renewal programs. The development and maintenance of building constructions standards.
Administration and maintenance of public halls, swimming pools and other swimming, recreation grounds and other sports facilities, library services, sundry cultural activities and parks and reserves.
Notes to and forming part of the Financial ReportPage 8 of 40
2. FUNCTIONS/ACTIVITIES OF THE COUNCIL
(a) Expenses, revenues and assets have been attributed to the following functions/activities, descriptions of which are set out in Note 2(c).
ROADS, HEALTH, LAND USE RECREATION UNALLOCATED TOTALSTREETS COMMUNITY PLANNING & CULTURE & UNCLASSIFIED
& BRIDGES & WELFARE SERVICES & BUILDING CONTROL2020 2019 2020 2019 2020 2019 2020 2019 2020 2019 2020 2019
RevenuesGrants 3,516,897 2,777,727 522,245 527,822 - - 796,543 1,489,364 2,107,368 2,161,429 6,943,053 6,956,342
Rates - - 2,794,113 2,672,863 - - - - 10,009,200 9,918,829 12,803,313 12,591,692
Other 472,599 120,355 758,273 898,148 545,103 508,812 440,489 322,619 1,475,868 1,617,006 3,692,332 3,466,940 Total 3,989,496$ 2,898,082$ 4,074,631$ 4,098,833$ 545,103$ 508,812$ 1,237,032$ 1,811,983$ 13,592,436$ 13,697,264$ 23,438,698$ 23,014,974$
Expenses 6,526,019$ 6,520,751$ 8,353,620$ 8,373,093$ 1,567,032$ 1,626,669$ 3,354,592$ 3,135,613$ 161,889$ 202,351$ 19,963,152$ 19,858,477$ % 32.69% 32.84% 41.85% 42.16% 7.85% 8.19% 16.80% 15.79% 0.81% 1.02% 100.00% 100.00%
(2,536,523)$ (3,622,669)$ (4,278,989)$ (4,274,260)$ (1,021,929)$ (1,117,857)$ (2,117,560)$ (1,323,630)$ 13,430,547$ 13,494,913$ 3,475,546$ 3,156,497$ Assets Note 2(b) 150,472,825$ 146,297,381$ 32,047,260$ 30,701,249$ 51,065$ 80,842$ 28,612,211$ 26,265,695$ 101,577,521$ 114,501,979$ 312,760,882$ 317,847,146$
Net Surplus/(Deficit)
Notes to and forming part of the Financial ReportPage 7 of 40

45
2. FUNCTIO
NS/ACTIVITIES O
F THE CO
UNCIL
(a) Expenses, revenues and assets have been attributed to the following functions/activities, descriptions of which are set out in Note 2(c).
ROAD
S,H
EALTH,
LAND
USERECREATIO
NUN
ALLOCATED
TOTAL
STREETSCO
MM
UNITY
PLANN
ING
& CULTURE
& UN
CLASSIFIED&
BRIDGES
& W
ELFARE SERVICES&
BUILDIN
G CON
TROL
20202019
20202019
20202019
20202019
20202019
20202019
RevenuesGrants
3,516,897
2,777,727
522,245
527,822
-
-
796,543
1,489,364
2,107,368
2,161,429
6,943,053
6,956,342
Rates-
-
2,794,113
2,672,863
-
-
-
-
10,009,200
9,918,829
12,803,313
12,591,692
Other
472,599
120,355
758,273
898,148
545,103
508,812
440,489
322,619
1,475,868
1,617,006
3,692,332
3,466,940
Total3,989,496
$ 2,898,082
$ 4,074,631
$ 4,098,833
$ 545,103
$ 508,812
$ 1,237,032
$ 1,811,983
$ 13,592,436
$ 13,697,264
$ 23,438,698
$ 23,014,974
$ Expenses
6,526,019$
6,520,751$
8,353,620$
8,373,093$
1,567,032$
1,626,669$
3,354,592$
3,135,613$
161,889$
202,351$
19,963,152$
19,858,477$
%32.69%
32.84%41.85%
42.16%7.85%
8.19%16.80%
15.79%0.81%
1.02%100.00%
100.00%
(2,536,523)$
(3,622,669)$
(4,278,989)$
(4,274,260)$
(1,021,929)$
(1,117,857)$
(2,117,560)$
(1,323,630)$
13,430,547$
13,494,913$
3,475,546$
3,156,497$
Assets Note 2(b)
150,472,825$
146,297,381$
32,047,260$
30,701,249$
51,065$
80,842$
28,612,211$
26,265,695$
101,577,521$
114,501,979$
312,760,882$
317,847,146$
Net Surplus/(D
eficit)
Notes to and form
ing part of the Financial ReportPage 7 of 40
Actual Actual2020 2019
$ $2. FUNCTIONS/ACTIVITIES OF THE COUNCIL (CONT.)
Current Assets 22,725,474 25,898,852Non-Current Assets 290,035,408 291,948,294
312,760,882 317,847,146
Roads, Streets and Bridges
Health, Community and Welfare Services
Land Use Planning and Building Control
Recreation and Culture
Unallocated and Unclassified
General rates and charges, general services and activities not identifiable with the foregoing functions, including private works and stock.
(b) Total assets shown in Note 2(a) are reconciled with the amounts shown for assets in the Statement of Financial Position:
(c) The activities of the Council are categorised into the following broad functions:
Construction, maintenance and cleaning of road, streets, footpaths, bridges, parking facilities and street lighting.
Collection, handling, processing and disposal of all waste materials, operation and maintenance of preventative health, animal control, fire protection, tourism promotion, sundry economic services, state emergency services, urban stormwater drainage, protection of the environment, cemeteries, community amenities, families and children, aged and disabled, and community development.
Administration of the town planning scheme, subdivisions and urban and rural renewal programs. The development and maintenance of building constructions standards.
Administration and maintenance of public halls, swimming pools and other swimming, recreation grounds and other sports facilities, library services, sundry cultural activities and parks and reserves.
Notes to and forming part of the Financial ReportPage 8 of 40
2. FUNCTIONS/ACTIVITIES OF THE COUNCIL
(a) Expenses, revenues and assets have been attributed to the following functions/activities, descriptions of which are set out in Note 2(c).
ROADS, HEALTH, LAND USE RECREATION UNALLOCATED TOTALSTREETS COMMUNITY PLANNING & CULTURE & UNCLASSIFIED
& BRIDGES & WELFARE SERVICES & BUILDING CONTROL2020 2019 2020 2019 2020 2019 2020 2019 2020 2019 2020 2019
RevenuesGrants 3,516,897 2,777,727 522,245 527,822 - - 796,543 1,489,364 2,107,368 2,161,429 6,943,053 6,956,342
Rates - - 2,794,113 2,672,863 - - - - 10,009,200 9,918,829 12,803,313 12,591,692
Other 472,599 120,355 758,273 898,148 545,103 508,812 440,489 322,619 1,475,868 1,617,006 3,692,332 3,466,940 Total 3,989,496$ 2,898,082$ 4,074,631$ 4,098,833$ 545,103$ 508,812$ 1,237,032$ 1,811,983$ 13,592,436$ 13,697,264$ 23,438,698$ 23,014,974$
Expenses 6,526,019$ 6,520,751$ 8,353,620$ 8,373,093$ 1,567,032$ 1,626,669$ 3,354,592$ 3,135,613$ 161,889$ 202,351$ 19,963,152$ 19,858,477$ % 32.69% 32.84% 41.85% 42.16% 7.85% 8.19% 16.80% 15.79% 0.81% 1.02% 100.00% 100.00%
(2,536,523)$ (3,622,669)$ (4,278,989)$ (4,274,260)$ (1,021,929)$ (1,117,857)$ (2,117,560)$ (1,323,630)$ 13,430,547$ 13,494,913$ 3,475,546$ 3,156,497$ Assets Note 2(b) 150,472,825$ 146,297,381$ 32,047,260$ 30,701,249$ 51,065$ 80,842$ 28,612,211$ 26,265,695$ 101,577,521$ 114,501,979$ 312,760,882$ 317,847,146$
Net Surplus/(Deficit)
Notes to and forming part of the Financial ReportPage 7 of 40
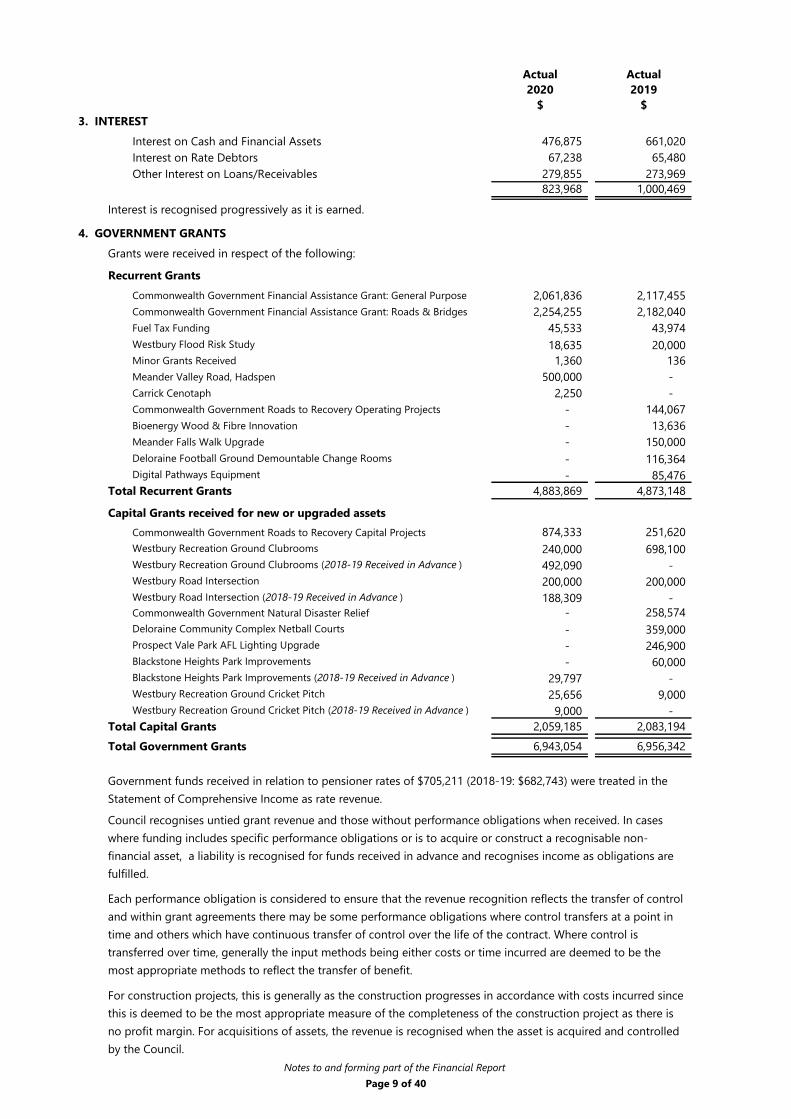
46
Actual Actual2020 2019
$ $3. INTEREST
Interest on Cash and Financial Assets 476,875 661,020 Interest on Rate Debtors 67,238 65,480 Other Interest on Loans/Receivables 279,855 273,969
823,968 1,000,469
4. GOVERNMENT GRANTSGrants were received in respect of the following:
Recurrent GrantsCommonwealth Government Financial Assistance Grant: General Purpose 2,061,836 2,117,455 Commonwealth Government Financial Assistance Grant: Roads & Bridges 2,254,255 2,182,040 Fuel Tax Funding 45,533 43,974 Westbury Flood Risk Study 18,635 20,000 Minor Grants Received 1,360 136 Meander Valley Road, Hadspen 500,000 - Carrick Cenotaph 2,250 - Commonwealth Government Roads to Recovery Operating Projects - 144,067 Bioenergy Wood & Fibre Innovation - 13,636 Meander Falls Walk Upgrade - 150,000 Deloraine Football Ground Demountable Change Rooms - 116,364 Digital Pathways Equipment - 85,476
Total Recurrent Grants 4,883,869 4,873,148
Capital Grants received for new or upgraded assetsCommonwealth Government Roads to Recovery Capital Projects 874,333 251,620 Westbury Recreation Ground Clubrooms 240,000 698,100 Westbury Recreation Ground Clubrooms (2018-19 Received in Advance ) 492,090 - Westbury Road Intersection 200,000 200,000 Westbury Road Intersection (2018-19 Received in Advance ) 188,309 - Commonwealth Government Natural Disaster Relief - 258,574 Deloraine Community Complex Netball Courts - 359,000 Prospect Vale Park AFL Lighting Upgrade - 246,900 Blackstone Heights Park Improvements - 60,000 Blackstone Heights Park Improvements (2018-19 Received in Advance ) 29,797 - Westbury Recreation Ground Cricket Pitch 25,656 9,000 Westbury Recreation Ground Cricket Pitch (2018-19 Received in Advance ) 9,000 -
Total Capital Grants 2,059,185 2,083,194 Total Government Grants 6,943,054 6,956,342
Interest is recognised progressively as it is earned.
Government funds received in relation to pensioner rates of $705,211 (2018-19: $682,743) were treated in the Statement of Comprehensive Income as rate revenue.
Council recognises untied grant revenue and those without performance obligations when received. In cases where funding includes specific performance obligations or is to acquire or construct a recognisable non-financial asset, a liability is recognised for funds received in advance and recognises income as obligations are fulfilled.
Each performance obligation is considered to ensure that the revenue recognition reflects the transfer of control and within grant agreements there may be some performance obligations where control transfers at a point in time and others which have continuous transfer of control over the life of the contract. Where control is transferred over time, generally the input methods being either costs or time incurred are deemed to be the most appropriate methods to reflect the transfer of benefit.
For construction projects, this is generally as the construction progresses in accordance with costs incurred since this is deemed to be the most appropriate measure of the completeness of the construction project as there is no profit margin. For acquisitions of assets, the revenue is recognised when the asset is acquired and controlled by the Council.
Notes to and forming part of the Financial ReportPage 9 of 40
Actual Actual2020 2019
$ $
Conditions on grants
Unexpended at the close of the previous reporting period -
Westbury Recreation Ground Clubrooms 492,090 Westbury Road Intersection 188,309 Blackstone Heights Park Improvements 29,797 Westbury Recreation Ground Cricket Pitch 9,000
719,196
Unexpended at the close of this reporting period 719,196
719,196
5. EMPLOYEE COSTSWages and Salaries 5,528,875 5,014,261Annual, Sick and Long Service Leave 849,552 886,571Superannuation 714,031 734,302State Government Payroll Tax 347,731 327,412Total Employee Expenses 7,440,189 6,962,546Less Capital & Non-Recurrent Expenditure
Labour Capital Assets constructed by Council (567,238) (536,793) (567,238) (536,793)
6,872,951 6,425,753
6. MATERIALS AND CONTRACTSFire Levy 1,264,848 1,191,966Councillor Allowances 191,464 186,350Insurance 312,060 285,516Street Lighting 212,157 187,182Household Waste 1,401,159 1,353,632Road Maintenance 1,242,440 1,116,940Bridge Maintenance 141,673 154,391Consultants 420,971 478,263Electricity 87,812 109,372Motor Vehicles 134,849 125,945Publications and Subscriptions 96,869 232,724Other 2,135,929 2,765,984
7,642,231 8,188,265
Employee benefits include, where applicable, entitlements to wages and salaries, annual leave, sick leave, long service leave, superannuation and any other post-employment benefits.
In both years the Commonwealth has made early payment of the first two quarterly instalments for the following year. The early receipt of instalments resulted in Commonwealth Government Financial Assistance Grants being above that originally budgeted in 2019-20 by $2,217,893 (2018-19: $2,180,889). This has impacted the Statement of Comprehensive Income resulting in the Surplus/(deficit) being higher by the same amount.
Non-reciprocal grants which were obtained on the condition that they be expended for specified purposes or in a future period, but which are not yet expended in accordance with those conditions, are as follows:
Net increase (decrease) in non-reciprocal grant revenues for the year
Plus: amounts recognised as revenues in this reporting period but not yet expended in accordance with the conditions
Refer to Note 45 for accounting policy related to AASB 15 and AASB 1058.
Notes to and forming part of the Financial ReportPage 10 of 40

47
Actual Actual2020 2019
$ $3. INTEREST
Interest on Cash and Financial Assets 476,875 661,020 Interest on Rate Debtors 67,238 65,480 Other Interest on Loans/Receivables 279,855 273,969
823,968 1,000,469
4. GOVERNMENT GRANTSGrants were received in respect of the following:
Recurrent GrantsCommonwealth Government Financial Assistance Grant: General Purpose 2,061,836 2,117,455 Commonwealth Government Financial Assistance Grant: Roads & Bridges 2,254,255 2,182,040 Fuel Tax Funding 45,533 43,974 Westbury Flood Risk Study 18,635 20,000 Minor Grants Received 1,360 136 Meander Valley Road, Hadspen 500,000 - Carrick Cenotaph 2,250 - Commonwealth Government Roads to Recovery Operating Projects - 144,067 Bioenergy Wood & Fibre Innovation - 13,636 Meander Falls Walk Upgrade - 150,000 Deloraine Football Ground Demountable Change Rooms - 116,364 Digital Pathways Equipment - 85,476
Total Recurrent Grants 4,883,869 4,873,148
Capital Grants received for new or upgraded assetsCommonwealth Government Roads to Recovery Capital Projects 874,333 251,620 Westbury Recreation Ground Clubrooms 240,000 698,100 Westbury Recreation Ground Clubrooms (2018-19 Received in Advance ) 492,090 - Westbury Road Intersection 200,000 200,000 Westbury Road Intersection (2018-19 Received in Advance ) 188,309 - Commonwealth Government Natural Disaster Relief - 258,574 Deloraine Community Complex Netball Courts - 359,000 Prospect Vale Park AFL Lighting Upgrade - 246,900 Blackstone Heights Park Improvements - 60,000 Blackstone Heights Park Improvements (2018-19 Received in Advance ) 29,797 - Westbury Recreation Ground Cricket Pitch 25,656 9,000 Westbury Recreation Ground Cricket Pitch (2018-19 Received in Advance ) 9,000 -
Total Capital Grants 2,059,185 2,083,194 Total Government Grants 6,943,054 6,956,342
Interest is recognised progressively as it is earned.
Government funds received in relation to pensioner rates of $705,211 (2018-19: $682,743) were treated in the Statement of Comprehensive Income as rate revenue.
Council recognises untied grant revenue and those without performance obligations when received. In cases where funding includes specific performance obligations or is to acquire or construct a recognisable non-financial asset, a liability is recognised for funds received in advance and recognises income as obligations are fulfilled.
Each performance obligation is considered to ensure that the revenue recognition reflects the transfer of control and within grant agreements there may be some performance obligations where control transfers at a point in time and others which have continuous transfer of control over the life of the contract. Where control is transferred over time, generally the input methods being either costs or time incurred are deemed to be the most appropriate methods to reflect the transfer of benefit.
For construction projects, this is generally as the construction progresses in accordance with costs incurred since this is deemed to be the most appropriate measure of the completeness of the construction project as there is no profit margin. For acquisitions of assets, the revenue is recognised when the asset is acquired and controlled by the Council.
Notes to and forming part of the Financial ReportPage 9 of 40
Actual Actual2020 2019
$ $
Conditions on grants
Unexpended at the close of the previous reporting period -
Westbury Recreation Ground Clubrooms 492,090 Westbury Road Intersection 188,309 Blackstone Heights Park Improvements 29,797 Westbury Recreation Ground Cricket Pitch 9,000
719,196
Unexpended at the close of this reporting period 719,196
719,196
5. EMPLOYEE COSTSWages and Salaries 5,528,875 5,014,261Annual, Sick and Long Service Leave 849,552 886,571Superannuation 714,031 734,302State Government Payroll Tax 347,731 327,412Total Employee Expenses 7,440,189 6,962,546Less Capital & Non-Recurrent Expenditure
Labour Capital Assets constructed by Council (567,238) (536,793) (567,238) (536,793)
6,872,951 6,425,753
6. MATERIALS AND CONTRACTSFire Levy 1,264,848 1,191,966Councillor Allowances 191,464 186,350Insurance 312,060 285,516Street Lighting 212,157 187,182Household Waste 1,401,159 1,353,632Road Maintenance 1,242,440 1,116,940Bridge Maintenance 141,673 154,391Consultants 420,971 478,263Electricity 87,812 109,372Motor Vehicles 134,849 125,945Publications and Subscriptions 96,869 232,724Other 2,135,929 2,765,984
7,642,231 8,188,265
Employee benefits include, where applicable, entitlements to wages and salaries, annual leave, sick leave, long service leave, superannuation and any other post-employment benefits.
In both years the Commonwealth has made early payment of the first two quarterly instalments for the following year. The early receipt of instalments resulted in Commonwealth Government Financial Assistance Grants being above that originally budgeted in 2019-20 by $2,217,893 (2018-19: $2,180,889). This has impacted the Statement of Comprehensive Income resulting in the Surplus/(deficit) being higher by the same amount.
Non-reciprocal grants which were obtained on the condition that they be expended for specified purposes or in a future period, but which are not yet expended in accordance with those conditions, are as follows:
Net increase (decrease) in non-reciprocal grant revenues for the year
Plus: amounts recognised as revenues in this reporting period but not yet expended in accordance with the conditions
Refer to Note 45 for accounting policy related to AASB 15 and AASB 1058.
Notes to and forming part of the Financial ReportPage 10 of 40

48
Actual Actual2020 2019
$ $7. DEPRECIATION AND AMORTISATION EXPENSE
Depreciation and amortisation was charged in respect of:Land Improvements 658,142 565,338 Buildings 396,350 368,188 Roads and Streets 2,484,965 2,409,606 Bridges 466,847 469,542 Stormwater 388,212 371,362 Plant and Equipment 601,677 617,672 Heritage 282 281 Computer Software 44,952 37,211 Valuations 26,725 29,586
5,068,152 4,868,786
The current depreciation method and useful lives are:Method Useful Life
Land Not Depreciated Unlimited LifeLand Under Roads Not Depreciated Unlimited LifeLand Improvements Straight Line 2 - 100 yearsBuildings Straight Line 30 - 250 yearsRoad and Street Components Straight Line 5 - 200 yearsBridges Straight Line 14 - 133 yearsStormwater Drainage Reticulation Straight Line 18 - 75 yearsPlant & Equipment Straight Line 3 - 30 yearsLarge Plant/Machinery (Mechanical) Straight Line 7 - 20 yearsSmall Plant/Machinery (Mechanical) Straight Line 3 - 20 yearsPlant/Machinery (Electrical) Straight Line 3 - 20 yearsOffice Equipment Straight Line 3 - 30 yearsMotor Vehicle Straight Line 5 yearsHeritage Assets Straight Line 15 - 300 yearsComputer Software Straight Line 3 - 10 years
8. FINANCE COSTSUnwinding of Tip Rehabilitation Provision 54,892 15,086 Interest Charges 211,320 211,320
266,212 226,406
Where assets have separate identifiable components that are subject to regular replacement, these components are assigned distinct useful lives and remaining values and a separate depreciation rate is determined for each component.
Road earthworks are not depreciated on the basis that they are assessed as not having a limited useful life. This shall be reviewed at least at the end of each reporting period, to ensure that the accounting policy applied to road earthworks reflects the most recent assessment of the useful lives of the assets, having regard to factors such as asset usage, physical deterioration and technical and commercial obsolescence.
Land and Land Under Roads are not depreciable assets.
Asset
Finance costs are expensed as incurred using the effective interest method. Borrowing costs include interest on bank overdrafts, interest on borrowings and unwinding of present value calculations.
Buildings, land improvements, plant and equipment, infrastructure and other assets having limited useful lives are systematically depreciated over their economic life to Council at a rate of depreciation that reflects the consumption of the service potential of the assets. Depreciation is recognised on a straight-line basis and is reviewed each reporting period. Depreciation rates and methods are reviewed annually.
Notes to and forming part of the Financial ReportPage 11 of 40

49
Actual Actual2020 2019
$ $7. DEPRECIATION AND AMORTISATION EXPENSE
Depreciation and amortisation was charged in respect of:Land Improvements 658,142 565,338 Buildings 396,350 368,188 Roads and Streets 2,484,965 2,409,606 Bridges 466,847 469,542 Stormwater 388,212 371,362 Plant and Equipment 601,677 617,672 Heritage 282 281 Computer Software 44,952 37,211 Valuations 26,725 29,586
5,068,152 4,868,786
The current depreciation method and useful lives are:Method Useful Life
Land Not Depreciated Unlimited LifeLand Under Roads Not Depreciated Unlimited LifeLand Improvements Straight Line 2 - 100 yearsBuildings Straight Line 30 - 250 yearsRoad and Street Components Straight Line 5 - 200 yearsBridges Straight Line 14 - 133 yearsStormwater Drainage Reticulation Straight Line 18 - 75 yearsPlant & Equipment Straight Line 3 - 30 yearsLarge Plant/Machinery (Mechanical) Straight Line 7 - 20 yearsSmall Plant/Machinery (Mechanical) Straight Line 3 - 20 yearsPlant/Machinery (Electrical) Straight Line 3 - 20 yearsOffice Equipment Straight Line 3 - 30 yearsMotor Vehicle Straight Line 5 yearsHeritage Assets Straight Line 15 - 300 yearsComputer Software Straight Line 3 - 10 years
8. FINANCE COSTSUnwinding of Tip Rehabilitation Provision 54,892 15,086 Interest Charges 211,320 211,320
266,212 226,406
Where assets have separate identifiable components that are subject to regular replacement, these components are assigned distinct useful lives and remaining values and a separate depreciation rate is determined for each component.
Road earthworks are not depreciated on the basis that they are assessed as not having a limited useful life. This shall be reviewed at least at the end of each reporting period, to ensure that the accounting policy applied to road earthworks reflects the most recent assessment of the useful lives of the assets, having regard to factors such as asset usage, physical deterioration and technical and commercial obsolescence.
Land and Land Under Roads are not depreciable assets.
Asset
Finance costs are expensed as incurred using the effective interest method. Borrowing costs include interest on bank overdrafts, interest on borrowings and unwinding of present value calculations.
Buildings, land improvements, plant and equipment, infrastructure and other assets having limited useful lives are systematically depreciated over their economic life to Council at a rate of depreciation that reflects the consumption of the service potential of the assets. Depreciation is recognised on a straight-line basis and is reviewed each reporting period. Depreciation rates and methods are reviewed annually.
Notes to and forming part of the Financial ReportPage 11 of 40
Actual Actual2020 2019
$ $9. OTHER EXPENSES
Other Expenses includes:External Auditor's Remuneration 31,884 36,310Community Grants 80,621 111,461Donations and Other 867 1,124 Bad Debts 234 372
113,606 149,267
10. DISPOSAL & DERECOGNITION OF ASSETS TotalProceeds from sales/disposal (762,010) (53,091) Written down value of assets sold/disposed 465,896 123,478 (Profit)/Loss on Disposal of Assets (296,114) 70,387
Recurrent write-off/disposal of infrastructure and plant & equipment (2,236) 70,387 One-off disposals of Land & Buildings (293,878) -
(296,114) 70,387
11. CURRENT ASSETS - Cash and Cash EquivalentsCash at Bank 3,113,229 3,386,167 Cash on Hand 1,450 1,450
3,114,679 3,387,617 The above figures are reconciled to cash at end of the financial year as shown in the Statement of Cash Flows as follows:
Balance as above 3,114,679 3,387,617 Balance per Statement of Cash Flows 3,114,679 3,387,617
12. CURRENT ASSETS - Trade and Other Receivables
Rates Debtors 727,951 643,473 Other Debtors 230,788 331,212
958,739 974,685
Cash Assets include all amounts readily convertible to cash on hand (cash on hand, deposits at call with financial institutions, other short term, highly liquid investments) at Council’s option with an insignificant risk of changes in value with a maturity of three months or less. Cash equivalents are held for the purpose of meeting short term cash commitments rather than for investment or other purposes. All financial instruments are recognised at fair value at the date of recognition. A detailed statement of the accounting policies applied to financial instruments forms part of Note 42.
Trade receivables that do not contain a significant financing component are measured at amortised cost, which represents their transaction value. Impairment is recognised on an expected credit loss (ECL) basis. When determining whether the credit risk has increased significantly since initial recognition, and when estimating the ECL, Council considers reasonable and supportable information that is relevant and available without undue cost or effort. This includes both quantitative and qualitative information and analysis based on Council’s historical experience, an informed credit assessment and forward-looking information. Council has established a provision matrix to facilitate the impairment assessment.
For rate debtors, Council takes the view that unpaid rates represent a charge against the rateable property that will be recovered when the property is next sold. For non-rate debtors, Council uses the presumptions that assets more than 30 days past due have a significant increase in credit risk and those more than 90 days will likely be in default. Council writes off receivables when there is information indicating that the debtor is in severe financial difficulty and there is no realistic prospect of recovery.
The gain or loss on sale of an asset is determined when control of the asset has irrevocably passed to the buyer.
Notes to and forming part of the Financial ReportPage 12 of 40

50
Actual Actual2020 2019
$ $
13. CURRENT ASSETS - Investments
Term Deposits 18,469,868 21,254,466
Market value of investments as at the reporting date 18,469,868 21,254,466
14. CURRENT ASSETS - Other
Inventory Materials 67,439 78,236Accrued Revenue 114,749 203,848
182,188 282,084
15. CURRENT LIABILITIES - Trade and Other Payables
Employee Costs 104,982 65,118Materials and Contracts 1,101,970 1,268,497Other Creditors 188,254 270,203
1,395,206 1,603,818
16. CURRENT LIABILITIES - Provisions
Provision for Annual Leave 669,221 675,342Provision for Long Service Leave 614,603 604,449Employee Provisions oncosts 159,522 157,976
1,443,346 1,437,767
17. CURRENT LIABILITIES - Contract Liabilities
Rates Received in Advance 347,834 - 347,834 -
Inventories held for distribution are measured at cost adjusted when applicable for any loss of service potential. Other inventories are measured at the lower of cost and net realisable value.
The obligations are presented as current liabilities in the statement of financial position if the entity does not have an unconditional right to defer settlement for at least twelve months after the reporting date, regardless of when the actual settlement is expected to occur.
Rates and charges in advance represents amounts received by Council prior to the commencement of the rating or charging period. Revenue is recognised by council at the beginning of the rating or charge period to which the advance payment relates.Grants received in advance includes are funds received under an enforceable contract which require Council to construct an identified asset which will be under Council’s control on completion. The revenue is recognised as Council constructs the asset and the contract liability reflects the funding received which cannot yet be recognised as revenue.
Where inventories are acquired at no cost, or for nominal consideration, the cost shall be the current replacement cost as at the date of acquisition.
Liabilities for wages and salaries, including non-monetary benefits, annual leave and sick leave expected to be wholly settled within 12 months after the end of the period in which the employees render the related service are recognised in respect of employees' services up to the end of the reporting period and are measured at the amounts expected to be paid when the liabilities are settled. The liability for annual leave is recognised in the provision for employee benefits. All other short-term employee benefit obligations are presented as payables.
Term Deposits and Cash at Bank are managed and expended in accordance with Council's Long Term Financial Plan.
- Short-term employee benefits, that fall due within 12 months after year end are measured at nominal value. - Long-term employee benefits that do not fall due within 12 months after year end measured at present value.
All annual leave and the long service leave entitlements representing 10 or more years of continuous service:
Notes to and forming part of the Financial ReportPage 13 of 40
Actual Actual2020 2019
$ $
18. NON-CURRENT ASSETS - Investment in Water Corporation
55,591,755 48,489,574 (13,021,159) 7,102,181 42,570,596 55,591,755
19. NON-CURRENT ASSETS - Loans and Other Receivables
Assessed Contributions - Westbury Industrial Development 821,800 765,716 Assessed Contributions - East Deloraine Industrial Development 103,087 99,100 Loan Receivable - Aged Care Deloraine 3,600,000 3,600,000 Vendor Finance - Aged Care Deloraine 162,000 162,000
4,686,887 4,626,816
20. NON-CURRENT ASSETS - Work in Progress
Work in Progress - at cost 819,400 1,642,466
21. NON-CURRENT ASSETS - Land
Land at Fair Value 8,600,000 8,518,455
22. NON-CURRENT ASSETS - Land Under Roads
Land Under Roads at Fair Vaue 28,994,771 26,169,270
23. NON-CURRENT ASSETS - Land Improvements
Land Improvements at Cost 14,546,818 14,201,053 Less Accumulated Depreciation (7,046,571) (6,422,361)
7,500,247 7,778,692
24. NON-CURRENT ASSETS - Buildings
Buildings at Fair Value 21,715,905 19,213,825 Less Accumulated Depreciation (249,762) (821,783)
21,466,143 18,392,042
25. NON-CURRENT ASSETS - Roads and Streets
Roads and Streets at Fair Value 173,141,603 168,260,026 Less Accumulated Depreciation (51,060,827) (50,060,985)
122,080,776 118,199,041
As Council's investment in TasWater is held for long-term strategic purposes, Council has elected under AASB 9: Financial Instruments to irrevocably classify this equity investment as designated as fair value through other comprehensive income. Subsequent changes in fair value on designated investments in equity instruments are recognised in other comprehensive income and not reclassified through the profit or loss when derecognised. Dividends associated with the equity investments are recognised in profit and loss when the right of payment has been established and it can be reliably measured.
Fair value was determined by using Council's ownership interest against the water corporation's net asset value at balance date. At 30 June 2020, Council holds a 2.95% (2018-19: 2.99%) ownership interest in TasWater which is based on Schedule 2 of the Corporation's Constitution which reflects the Council's voting rights.
Opening balance Fair Value adjustments on equity investment assets
Land improvements include landscaping (trees, grass, rocks and shrubs), earthworks not integral to other assets, playing surfaces on recreation reserves and recreational equipment and structures.
Roads and streets include earthworks, substructures, seals and kerbs relating to roads, roundabouts, driveways, footpaths, nature strips and parking areas.
Land under roads is land under roadways and road reserves including land under footpaths, nature strips and median strips.
Carrying value of investment at end of year
Notes to and forming part of the Financial ReportPage 14 of 40

51
Actual Actual2020 2019
$ $
13. CURRENT ASSETS - Investments
Term Deposits 18,469,868 21,254,466
Market value of investments as at the reporting date 18,469,868 21,254,466
14. CURRENT ASSETS - Other
Inventory Materials 67,439 78,236Accrued Revenue 114,749 203,848
182,188 282,084
15. CURRENT LIABILITIES - Trade and Other Payables
Employee Costs 104,982 65,118Materials and Contracts 1,101,970 1,268,497Other Creditors 188,254 270,203
1,395,206 1,603,818
16. CURRENT LIABILITIES - Provisions
Provision for Annual Leave 669,221 675,342Provision for Long Service Leave 614,603 604,449Employee Provisions oncosts 159,522 157,976
1,443,346 1,437,767
17. CURRENT LIABILITIES - Contract Liabilities
Rates Received in Advance 347,834 - 347,834 -
Inventories held for distribution are measured at cost adjusted when applicable for any loss of service potential. Other inventories are measured at the lower of cost and net realisable value.
The obligations are presented as current liabilities in the statement of financial position if the entity does not have an unconditional right to defer settlement for at least twelve months after the reporting date, regardless of when the actual settlement is expected to occur.
Rates and charges in advance represents amounts received by Council prior to the commencement of the rating or charging period. Revenue is recognised by council at the beginning of the rating or charge period to which the advance payment relates.Grants received in advance includes are funds received under an enforceable contract which require Council to construct an identified asset which will be under Council’s control on completion. The revenue is recognised as Council constructs the asset and the contract liability reflects the funding received which cannot yet be recognised as revenue.
Where inventories are acquired at no cost, or for nominal consideration, the cost shall be the current replacement cost as at the date of acquisition.
Liabilities for wages and salaries, including non-monetary benefits, annual leave and sick leave expected to be wholly settled within 12 months after the end of the period in which the employees render the related service are recognised in respect of employees' services up to the end of the reporting period and are measured at the amounts expected to be paid when the liabilities are settled. The liability for annual leave is recognised in the provision for employee benefits. All other short-term employee benefit obligations are presented as payables.
Term Deposits and Cash at Bank are managed and expended in accordance with Council's Long Term Financial Plan.
- Short-term employee benefits, that fall due within 12 months after year end are measured at nominal value. - Long-term employee benefits that do not fall due within 12 months after year end measured at present value.
All annual leave and the long service leave entitlements representing 10 or more years of continuous service:
Notes to and forming part of the Financial ReportPage 13 of 40
Actual Actual2020 2019
$ $
18. NON-CURRENT ASSETS - Investment in Water Corporation
55,591,755 48,489,574 (13,021,159) 7,102,181 42,570,596 55,591,755
19. NON-CURRENT ASSETS - Loans and Other Receivables
Assessed Contributions - Westbury Industrial Development 821,800 765,716 Assessed Contributions - East Deloraine Industrial Development 103,087 99,100 Loan Receivable - Aged Care Deloraine 3,600,000 3,600,000 Vendor Finance - Aged Care Deloraine 162,000 162,000
4,686,887 4,626,816
20. NON-CURRENT ASSETS - Work in Progress
Work in Progress - at cost 819,400 1,642,466
21. NON-CURRENT ASSETS - Land
Land at Fair Value 8,600,000 8,518,455
22. NON-CURRENT ASSETS - Land Under Roads
Land Under Roads at Fair Vaue 28,994,771 26,169,270
23. NON-CURRENT ASSETS - Land Improvements
Land Improvements at Cost 14,546,818 14,201,053 Less Accumulated Depreciation (7,046,571) (6,422,361)
7,500,247 7,778,692
24. NON-CURRENT ASSETS - Buildings
Buildings at Fair Value 21,715,905 19,213,825 Less Accumulated Depreciation (249,762) (821,783)
21,466,143 18,392,042
25. NON-CURRENT ASSETS - Roads and Streets
Roads and Streets at Fair Value 173,141,603 168,260,026 Less Accumulated Depreciation (51,060,827) (50,060,985)
122,080,776 118,199,041
As Council's investment in TasWater is held for long-term strategic purposes, Council has elected under AASB 9: Financial Instruments to irrevocably classify this equity investment as designated as fair value through other comprehensive income. Subsequent changes in fair value on designated investments in equity instruments are recognised in other comprehensive income and not reclassified through the profit or loss when derecognised. Dividends associated with the equity investments are recognised in profit and loss when the right of payment has been established and it can be reliably measured.
Fair value was determined by using Council's ownership interest against the water corporation's net asset value at balance date. At 30 June 2020, Council holds a 2.95% (2018-19: 2.99%) ownership interest in TasWater which is based on Schedule 2 of the Corporation's Constitution which reflects the Council's voting rights.
Opening balance Fair Value adjustments on equity investment assets
Land improvements include landscaping (trees, grass, rocks and shrubs), earthworks not integral to other assets, playing surfaces on recreation reserves and recreational equipment and structures.
Roads and streets include earthworks, substructures, seals and kerbs relating to roads, roundabouts, driveways, footpaths, nature strips and parking areas.
Land under roads is land under roadways and road reserves including land under footpaths, nature strips and median strips.
Carrying value of investment at end of year
Notes to and forming part of the Financial ReportPage 14 of 40

52
Actual Actual2020 2019
$ $
26. NON-CURRENT ASSETS - Bridges
Bridges at Fair Value 38,955,188 38,268,210 Less Accumulated Depreciation (10,208,566) (10,357,998)
28,746,622 27,910,212
27. NON-CURRENT ASSETS - Stormwater
Stormwater at Fair Value 30,240,640 28,041,503 Less Accumulated Depreciation (8,950,291) (8,165,341)
21,290,349 19,876,162
28. NON-CURRENT ASSETS - Plant and Equipment
Plant and Equipment at Cost 6,925,334 6,760,885 Less Accumulated Depreciation (3,966,872) (3,754,744)
2,958,462 3,006,141
29. NON-CURRENT ASSETS - Heritage
Heritage at Cost 139,854 139,854 Less Accumulated Depreciation (120,371) (120,089)
19,483 19,765
30. NON-CURRENT ASSETS - Computer Software
Computer Software at Cost 755,900 668,577 Less Accumulated Amortisation (602,022) (583,977)
153,878 84,600
31. NON-CURRENT ASSETS - Valuations
Valuations at Cost 174,642 133,000 Less Accumulated Depreciation (26,848) (122)
147,794 132,878
Notes to and forming part of the Financial ReportPage 15 of 40

53
Actual Actual2020 2019
$ $
26. NON-CURRENT ASSETS - Bridges
Bridges at Fair Value 38,955,188 38,268,210 Less Accumulated Depreciation (10,208,566) (10,357,998)
28,746,622 27,910,212
27. NON-CURRENT ASSETS - Stormwater
Stormwater at Fair Value 30,240,640 28,041,503 Less Accumulated Depreciation (8,950,291) (8,165,341)
21,290,349 19,876,162
28. NON-CURRENT ASSETS - Plant and Equipment
Plant and Equipment at Cost 6,925,334 6,760,885 Less Accumulated Depreciation (3,966,872) (3,754,744)
2,958,462 3,006,141
29. NON-CURRENT ASSETS - Heritage
Heritage at Cost 139,854 139,854 Less Accumulated Depreciation (120,371) (120,089)
19,483 19,765
30. NON-CURRENT ASSETS - Computer Software
Computer Software at Cost 755,900 668,577 Less Accumulated Amortisation (602,022) (583,977)
153,878 84,600
31. NON-CURRENT ASSETS - Valuations
Valuations at Cost 174,642 133,000 Less Accumulated Depreciation (26,848) (122)
147,794 132,878
Notes to and forming part of the Financial ReportPage 15 of 40
32.
PRO
PERT
Y, P
LAN
T AN
D E
QUI
PMEN
T, IN
FRAS
TRUC
TURE
2020
Ope
ning
Ba
lanc
eRe
cogn
ition
&
Acqu
isitio
n of
Ass
ets
Reva
luat
ion
Incr
emen
ts /
(Dec
rem
ents
)
Dep
reci
atio
n &
Am
ortis
atio
n W
ritte
n D
own
Valu
e of
D
ispo
sals
Tran
sfer
sYe
ar E
nd
Bala
nce
(Not
e 35
)(N
ote
7)$
$$
$$
$$
Wor
ks In
Pro
gres
s1,
642,
466
10
,742
,199
-
-
-
(1
1,56
5,26
5)
81
9,40
0
To
tal W
orks
In P
rogr
ess
1,64
2,46
6
10,7
42,1
99
-
-
-
(11,
565,
265)
819,
400
Prop
erty
Land
8,51
8,45
5
-
278,
897
-
(197
,352
)
-
8,
600,
000
La
nd U
nder
Roa
ds26
,169
,270
98
,136
2,
727,
365
-
-
-
28
,994
,771
La
nd Im
prov
emen
ts7,
778,
692
4,
889
-
(658
,142
)
-
374,
808
7,50
0,24
7
Build
ings
18,3
92,0
42
-
1,21
8,01
2
(396
,350
)
(178
,752
)
2,
431,
191
21
,466
,143
To
tal p
rope
rty60
,858
,459
10
3,02
5
4,
224,
274
(1
,054
,492
)
(3
76,1
04)
2,80
5,99
9
66,5
61,1
61
Infr
astr
uctu
reRo
ads &
Stre
ets
118,
199,
041
482,
462
-
(2,4
84,9
65)
(72,
231)
5,
956,
469
12
2,08
0,77
6
Br
idge
s27
,910
,212
-
-
(4
66,8
47)
-
1,
303,
257
28
,746
,622
St
orm
wate
r19
,876
,162
57
,978
97
2,31
1
(3
88,2
12)
-
77
2,11
0
21
,290
,349
To
tal i
nfra
stru
ctur
e16
5,98
5,41
5
54
0,44
0
97
2,31
1
(3
,340
,024
)
(7
2,23
1)
8,03
1,83
6
172,
117,
747
Plan
t & E
quip
men
t3,
006,
141
-
-
(6
01,6
77)
(1
7,32
9)
571,
327
2,95
8,46
2
Her
itage
19
,765
-
-
(2
82)
-
-
19
,483
Com
pute
r Sof
twar
e84
,600
-
-
(4
4,95
2)
(232
)
11
4,46
2
15
3,87
8
Valu
atio
ns13
2,87
8
-
-
(2
6,72
5)
-
41,6
41
147,
794
Tota
l 23
0,08
7,25
8
64
3,46
5
5,
196,
585
(5
,068
,152
)
(4
65,8
96)
11,5
65,2
65
241,
958,
525
Not
es to
and
form
ing
part
of th
e Fi
nanc
ial R
epor
tPa
ge 1
6 of
40

54
32. PROPERTY, PLAN
T AND
EQUIPM
ENT, IN
FRASTRUCTURE (CON
T.)
2019
Opening
BalanceRecognition &
Acquisition of Assets
RevaluationIncrem
ents / (D
ecrements)
Depreciation &
Am
ortisation W
ritten Dow
n Value of D
isposals
TransfersYear End Balance
(Note 35)
(Note 7)
$$
$$
$$
$W
orks In Progress727,656
7,351,331
-
-
-
(6,436,521)
1,642,466
Total W
orks In Progress727,656
7,351,331
-
-
-
(6,436,521)
1,642,466
PropertyLand
8,518,455
-
-
-
-
-
8,518,455
Land Under Roads26,169,270
-
-
-
-
-
26,169,270
Land Im
provements
6,889,787
324,628
-
(565,338)
-
1,129,615
7,778,692
Buildings18,640,034
-
-
(368,188)
-
120,196
18,392,042
Total property
60,217,546
324,628
-
(933,526)
-
1,249,811
60,858,459
InfrastructureRoads &
Streets116,221,404
55,505
1,822,916
(2,409,606)
(81,542)
2,590,364
118,199,041
Bridges
26,771,637
-
-
(469,542)
-
1,608,117
27,910,212
Stormwater
19,770,109
85,408
-
(371,362)
-
392,007
19,876,162
Total infrastructure162,763,150
140,913
1,822,916
(3,250,510)
(81,542)
4,590,488
165,985,415
Plant & Equipm
ent3,245,770
-
-
(617,672)
(39,073)
417,116
3,006,141
Heritage
20,046
-
-
(281)
-
-
19,765
Computer Softw
are78,405
-
-
(37,211)
(2,700)
46,106
84,600
Valuations29,626
-
-
(29,586)
(162)
133,000
132,878
Total 226,354,543
465,541
1,822,916
(4,868,786)
(123,477)
6,436,521
230,087,258
Notes to and form
ing part of the Financial ReportPage 17 of 40
32.
PRO
PERT
Y, P
LAN
T AN
D E
QUI
PMEN
T, IN
FRAS
TRUC
TURE
(CO
NT.
)
2019
Ope
ning
Ba
lanc
eRe
cogn
ition
&
Acqu
isitio
n of
Ass
ets
Reva
luat
ion
Incr
emen
ts /
(Dec
rem
ents
)
Dep
reci
atio
n &
Am
ortis
atio
n W
ritte
n D
own
Valu
e of
D
ispo
sals
Tran
sfer
sYe
ar E
nd
Bala
nce
(Not
e 35
)(N
ote
7)$
$$
$$
$$
Wor
ks In
Pro
gres
s72
7,65
6
7,
351,
331
-
-
-
(6
,436
,521
)
1,64
2,46
6
Tota
l Wor
ks In
Pro
gres
s72
7,65
6
7,
351,
331
-
-
-
(6
,436
,521
)
1,64
2,46
6
Prop
erty
Land
8,51
8,45
5
-
-
-
-
-
8,51
8,45
5
Land
Und
er R
oads
26,1
69,2
70
-
-
-
-
-
26,1
69,2
70
Land
Impr
ovem
ents
6,88
9,78
7
324,
628
-
(565
,338
)
-
1,12
9,61
5
7,77
8,69
2
Build
ings
18,6
40,0
34
-
-
(368
,188
)
-
120,
196
18,3
92,0
42
Tota
l pro
perty
60,2
17,5
46
324,
628
-
(933
,526
)
-
1,24
9,81
1
60,8
58,4
59
Infr
astr
uctu
reRo
ads &
Stre
ets
116,
221,
404
55,5
05
1,82
2,91
6
(2,4
09,6
06)
(81,
542)
2,
590,
364
11
8,19
9,04
1
Br
idge
s26
,771
,637
-
-
(4
69,5
42)
-
1,
608,
117
27
,910
,212
St
orm
wate
r19
,770
,109
85
,408
-
(3
71,3
62)
-
39
2,00
7
19
,876
,162
To
tal i
nfra
stru
ctur
e16
2,76
3,15
0
14
0,91
3
1,
822,
916
(3
,250
,510
)
(8
1,54
2)
4,59
0,48
8
165,
985,
415
Plan
t & E
quip
men
t3,
245,
770
-
-
(6
17,6
72)
(3
9,07
3)
417,
116
3,00
6,14
1
Her
itage
20
,046
-
-
(2
81)
-
-
19
,765
Com
pute
r Sof
twar
e78
,405
-
-
(3
7,21
1)
(2,7
00)
46
,106
84
,600
Valu
atio
ns29
,626
-
-
(2
9,58
6)
(162
)
13
3,00
0
13
2,87
8
Tota
l 22
6,35
4,54
3
46
5,54
1
1,
822,
916
(4
,868
,786
)
(1
23,4
77)
6,43
6,52
1
230,
087,
258
Not
es to
and
form
ing
part
of th
e Fi
nanc
ial R
epor
tPa
ge 1
7 of
40
32. PROPERTY, PLANT AND EQUIPMENT, INFRASTRUCTURE (CONT.)
2019
Opening Balance
Recognition & Acquisition of Assets
RevaluationIncrements / (Decrements)
Depreciation & Amortisation
Written Down Value of Disposals
Transfers Year End Balance
(Note 35) (Note 7)$ $ $ $ $ $ $
Works In Progress727,656 7,351,331 - - - (6,436,521) 1,642,466
Total Works In Progress 727,656 7,351,331 - - - (6,436,521) 1,642,466
PropertyLand 8,518,455 - - - - - 8,518,455 Land Under Roads 26,169,270 - - - - - 26,169,270 Land Improvements 6,889,787 324,628 - (565,338) - 1,129,615 7,778,692 Buildings 18,640,034 - - (368,188) - 120,196 18,392,042 Total property 60,217,546 324,628 - (933,526) - 1,249,811 60,858,459
InfrastructureRoads & Streets 116,221,404 55,505 1,822,916 (2,409,606) (81,542) 2,590,364 118,199,041 Bridges 26,771,637 - - (469,542) - 1,608,117 27,910,212 Stormwater 19,770,109 85,408 - (371,362) - 392,007 19,876,162 Total infrastructure 162,763,150 140,913 1,822,916 (3,250,510) (81,542) 4,590,488 165,985,415
Plant & Equipment 3,245,770 - - (617,672) (39,073) 417,116 3,006,141
Heritage 20,046 - - (281) - - 19,765
Computer Software 78,405 - - (37,211) (2,700) 46,106 84,600
Valuations 29,626 - - (29,586) (162) 133,000 132,878
Total 226,354,543 465,541 1,822,916 (4,868,786) (123,477) 6,436,521 230,087,258
Notes to and forming part of the Financial ReportPage 17 of 40

55
32. PROPERTY, PLAN
T AND
EQUIPM
ENT, IN
FRASTRUCTURE (CON
T.)
2019
Opening
BalanceRecognition &
Acquisition of Assets
RevaluationIncrem
ents / (D
ecrements)
Depreciation &
Am
ortisation W
ritten Dow
n Value of D
isposals
TransfersYear End Balance
(Note 35)
(Note 7)
$$
$$
$$
$W
orks In Progress727,656
7,351,331
-
-
-
(6,436,521)
1,642,466
Total W
orks In Progress727,656
7,351,331
-
-
-
(6,436,521)
1,642,466
PropertyLand
8,518,455
-
-
-
-
-
8,518,455
Land Under Roads26,169,270
-
-
-
-
-
26,169,270
Land Im
provements
6,889,787
324,628
-
(565,338)
-
1,129,615
7,778,692
Buildings18,640,034
-
-
(368,188)
-
120,196
18,392,042
Total property
60,217,546
324,628
-
(933,526)
-
1,249,811
60,858,459
InfrastructureRoads &
Streets116,221,404
55,505
1,822,916
(2,409,606)
(81,542)
2,590,364
118,199,041
Bridges
26,771,637
-
-
(469,542)
-
1,608,117
27,910,212
Stormwater
19,770,109
85,408
-
(371,362)
-
392,007
19,876,162
Total infrastructure162,763,150
140,913
1,822,916
(3,250,510)
(81,542)
4,590,488
165,985,415
Plant & Equipm
ent3,245,770
-
-
(617,672)
(39,073)
417,116
3,006,141
Heritage
20,046
-
-
(281)
-
-
19,765
Computer Softw
are78,405
-
-
(37,211)
(2,700)
46,106
84,600
Valuations29,626
-
-
(29,586)
(162)
133,000
132,878
Total 226,354,543
465,541
1,822,916
(4,868,786)
(123,477)
6,436,521
230,087,258
Notes to and form
ing part of the Financial ReportPage 17 of 40
32. PROPERTY, PLANT AND EQUIPMENT, INFRASTRUCTURE (CONT.)Asset Capitalisation and Maintenance
Road ComponentResealsRoad ShoulderingReconstruction/ConstructionGravel ResheetingSeal PatchingRoad DrainageRoad Drainage (Piped)Road Verge Works
Recognition and Measurement of Assets
Asset Class Threshold ($)Land Nil Land Under Roads Nil Land Improvements 5,000Buildings 5,000Roads and Streets 5,000Bridges 5,000Stormwater 5,000Plant and Equipment 2,000Heritage Assets 2,000Computer Software 2,000
Expensed
Treatment
ExpensedCapitalised or ExpensedCapitalised or Expensed
The cost method of accounting is used for the initial recognition of all asset acquisitions. Cost is determined as the fair value of the assets given as consideration plus costs incidental to the acquisition including architects' fees and engineering design fees and all other costs incurred in getting the assets ready for use.
In determining the cost of Non-Current Assets constructed by Council, "Cost" includes all materials used in construction, direct labour used on the project and an appropriate proportion of overheads. The cost of all materials includes all consulting fees.
Non-monetary assets received in the form of contributions, are recognised as assets and revenues at fair value by Council valuation where that value exceeds the recognition thresholds for the respective asset class. Fair value is the price that would be received to sell the asset in an orderly transaction between market participants at the measurement date.
The following thresholds apply in recognising the acquisition of new assets. Assets valued at less than the specified amounts are charged to the Statement of Comprehensive Income in the year of purchase. When group values have been determined, the threshold applies to the group, not individual assets within that group.
Routine maintenance, repair costs, and minor renewal costs are expensed as incurred. Where the repair relates to the replacement of a component of an asset and the cost exceeds the capitalisation threshold the cost is capitalised and depreciated. The carrying value of the replaced asset is expensed. Officers of the Council determine at the occurrence of an event whether to capitalise/expense expenditure. The following is provided as a guide for roads:
Capitalised or ExpensedExpensedCapitalisedCapitalised
Notes to and forming part of the Financial ReportPage 18 of 40
32. PROPERTY, PLANT AND EQUIPMENT, INFRASTRUCTURE (CONT.)
2019
Opening Balance
Recognition & Acquisition of Assets
RevaluationIncrements / (Decrements)
Depreciation & Amortisation
Written Down Value of Disposals
Transfers Year End Balance
(Note 35) (Note 7)$ $ $ $ $ $ $
Works In Progress727,656 7,351,331 - - - (6,436,521) 1,642,466
Total Works In Progress 727,656 7,351,331 - - - (6,436,521) 1,642,466
PropertyLand 8,518,455 - - - - - 8,518,455 Land Under Roads 26,169,270 - - - - - 26,169,270 Land Improvements 6,889,787 324,628 - (565,338) - 1,129,615 7,778,692 Buildings 18,640,034 - - (368,188) - 120,196 18,392,042 Total property 60,217,546 324,628 - (933,526) - 1,249,811 60,858,459
InfrastructureRoads & Streets 116,221,404 55,505 1,822,916 (2,409,606) (81,542) 2,590,364 118,199,041 Bridges 26,771,637 - - (469,542) - 1,608,117 27,910,212 Stormwater 19,770,109 85,408 - (371,362) - 392,007 19,876,162 Total infrastructure 162,763,150 140,913 1,822,916 (3,250,510) (81,542) 4,590,488 165,985,415
Plant & Equipment 3,245,770 - - (617,672) (39,073) 417,116 3,006,141
Heritage 20,046 - - (281) - - 19,765
Computer Software 78,405 - - (37,211) (2,700) 46,106 84,600
Valuations 29,626 - - (29,586) (162) 133,000 132,878
Total 226,354,543 465,541 1,822,916 (4,868,786) (123,477) 6,436,521 230,087,258
Notes to and forming part of the Financial ReportPage 17 of 40

56
Revaluation of Non-Current Assets
Asset Class Valuation BasisLand Fair ValueLand Under Roads Fair ValueLand Improvements CostBuildings Fair ValuePlant and Equipment CostRoads and Streets Fair ValueStormwater Fair ValueHeritage Assets CostBridges Fair ValueComputer Software Cost
Impairment of Assets
Where the assets are revalued, the revaluation increments are credited directly to the asset revaluation reserve except to the extent that an increment reverses a prior year decrement for that class of asset that had been recognised as an expense in which case the increment is recognised as revenue up to the amount of the expense. Revaluation decrements are recognised as an expense except where prior increments are included in the asset revaluation surplus for that class of asset in which case the decrement is taken to the reserve to the extent of the remaining increments. Within the same class of assets, revaluation increments and decrements within the year are offset.
At each reporting date, Council reviews the carrying value of its assets to determine whether there is any indication that these assets have been impaired. If such an indication exists, the recoverable amount of the asset, being the higher of the asset's fair value less costs to sell and value in use, is compared to the assets carrying value. Any excess of the assets carrying value over its recoverable amount is expensed to the Statement of Comprehensive Income, unless the asset is carried at the revalued amount in which case, the impairment loss is recognised directly against the revaluation reserve in respect of the same class of asset to the extent that the impairment loss does not exceed the amount in the revaluation surplus for that same class of asset.
For non-cash generating assets of Council such as Roads, Stormwater, Buildings and the like, value in use is represented by the deprival value of the asset approximated by its written down replacement cost.
Council has adopted the following valuation bases for its non-current assets:
Subsequent to the initial recognition of assets, non-current physical assets, other than Land Improvements, Plant and Equipment, Heritage and Intangibles, are measured at their fair value in accordance with AASB 116 Property, Plant & Equipment and AASB 13 Fair Value Measurement .
At balance date, Council reviewed the carrying value of the individual classes of assets measured at fair value to ensure that each asset materially approximated its fair value. Where the carrying value materially differed from the fair value at balance date, the class of asset was revalued.
In addition, Council undertakes a formal revaluation of asset classes, measured on the fair value basis on a three-year rolling cycle. The valuation is performed either by experienced Council officers or independent experts. The cost of acquisitions and capital works during the year is considered to represent their fair value.
Fair value valuations are determined in accordance with a valuation hierarchy. Changes to the valuation hierarchy will only occur if an external change in the restrictions or limitations of use on an asset result in changes to the permissible or practical highest and best use of the asset. Further details regarding the fair value hierarchy are disclosed at Note 44 Fair Value Measurement.
Notes to and forming part of the Financial ReportPage 19 of 40

57
Revaluation of Non-Current Assets
Asset Class Valuation BasisLand Fair ValueLand Under Roads Fair ValueLand Improvements CostBuildings Fair ValuePlant and Equipment CostRoads and Streets Fair ValueStormwater Fair ValueHeritage Assets CostBridges Fair ValueComputer Software Cost
Impairment of Assets
Where the assets are revalued, the revaluation increments are credited directly to the asset revaluation reserve except to the extent that an increment reverses a prior year decrement for that class of asset that had been recognised as an expense in which case the increment is recognised as revenue up to the amount of the expense. Revaluation decrements are recognised as an expense except where prior increments are included in the asset revaluation surplus for that class of asset in which case the decrement is taken to the reserve to the extent of the remaining increments. Within the same class of assets, revaluation increments and decrements within the year are offset.
At each reporting date, Council reviews the carrying value of its assets to determine whether there is any indication that these assets have been impaired. If such an indication exists, the recoverable amount of the asset, being the higher of the asset's fair value less costs to sell and value in use, is compared to the assets carrying value. Any excess of the assets carrying value over its recoverable amount is expensed to the Statement of Comprehensive Income, unless the asset is carried at the revalued amount in which case, the impairment loss is recognised directly against the revaluation reserve in respect of the same class of asset to the extent that the impairment loss does not exceed the amount in the revaluation surplus for that same class of asset.
For non-cash generating assets of Council such as Roads, Stormwater, Buildings and the like, value in use is represented by the deprival value of the asset approximated by its written down replacement cost.
Council has adopted the following valuation bases for its non-current assets:
Subsequent to the initial recognition of assets, non-current physical assets, other than Land Improvements, Plant and Equipment, Heritage and Intangibles, are measured at their fair value in accordance with AASB 116 Property, Plant & Equipment and AASB 13 Fair Value Measurement .
At balance date, Council reviewed the carrying value of the individual classes of assets measured at fair value to ensure that each asset materially approximated its fair value. Where the carrying value materially differed from the fair value at balance date, the class of asset was revalued.
In addition, Council undertakes a formal revaluation of asset classes, measured on the fair value basis on a three-year rolling cycle. The valuation is performed either by experienced Council officers or independent experts. The cost of acquisitions and capital works during the year is considered to represent their fair value.
Fair value valuations are determined in accordance with a valuation hierarchy. Changes to the valuation hierarchy will only occur if an external change in the restrictions or limitations of use on an asset result in changes to the permissible or practical highest and best use of the asset. Further details regarding the fair value hierarchy are disclosed at Note 44 Fair Value Measurement.
Notes to and forming part of the Financial ReportPage 19 of 40
Actual Actual2020 2019
$ $33. NON-CURRENT LIABILITIES - Borrowings
Borrowings - Secured 3,600,000 3,600,000
Later than one year and not later than five years 3,600,000 3,600,000 3,600,000 3,600,000
34. NON-CURRENT LIABILITIES - Provisions
Provision for Long Service Leave 243,374 241,403Employee Provisions - oncosts 17,766 17,188Provision for Tip Rehabilitation 4,177,766 4,117,984
4,438,906 4,376,575
Reconciliation of Provision for Tip Rehabilitation
Opening Balance 4,117,984 3,778,271 Unwinding of Discount 54,892 15,086 Reassessment of Estimate 4,890 324,627 Closing Balance 4,177,766 4,117,984
Employee Benefits
The borrowing capacity of Council is limited by the Local Government Act 1993 . Interest bearing liabilities are initially recognised at fair value, net of transaction costs incurred. Subsequent to initial recognition these liabilities are measured at amortised cost. Any difference between the proceeds (net of transaction costs) and the redemption amount is recognised in the Statement of Comprehensive Income over the period of the liability using the effective interest method.
Council is obligated to restore landfill sites to a particular standard. Current engineering projections indicate that the landfill site at Cluan will begin restoration work in 2021-22 and the landfill site at Deloraine will begin restoration work in 2025-26. The forecast life of the landfill sites are based on current estimates of remaining capacity and the forecast rate of infill. The provision for landfill restoration has been calculated based on the present value of the expected cost of works to be undertaken. The expected cost of works have been inflated by the Consumer Price Index (Hobart) 1.31% and discounted by the Indicative Mid Rates of Selected Australian Government Securities. The expected cost of works has been estimated based on current understanding of work required to reinstate the site to a suitable standard. Accordingly, the estimation of the provision required is dependent on the accuracy of the forecast timing of the work, work required and related costs.
AASB 119 Employee Benefits has been applied when calculating and reporting employee entitlements. The bases of measurement of liabilities for each type of employee benefit are as follows:
Interest is expensed as it accrues and no interest has been capitalised during the current or comparative reporting period. There have been no defaults or breaches of the loan agreement during the period. Borrowings are secured by way of mortgages over the general rates of the Council.
As part of the Government’s response to the COVID-19 pandemic, the Treasurer has ensured that all councils have access to sufficient funding. On 15 June 2020 the Treasurer provided explicit support to the Tasmanian Public Finance Corporation for any loans advanced to local government authorities under the Local Government Loans Program. As at 30 June 2020 no borrowings have been required by Council.
Provision for long service leave representing less than 10 years of continuous service measured at present value.
Notes to and forming part of the Financial ReportPage 20 of 40

58
2020 2019Permanent FTE staff 80 80
Casual staff 2 1
35. RESERVES
Opening Balance
Increment / (decrement)
Closing Balance
Asset Revaluation ReserveLand 5,268,459 3,006,262 8,274,721 Buildings 7,917,193 1,218,012 9,135,205 Roads and Streets 49,515,292 - 49,515,292 Bridges 16,692,524 - 16,692,524 Stormwater 10,851,635 972,311 11,823,946
Total Asset Revaluation Reserve 90,245,103 5,196,585 95,441,688
Fair Value ReserveInvestment in Water Corporation 3,904,679 (13,021,159) (9,116,480)
Total Fair Value Reserve 3,904,679 (13,021,159) (9,116,480) 94,149,782 (7,824,574) 86,325,208
Opening Balance
Increment / (decrement)
Closing Balance
Asset Revaluation ReserveLand 5,268,459 - 5,268,459 Buildings 7,917,193 - 7,917,193 Roads and Streets 47,692,376 1,822,916 49,515,292 Bridges 16,692,524 - 16,692,524 Stormwater 10,851,635 - 10,851,635
Total Asset Revaluation Reserve 88,422,187 1,822,916 90,245,103
Fair Value ReserveInvestment in Water Corporation (3,197,502) 7,102,181 3,904,679
Total Fair Value Reserve (3,197,502) 7,102,181 3,904,679 85,224,685 8,925,097 94,149,782
2020
2019
(iv) Number of employees
No accrual is made for sick leave as Council experience indicates that, on average, sick leave taken in each reporting period is less than the entitlement accruing in that period, and this experience is expected to recur in future reporting periods. Council does not make payment for untaken sick leave.
(iii) Superannuation
The superannuation expense for the reporting period is the amount of the statutory contribution the local government makes to the superannuation plan which provides benefits to its employees. Council accounts for its obligations to defined benefit plans on the same basis as its obligations to defined contribution plans i.e as an expense when it becomes payable. Details of those arrangements are set out in Note 38.
The liability for long service leave and annual leave which is not expected to be wholly settled within 12 months after the end of the period in which the employees render the related service is recognised in the provision for employee benefits and measured as the present value of expected future payments to be made in respect of services provided by employees up to the end of the reporting period using the projected unit credit method. Consideration is given to expected future wage and salary levels, experience of employee departures and periods of service. Expected future payments are discounted using market yields at the end of the reporting period on national government bonds with terms to maturity and currency that match, as closely as possible, the estimated future cash outflows.
(ii) Sick Leave
(i) Other Long Term Employee Benefit Obligations
The asset revaluation reserve was established to capture the movements in asset valuations upon the periodic revaluation of Council's assets.
Notes to and forming part of the Financial ReportPage 21 of 40
36. SPECIAL COMMITTEES
The statements include transactions for the following Special Committees:Receipts Payments Net Assets
Birralee Memorial Hall 3,254 2,922 7,285 Bracknell Public Hall & Recreation Ground 1,269 582 10,171 Carrick Community Hall 680 1,456 825 Caveside Recreation Committee 2,600 2,307 13,805 Chudleigh Memorial Hall 12,031 10,778 19,156 Dairy Plains Memorial Hall 3,931 1,477 13,460 Deloraine Community Car 18,052 13,462 26,573 Meander Hall & Recreation Ground 26,000 26,802 30,745 Mole Creek Memorial Hall 3,910 11,456 21,379 Rosevale Memorial Hall & Recreation Ground 2,151 1,108 23,410 Selbourne Memorial Hall 906 2,502 41,146 Weegena Hall 381 183 9,145 Westbury Community Car 5,738 20,866 2,051 Westbury Historical Society 970 1,896 16,749 Westbury Recreation Ground - 599 1,472 Whitemore Recreation Ground 1,041 971 3,245
82,914 99,367 240,617
The balance of net assets forms part of the Cash at Bank balance.
37. COMMITMENTS FOR EXPENDITURE
2020 2019$ $
Capital Expenditure Commitments: Works In ProgressBuildings 178,316 1,217,656 Roads 175,573 695,787 Bridges - 394,118 Stormwater 18,487 83,990 Land Improvements 43,460 61,962
415,836 2,453,513
38. SUPERANNUATION
Net Investment Return 7.0% p.a.Salary Inflation 4.0% p.a.Price Inflation n/a
Council makes superannuation contributions for a number of its employees to the Quadrant Defined Benefits Fund (the Fund), a sub-fund of the Tasplan Superannuation Fund (Tasplan). The Quadrant Defined Benefits Fund has been classified as a multi-employer sponsored plan. As the Fund’s assets and liabilities are pooled and are not allocated by employer, the Actuary is unable to allocate benefit liabilities, assets and costs between employers. As provided under paragraph 34 of AASB 119 Employee Benefits, Council does not use defined benefit accounting for these contributions.
For the year ended 30 June 2020 the Council contributed 0% of employees’ gross income to the Fund. Assets accumulate in the fund to meet member benefits as they accrue, and if assets within the fund are insufficient to satisfy benefits payable, the Council is required to meet its share of the deficiency.
Rice Warner Pty Ltd undertook the last actuarial review of the Fund at 30 June 2017. The review disclosed that at that time the net market value of assets available for funding member benefits was $58,940,000, the value of vested benefits was $51,170,000, the surplus over vested benefits was $7,770,000, the value of total accrued benefits was $50,606,000, and the number of members was 134. These amounts relate to all members of the fund at the date of valuation and no asset or liability is recorded in the Tasplan Super’s financial statements for Council employees.
The financial assumptions used to calculate the Accrued Benefits for the fund were:
2020
Capital expenditure commitments contracted for as at the reporting date and which have not been recognised as liabilities in the Statement of Financial Position are as follows (all commitments due within 12 months).
Notes to and forming part of the Financial ReportPage 22 of 40

59
2020 2019Permanent FTE staff 80 80
Casual staff 2 1
35. RESERVES
Opening Balance
Increment / (decrement)
Closing Balance
Asset Revaluation ReserveLand 5,268,459 3,006,262 8,274,721 Buildings 7,917,193 1,218,012 9,135,205 Roads and Streets 49,515,292 - 49,515,292 Bridges 16,692,524 - 16,692,524 Stormwater 10,851,635 972,311 11,823,946
Total Asset Revaluation Reserve 90,245,103 5,196,585 95,441,688
Fair Value ReserveInvestment in Water Corporation 3,904,679 (13,021,159) (9,116,480)
Total Fair Value Reserve 3,904,679 (13,021,159) (9,116,480) 94,149,782 (7,824,574) 86,325,208
Opening Balance
Increment / (decrement)
Closing Balance
Asset Revaluation ReserveLand 5,268,459 - 5,268,459 Buildings 7,917,193 - 7,917,193 Roads and Streets 47,692,376 1,822,916 49,515,292 Bridges 16,692,524 - 16,692,524 Stormwater 10,851,635 - 10,851,635
Total Asset Revaluation Reserve 88,422,187 1,822,916 90,245,103
Fair Value ReserveInvestment in Water Corporation (3,197,502) 7,102,181 3,904,679
Total Fair Value Reserve (3,197,502) 7,102,181 3,904,679 85,224,685 8,925,097 94,149,782
2020
2019
(iv) Number of employees
No accrual is made for sick leave as Council experience indicates that, on average, sick leave taken in each reporting period is less than the entitlement accruing in that period, and this experience is expected to recur in future reporting periods. Council does not make payment for untaken sick leave.
(iii) Superannuation
The superannuation expense for the reporting period is the amount of the statutory contribution the local government makes to the superannuation plan which provides benefits to its employees. Council accounts for its obligations to defined benefit plans on the same basis as its obligations to defined contribution plans i.e as an expense when it becomes payable. Details of those arrangements are set out in Note 38.
The liability for long service leave and annual leave which is not expected to be wholly settled within 12 months after the end of the period in which the employees render the related service is recognised in the provision for employee benefits and measured as the present value of expected future payments to be made in respect of services provided by employees up to the end of the reporting period using the projected unit credit method. Consideration is given to expected future wage and salary levels, experience of employee departures and periods of service. Expected future payments are discounted using market yields at the end of the reporting period on national government bonds with terms to maturity and currency that match, as closely as possible, the estimated future cash outflows.
(ii) Sick Leave
(i) Other Long Term Employee Benefit Obligations
The asset revaluation reserve was established to capture the movements in asset valuations upon the periodic revaluation of Council's assets.
Notes to and forming part of the Financial ReportPage 21 of 40
36. SPECIAL COMMITTEES
The statements include transactions for the following Special Committees:Receipts Payments Net Assets
Birralee Memorial Hall 3,254 2,922 7,285 Bracknell Public Hall & Recreation Ground 1,269 582 10,171 Carrick Community Hall 680 1,456 825 Caveside Recreation Committee 2,600 2,307 13,805 Chudleigh Memorial Hall 12,031 10,778 19,156 Dairy Plains Memorial Hall 3,931 1,477 13,460 Deloraine Community Car 18,052 13,462 26,573 Meander Hall & Recreation Ground 26,000 26,802 30,745 Mole Creek Memorial Hall 3,910 11,456 21,379 Rosevale Memorial Hall & Recreation Ground 2,151 1,108 23,410 Selbourne Memorial Hall 906 2,502 41,146 Weegena Hall 381 183 9,145 Westbury Community Car 5,738 20,866 2,051 Westbury Historical Society 970 1,896 16,749 Westbury Recreation Ground - 599 1,472 Whitemore Recreation Ground 1,041 971 3,245
82,914 99,367 240,617
The balance of net assets forms part of the Cash at Bank balance.
37. COMMITMENTS FOR EXPENDITURE
2020 2019$ $
Capital Expenditure Commitments: Works In ProgressBuildings 178,316 1,217,656 Roads 175,573 695,787 Bridges - 394,118 Stormwater 18,487 83,990 Land Improvements 43,460 61,962
415,836 2,453,513
38. SUPERANNUATION
Net Investment Return 7.0% p.a.Salary Inflation 4.0% p.a.Price Inflation n/a
Council makes superannuation contributions for a number of its employees to the Quadrant Defined Benefits Fund (the Fund), a sub-fund of the Tasplan Superannuation Fund (Tasplan). The Quadrant Defined Benefits Fund has been classified as a multi-employer sponsored plan. As the Fund’s assets and liabilities are pooled and are not allocated by employer, the Actuary is unable to allocate benefit liabilities, assets and costs between employers. As provided under paragraph 34 of AASB 119 Employee Benefits, Council does not use defined benefit accounting for these contributions.
For the year ended 30 June 2020 the Council contributed 0% of employees’ gross income to the Fund. Assets accumulate in the fund to meet member benefits as they accrue, and if assets within the fund are insufficient to satisfy benefits payable, the Council is required to meet its share of the deficiency.
Rice Warner Pty Ltd undertook the last actuarial review of the Fund at 30 June 2017. The review disclosed that at that time the net market value of assets available for funding member benefits was $58,940,000, the value of vested benefits was $51,170,000, the surplus over vested benefits was $7,770,000, the value of total accrued benefits was $50,606,000, and the number of members was 134. These amounts relate to all members of the fund at the date of valuation and no asset or liability is recorded in the Tasplan Super’s financial statements for Council employees.
The financial assumptions used to calculate the Accrued Benefits for the fund were:
2020
Capital expenditure commitments contracted for as at the reporting date and which have not been recognised as liabilities in the Statement of Financial Position are as follows (all commitments due within 12 months).
Notes to and forming part of the Financial ReportPage 22 of 40
60
The Actuary will continue to undertake a brief review of the financial position the Fund at the end of each financial year to confirm that the contribution rates remain appropriate. The next full triennial actuarial review of the Fund will have an effective date of 30 June 2020 and is expected to be completed late in 2020.
As required in terms of paragraph 148 of AASB 119 Employee Benefits, Council discloses the following details:
The 2017 actuarial review used the “aggregate” funding method. This is a standard actuarial funding method. The results from this method were tested by projecting future fund assets and liabilities for a range of future assumed investment returns. The funding method used is consistent with the method used at the previous actuarial review in 2014. Under the aggregate funding method of financing the benefits, the stability of the Councils’ contributions over time depends on how closely the Fund’s actual experience matches the expected experience. If the actual experience differs from that expected, the Councils’ contribution rate may need to be adjusted accordingly to ensure the Fund remains on course towards financing members’ benefits.
Council also contributes to other accumulation schemes on behalf of a number of employees; however the Council has no ongoing responsibility to make good any deficiencies that may occur in those schemes. During the year Council made the required superannuation contributions for all eligible employees to an appropriate complying superannuation fund as required by the Superannuation Guarantee (Administration) Act 1992.
Given the strong financial position of the Fund, the Actuary recommended that the Council consider a contribution holiday and contribute 0% of salaries from 1 July 2018 to 30 June 2021.
The actuarial review concluded that:
The value of assets of the Fund was adequate to meet the liabilities of the Fund in respect of vested benefits as at 30 June 2017.The value of assets of the Fund was adequate to meet the value of the liabilities of the Fund in respect of accrued benefits as at 30 June 2017.Based on the assumptions used, and assuming the Employer contributes at the levels described below, the value of the assets is expected to continue to be adequate to meet the value of the liabilities of the Fund in respect of vested benefits at all times during the period up to 30 June 2017.
In terms of Rule 27.4 of the Tasplan Trust Deed (Trust Deed), there is a risk that employers within the Fund may incur an additional liability when an Employer ceases to participate in the Fund at a time when the assets of the Fund are less than members’ vested benefits. Each member of the Fund who is an employee of the Employer who is ceasing to Participate is required to be provided with a benefit at least equal to their vested benefit in terms of Rule 27.4 (b) (A). However, there is no provision in the Trust Deed requiring an employer to make contributions other than its regular contributions up to the date of cessation of contributions. This issue can be resolved by the Trustee seeking an Actuarial Certificate in terms of Rule 26.5 identifying a deficit and the Trustee determining in terms of Rule 26.3(c) that the particular employer should make the payment required to make good any shortfall before the cessation of participation is approved.
The application of Fund assets on Tasplan being wound-up is set out in Rule 41.4. This Rule provides that expenses and taxation liabilities should have first call on the available assets. Additional assets will initially be applied for the benefit of the then remaining members and/or their Dependants in such manner as the Trustee considers equitable and appropriate in accordance with the Applicable Requirements (broadly, superannuation and taxation legislative requirements and other requirements as determined by the regulators). The Trust Deed does not contemplate the Fund withdrawing from Tasplan. However it is likely that Rule 27.4 would be applied in this case (as detailed above).
The Fund is a defined benefit Fund.
The Quadrant Defined Benefits Fund has been classified as a multi-employer sponsored plan. As the Fund’s assets and liabilities are pooled and are not allocated by employer, the Actuary is unable to allocate benefit liabilities, assets and costs between employers. Thus the Fund is not able to prepare standard AASB119 defined benefit reporting.
During the reporting period the amount of contributions paid to defined benefits schemes was Nil, (2018-19: Nil) due to the contribution holiday as prescribed by Tasplan, and the amount paid to accumulation schemes was $714,031 (2018-19: $734,302).
Notes to and forming part of the Financial ReportPage 23 of 40
Actual Actual2020 2019
$ $39. RECONCILIATION OF SURPLUS/ (DEFICIT) FOR THE PERIOD TO NET CASH INFLOW FROM OPERATING ACTIVITIES
Net Surplus/(Deficit) 3,475,546 3,156,497
Items not involving CashSubdivisions Taken Over (638,576) (140,914) Interest Accrued on Receivables (60,070) (55,941) Depreciation and Amortisation Expense 5,068,152 4,868,786 Adjustment for Prior Year Rates Received in Advance (225,173) -
4,144,333 4,671,931 Investing Activity
(Profit)/Loss on Disposal of Assets (296,114) 70,387 Proceeds from Capital Grants (2,059,185) (2,083,194) Proceeds from Capital Contributions (13,119) (16,905)
Changes in Operating Assets and Liabilities(Increase)/Decrease in Receivables 15,946 (235,644) (Increase)/Decrease in Inventories 10,797 (12,535) (Increase)/Decrease in Accrued Revenue 89,099 (7,600) Increase/(Decrease) in Payables (208,612) 333,012 Increase/(Decrease) in Provisions 63,020 141,472 Increase/(Decrease) in Contract Liabilities 347,834 -
318,084 218,705
Net Cash Inflow from Operating Activities 5,569,545 6,017,421
40. CREDIT STANDBY ARRANGEMENTS
Council has a Direct Debit Facility with the Commonwealth Bank with a $50,000 limit (2018-19: $50,000).Council has Business Cards with a limit of $55,000 (2018-19: $55,000). The balance is cleared monthly.There were no other credit standby arrangements or unused loan facilities at 30 June 2020.
As at 30 June 2019 the fund had 107 members and the total employer contributions and member contributions for the year ending 30 June 2019 were $1,000,322 and $221,484 respectively.
During the next reporting period the expected amount of contributions to be paid to defined benefits schemes is Nil, due to the contribution holiday as prescribed by Tasplan. The amount to be paid to accumulation schemes is $790,600.
An analysis of the assets and vested benefits of sub-funds participating in the Scheme, prepared by Rice Warner Pty Ltd as at 30 June 2019, showed that the Fund had assets of $56.64 million and members’ Vested Benefits were $47.32 million. These amounts represented 0.6% and 0.5% respectively of the corresponding total amounts for Tasplan.
As reported above, Assets exceeded accrued benefits as at the date of the last actuarial review, 30 June 2017. Moderate investment returns, since that date, make it quite probable that this is still the position. The financial position of the Fund will be fully investigated at the actuarial review as at 30 June 2020.
Notes to and forming part of the Financial ReportPage 24 of 40

61
The Actuary will continue to undertake a brief review of the financial position the Fund at the end of each financial year to confirm that the contribution rates remain appropriate. The next full triennial actuarial review of the Fund will have an effective date of 30 June 2020 and is expected to be completed late in 2020.
As required in terms of paragraph 148 of AASB 119 Employee Benefits, Council discloses the following details:
The 2017 actuarial review used the “aggregate” funding method. This is a standard actuarial funding method. The results from this method were tested by projecting future fund assets and liabilities for a range of future assumed investment returns. The funding method used is consistent with the method used at the previous actuarial review in 2014. Under the aggregate funding method of financing the benefits, the stability of the Councils’ contributions over time depends on how closely the Fund’s actual experience matches the expected experience. If the actual experience differs from that expected, the Councils’ contribution rate may need to be adjusted accordingly to ensure the Fund remains on course towards financing members’ benefits.
Council also contributes to other accumulation schemes on behalf of a number of employees; however the Council has no ongoing responsibility to make good any deficiencies that may occur in those schemes. During the year Council made the required superannuation contributions for all eligible employees to an appropriate complying superannuation fund as required by the Superannuation Guarantee (Administration) Act 1992.
Given the strong financial position of the Fund, the Actuary recommended that the Council consider a contribution holiday and contribute 0% of salaries from 1 July 2018 to 30 June 2021.
The actuarial review concluded that:
The value of assets of the Fund was adequate to meet the liabilities of the Fund in respect of vested benefits as at 30 June 2017.The value of assets of the Fund was adequate to meet the value of the liabilities of the Fund in respect of accrued benefits as at 30 June 2017.Based on the assumptions used, and assuming the Employer contributes at the levels described below, the value of the assets is expected to continue to be adequate to meet the value of the liabilities of the Fund in respect of vested benefits at all times during the period up to 30 June 2017.
In terms of Rule 27.4 of the Tasplan Trust Deed (Trust Deed), there is a risk that employers within the Fund may incur an additional liability when an Employer ceases to participate in the Fund at a time when the assets of the Fund are less than members’ vested benefits. Each member of the Fund who is an employee of the Employer who is ceasing to Participate is required to be provided with a benefit at least equal to their vested benefit in terms of Rule 27.4 (b) (A). However, there is no provision in the Trust Deed requiring an employer to make contributions other than its regular contributions up to the date of cessation of contributions. This issue can be resolved by the Trustee seeking an Actuarial Certificate in terms of Rule 26.5 identifying a deficit and the Trustee determining in terms of Rule 26.3(c) that the particular employer should make the payment required to make good any shortfall before the cessation of participation is approved.
The application of Fund assets on Tasplan being wound-up is set out in Rule 41.4. This Rule provides that expenses and taxation liabilities should have first call on the available assets. Additional assets will initially be applied for the benefit of the then remaining members and/or their Dependants in such manner as the Trustee considers equitable and appropriate in accordance with the Applicable Requirements (broadly, superannuation and taxation legislative requirements and other requirements as determined by the regulators). The Trust Deed does not contemplate the Fund withdrawing from Tasplan. However it is likely that Rule 27.4 would be applied in this case (as detailed above).
The Fund is a defined benefit Fund.
The Quadrant Defined Benefits Fund has been classified as a multi-employer sponsored plan. As the Fund’s assets and liabilities are pooled and are not allocated by employer, the Actuary is unable to allocate benefit liabilities, assets and costs between employers. Thus the Fund is not able to prepare standard AASB119 defined benefit reporting.
During the reporting period the amount of contributions paid to defined benefits schemes was Nil, (2018-19: Nil) due to the contribution holiday as prescribed by Tasplan, and the amount paid to accumulation schemes was $714,031 (2018-19: $734,302).
Notes to and forming part of the Financial ReportPage 23 of 40
Actual Actual2020 2019
$ $39. RECONCILIATION OF SURPLUS/ (DEFICIT) FOR THE PERIOD TO NET CASH INFLOW FROM OPERATING ACTIVITIES
Net Surplus/(Deficit) 3,475,546 3,156,497
Items not involving CashSubdivisions Taken Over (638,576) (140,914) Interest Accrued on Receivables (60,070) (55,941) Depreciation and Amortisation Expense 5,068,152 4,868,786 Adjustment for Prior Year Rates Received in Advance (225,173) -
4,144,333 4,671,931 Investing Activity
(Profit)/Loss on Disposal of Assets (296,114) 70,387 Proceeds from Capital Grants (2,059,185) (2,083,194) Proceeds from Capital Contributions (13,119) (16,905)
Changes in Operating Assets and Liabilities(Increase)/Decrease in Receivables 15,946 (235,644) (Increase)/Decrease in Inventories 10,797 (12,535) (Increase)/Decrease in Accrued Revenue 89,099 (7,600) Increase/(Decrease) in Payables (208,612) 333,012 Increase/(Decrease) in Provisions 63,020 141,472 Increase/(Decrease) in Contract Liabilities 347,834 -
318,084 218,705
Net Cash Inflow from Operating Activities 5,569,545 6,017,421
40. CREDIT STANDBY ARRANGEMENTS
Council has a Direct Debit Facility with the Commonwealth Bank with a $50,000 limit (2018-19: $50,000).Council has Business Cards with a limit of $55,000 (2018-19: $55,000). The balance is cleared monthly.There were no other credit standby arrangements or unused loan facilities at 30 June 2020.
As at 30 June 2019 the fund had 107 members and the total employer contributions and member contributions for the year ending 30 June 2019 were $1,000,322 and $221,484 respectively.
During the next reporting period the expected amount of contributions to be paid to defined benefits schemes is Nil, due to the contribution holiday as prescribed by Tasplan. The amount to be paid to accumulation schemes is $790,600.
An analysis of the assets and vested benefits of sub-funds participating in the Scheme, prepared by Rice Warner Pty Ltd as at 30 June 2019, showed that the Fund had assets of $56.64 million and members’ Vested Benefits were $47.32 million. These amounts represented 0.6% and 0.5% respectively of the corresponding total amounts for Tasplan.
As reported above, Assets exceeded accrued benefits as at the date of the last actuarial review, 30 June 2017. Moderate investment returns, since that date, make it quite probable that this is still the position. The financial position of the Fund will be fully investigated at the actuarial review as at 30 June 2020.
Notes to and forming part of the Financial ReportPage 24 of 40

62
41. RELATED PARTY DISCLOSURES
(a) Councillor Remuneration2020
Allowances Vehicles2
Total Compensation
AASB 124Expenses
Total allowances and expenses
section 72$ $ $ $ $
Mayor 53,824 2,548 56,372 963 57,335 Deputy Mayor 29,987 - 29,987 481 30,468 Councillors 107,653 - 107,653 3,877 111,530
Total 191,464 2,548 194,012 5,321 199,333
2019
Allowances Vehicles2
Total Compensation
AASB 124Expenses
Total allowances and expenses
section 72$ $ $ $ $
Mayor 52,566 862 53,428 2,614 56,042 Deputy Mayor 29,286 - 29,286 317 29,603 Councillors 104,498 - 104,498 8,945 113,443
Total 186,350 862 187,212 11,876 199,088
(b) Key Management Personnel Remuneration
2020
Remuneration bandNumber of employees6 Salary1 Vehicles2
Super-annuation3
Termination Benefits4
Non-monetary Benefits5
Total
$ $ $ $ $ $
$20 001 - $40 000 1 71,720 1,178 6,391 - (39,294) 39,995 $100 001 - $120 000 1 75,479 5,153 9,812 - 11,345 101,789 $180 001 - $200 000 3 482,134 19,229 62,194 - 24,389 587,946 $200 001 - $220 000 1 158,721 6,927 20,515 - 14,530 200,693
Sub-total 788,054 32,487 98,912 - 10,970 930,423 Acting arrangements
$40 001 - $60 000 1 37,306 - 4,850 - 4,075 46,231 Sub-total 37,306 - 4,850 - 4,075 46,231 Total 825,360 32,487 103,762 - 15,045 976,654
2019
Remuneration bandNumber of employees6 Salary1 Vehicles2
Super-annuation3
Termination Benefits4
Non-monetary Benefits5
Total
$ $ $ $ $ $
$160 001 - $180 000 2 297,330 11,221 38,333 - 8,215 355,099 $180 001 - $200 000 2 296,711 16,040 38,298 - 20,303 371,352 $220 001 - $240 000 1 182,608 5,382 23,594 - 10,518 222,102
Total 776,649 32,643 100,225 - 39,036 948,553
Post employment benefits
Post employment benefits
Short term employee benefits
Short term employee benefits
1 Gross Salary includes all forms of consideration paid and payable for services rendered, compensated absences during the period and salary sacrifice 2 Includes total cost of providing and maintaining vehicles provided for private use, including registration, insurance, fuel and other consumables, maintenance cost and parking (including notional value of parking provided at premises that are owned or leased and fringe benefits tax).3 Superannuation means the contribution to the superannuation fund of the individual.
5 Non-monetary benefits include annual and long service leave movements.
4 Termination benefits include all forms of benefit paid or accrued as a consequence of termination.
6 Number of employees inlcudes total number of employees that held a Key Management Personnel position during the financial year.
Section 72(1)(cd) of the Local Government Act 1993 requires Council to report the total annual remuneration paid to employees of the Council who hold positions designated by the Council as being senior positions. The Council has determined that Senior Positions comprise Director and General Manager positions.
Notes to and forming part of the Financial ReportPage 25 of 40

63
41. RELATED PARTY DISCLOSURES
(a) Councillor Remuneration2020
Allowances Vehicles2
Total Compensation
AASB 124Expenses
Total allowances and expenses
section 72$ $ $ $ $
Mayor 53,824 2,548 56,372 963 57,335 Deputy Mayor 29,987 - 29,987 481 30,468 Councillors 107,653 - 107,653 3,877 111,530
Total 191,464 2,548 194,012 5,321 199,333
2019
Allowances Vehicles2
Total Compensation
AASB 124Expenses
Total allowances and expenses
section 72$ $ $ $ $
Mayor 52,566 862 53,428 2,614 56,042 Deputy Mayor 29,286 - 29,286 317 29,603 Councillors 104,498 - 104,498 8,945 113,443
Total 186,350 862 187,212 11,876 199,088
(b) Key Management Personnel Remuneration
2020
Remuneration bandNumber of employees6 Salary1 Vehicles2
Super-annuation3
Termination Benefits4
Non-monetary Benefits5
Total
$ $ $ $ $ $
$20 001 - $40 000 1 71,720 1,178 6,391 - (39,294) 39,995 $100 001 - $120 000 1 75,479 5,153 9,812 - 11,345 101,789 $180 001 - $200 000 3 482,134 19,229 62,194 - 24,389 587,946 $200 001 - $220 000 1 158,721 6,927 20,515 - 14,530 200,693
Sub-total 788,054 32,487 98,912 - 10,970 930,423 Acting arrangements
$40 001 - $60 000 1 37,306 - 4,850 - 4,075 46,231 Sub-total 37,306 - 4,850 - 4,075 46,231 Total 825,360 32,487 103,762 - 15,045 976,654
2019
Remuneration bandNumber of employees6 Salary1 Vehicles2
Super-annuation3
Termination Benefits4
Non-monetary Benefits5
Total
$ $ $ $ $ $
$160 001 - $180 000 2 297,330 11,221 38,333 - 8,215 355,099 $180 001 - $200 000 2 296,711 16,040 38,298 - 20,303 371,352 $220 001 - $240 000 1 182,608 5,382 23,594 - 10,518 222,102
Total 776,649 32,643 100,225 - 39,036 948,553
Post employment benefits
Post employment benefits
Short term employee benefits
Short term employee benefits
1 Gross Salary includes all forms of consideration paid and payable for services rendered, compensated absences during the period and salary sacrifice 2 Includes total cost of providing and maintaining vehicles provided for private use, including registration, insurance, fuel and other consumables, maintenance cost and parking (including notional value of parking provided at premises that are owned or leased and fringe benefits tax).3 Superannuation means the contribution to the superannuation fund of the individual.
5 Non-monetary benefits include annual and long service leave movements.
4 Termination benefits include all forms of benefit paid or accrued as a consequence of termination.
6 Number of employees inlcudes total number of employees that held a Key Management Personnel position during the financial year.
Section 72(1)(cd) of the Local Government Act 1993 requires Council to report the total annual remuneration paid to employees of the Council who hold positions designated by the Council as being senior positions. The Council has determined that Senior Positions comprise Director and General Manager positions.
Notes to and forming part of the Financial ReportPage 25 of 40

64
42. FINANCIAL INSTRUMENTS
(a)
Financial Instruments
Note Accounting Policy
11
13
12
12
19
15
33
Cash on hand and at bank and in cashmanagement accounts are valued at facevalue.
Interest is recognised as it accrues.
Investments and bills are valued at cost.
Receivables are carried at amortised costusing the effective interest method. Aprovision for doubtful debts is recognisedwhen there is objective evidence that animpairment loss has occurred. Collectability ofoverdue accounts is assessed on an ongoingbasis.
General debtors are unsecured and arrears donot attract interest. Debtors are required tosettle within 14 days of issue of the account.
Trade and Other Payables
Accounting Policy, terms and conditions
Financial Assets
Receivables - Loans
Receivables - Rate Debtors
Financial Liabilities
Loans are carried at their principal amounts,which represent the present value of futureassociated cash flows. Interest is accrued overthe period it becomes due and recognised aspart of receivables.
Liabilities are recognised for amounts to bepaid in the future for goods and servicesprovided to Council as at balance datewhether or not invoices have been received.
Loans are carried at their principal amounts, which represent the present value of future cash flows associated with servicing the debt. Interest is accrued over the period it becomes due and recognised as part of payables.
Terms and Conditions
Interest-Bearing Loans and Borrowings
Loans are secured by way of mortgages overthe property titles.The fixed interest rates on loans receivable arebetween 3.94% and 7.07%.
General Creditors are unsecured, not subjectto interest charges and are normally settledwithin 30 days of invoice receipt.
Borrowings are secured by way of mortgages over the general rates of the Council.The fixed interest rate on borrowings is 5.87%.
Receivables - Other Debtors
Investments are held to maximise interestreturns of surplus cash.
Interest revenues are recognised as theyaccrue. Investments are held to maximiseinterest returns of surplus cash.
An impairment loss is not recognised on ratesreceivable.
On call deposits returned floating interestrates between 0% (2018-19: 0%) and 1.75%(2018-19: 2.00%). The interest rate at balancedate was 0%-0.75% (2018-19: 0%-1.50%).
Term Deposits returned fixed interest rates ofbetween 1.45% (2018-19: 2.05%), and 2.95%(2018-19: 2.95%) net of fees. Funds returned aweighted average interest rate of 2.10% (2018-19: 2.66%).
Unpaid rates represent a charge against theratable property that will be recovered whenthe property is next sold. Arrears attractinterest of 8.10% (2018-19: 8.81%).
Cash and Cash Equivalents
Term Deposits
Notes to and forming part of the Financial ReportPage 27 of 40

65
42. FINANCIAL INSTRUMENTS
(a)
Financial Instruments
Note Accounting Policy
11
13
12
12
19
15
33
Cash on hand and at bank and in cashmanagement accounts are valued at facevalue.
Interest is recognised as it accrues.
Investments and bills are valued at cost.
Receivables are carried at amortised costusing the effective interest method. Aprovision for doubtful debts is recognisedwhen there is objective evidence that animpairment loss has occurred. Collectability ofoverdue accounts is assessed on an ongoingbasis.
General debtors are unsecured and arrears donot attract interest. Debtors are required tosettle within 14 days of issue of the account.
Trade and Other Payables
Accounting Policy, terms and conditions
Financial Assets
Receivables - Loans
Receivables - Rate Debtors
Financial Liabilities
Loans are carried at their principal amounts,which represent the present value of futureassociated cash flows. Interest is accrued overthe period it becomes due and recognised aspart of receivables.
Liabilities are recognised for amounts to bepaid in the future for goods and servicesprovided to Council as at balance datewhether or not invoices have been received.
Loans are carried at their principal amounts, which represent the present value of future cash flows associated with servicing the debt. Interest is accrued over the period it becomes due and recognised as part of payables.
Terms and Conditions
Interest-Bearing Loans and Borrowings
Loans are secured by way of mortgages overthe property titles.The fixed interest rates on loans receivable arebetween 3.94% and 7.07%.
General Creditors are unsecured, not subjectto interest charges and are normally settledwithin 30 days of invoice receipt.
Borrowings are secured by way of mortgages over the general rates of the Council.The fixed interest rate on borrowings is 5.87%.
Receivables - Other Debtors
Investments are held to maximise interestreturns of surplus cash.
Interest revenues are recognised as theyaccrue. Investments are held to maximiseinterest returns of surplus cash.
An impairment loss is not recognised on ratesreceivable.
On call deposits returned floating interestrates between 0% (2018-19: 0%) and 1.75%(2018-19: 2.00%). The interest rate at balancedate was 0%-0.75% (2018-19: 0%-1.50%).
Term Deposits returned fixed interest rates ofbetween 1.45% (2018-19: 2.05%), and 2.95%(2018-19: 2.95%) net of fees. Funds returned aweighted average interest rate of 2.10% (2018-19: 2.66%).
Unpaid rates represent a charge against theratable property that will be recovered whenthe property is next sold. Arrears attractinterest of 8.10% (2018-19: 8.81%).
Cash and Cash Equivalents
Term Deposits
Notes to and forming part of the Financial ReportPage 27 of 40
(b)
2020
Floating Interest Rate
Under 1 Year
1-5Years
Over 5 Years
Non-Interest Bearing
Total
$ $ $ $ $ $ Financial AssetsCash and Cash Equivalents 3,113,229 - - - 1,450 3,114,679 Investments - 18,469,868 - - - 18,469,868 Rates Receivable - 727,951 - - - 727,951 Loans, Trade and Other Receivables - - 4,421,800 265,087 230,788 4,917,675 Accrued Revenue - - - - 114,749 114,749 Investment in Water Corporation - - - - 42,570,596 42,570,596 Total Financial Assets 3,113,229 19,197,819 4,421,800 265,087 42,917,583 69,915,518
Financial LiabilitiesTrade and other payables - - - - 1,395,206 1,395,206 Trust funds and deposits - - - - - - Borrowings - - 3,600,000 - - 3,600,000 Total Financial Liabilities - - 3,600,000 - 1,395,206 4,995,206
Net Financial Assets (Liabilities) 3,113,229 19,197,819 821,800 265,087 41,522,377 64,920,312
2019
Floating Interest Rate
Under 1 Year
1-5Years
Over 5 Years
Non-Interest Bearing
Total
$ $ $ $ $ $ Financial AssetsCash and Cash Equivalents 3,386,167 - - - 1,450 3,387,617 Investments - 21,254,466 - - - 21,254,466 Rates Receivable - 643,473 - - - 643,473 Loans, Trade and Other Receivables - - 4,365,716 261,100 331,212 4,958,028 Accrued Revenue - - - - 203,848 203,848 Investment in Water Corporation - - - - 55,591,755 55,591,755 Total Financial Assets 3,386,167 21,897,939 4,365,716 261,100 56,128,265 86,039,187
Financial LiabilitiesTrade and other payables - - - - 1,603,818 1,603,818 Trust funds and deposits - - - - - Borrowings - - 3,600,000 - - 3,600,000 Total Financial Liabilities - - 3,600,000 - 1,603,818 5,203,818
Net Financial Assets (Liabilities) 3,386,167 21,897,939 765,716 261,100 54,524,447 80,835,369
Interest Rate Risk
The exposure to interest rate risk of financial assets and financial liabilities, both recognised and unrecognised, atbalance date are as follows:
Fixed Interest Maturing in:
Fixed Interest Maturing in:
Notes to and forming part of the Financial ReportPage 28 of 40

66
(c)
Financial InstrumentsCarrying Amount
Net Fair Value
Carrying Amount
Net Fair Value
$ $ $ $Financial AssetsCash and Cash Equivalents 3,114,679 3,114,679 3,387,617 3,387,617 Term Deposits: Maturity > 3 months 18,469,868 18,469,868 21,254,466 21,254,466 Trade and Other receivables 5,645,626 5,645,626 5,601,501 5,601,501 Accrued Revenue 114,749 114,749 203,848 203,848 Investment in Water Corporation 42,570,596 42,570,596 55,591,755 55,591,755 Total Financial Assets 69,915,518 69,915,518 86,039,187 86,039,187 Financial LiabilitiesTrade and Other payables 1,395,206 1,395,206 1,603,818 1,603,818 Borrowings 3,600,000 4,072,752 3,600,000 4,096,692 Total Financial Liabilities 4,995,206 5,467,958 5,203,818 5,700,510 Net Financial Assets 64,920,312 64,447,560 80,835,369 80,338,677
(d) Credit Risk
(e) Risks and mitigation
Market risk
Interest rate risk
- diversification by credit rating, financial institution and investment product, - monitoring of return on investment,
Maturity will be staggered to provide for interest rate variations and to minimise interest rate risk.
- benchmarking of returns and comparison with budget.
- reducing risks of refinancing by managing in accordance with target maturity profiles; and - setting prudential limits on interest repayments as a percentage of rate revenue.
- conformity with State and Federal regulations and standards, - capital protection, - appropriate liquidity,
Net Fair Values
30 June 201930 June 2020
- ensuring access to diverse sources of funding;
We manage the interest rate exposure on our debt portfolio by appropriate budgeting strategies and obtaining approval for borrowings from the Department of Treasury and Finance each year.
Investment of surplus funds is made with approved financial institutions under the Local Government Act 1993 . We manage interest rate risk by adopting an investment policy that ensures:
The aggregate net fair values of financial assets and financial liabilities, both recognised and unrecognised, at balance date are as follows:
The maximum exposure to credit risk at balance date in relation to each class of recognised financial asset is represented by the carrying amount of those assets as indicated in the Statement of Financial Position.
The risks associated with our main financial instruments and our policies for minimising these risks are detailed below.
Market risk is the risk that the fair value or future cash flows of our financial instruments will fluctuate because of changes in market prices. Council's exposures to market risk are primarily through interest rate risk with only insignificant exposure to other price risks and no exposure to foreign currency risk. Components of market risk to which we are exposed are discussed below.
Interest rate risk refers to the risk that the value of a financial instrument, or cash flows associated with the instrument, will fluctuate due to changes in market interest rates. Interest rate risk arises from interest bearing financial assets and liabilities that we use. Non derivative interest bearing assets are predominantly short term liquid assets. Our interest rate liability risk arises primarily from long term loans and borrowings at fixed rates which exposes us to fair value interest rate risk.
Our loan borrowings are sourced from Tascorp. We manage interest rate risk on our net debt portfolio by:
Notes to and forming part of the Financial ReportPage 29 of 40
Credit risk
Ageing of Trade and Other Receivables
2020 2019$ $
Current (not yet due) 4,905,947 4,936,153 Past due by up to 30 days (154) 4,651 Past due between 31 and 180 days 1,978 12,336 Past due between 181 and 365 days 5,707 4,033 Past due by more than 1 year 4,197 855 Total Trade Receivables 4,917,675 4,958,028 Rates Receivable 727,951 643,473 Total Trade & Other Receivables 5,645,626 5,601,501
Ageing of individually impaired Trade and Other Receivables
Liquidity risk
Credit risk arises from Council's financial assets, which comprise cash and cash equivalents, and trade and other receivables. Council's exposure to credit risk arises from potential default of the counterparty, with a maximum exposure equal to the carrying amount of these instruments. Exposure at balance date is addressed in each applicable note. Council generally trades with recognised, creditworthy third parties, and as such collateral is generally not requested, nor is it Council's policy to securitise its trade and other receivables. It is Council's policy that some customers who wish to trade on credit terms are subject to credit verification procedures including an assessment of their credit rating, financial position, past experience and industry reputation. In addition, receivable balance are monitored on an ongoing basis with the result that Council's exposure to bad debts is not significant.
At balance date no debtors were impaired. Some of the long outstanding past due amounts have been lodged with Council's debt collectors or are on payment arrangements.
At balance date other debtors representing financial assets were past due but not impaired. These amounts relate to a number of independent customers for whom there is no recent history of default. The ageing of the Council's Trade & Other Receivables was:
- we may be unable to settle or recover a financial assets at all. - we will be forced to sell financial assets at a value which is less than what they are worth; or
To help reduce these risks we: - have readily accessible standby facilities and other funding arrangements in place; and
We may also be subject to credit risk for transactions which are not included in the Statement of Financial Position, such as when we provide a guarantee for another party.
Credit risk is the risk that a contracting entity will not complete its obligations under a financial instrument and cause Council to make a financial loss. Council have exposure to credit risk on some financial assets included in our Statement of Financial Position. To help manage this risk:
- we have a policy for establishing credit limits for the entities we deal with; - we may require collateral where appropriate; and - we only invest surplus funds with financial institutions per our Investment policy.
The Councils exposure to liquidity risk is deemed insignificant based on prior periods' data and current assessment of risk.
- monitor budget to actual performance on a regular basis.
Liquidity risk includes the risk that, as a result of our operational liquidity requirements: - we will not have sufficient funds to settle a transaction on the date;
Notes to and forming part of the Financial ReportPage 30 of 40

67
(c)
Financial InstrumentsCarrying Amount
Net Fair Value
Carrying Amount
Net Fair Value
$ $ $ $Financial AssetsCash and Cash Equivalents 3,114,679 3,114,679 3,387,617 3,387,617 Term Deposits: Maturity > 3 months 18,469,868 18,469,868 21,254,466 21,254,466 Trade and Other receivables 5,645,626 5,645,626 5,601,501 5,601,501 Accrued Revenue 114,749 114,749 203,848 203,848 Investment in Water Corporation 42,570,596 42,570,596 55,591,755 55,591,755 Total Financial Assets 69,915,518 69,915,518 86,039,187 86,039,187 Financial LiabilitiesTrade and Other payables 1,395,206 1,395,206 1,603,818 1,603,818 Borrowings 3,600,000 4,072,752 3,600,000 4,096,692 Total Financial Liabilities 4,995,206 5,467,958 5,203,818 5,700,510 Net Financial Assets 64,920,312 64,447,560 80,835,369 80,338,677
(d) Credit Risk
(e) Risks and mitigation
Market risk
Interest rate risk
- diversification by credit rating, financial institution and investment product, - monitoring of return on investment,
Maturity will be staggered to provide for interest rate variations and to minimise interest rate risk.
- benchmarking of returns and comparison with budget.
- reducing risks of refinancing by managing in accordance with target maturity profiles; and - setting prudential limits on interest repayments as a percentage of rate revenue.
- conformity with State and Federal regulations and standards, - capital protection, - appropriate liquidity,
Net Fair Values
30 June 201930 June 2020
- ensuring access to diverse sources of funding;
We manage the interest rate exposure on our debt portfolio by appropriate budgeting strategies and obtaining approval for borrowings from the Department of Treasury and Finance each year.
Investment of surplus funds is made with approved financial institutions under the Local Government Act 1993 . We manage interest rate risk by adopting an investment policy that ensures:
The aggregate net fair values of financial assets and financial liabilities, both recognised and unrecognised, at balance date are as follows:
The maximum exposure to credit risk at balance date in relation to each class of recognised financial asset is represented by the carrying amount of those assets as indicated in the Statement of Financial Position.
The risks associated with our main financial instruments and our policies for minimising these risks are detailed below.
Market risk is the risk that the fair value or future cash flows of our financial instruments will fluctuate because of changes in market prices. Council's exposures to market risk are primarily through interest rate risk with only insignificant exposure to other price risks and no exposure to foreign currency risk. Components of market risk to which we are exposed are discussed below.
Interest rate risk refers to the risk that the value of a financial instrument, or cash flows associated with the instrument, will fluctuate due to changes in market interest rates. Interest rate risk arises from interest bearing financial assets and liabilities that we use. Non derivative interest bearing assets are predominantly short term liquid assets. Our interest rate liability risk arises primarily from long term loans and borrowings at fixed rates which exposes us to fair value interest rate risk.
Our loan borrowings are sourced from Tascorp. We manage interest rate risk on our net debt portfolio by:
Notes to and forming part of the Financial ReportPage 29 of 40
Credit risk
Ageing of Trade and Other Receivables
2020 2019$ $
Current (not yet due) 4,905,947 4,936,153 Past due by up to 30 days (154) 4,651 Past due between 31 and 180 days 1,978 12,336 Past due between 181 and 365 days 5,707 4,033 Past due by more than 1 year 4,197 855 Total Trade Receivables 4,917,675 4,958,028 Rates Receivable 727,951 643,473 Total Trade & Other Receivables 5,645,626 5,601,501
Ageing of individually impaired Trade and Other Receivables
Liquidity risk
Credit risk arises from Council's financial assets, which comprise cash and cash equivalents, and trade and other receivables. Council's exposure to credit risk arises from potential default of the counterparty, with a maximum exposure equal to the carrying amount of these instruments. Exposure at balance date is addressed in each applicable note. Council generally trades with recognised, creditworthy third parties, and as such collateral is generally not requested, nor is it Council's policy to securitise its trade and other receivables. It is Council's policy that some customers who wish to trade on credit terms are subject to credit verification procedures including an assessment of their credit rating, financial position, past experience and industry reputation. In addition, receivable balance are monitored on an ongoing basis with the result that Council's exposure to bad debts is not significant.
At balance date no debtors were impaired. Some of the long outstanding past due amounts have been lodged with Council's debt collectors or are on payment arrangements.
At balance date other debtors representing financial assets were past due but not impaired. These amounts relate to a number of independent customers for whom there is no recent history of default. The ageing of the Council's Trade & Other Receivables was:
- we may be unable to settle or recover a financial assets at all. - we will be forced to sell financial assets at a value which is less than what they are worth; or
To help reduce these risks we: - have readily accessible standby facilities and other funding arrangements in place; and
We may also be subject to credit risk for transactions which are not included in the Statement of Financial Position, such as when we provide a guarantee for another party.
Credit risk is the risk that a contracting entity will not complete its obligations under a financial instrument and cause Council to make a financial loss. Council have exposure to credit risk on some financial assets included in our Statement of Financial Position. To help manage this risk:
- we have a policy for establishing credit limits for the entities we deal with; - we may require collateral where appropriate; and - we only invest surplus funds with financial institutions per our Investment policy.
The Councils exposure to liquidity risk is deemed insignificant based on prior periods' data and current assessment of risk.
- monitor budget to actual performance on a regular basis.
Liquidity risk includes the risk that, as a result of our operational liquidity requirements: - we will not have sufficient funds to settle a transaction on the date;
Notes to and forming part of the Financial ReportPage 30 of 40
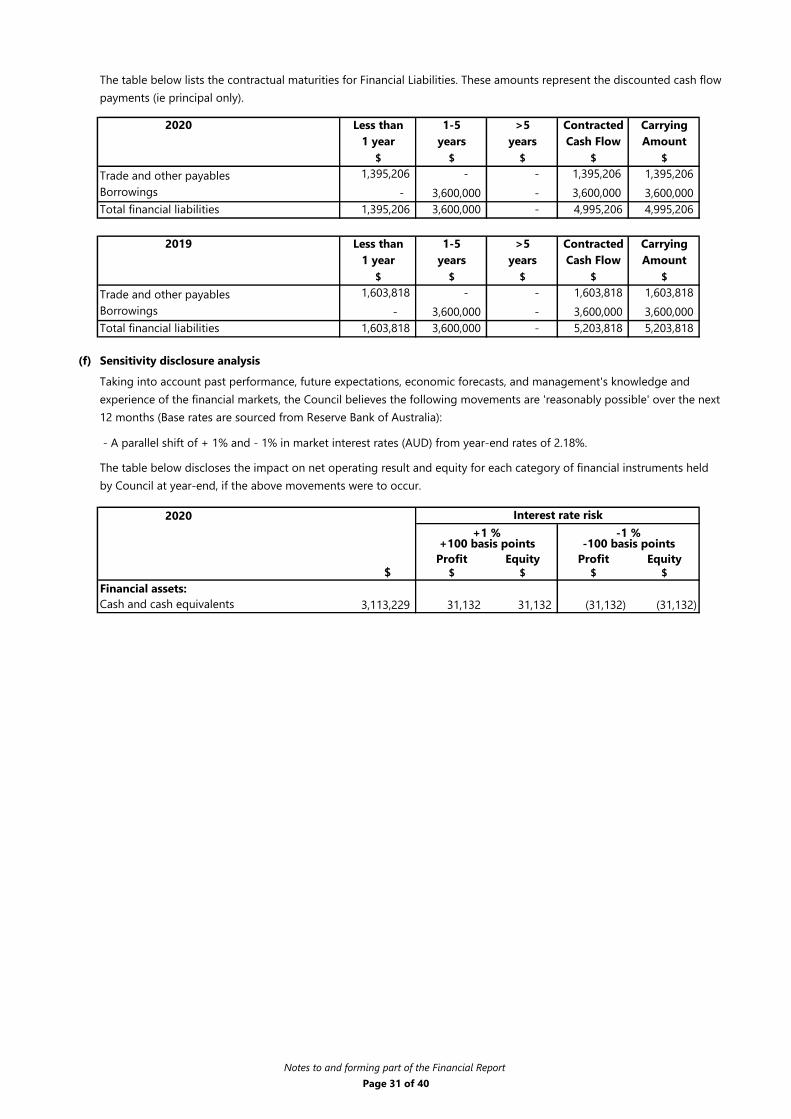
68
2020 Less than 1-5 >5 Contracted Carrying1 year years years Cash Flow Amount
$ $ $ $ $ 1,395,206 - - 1,395,206 1,395,206 - 3,600,000 - 3,600,000 3,600,000
1,395,206 3,600,000 - 4,995,206 4,995,206
2019 Less than 1-5 >5 Contracted Carrying1 year years years Cash Flow Amount
$ $ $ $ $1,603,818 - - 1,603,818 1,603,818
- 3,600,000 - 3,600,000 3,600,000 1,603,818 3,600,000 - 5,203,818 5,203,818
(f) Sensitivity disclosure analysis
2020
Profit Equity Profit Equity$ $ $ $ $
Financial assets:3,113,229 31,132 31,132 (31,132) (31,132)
The table below lists the contractual maturities for Financial Liabilities. These amounts represent the discounted cash flow payments (ie principal only).
Total financial liabilities
Trade and other payablesBorrowings
-1 % +1 %
Trade and other payables
The table below discloses the impact on net operating result and equity for each category of financial instruments held by Council at year-end, if the above movements were to occur.
BorrowingsTotal financial liabilities
Interest rate risk
Taking into account past performance, future expectations, economic forecasts, and management's knowledge and experience of the financial markets, the Council believes the following movements are 'reasonably possible' over the next 12 months (Base rates are sourced from Reserve Bank of Australia):
- A parallel shift of + 1% and - 1% in market interest rates (AUD) from year-end rates of 2.18%.
Cash and cash equivalents
+100 basis points -100 basis points
Notes to and forming part of the Financial ReportPage 31 of 40
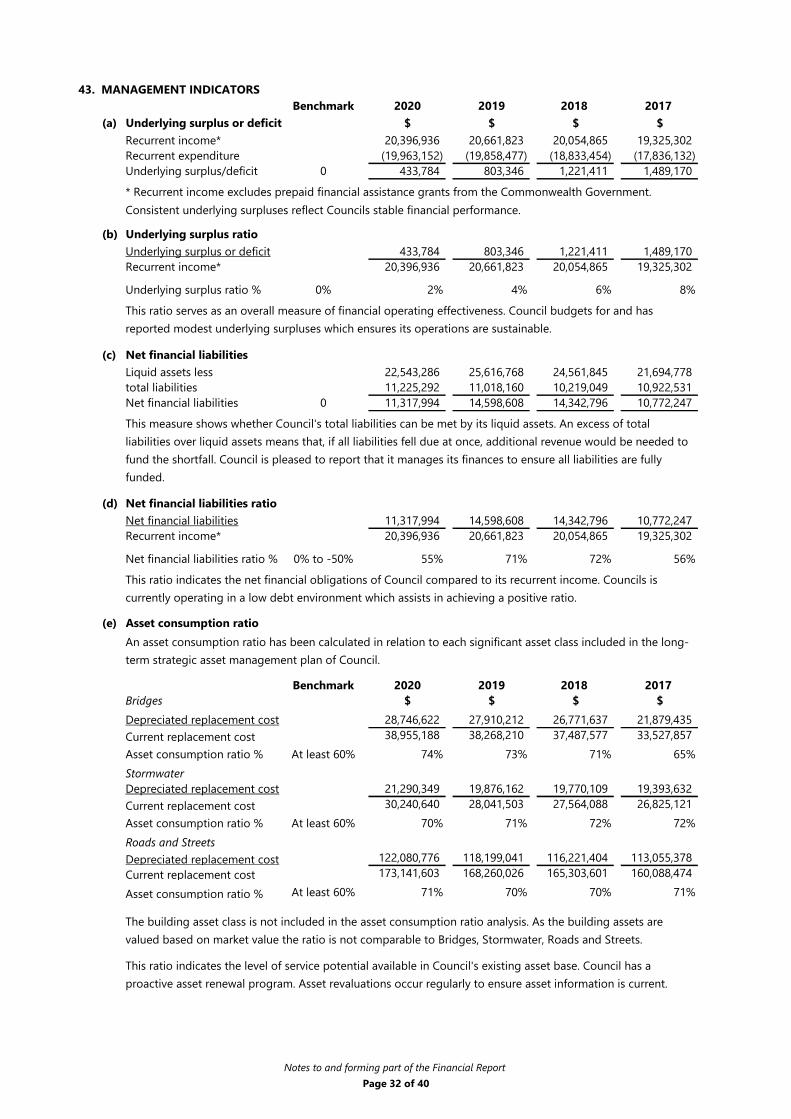
69
2020 Less than 1-5 >5 Contracted Carrying1 year years years Cash Flow Amount
$ $ $ $ $ 1,395,206 - - 1,395,206 1,395,206 - 3,600,000 - 3,600,000 3,600,000
1,395,206 3,600,000 - 4,995,206 4,995,206
2019 Less than 1-5 >5 Contracted Carrying1 year years years Cash Flow Amount
$ $ $ $ $1,603,818 - - 1,603,818 1,603,818
- 3,600,000 - 3,600,000 3,600,000 1,603,818 3,600,000 - 5,203,818 5,203,818
(f) Sensitivity disclosure analysis
2020
Profit Equity Profit Equity$ $ $ $ $
Financial assets:3,113,229 31,132 31,132 (31,132) (31,132)
The table below lists the contractual maturities for Financial Liabilities. These amounts represent the discounted cash flow payments (ie principal only).
Total financial liabilities
Trade and other payablesBorrowings
-1 % +1 %
Trade and other payables
The table below discloses the impact on net operating result and equity for each category of financial instruments held by Council at year-end, if the above movements were to occur.
BorrowingsTotal financial liabilities
Interest rate risk
Taking into account past performance, future expectations, economic forecasts, and management's knowledge and experience of the financial markets, the Council believes the following movements are 'reasonably possible' over the next 12 months (Base rates are sourced from Reserve Bank of Australia):
- A parallel shift of + 1% and - 1% in market interest rates (AUD) from year-end rates of 2.18%.
Cash and cash equivalents
+100 basis points -100 basis points
Notes to and forming part of the Financial ReportPage 31 of 40
Benchmark 2020 2019 2018 2017(a) Underlying surplus or deficit $ $ $ $
Recurrent income* 20,396,936 20,661,823 20,054,865 19,325,302 Recurrent expenditure (19,963,152) (19,858,477) (18,833,454) (17,836,132) Underlying surplus/deficit 0 433,784 803,346 1,221,411 1,489,170
(b) Underlying surplus ratioUnderlying surplus or deficit 433,784 803,346 1,221,411 1,489,170 Recurrent income* 20,396,936 20,661,823 20,054,865 19,325,302
Underlying surplus ratio % 0% 2% 4% 6% 8%
(c) Net financial liabilitiesLiquid assets less 22,543,286 25,616,768 24,561,845 21,694,778 total liabilities 11,225,292 11,018,160 10,219,049 10,922,531 Net financial liabilities 0 11,317,994 14,598,608 14,342,796 10,772,247
(d) Net financial liabilities ratioNet financial liabilities 11,317,994 14,598,608 14,342,796 10,772,247 Recurrent income* 20,396,936 20,661,823 20,054,865 19,325,302
Net financial liabilities ratio % 0% to -50% 55% 71% 72% 56%
(e) Asset consumption ratio
Benchmark 2020 2019 2018 2017Bridges $ $ $ $Depreciated replacement cost 28,746,622 27,910,212 26,771,637 21,879,435 Current replacement cost 38,955,188 38,268,210 37,487,577 33,527,857 Asset consumption ratio % At least 60% 74% 73% 71% 65%StormwaterDepreciated replacement cost 21,290,349 19,876,162 19,770,109 19,393,632 Current replacement cost 30,240,640 28,041,503 27,564,088 26,825,121 Asset consumption ratio % At least 60% 70% 71% 72% 72%Roads and StreetsDepreciated replacement cost 122,080,776 118,199,041 116,221,404 113,055,378 Current replacement cost 173,141,603 168,260,026 165,303,601 160,088,474 Asset consumption ratio % At least 60% 71% 70% 70% 71%
This ratio indicates the level of service potential available in Council's existing asset base. Council has a proactive asset renewal program. Asset revaluations occur regularly to ensure asset information is current.
43. MANAGEMENT INDICATORS
* Recurrent income excludes prepaid financial assistance grants from the Commonwealth Government.
This ratio serves as an overall measure of financial operating effectiveness. Council budgets for and has reported modest underlying surpluses which ensures its operations are sustainable.
This measure shows whether Council's total liabilities can be met by its liquid assets. An excess of total liabilities over liquid assets means that, if all liabilities fell due at once, additional revenue would be needed to fund the shortfall. Council is pleased to report that it manages its finances to ensure all liabilities are fully funded.
This ratio indicates the net financial obligations of Council compared to its recurrent income. Councils is currently operating in a low debt environment which assists in achieving a positive ratio.
An asset consumption ratio has been calculated in relation to each significant asset class included in the long-term strategic asset management plan of Council.
Consistent underlying surpluses reflect Councils stable financial performance.
The building asset class is not included in the asset consumption ratio analysis. As the building assets are valued based on market value the ratio is not comparable to Bridges, Stormwater, Roads and Streets.
Notes to and forming part of the Financial ReportPage 32 of 40

70
Benchmark 2020 2019 2018 2017(f) Asset renewal funding ratio $ $ $ $
BridgesProjected capital funding outlays** 7,640,000 6,341,000 8,212,000 8,534,000 Projected capital expenditure funding*** 7,640,000 6,341,000 8,212,000 8,534,000
Asset renewal funding ratio % 90% to 100% 100% 100% 100% 100%
BuildingsProjected capital funding outlays** 10,565,000 5,649,000 3,983,000 3,720,000 Projected capital expenditure funding*** 10,565,000 5,649,000 3,983,000 3,720,000
Asset renewal funding ratio % 90% to 100% 100% 100% 100% 100%StormwaterProjected capital funding outlays** 4,667,000 4,996,000 4,894,000 5,095,000 Projected capital expenditure funding*** 4,667,000 4,996,000 4,894,000 5,095,000
Asset renewal funding ratio % 90% to 100% 100% 100% 100% 100%Roads & StreetsProjected capital funding outlays** 38,494,000 39,640,000 37,870,000 39,016,000 Projected capital expenditure funding*** 38,494,000 39,640,000 37,870,000 39,016,000
Asset renewal funding ratio % 90% to 100% 100% 100% 100% 100%
Benchmark 2020 2019 2018 2017(g) Asset sustainability ratio $ $ $ $
Capex on replacement/renewal of existing assets 5,721,861 5,136,691 8,108,043 8,953,212 Annual depreciation expense 5,068,152 4,868,786 4,931,099 4,722,886
Asset sustainability ratio % 100% 113% 106% 164% 190%
This ratio calculates the extent to which Council is maintaining operating capacity through renewal of their existing asset base. Council manages its capex on replacement/renewal of existing assets in line with the requirements of the asset management plans. Due to the long useful lives of Councils infrastructure this ratio must be viewed in conjunction with a long term view.
** Current value of projected capital funding outlays for an asset identified in Council's long-term financial plan.
This ratio measures Council's capacity to fund future asset replacement requirements. Council is focussed on fully funding the capital asset expenditure as established in the asset management plans.
*** Value of projected capital expenditure funding for an asset identified in Council's long-term strategic asset management plan.
An asset renewal funding ratio has been calculated in relation to each significant asset class included in the long-term strategic asset management plan of Council.
Notes to and forming part of the Financial ReportPage 33 of 40

71
Benchmark 2020 2019 2018 2017(f) Asset renewal funding ratio $ $ $ $
BridgesProjected capital funding outlays** 7,640,000 6,341,000 8,212,000 8,534,000 Projected capital expenditure funding*** 7,640,000 6,341,000 8,212,000 8,534,000
Asset renewal funding ratio % 90% to 100% 100% 100% 100% 100%
BuildingsProjected capital funding outlays** 10,565,000 5,649,000 3,983,000 3,720,000 Projected capital expenditure funding*** 10,565,000 5,649,000 3,983,000 3,720,000
Asset renewal funding ratio % 90% to 100% 100% 100% 100% 100%StormwaterProjected capital funding outlays** 4,667,000 4,996,000 4,894,000 5,095,000 Projected capital expenditure funding*** 4,667,000 4,996,000 4,894,000 5,095,000
Asset renewal funding ratio % 90% to 100% 100% 100% 100% 100%Roads & StreetsProjected capital funding outlays** 38,494,000 39,640,000 37,870,000 39,016,000 Projected capital expenditure funding*** 38,494,000 39,640,000 37,870,000 39,016,000
Asset renewal funding ratio % 90% to 100% 100% 100% 100% 100%
Benchmark 2020 2019 2018 2017(g) Asset sustainability ratio $ $ $ $
Capex on replacement/renewal of existing assets 5,721,861 5,136,691 8,108,043 8,953,212 Annual depreciation expense 5,068,152 4,868,786 4,931,099 4,722,886
Asset sustainability ratio % 100% 113% 106% 164% 190%
This ratio calculates the extent to which Council is maintaining operating capacity through renewal of their existing asset base. Council manages its capex on replacement/renewal of existing assets in line with the requirements of the asset management plans. Due to the long useful lives of Councils infrastructure this ratio must be viewed in conjunction with a long term view.
** Current value of projected capital funding outlays for an asset identified in Council's long-term financial plan.
This ratio measures Council's capacity to fund future asset replacement requirements. Council is focussed on fully funding the capital asset expenditure as established in the asset management plans.
*** Value of projected capital expenditure funding for an asset identified in Council's long-term strategic asset management plan.
An asset renewal funding ratio has been calculated in relation to each significant asset class included in the long-term strategic asset management plan of Council.
Notes to and forming part of the Financial ReportPage 33 of 40
(g) Asset sustainability ratio (Cont.)
2020 Capital Capital Totalrenewal new capital
expenditure expenditure expenditure Asset Class $ $ $Land Improvements 140,693 234,115 374,808 Buildings 503,345 1,927,847 2,431,192 Roads and Streets 3,047,875 2,908,594 5,956,469 Bridges 1,303,257 - 1,303,257 Stormwater 12,149 759,961 772,110 Plant and Equipment 558,440 12,887 571,327 Valuations 41,641 - 41,641 Computer Software 114,461 - 114,461
5,721,861 5,843,404 11,565,265
2019 Capital Capital Totalrenewal new capital
expenditure expenditure expenditure Asset Class $ $ $Land Improvements 625,209 504,406 1,129,615 Buildings 96,326 23,870 120,196 Roads and Streets 2,324,387 265,977 2,590,364 Bridges 1,608,117 - 1,608,117 Stormwater - 392,007 392,007 Plant and Equipment 303,546 113,570 417,116 Valuations 133,000 - 133,000 Computer Software 46,106 - 46,106
5,136,691 1,299,830 6,436,521
Notes to and forming part of the Financial ReportPage 34 of 40

72
Council measures and recognises the following assets at fair value on a recurring basis:
Land Land Under Roads Buildings Roads and Streets Bridges Stormwater Investment in Water Corporation
Council does not measure any liabilities at fair value on a recurring basis.
(a) Fair Value Hierarchy
Level 1
Level 2
Level 3
As at 30 June 2020 Note Level 1 Level 2 Level 3 Total$ $ $ $
Recurring fair value measurementsLand 21 - 8,600,000 - 8,600,000 Land Under Roads 22 - - 28,994,771 28,994,771 Buildings 24 - - 21,466,143 21,466,143 Roads and Streets 25 - - 122,080,776 122,080,776 Bridges 26 - - 28,746,622 28,746,622 Stormwater 27 - - 21,290,349 21,290,349 Investment in Water Corporation 18 - - 42,570,596 42,570,596
- 8,600,000 265,149,257 273,749,257
As at 30 June 2019 Note Level 1 Level 2 Level 3 Total$ $ $ $
Recurring fair value measurementsLand 21 - 8,518,455 - 8,518,455 Land Under Roads 22 - - 26,169,270 26,169,270 Buildings 24 - - 18,392,042 18,392,042 Roads and Streets 25 - - 118,199,041 118,199,041 Bridges 26 - - 27,910,212 27,910,212 Stormwater 27 - - 19,876,162 19,876,162 Investment in Water Corporation 18 - - 55,591,754 55,591,754
- 8,518,455 266,138,481 274,656,936
44. FAIR VALUE MEASUREMENT
AASB 13 Fair Value Measurement requires all assets and liabilities measured at fair value to be assigned to a level in the fair value hierarchy as follows:
Unadjusted quoted prices in active markets for identical assets or liabilities that the entity can access at the measurement date.
Inputs other than quoted prices included within Level 1 that are observable for the asset or liability, either directly or indirectly.
Unobservable inputs for the asset or liability.
The fair values of the assets are determined using valuation techniques which maximise the use of observable data, where it is available, and minimise the use of entity specific estimates. If one or more of the significant inputs is not based on observable market data, the asset is included in level 3. This is the case for Council infrastructure assets, which are of a specialist nature for which there is no active market for similar or identical assets. These assets are valued using a combination of observable and unobservable inputs.
There were no transfers between levels 1 and 2 during the year, nor between levels 2 and 3.
Notes to and forming part of the Financial ReportPage 35 of 40
(b) Highest and best use
(c) Valuation techniques and significant inputs used to derive fair values
Land (Level 2)
Land Under Roads (Level 3)
Buildings (Level 3)
Infrastructure Assets
While the unit rates based on square metres can be supported by market evidence (level 2), the estimates of useful lives that are used to calculate accumulated depreciation comprise unobservable inputs (level 3). Where these other inputs are significant to the valuation the overall valuation has been classified as level 3.
Land under roads is based on land use class rates determined by the Valuer General, effective 1 July 2019, using site values adjusted for englobo (undeveloped and/or unserviced) characteristics, access rights, private interests of other parties and entitlements of infrastructure assets and services. This adjustment is an unobservable input in the valuation.
The unit rates (labour and materials) and quantities applied to determine the CRC of an asset or asset component were based on a "Brownfield" assumption meaning that the CRC was determined as the full cost of replacing an asset in its current form including components that may not need to be replaced, such as earthworks.
The calculation of CRC involves a number of inputs that require judgement and are therefore classed as unobservable. While these judgements are made by qualified and experienced staff, different judgements could result in a different valuation. The table at (d) below summarises the effect that changes in the most significant unobservable inputs would have on the valuation.
The level of accumulated depreciation for infrastructure assets was determined based on the age of the asset and the useful life adopted by Council for the asset type. Estimated useful lives are disclosed in Note 7.
The methods for calculating CRC are described under individual asset categories below.
CRC was measured by reference to the lowest cost at which the gross future economic benefits of the asset could currently be obtained in the normal course of business. The resulting valuation reflects the cost of replacing the existing economic benefits based on an efficient set of modern equivalent assets to achieve the required level of service output.
Land fair values were determined by a qualified independent valuer effective 1 July 2019. Level 2 valuation inputs were used to value land in freehold title as well as land used for special purposes, which is restricted in use under current planning provisions. Sales prices of comparable land sites in close proximity are adjusted for differences in key attributes such as property size. The most significant input into this valuation approach is price per square metre.
The fair value of buildings were determined by a qualified independent valuer Herron Todd White effective 22 November 2019. Where there is a market for Council building assets, fair value has been derived from the sales prices of comparable properties after adjusting for differences in key attributes such as property size. The most significant input into this valuation approach was price per square metre.
All Council infrastructure assets were fair valued using written down current replacement cost (CRC). This valuation comprises the asset's gross replacement cost less accumulated depreciation calculated on the basis of such cost to reflect the already consumed or expired future economic benefits of the asset. Council first determined the gross cost of replacing the full service potential of the asset and then adjusted this amount to take account of the expired service potential of the asset.
AASB 13 requires the fair value of non-financial assets to be calculated based on their "highest and best use". Council considers that all assets valued at fair value in this note are being used for their highest and best use.
Notes to and forming part of the Financial ReportPage 36 of 40

73
Council measures and recognises the following assets at fair value on a recurring basis:
Land Land Under Roads Buildings Roads and Streets Bridges Stormwater Investment in Water Corporation
Council does not measure any liabilities at fair value on a recurring basis.
(a) Fair Value Hierarchy
Level 1
Level 2
Level 3
As at 30 June 2020 Note Level 1 Level 2 Level 3 Total$ $ $ $
Recurring fair value measurementsLand 21 - 8,600,000 - 8,600,000 Land Under Roads 22 - - 28,994,771 28,994,771 Buildings 24 - - 21,466,143 21,466,143 Roads and Streets 25 - - 122,080,776 122,080,776 Bridges 26 - - 28,746,622 28,746,622 Stormwater 27 - - 21,290,349 21,290,349 Investment in Water Corporation 18 - - 42,570,596 42,570,596
- 8,600,000 265,149,257 273,749,257
As at 30 June 2019 Note Level 1 Level 2 Level 3 Total$ $ $ $
Recurring fair value measurementsLand 21 - 8,518,455 - 8,518,455 Land Under Roads 22 - - 26,169,270 26,169,270 Buildings 24 - - 18,392,042 18,392,042 Roads and Streets 25 - - 118,199,041 118,199,041 Bridges 26 - - 27,910,212 27,910,212 Stormwater 27 - - 19,876,162 19,876,162 Investment in Water Corporation 18 - - 55,591,754 55,591,754
- 8,518,455 266,138,481 274,656,936
44. FAIR VALUE MEASUREMENT
AASB 13 Fair Value Measurement requires all assets and liabilities measured at fair value to be assigned to a level in the fair value hierarchy as follows:
Unadjusted quoted prices in active markets for identical assets or liabilities that the entity can access at the measurement date.
Inputs other than quoted prices included within Level 1 that are observable for the asset or liability, either directly or indirectly.
Unobservable inputs for the asset or liability.
The fair values of the assets are determined using valuation techniques which maximise the use of observable data, where it is available, and minimise the use of entity specific estimates. If one or more of the significant inputs is not based on observable market data, the asset is included in level 3. This is the case for Council infrastructure assets, which are of a specialist nature for which there is no active market for similar or identical assets. These assets are valued using a combination of observable and unobservable inputs.
There were no transfers between levels 1 and 2 during the year, nor between levels 2 and 3.
Notes to and forming part of the Financial ReportPage 35 of 40
(b) Highest and best use
(c) Valuation techniques and significant inputs used to derive fair values
Land (Level 2)
Land Under Roads (Level 3)
Buildings (Level 3)
Infrastructure Assets
While the unit rates based on square metres can be supported by market evidence (level 2), the estimates of useful lives that are used to calculate accumulated depreciation comprise unobservable inputs (level 3). Where these other inputs are significant to the valuation the overall valuation has been classified as level 3.
Land under roads is based on land use class rates determined by the Valuer General, effective 1 July 2019, using site values adjusted for englobo (undeveloped and/or unserviced) characteristics, access rights, private interests of other parties and entitlements of infrastructure assets and services. This adjustment is an unobservable input in the valuation.
The unit rates (labour and materials) and quantities applied to determine the CRC of an asset or asset component were based on a "Brownfield" assumption meaning that the CRC was determined as the full cost of replacing an asset in its current form including components that may not need to be replaced, such as earthworks.
The calculation of CRC involves a number of inputs that require judgement and are therefore classed as unobservable. While these judgements are made by qualified and experienced staff, different judgements could result in a different valuation. The table at (d) below summarises the effect that changes in the most significant unobservable inputs would have on the valuation.
The level of accumulated depreciation for infrastructure assets was determined based on the age of the asset and the useful life adopted by Council for the asset type. Estimated useful lives are disclosed in Note 7.
The methods for calculating CRC are described under individual asset categories below.
CRC was measured by reference to the lowest cost at which the gross future economic benefits of the asset could currently be obtained in the normal course of business. The resulting valuation reflects the cost of replacing the existing economic benefits based on an efficient set of modern equivalent assets to achieve the required level of service output.
Land fair values were determined by a qualified independent valuer effective 1 July 2019. Level 2 valuation inputs were used to value land in freehold title as well as land used for special purposes, which is restricted in use under current planning provisions. Sales prices of comparable land sites in close proximity are adjusted for differences in key attributes such as property size. The most significant input into this valuation approach is price per square metre.
The fair value of buildings were determined by a qualified independent valuer Herron Todd White effective 22 November 2019. Where there is a market for Council building assets, fair value has been derived from the sales prices of comparable properties after adjusting for differences in key attributes such as property size. The most significant input into this valuation approach was price per square metre.
All Council infrastructure assets were fair valued using written down current replacement cost (CRC). This valuation comprises the asset's gross replacement cost less accumulated depreciation calculated on the basis of such cost to reflect the already consumed or expired future economic benefits of the asset. Council first determined the gross cost of replacing the full service potential of the asset and then adjusted this amount to take account of the expired service potential of the asset.
AASB 13 requires the fair value of non-financial assets to be calculated based on their "highest and best use". Council considers that all assets valued at fair value in this note are being used for their highest and best use.
Notes to and forming part of the Financial ReportPage 36 of 40

74
Roads and Streets (Level 3)
Bridges (Level 3)
Stormwater (Level 3)
(d) Unobservable inputs and sensitivities
Asset / liability category* Carrying amount (at fair value)
Key unobservable
inputs *
Expected range of inputs
Investment in Water Corporation 42,570,596
(e) Changes in recurring level 3 fair value measurements
(f) Valuation processes
(g) Assets and liabilities not measured at fair value but for which fair value is disclosed
Council has assets and liabilities which are not measured at fair value, but for which fair values are disclosed in Note 42.
Council borrowings are measured at amortised cost with interest recognised in profit or loss when incurred. The fair value of borrowings disclosed in Note 42 is provided by Tascorp (level 2).
CRC is based on the unit rate for the component type. For pipes, the unit price is multiplied by the asset's length. The unit rate for pipes is based on the construction material and labour.
Description of how changes in inputs will affect the fair
value
Refer to Note 18 for a description of the valuation basis.
The carrying amounts of trade receivables and trade payables are assumed to approximate their fair values due to their short-term nature (Level 2).
*There were no significant inter-relationships between unobservable inputs that materially affect fair values.
The changes in level 3 assets with recurring fair value measurements are detailed in Note 32 (Reconciliation of movements in non-current assets). There have been no transfers between level 1, 2 or 3 measurements during the year.
Council's current policy for the valuation of Land, Buildings, Roads and Streets and Stormwater (recurring fair value measurements) is set out in Note 32 and Note 35.
The fair value of Roads and Streets were determined by Dino De Paoli, Director of Councils Infrastructure Services effective 31 December 2018. Council categorises its road infrastructure into urban and rural roads and then further sub-categorises these into sealed and unsealed roads. All road segments are componentised into formation, pavement, and seal. Council assumes that environmental factors such as soil type, climate and topography are consistent across each segment. Council also assumes a segment is designed and constructed to the same standard and uses a consistent amount of labour and materials.
The fair value of Stormwater Infrastructure were determined by Dino De Paoli, Director of Councils Infrastructure Services effective 31 December 2019. Similar to roads, stormwater assets are managed in segments; pits and pipes being the major components.
CRC is based on the road area multiplied by a unit rate; the unit rate being an estimate of labour and material inputs, services costs, and overhead allocations. For internal construction estimates, material and services prices are based on existing supplier contract rates or supplier price lists and labour wage rates are based on Council's Enterprise Bargaining Agreement (EBA). Where construction is outsourced, CRC is based on the average of completed similar projects over the last few years.
Consistent with roads, Council assumes that environmental factors such as soil type, climate and topography are consistent across each segment and that a segment is designed and constructed to the same standard and uses a consistent amount of labour and materials.
The fair value of bridges assets were determined by a valuation undertaken by independent valuers Aus Span effective 18 December 2017. Each bridge is assessed individually and componentised into sub-assets representing the deck and sub-structure. The valuation is based on the material type used for construction and the deck and sub-structure area.
Notes to and forming part of the Financial ReportPage 37 of 40
45. OTHER SIGNIFICANT ACCOUNTING POLICIES AND NEW ACCOUNTING STANDARDS
(a) Allocation Between Current and Non-Current
(b) Taxation
(c) Comparative and Budget Information
(d) Adoption of New and Amended Accounting Standards
(i)
Unless otherwise stated, all accounting policies are consistent with those applied in the prior year. Where necessary by accounting standards, comparative information has been adjusted to conform with changes in presentation for the current year. The Budget revenue and expenses allocated in the Statement of Comprehensive Income are taken from Council's annual budget and have not been audited.
Certain new accounting standards and interpretations have become mandatory for the 30 June 2020 reporting period. Council's assessment of the impact of new standards and interpretations are set out below:
AASB 15 Revenue from Contracts with Customers and AASB 1058 Income of Not-for-Profit EntitiesCouncil adopted AASB15 and AASB1058 using the modified retrospective method of transition, with the date of initial application of 1 July 2019. In accordance with the provisions of this transition approach, Council recognised the cumulative effect of applying these new standards as an adjustment to opening Accumulated surplses at the date of initial application, i.e., 1 July 2019. Consequently, the comparative information presented has not been restated and continues to be reported under the previous standards on revenue and income. In addition, Council has applied the practical expedients and elected to apply these standards retrospectively only to contracts and transactions that were not completed contracts at the date of initial application, i.e., as at 1 July 2019
As Council has applied the modified retrospective apprach, it has applied the practical expedient described in AASB15.C5(c) for all contract modifications that occured before application date. In doing so Council did not retrospectively restate the contract for those modifications in accordance with AASB15.20-21. Instead, Council reflected the aggregate effect of all of the modifications that occur before the beginning of the earliest period presented when: • Identifying the satisfied and unsatisfied performance obligations • Determining the transaction price • Allocating the transaction price to the satisfied and unsatisfied performance obligation.
AASB 15 introduces a five-step process for revenue recognition, with the core principle of the new standard being for entities to recognise revenue to depict the transfer of goods or services to customers in amounts that reflect the consideration (that is, payment) to which the entity expects to be entitled in exchange for those goods or services.
Goods and Services Tax (GST)Revenues, expenses and assets are recognised net of goods and services tax (GST), except where the GST incurred is not recoverable from the Australian Tax Office (ATO). In these circumstances the GST is recognised as part of the cost of acquisition of the asset or as part of an expense item. Receivables and payables are stated as the GST inclusive amount.
Cash flows are included in the Statement of Cash Flows on a gross basis. The GST components of cash flows arising from the investing and financing activities, which are recovered from or paid to the ATO, are classified as operating cash flows.
In the determination of whether an asset or liability is current or non-current, consideration is given to the time when each asset or liability is expected to be settled. The asset or liability is classified as current if it is expected to be settled within the next twelve months, being Council's operational cycle, or if Council does not have an unconditional right to defer settlement of a liability for at least 12 months after the reporting date.
Council is exempt from income tax however is required to pay for other forms of taxation including Land Tax, Fringe Benefits Tax, Payroll Tax and the Goods and Services Tax.
Notes to and forming part of the Financial ReportPage 38 of 40
75
Roads and Streets (Level 3)
Bridges (Level 3)
Stormwater (Level 3)
(d) Unobservable inputs and sensitivities
Asset / liability category* Carrying amount (at fair value)
Key unobservable
inputs *
Expected range of inputs
Investment in Water Corporation 42,570,596
(e) Changes in recurring level 3 fair value measurements
(f) Valuation processes
(g) Assets and liabilities not measured at fair value but for which fair value is disclosed
Council has assets and liabilities which are not measured at fair value, but for which fair values are disclosed in Note 42.
Council borrowings are measured at amortised cost with interest recognised in profit or loss when incurred. The fair value of borrowings disclosed in Note 42 is provided by Tascorp (level 2).
CRC is based on the unit rate for the component type. For pipes, the unit price is multiplied by the asset's length. The unit rate for pipes is based on the construction material and labour.
Description of how changes in inputs will affect the fair
value
Refer to Note 18 for a description of the valuation basis.
The carrying amounts of trade receivables and trade payables are assumed to approximate their fair values due to their short-term nature (Level 2).
*There were no significant inter-relationships between unobservable inputs that materially affect fair values.
The changes in level 3 assets with recurring fair value measurements are detailed in Note 32 (Reconciliation of movements in non-current assets). There have been no transfers between level 1, 2 or 3 measurements during the year.
Council's current policy for the valuation of Land, Buildings, Roads and Streets and Stormwater (recurring fair value measurements) is set out in Note 32 and Note 35.
The fair value of Roads and Streets were determined by Dino De Paoli, Director of Councils Infrastructure Services effective 31 December 2018. Council categorises its road infrastructure into urban and rural roads and then further sub-categorises these into sealed and unsealed roads. All road segments are componentised into formation, pavement, and seal. Council assumes that environmental factors such as soil type, climate and topography are consistent across each segment. Council also assumes a segment is designed and constructed to the same standard and uses a consistent amount of labour and materials.
The fair value of Stormwater Infrastructure were determined by Dino De Paoli, Director of Councils Infrastructure Services effective 31 December 2019. Similar to roads, stormwater assets are managed in segments; pits and pipes being the major components.
CRC is based on the road area multiplied by a unit rate; the unit rate being an estimate of labour and material inputs, services costs, and overhead allocations. For internal construction estimates, material and services prices are based on existing supplier contract rates or supplier price lists and labour wage rates are based on Council's Enterprise Bargaining Agreement (EBA). Where construction is outsourced, CRC is based on the average of completed similar projects over the last few years.
Consistent with roads, Council assumes that environmental factors such as soil type, climate and topography are consistent across each segment and that a segment is designed and constructed to the same standard and uses a consistent amount of labour and materials.
The fair value of bridges assets were determined by a valuation undertaken by independent valuers Aus Span effective 18 December 2017. Each bridge is assessed individually and componentised into sub-assets representing the deck and sub-structure. The valuation is based on the material type used for construction and the deck and sub-structure area.
Notes to and forming part of the Financial ReportPage 37 of 40
45. OTHER SIGNIFICANT ACCOUNTING POLICIES AND NEW ACCOUNTING STANDARDS
(a) Allocation Between Current and Non-Current
(b) Taxation
(c) Comparative and Budget Information
(d) Adoption of New and Amended Accounting Standards
(i)
Unless otherwise stated, all accounting policies are consistent with those applied in the prior year. Where necessary by accounting standards, comparative information has been adjusted to conform with changes in presentation for the current year. The Budget revenue and expenses allocated in the Statement of Comprehensive Income are taken from Council's annual budget and have not been audited.
Certain new accounting standards and interpretations have become mandatory for the 30 June 2020 reporting period. Council's assessment of the impact of new standards and interpretations are set out below:
AASB 15 Revenue from Contracts with Customers and AASB 1058 Income of Not-for-Profit EntitiesCouncil adopted AASB15 and AASB1058 using the modified retrospective method of transition, with the date of initial application of 1 July 2019. In accordance with the provisions of this transition approach, Council recognised the cumulative effect of applying these new standards as an adjustment to opening Accumulated surplses at the date of initial application, i.e., 1 July 2019. Consequently, the comparative information presented has not been restated and continues to be reported under the previous standards on revenue and income. In addition, Council has applied the practical expedients and elected to apply these standards retrospectively only to contracts and transactions that were not completed contracts at the date of initial application, i.e., as at 1 July 2019
As Council has applied the modified retrospective apprach, it has applied the practical expedient described in AASB15.C5(c) for all contract modifications that occured before application date. In doing so Council did not retrospectively restate the contract for those modifications in accordance with AASB15.20-21. Instead, Council reflected the aggregate effect of all of the modifications that occur before the beginning of the earliest period presented when: • Identifying the satisfied and unsatisfied performance obligations • Determining the transaction price • Allocating the transaction price to the satisfied and unsatisfied performance obligation.
AASB 15 introduces a five-step process for revenue recognition, with the core principle of the new standard being for entities to recognise revenue to depict the transfer of goods or services to customers in amounts that reflect the consideration (that is, payment) to which the entity expects to be entitled in exchange for those goods or services.
Goods and Services Tax (GST)Revenues, expenses and assets are recognised net of goods and services tax (GST), except where the GST incurred is not recoverable from the Australian Tax Office (ATO). In these circumstances the GST is recognised as part of the cost of acquisition of the asset or as part of an expense item. Receivables and payables are stated as the GST inclusive amount.
Cash flows are included in the Statement of Cash Flows on a gross basis. The GST components of cash flows arising from the investing and financing activities, which are recovered from or paid to the ATO, are classified as operating cash flows.
In the determination of whether an asset or liability is current or non-current, consideration is given to the time when each asset or liability is expected to be settled. The asset or liability is classified as current if it is expected to be settled within the next twelve months, being Council's operational cycle, or if Council does not have an unconditional right to defer settlement of a liability for at least 12 months after the reporting date.
Council is exempt from income tax however is required to pay for other forms of taxation including Land Tax, Fringe Benefits Tax, Payroll Tax and the Goods and Services Tax.
Notes to and forming part of the Financial ReportPage 38 of 40

76
Statement of Comprehensive Income
Amounts under AASB 118 & 1004
Adjustment Amounts under AASB 15 & 1058
Rates and Charges (12,925,975) 122,661 (12,803,314) Capital Grants (1,339,989) (719,196) (2,059,185)
Statement of Financial PositionContract Liabilities - (347,834) (347,834) Opening Accumulated Surplus (212,679,204) 944,368 (211,734,836)
(ii) AASB 16 LeasesAASB 16 introduces a single lessee accounting model and requires a lessee to recognise assets and liabilities for all leases with a term of more than 12 months, unless the underlying asset is of low value. A lessee is required to recognise a right-of-use asset representing its right to use the underlying leased asset and a lease liability representing its obligations to make lease payments.
Council has applied this standard from 1 July 2019 using a retrospective approach (partial) with cumulative catch-up. This does not require Council to restate comparative figures, but does require the presentation of both qualitative and quantitative disclosures for affected items, along with a corresponding adjustment to the opening balance of Accumulated surpluses for transitional effects of re-measurement.
The impact of the new standard has changed in the timing of revenue recognition, treatment of contracts costs and contracts which contain a financing element. Under the new income recognition model applicable to not-for-profit entities, Council determines whether an enforceable agreement exists and whether the promises to transfer goods or services to the customer are ‘sufficiently specific’. If an enforceable agreement exists and the promises are ‘sufficiently specific’ (to a transaction or part of a transaction), Council applies the general AASB15 principles to determine the appropriate revenue recognition. If these criteria are not met, Council considers whether AASB1058 applies.
AASB 1058 supersedes all the income recognition requirements relating to council, previously in AASB 1004 Contributions. The timing of income recognition under AASB 1058 depends on whether a transaction gives rise to a liability or other performance obligation, or a contribution by owners, related to an asset (such as cash or another asset) received.
AASB 1058 applies when Council receives volunteer services or enters into other transactions in which the consideration to acquire an asset is significantly less than the fair value of the asset, and where the asset is principally to enable Council to further its objectives. In cases where Council enters into other transactions, Council recognises and measures the asset at fair value in accordance with the applicable Australian Accounting Standard (e.g. AASB 116 Property, Plant and Equipment).
If the transaction is a transfer of a financial asset to enable Council to acquire or construct a recognisable non-financial asset to be controlled by council (i.e. an in-substance acquisition of a non-financial asset), Council recognises a liability for the excess of the fair value of the transfer over any related amounts recognised. Council will recognise income as it satisfies its obligations under the transfer, similarly to income recognition in relation to performance obligations under AASB 15 as discussed above.
The table below highlights the impact of adopting AASB 15 and AASB 1058 on the Statement of Comprehensive income and Statement of Financial Position. There was no material impact on Council's Statement of Cash Flows.
AASB 1058 also encompasses non-contractual statutory income such as rates, taxes and fines. Council previously recognised income when received. Under AASB 1058, income is recognised when the taxable event has occurred. The impact to Council has been that revenue previously recognised when received from Rates and charges in advance is now recorded as a liability, with revenue deferred until the commencement of the applicable rating period.
Notes to and forming part of the Financial ReportPage 39 of 40

77
Statement of Comprehensive Income
Amounts under AASB 118 & 1004
Adjustment Amounts under AASB 15 & 1058
Rates and Charges (12,925,975) 122,661 (12,803,314) Capital Grants (1,339,989) (719,196) (2,059,185)
Statement of Financial PositionContract Liabilities - (347,834) (347,834) Opening Accumulated Surplus (212,679,204) 944,368 (211,734,836)
(ii) AASB 16 LeasesAASB 16 introduces a single lessee accounting model and requires a lessee to recognise assets and liabilities for all leases with a term of more than 12 months, unless the underlying asset is of low value. A lessee is required to recognise a right-of-use asset representing its right to use the underlying leased asset and a lease liability representing its obligations to make lease payments.
Council has applied this standard from 1 July 2019 using a retrospective approach (partial) with cumulative catch-up. This does not require Council to restate comparative figures, but does require the presentation of both qualitative and quantitative disclosures for affected items, along with a corresponding adjustment to the opening balance of Accumulated surpluses for transitional effects of re-measurement.
The impact of the new standard has changed in the timing of revenue recognition, treatment of contracts costs and contracts which contain a financing element. Under the new income recognition model applicable to not-for-profit entities, Council determines whether an enforceable agreement exists and whether the promises to transfer goods or services to the customer are ‘sufficiently specific’. If an enforceable agreement exists and the promises are ‘sufficiently specific’ (to a transaction or part of a transaction), Council applies the general AASB15 principles to determine the appropriate revenue recognition. If these criteria are not met, Council considers whether AASB1058 applies.
AASB 1058 supersedes all the income recognition requirements relating to council, previously in AASB 1004 Contributions. The timing of income recognition under AASB 1058 depends on whether a transaction gives rise to a liability or other performance obligation, or a contribution by owners, related to an asset (such as cash or another asset) received.
AASB 1058 applies when Council receives volunteer services or enters into other transactions in which the consideration to acquire an asset is significantly less than the fair value of the asset, and where the asset is principally to enable Council to further its objectives. In cases where Council enters into other transactions, Council recognises and measures the asset at fair value in accordance with the applicable Australian Accounting Standard (e.g. AASB 116 Property, Plant and Equipment).
If the transaction is a transfer of a financial asset to enable Council to acquire or construct a recognisable non-financial asset to be controlled by council (i.e. an in-substance acquisition of a non-financial asset), Council recognises a liability for the excess of the fair value of the transfer over any related amounts recognised. Council will recognise income as it satisfies its obligations under the transfer, similarly to income recognition in relation to performance obligations under AASB 15 as discussed above.
The table below highlights the impact of adopting AASB 15 and AASB 1058 on the Statement of Comprehensive income and Statement of Financial Position. There was no material impact on Council's Statement of Cash Flows.
AASB 1058 also encompasses non-contractual statutory income such as rates, taxes and fines. Council previously recognised income when received. Under AASB 1058, income is recognised when the taxable event has occurred. The impact to Council has been that revenue previously recognised when received from Rates and charges in advance is now recorded as a liability, with revenue deferred until the commencement of the applicable rating period.
Notes to and forming part of the Financial ReportPage 39 of 40
(e) Pending Accounting Standards
Certain new accounting standards and interpretations have been published that are not mandatory for the 30 June 2020 reporting period. Council's assessment of the new standards and interpretations is that there is no material impact on the financial statements.
a) Impact of the new definition of a lease
Council has made use of the practical expedient available on transition to AASB 16 not to reassess whether a contract is or contains a lease. Instead contracts containing a lease under AASB 17 or Interpretation 4 at transition will continue to be applied to those contracts entered or modified before 1 January 2019.
The change in definition of a lease mainly relates to the concept of control. AASB 16 determines whether a contract contains a lease on the basis of whether the customer has the right to control the use of an identified asset for a period of time in exchange for consideration. This is in contrast to the focus on 'risks and rewards' in AASB 117 and Interpretation 4.
b) Impact of lessee accounting
i) Former operating leases
AASB 16 changes how Council accounts for leases previously classified as operating leases under AASB 17, which were off balance sheet.
Applying AASB 16, for all leases, Council:
a) Recognises right-of-use of assets and lease liabilities in the statement of financial position, initially measured at the present value of the future lease payments;
b) Recognises depreciation of right-of-use assets and interest on lease liabilities in profit or loss;
c) Separates the total amount of cash paid into a principal portion (presented within financing activities) and interest (presented within financing activities) in the Statement of cash flows.
Lease incentives (e.g rent-free period) are recognised as part of the measurement of the right-of-use assets and lease liabilities wheres under AASB 117 they resulted into the recognition of a lease incentive, amortised as a reduction of rental expenses generally on a straight-line basis.
Lessor accounting under AASB 16 remains largely unchanged. For finance leases, the lessor recognises a receivable equal to the net investment in the lease. Lease receipts from operating leases are recognised as income either on a straight-line basis or another systematic basis where appropriate. However, AASB 16 has changed and expanded the disclosures required, in particular with regard to how a lessor manages the risks arising from its residual interest in leased assets.
All other Australian accounting standards and interpretations with future effective dates are either not applicable to Council's activities, or have no material impact.
Under AASB 16, right-of-use assets are tested for impairment in accordance with AASB 136.
For short-term leases (lease term of 12 months or less) and leases of low-value assets (such as tablet and personal computers, small items of office furniture and telephones), Council has opted to recognised a lease expense on a straight-line basis as permitted by AASB 16. This expenses is presented within 'other expenses' in profit or loss.
ii) Former finance leasesAASB 16 requires that Council recognises as part of its lease liability only the amount expected to be payable under a residual value guarantee, rather than the maximum amount guaranteed as required by AASB 117. This change did not have a material effect on the Council's financial statements
iii) Lessor accounting
Council's assessment is that there is no material change to the financial statements from the adoption of the standard. Therefore there has been no recognition made of either Right Of Use Assets or Lease liabilities.
Notes to and forming part of the Financial ReportPage 40 of 40

78
…1 of 4
Independent Auditor’s Report To the Councillors of Meander Valley Council Report on the Audit of the Financial Report Opinion I have audited the financial report of Meander Valley Council (Council), which comprises the statement of financial position as at 30 June 2020 and statements of comprehensive income, changes in equity and cash flows for the year then ended, notes to the financial statements, including a summary of significant accounting policies, other explanatory notes and the statement of certification by the General Manager. In my opinion the accompanying financial report:
(a) presents fairly, in all material respects, Council’s financial position as at 30 June 2020 and its financial performance and its cash flows for the year then ended
(b) is in accordance with the Local Government Act 1993 and Australian Accounting Standards. Basis for Opinion I conducted the audit in accordance with Australian Auditing Standards. My responsibilities under those standards are further described in the Auditor’s Responsibilities for the Audit of the Financial Report section of my report. I am independent of Council in accordance with the ethical requirements of the Accounting Professional and Ethical Standards Board’s APES 110 Code of Ethics for Professional Accountants (including Independence standards) (the Code) that are relevant to my audit of the financial report in Australia. I have also fulfilled my other ethical responsibilities in accordance with the Code. The Audit Act 2008 further promotes the independence of the Auditor-General. The Auditor-General is the auditor of all Tasmanian public sector entities and can only be removed by Parliament. The Auditor-General may conduct an audit in any way considered appropriate and is not subject to direction by any person about the way in which audit powers are to be exercised. The Auditor-General has for the purposes of conducting an audit, access to all documents and property and can report to Parliament matters which in the Auditor-General’s opinion are significant. My audit responsibility does not extend to the budget figures included in the financial report and the asset renewal funding ratio disclosed in note 43(f) to the financial report and accordingly, I express no opinion on them. Furthermore, I express no opinion on the General Manager’s

79
…2 of 4
determination that Council did not have any Significant Business Activities for inclusion in the financial report as required by Section 84(2)(da) of the Local Government Act 1993. I believe that the audit evidence I have obtained is sufficient and appropriate to provide a basis for my opinion. Key Audit Matters Key audit matters are those matters that, in my professional judgement, were of most significance in my audit of the financial report of the current period. These matters were addressed in the context of my audit of the financial report as a whole, and in forming my opinion thereon, and I do not provide a separate opinion on these matters. Why this matter is considered to be one of the most significant matters in the audit
Audit procedures to address the matter included
Valuation of property and infrastructure Refer to note 7, 20 to 32 and 44
Council’s assets at 30 June 2020 included land, land under roads, buildings and material long-life infrastructure assets such as roads, bridges and stormwater valued at fair values totalling $231.2m. The fair values of these assets are based on market value or current replacement cost. Council undertakes formal revaluations on a regular basis to ensure valuations represent fair value.
In 2019-20, Council revalued buildings based on an independent valuation and revalued stormwater assets based on current replacement cost valuations determined by internal experts. Land was revalued based on valuations provided by the Valuer-General and land under roads was revalued based on rates provided by the Valuer-General. These valuations are highly dependent upon a range of assumptions and estimated unit rates.
• Assessing the scope, expertise and independence of experts involved in the valuation.
• Assessing the appropriateness of the valuation methodology and the key assumptions used.
• Testing, on a sample basis, the mathematical accuracy of the revaluation calculations.
• Evaluating the adequacy of disclosures made in the financial report, including those regarding the key assumptions used.
Responsibilities of the General Manager for the Financial Report The General Manager is responsible for the preparation and fair presentation of the financial report in accordance with Australian Accounting Standards and the Local Government Act 1993 and for such internal control as determined necessary to enable the preparation of the financial report that is free from material misstatement, whether due to fraud or error.

80
…3 of 4
In preparing the financial report, the General Manager is responsible for assessing Council’s ability to continue as a going concern, disclosing, as applicable, matters related to going concern and using the going concern basis of accounting unless Council is to be dissolved by an Act of Parliament or the Councillors intend to cease operations, or have no realistic alternative but to do so. Auditor’s Responsibilities for the Audit of the Financial Report My objectives are to obtain reasonable assurance about whether the financial report as a whole is free from material misstatement, whether due to fraud or error, and to issue an auditor’s report that includes my opinion. Reasonable assurance is a high level of assurance, but is not a guarantee that an audit conducted in accordance with the Australian Auditing Standards will always detect a material misstatement when it exists. Misstatements can arise from fraud or error and are considered material if, individually or in the aggregate, they could reasonably be expected to influence the economic decisions of users taken on the basis of this financial report. As part of an audit in accordance with the Australian Auditing Standards, I exercise professional judgement and maintain professional scepticism throughout the audit. I also:
• Identify and assess the risks of material misstatement of the financial report, whether due to fraud or error, design and perform audit procedures responsive to those risks, and obtain audit evidence that is sufficient and appropriate to provide a basis for my opinion. The risk of not detecting a material misstatement resulting from fraud is higher than for one resulting from error, as fraud may involve collusion, forgery, intentional omissions, misrepresentations, or the override of internal control.
• Obtain an understanding of internal control relevant to the audit in order to design audit procedures that are appropriate in the circumstances, but not for the purpose of expressing an opinion on the effectiveness of Council’s internal control.
• Evaluate the appropriateness of accounting policies used and the reasonableness of accounting estimates and related disclosures made by the General Manager.
• Conclude on the appropriateness of the General Manager’s use of the going concern basis of accounting and, based on the audit evidence obtained, whether a material uncertainty exists related to events or conditions that may cast significant doubt on the Council’s ability to continue as a going concern. If I conclude that a material uncertainty exists, I am required to draw attention in my auditor’s report to the related disclosures in the financial report or, if such disclosures are inadequate, to modify my opinion. My conclusion is based on the audit evidence obtained up to the date of my auditor’s report. However, future events or conditions may cause Council to cease to continue as a going concern.
• Evaluate the overall presentation, structure and content of the financial report, including the disclosures, and whether the financial report represents the underlying transactions and events in a manner that achieves fair presentation.
I communicate with the General Manager regarding, among other matters, the planned scope and timing of the audit and significant audit findings, including any significant deficiencies in internal control that I identify during my audit.
81
…4 of 4
From the matters communicated with the General Manager, I determine those matters that were of most significance in the audit of the financial report of the current period and are therefore the key audit matters. I describe these matters in my auditor’s report unless law or regulation precludes public disclosure about the matter or when, in extremely rare circumstances, I determine that a matter should not be communicated in my report because the adverse consequences of doing so would reasonably be expected to outweigh the public interest benefits of such communication.
Rod Whitehead Auditor-General Tasmanian Audit Office 17 November 2020 Hobart
