measurement and scaling noncomparative scaling technique
TRANSCRIPT
Chapter Nine
Measurement and Scaling:Noncomparative Scaling
Techniques
9-2
Chapter Outline
1) Overview
2) Noncomparative Scaling Techniques
3) Continuous Rating Scale
4) Itemized Rating Scale
i. Likert Scale
ii. Semantic Differential Scale
iii. Stapel Scale
9-3
Chapter Outline
5) Noncomparative Itemized Rating Scale Decisions
i. Number of Scale Categories
ii. Balanced vs. Unbalanced Scales
iii. Odd or Even Number of Categories
iv. Forced vs. Non-forced Scales
v. Nature and Degree of Verbal Description
vi. Physical Form or Configuration
6) Multi-item Scales
9-4
Chapter Outline
7) Scale Evaluation
i. Measurement Accuracy
ii. Reliability
iii. Validity
iv. Relationship between Reliability and Validity
v. Generalizability
8) Choosing a Scaling Technique
9) Mathematically Derived Scales
Reliable? Valid?
Generalizable?

9-5
Chapter Outline
10) International Marketing Research
11) Ethics in Marketing Research
12) Internet and Computer Applications
13) Focus on Burke
14) Summary
15) Key Terms and Concepts
9-6Noncomparative Scaling Techniques
Respondents evaluate only one object at a time, and for this reason noncomparative scales are often referred to as monadic scales.
Noncomparative techniques consist of continuous and itemized rating scales.
9-7
Continuous Rating Scale
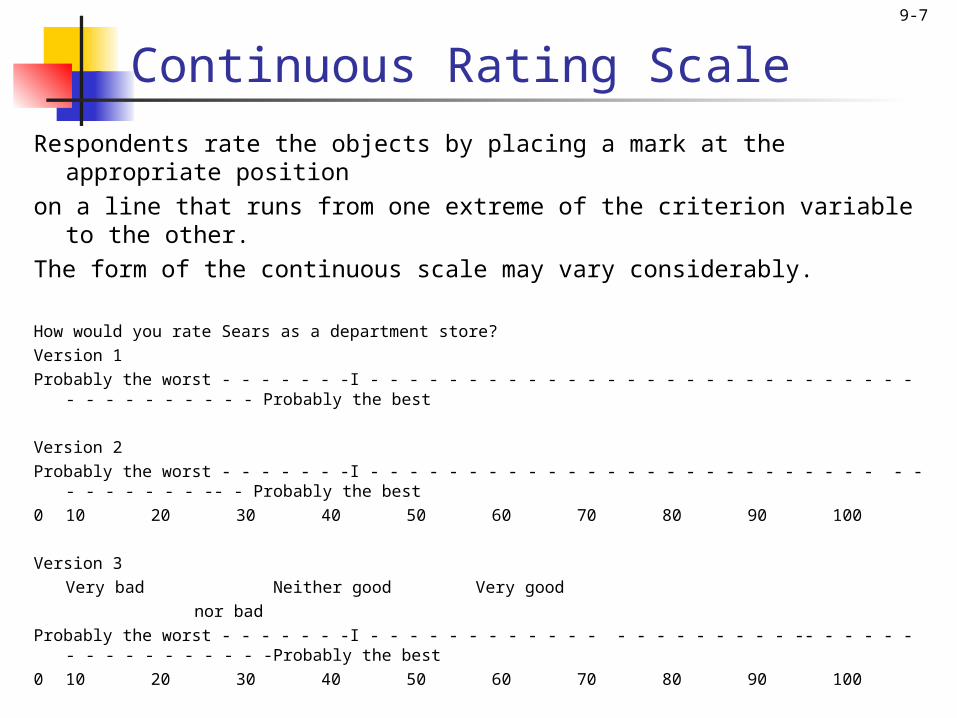
Respondents rate the objects by placing a mark at the appropriate position
on a line that runs from one extreme of the criterion variable to the other.
The form of the continuous scale may vary considerably. How would you rate Sears as a department store?Version 1Probably the worst - - - - - - -I - - - - - - - - - - - - - - - - - - - - - - - - - - - - - - - - - - - - - - Probably the best Version 2Probably the worst - - - - - - -I - - - - - - - - - - - - - - - - - - - - - - - - - - - - - - - - - - - -- - Probably the best0 10 20 30 40 50 60 70 80 90 100 Version 3
Very bad Neither good Very good nor bad
Probably the worst - - - - - - -I - - - - - - - - - - - - - - - - - - - - - -- - - - - - - - - - - - - - - - -Probably the best0 10 20 30 40 50 60 70 80 90 100
9-8
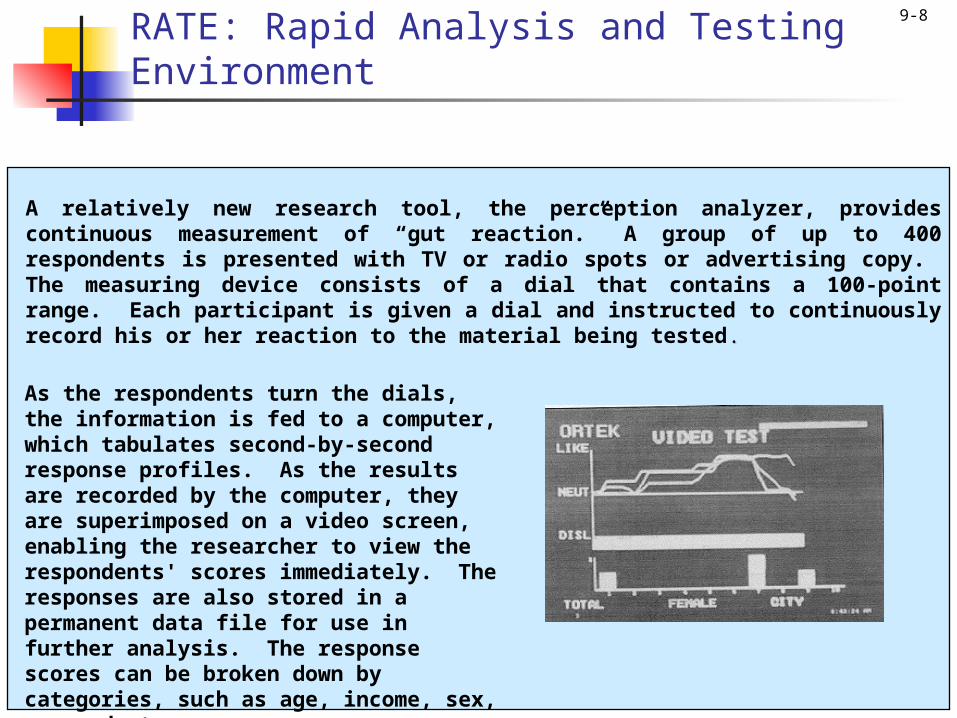
A relatively new research tool, the perception analyzer, provides continuous measurement of “gut reaction.” A group of up to 400 respondents is presented with TV or radio spots or advertising copy. The measuring device consists of a dial that contains a 100-point range. Each participant is given a dial and instructed to continuously record his or her reaction to the material being tested. .
As the respondents turn the dials, the information is fed to a computer, which tabulates second-by-second response profiles. As the results are recorded by the computer, they are superimposed on a video screen, enabling the researcher to view the respondents' scores immediately. The responses are also stored in a permanent data file for use in further analysis. The response scores can be broken down by categories, such as age, income, sex, or product usage.
RATE: Rapid Analysis and Testing Environment
9-9
Itemized Rating Scales
The respondents are provided with a scale that has a number or brief description associated with each category.
The categories are ordered in terms of scale position, and the respondents are required to select the specified category that best describes the object being rated.
The commonly used itemized rating scales are the Likert, semantic differential, and Stapel scales.
9-10
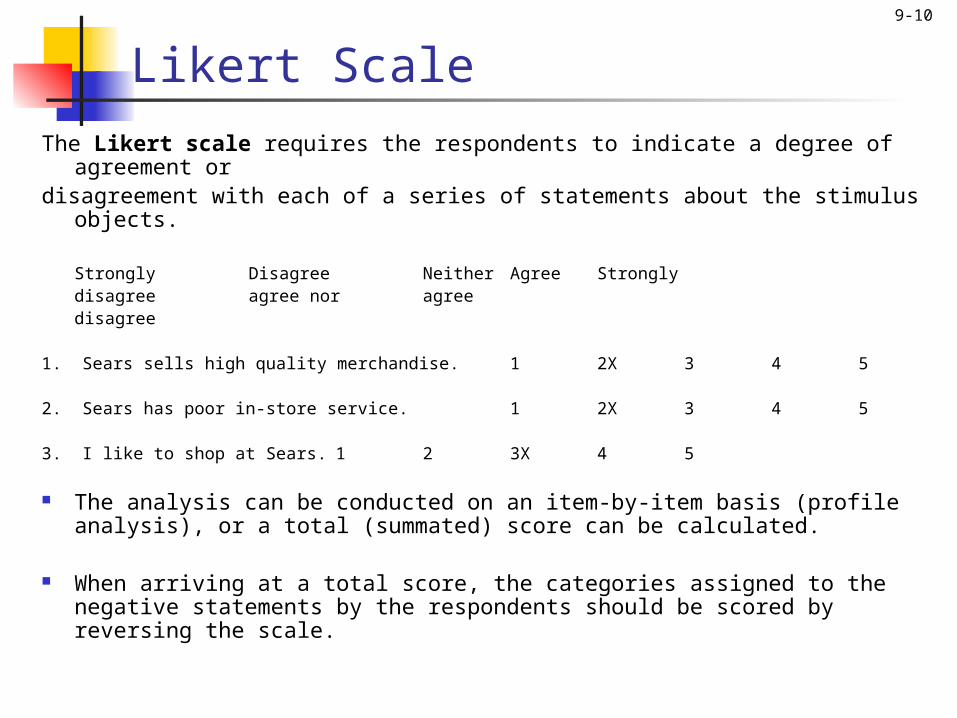
Likert Scale
The Likert scale requires the respondents to indicate a degree of agreement or
disagreement with each of a series of statements about the stimulus objects.
Strongly Disagree Neither Agree Strongly disagree agree nor
agreedisagree
1. Sears sells high quality merchandise. 1 2X 3 4 5 2. Sears has poor in-store service. 1 2X 3 4 5 3. I like to shop at Sears. 1 2 3X 4 5 The analysis can be conducted on an item-by-item basis (profile
analysis), or a total (summated) score can be calculated.
When arriving at a total score, the categories assigned to the negative statements by the respondents should be scored by reversing the scale.
9-11
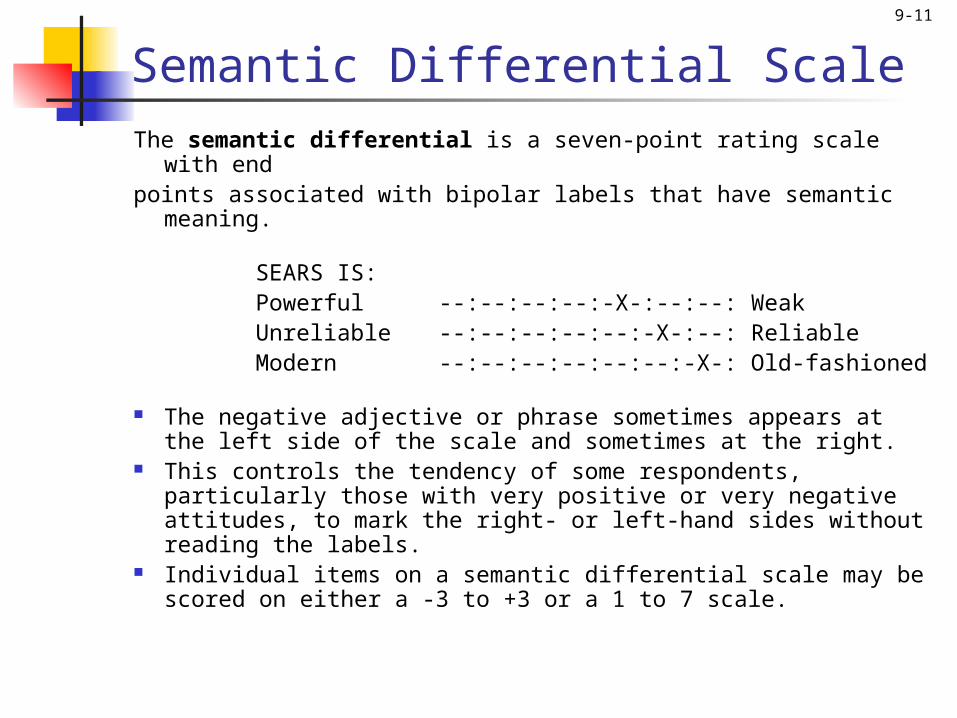
Semantic Differential ScaleThe semantic differential is a seven-point rating scale with
end points associated with bipolar labels that have semantic
meaning.
SEARS IS:Powerful --:--:--:--:-X-:--:--: WeakUnreliable --:--:--:--:--:-X-:--: ReliableModern --:--:--:--:--:--:-X-: Old-fashioned
The negative adjective or phrase sometimes appears at the left side of the scale and sometimes at the right.
This controls the tendency of some respondents, particularly those with very positive or very negative attitudes, to mark the right- or left-hand sides without reading the labels.
Individual items on a semantic differential scale may be scored on either a -3 to +3 or a 1 to 7 scale.
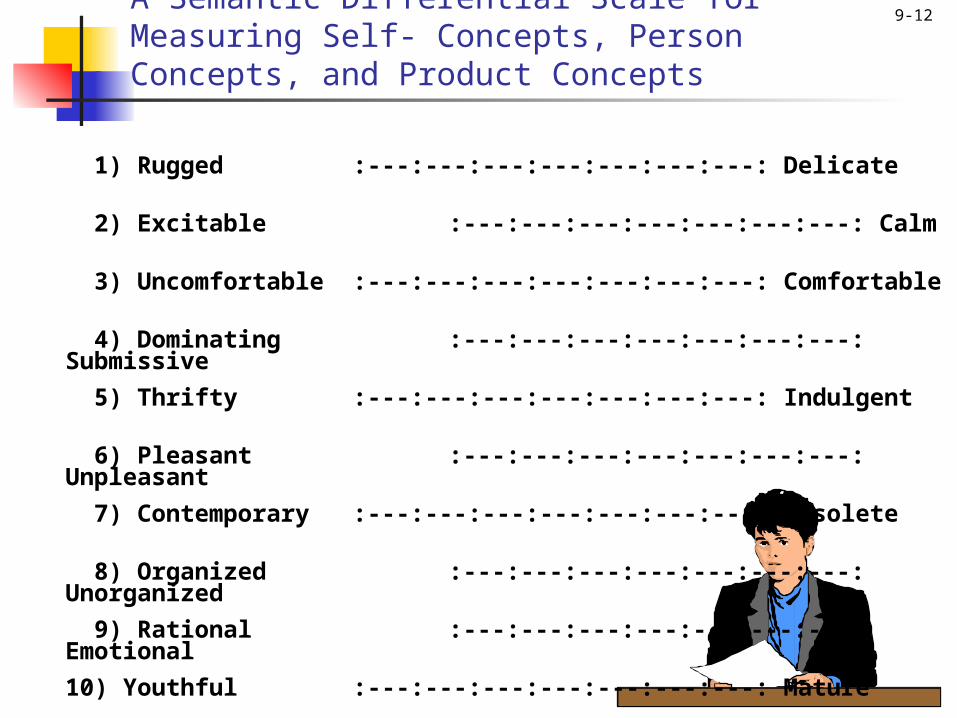
9-12A Semantic Differential Scale for Measuring Self- Concepts, Person Concepts, and Product Concepts
1) Rugged :---:---:---:---:---:---:---: Delicate
2) Excitable :---:---:---:---:---:---:---: Calm
3) Uncomfortable :---:---:---:---:---:---:---: Comfortable
4) Dominating :---:---:---:---:---:---:---: Submissive
5) Thrifty :---:---:---:---:---:---:---: Indulgent
6) Pleasant :---:---:---:---:---:---:---: Unpleasant
7) Contemporary :---:---:---:---:---:---:---: Obsolete
8) Organized :---:---:---:---:---:---:---: Unorganized
9) Rational :---:---:---:---:---:---:---: Emotional
10) Youthful :---:---:---:---:---:---:---: Mature
11) Formal :---:---:---:---:---:---:---: Informal
12) Orthodox :---:---:---:---:---:---:---: Liberal
13) Complex :---:---:---:---:---:---:---: Simple
14) Colorless :---:---:---:---:---:---:---: Colorful
15) Modest :---:---:---:---:---:---:---: Vain
9-13
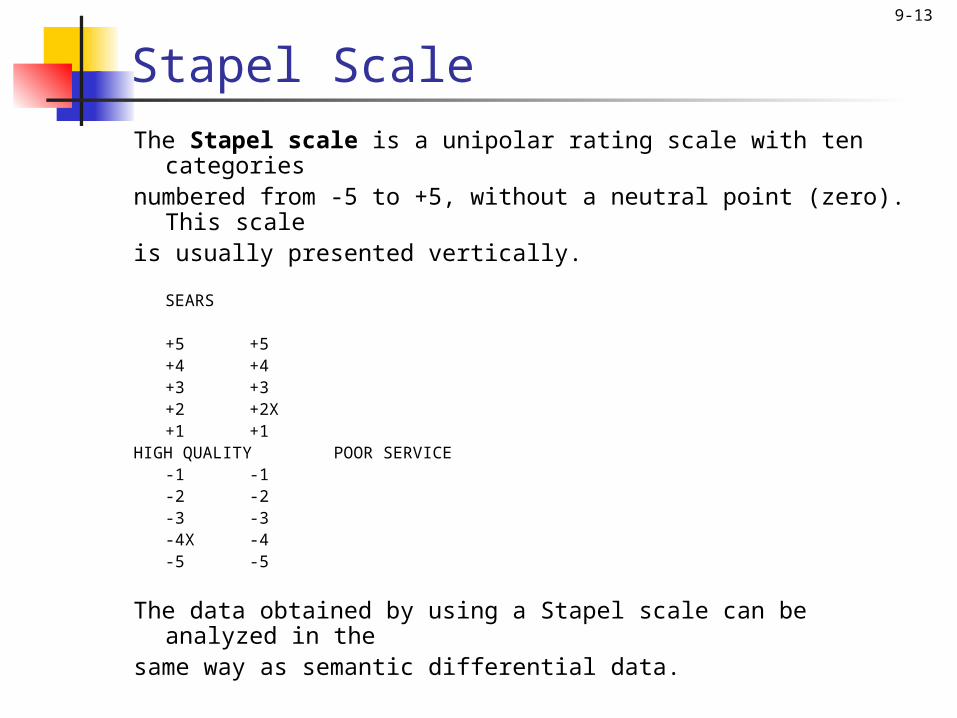
Stapel ScaleThe Stapel scale is a unipolar rating scale with ten categoriesnumbered from -5 to +5, without a neutral point (zero). This
scaleis usually presented vertically.
SEARS
+5 +5+4 +4+3 +3+2 +2X+1 +1
HIGH QUALITY POOR SERVICE-1 -1-2 -2-3 -3-4X -4-5 -5
The data obtained by using a Stapel scale can be analyzed in the
same way as semantic differential data.

9-14
Scale Basic Characteristics
Examples Advantages Disadvantages
Continuous Rating Scale
Place a mark on a continuous line
Reaction to TV commercials
Easy to construct Scoring can be cumbersome
unless computerized
Itemized Rating Scales
Likert Scale Degrees of agreement on a 1 (strongly disagree) to 5 (strongly agree)
scale
Measurement of attitudes
Easy to construct, administer, and
understand
More time - consuming
Semantic Differential
Seven - point scale with bipolar labels
Brand, product, and company images
Versatile Controversy as to whether the data are interval
Stapel Scale
Unipolar ten - point scale, - 5 to +5,
witho ut a neutral point (zero)
Measurement of attitudes and images
Easy to construct, administer over
telephone
Confusing and difficult to apply
Table 9.1
Basic Noncomparative Scales
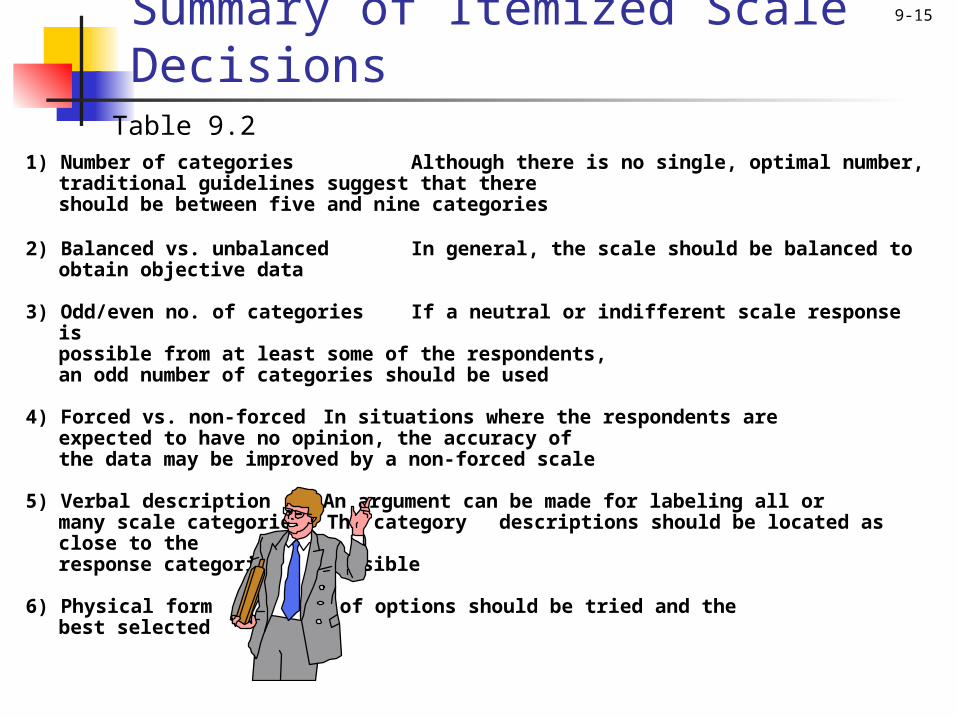
9-15Summary of Itemized Scale Decisions
1) Number of categories Although there is no single, optimal number,traditional guidelines suggest that thereshould be between five and nine categories
2) Balanced vs. unbalanced In general, the scale should be balanced toobtain objective data
3) Odd/even no. of categories If a neutral or indifferent scale response ispossible from at least some of the
respondents,an odd number of categories should be used
4) Forced vs. non-forced In situations where the respondents areexpected to have no opinion, the accuracy ofthe data may be improved by a non-forced
scale
5) Verbal description An argument can be made for labeling all ormany scale categories. The category descriptions should be located as close to theresponse categories as possible
6) Physical form A number of options should be tried and thebest selected
Table 9.2
9-16
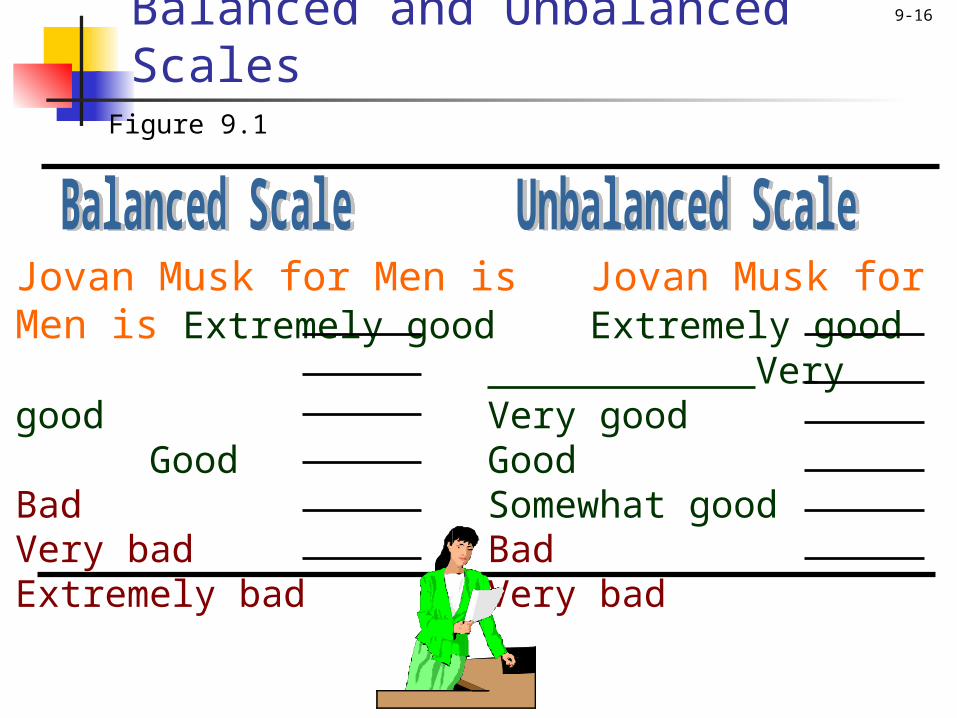
Jovan Musk for Men is Jovan Musk for Men is Extremely good Extremely good Very good Very good Good Good Bad Somewhat goodVery bad Bad Extremely bad Very bad
Figure 9.1
Balanced and Unbalanced Scales
9-17
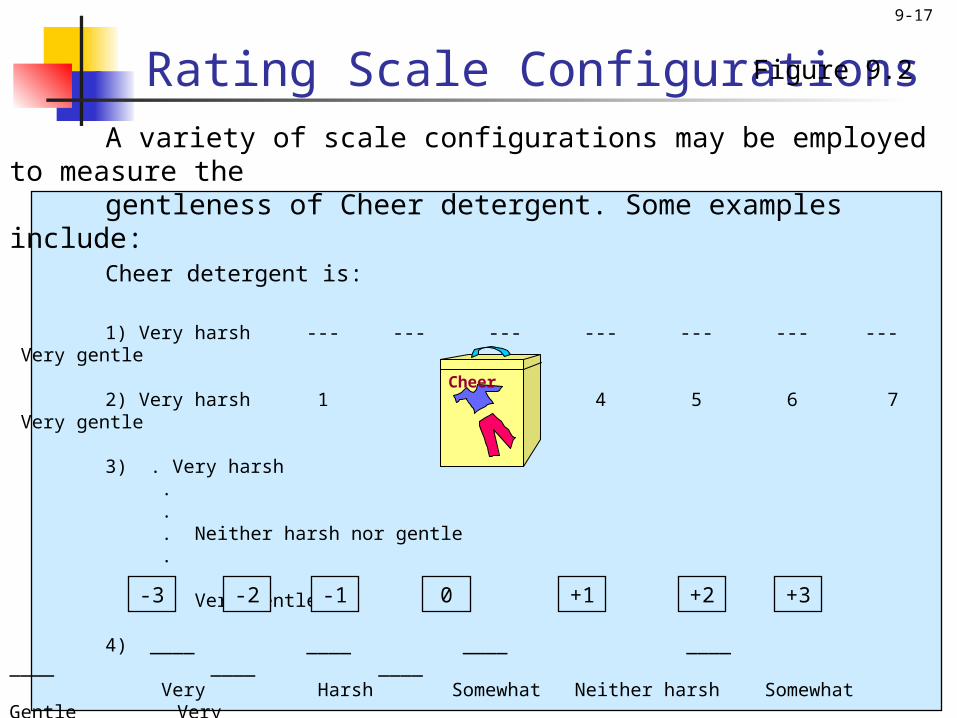
A variety of scale configurations may be employed to measure thegentleness of Cheer detergent. Some examples include:Cheer detergent is:
1) Very harsh --- --- --- --- --- --- --- Very gentle
2) Very harsh 1 2 3 4 5 6 7 Very gentle
3) . Very harsh . .
. Neither harsh nor gentle . . . Very gentle
4) ____ ____ ____ ____ ____ ____ ____ Very Harsh Somewhat Neither harsh Somewhat Gentle Very harsh Harsh nor gentle gentle gentle
5) Very Neither harsh Very
harsh nor gentle gentle
Rating Scale ConfigurationsFigure 9.2
-3 -1 0 +1 +2-2 +3
Cheer
9-18
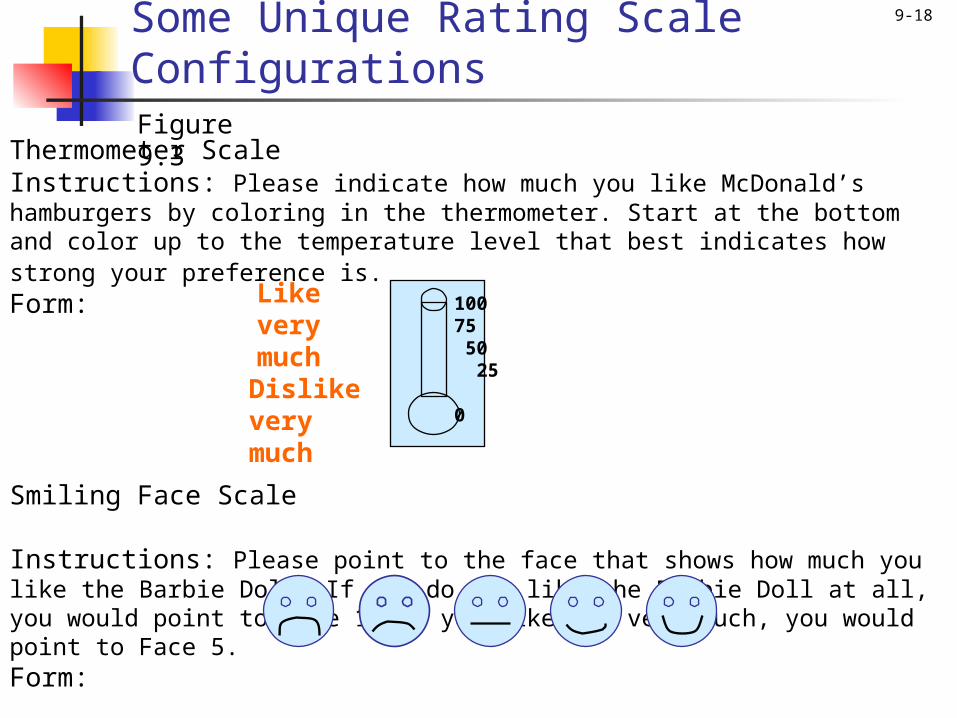
Thermometer ScaleInstructions: Please indicate how much you like McDonald’s hamburgers by coloring in the thermometer. Start at the bottom and color up to the temperature level that best indicates how strong your preference is. Form:
Smiling Face Scale Instructions: Please point to the face that shows how much you like the Barbie Doll. If you do not like the Barbie Doll at all, you would point to Face 1. If you liked it very much, you would point to Face 5. Form:
1 2 3 4 5
Figure 9.3
Like very much
Dislike very much
100 75 50 25 0
Some Unique Rating Scale Configurations

9-19
Scale EvaluationFigure 9.5
Discriminant
Nomological
Convergent
Test/ Retest
Alternative Forms
Internal Consistenc
y
Content
Criterion Construct
Generalizability
Reliability Validity
Scale Evaluation
9-20
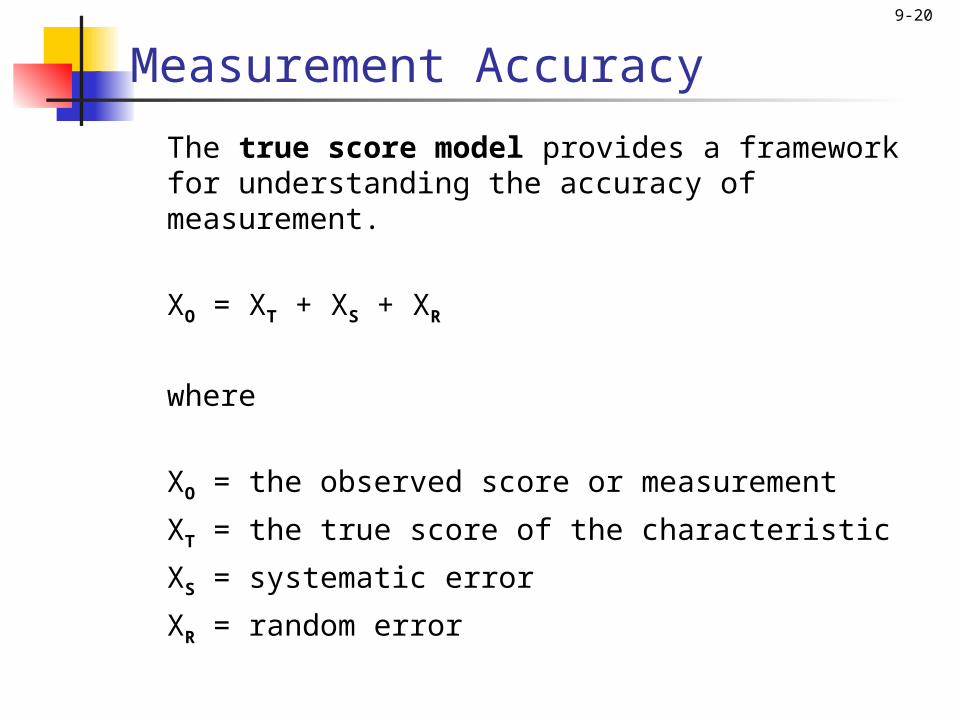
Measurement Accuracy
The true score model provides a framework for understanding the accuracy of measurement.
XO = XT + XS + XR
where
XO = the observed score or measurement
XT = the true score of the characteristic
XS = systematic error
XR = random error
9-21
Reliability
Reliability can be defined as the extent to which measures are free from random error, XR. If XR = 0, the measure is perfectly reliable.
In test-retest reliability, respondents are administered identical sets of scale items at two different times and the degree of similarity between the two measurements is determined.
In alternative-forms reliability, two equivalent forms of the scale are constructed and the same respondents are measured at two different times, with a different form being used each time.
9-22
Reliability Internal consistency reliability determines
the extent to which different parts of a summated scale are consistent in what they indicate about the characteristic being measured.
In split-half reliability, the items on the scale are divided into two halves and the resulting half scores are correlated.
The coefficient alpha, or Cronbach's alpha, is the average of all possible split-half coefficients resulting from different ways of splitting the scale items. This coefficient varies from 0 to 1, and a value of 0.6 or less generally indicates unsatisfactory internal consistency reliability.
9-23
Validity The validity of a scale may be defined as the
extent to which differences in observed scale scores reflect true differences among objects on the characteristic being measured, rather than systematic or random error. Perfect validity requires that there be no measurement error (XO = XT, XR = 0, XS = 0).
Content validity is a subjective but systematic evaluation of how well the content of a scale represents the measurement task at hand.
Criterion validity reflects whether a scale performs as expected in relation to other variables selected (criterion variables) as meaningful criteria.
9-24
Validity Construct validity addresses the question of
what construct or characteristic the scale is, in fact, measuring. Construct validity includes convergent, discriminant, and nomological validity.
Convergent validity is the extent to which the scale correlates positively with other measures of the same construct.
Discriminant validity is the extent to which a measure does not correlate with other constructs from which it is supposed to differ.
Nomological validity is the extent to which the scale correlates in theoretically predicted ways with measures of different but related constructs.