measuring commodity-level trade costs in asia · measuring commodity-level trade costs in asia: ......
TRANSCRIPT

Measuring CommodityMeasuring Commodity--Level Level Trade Costs in Asia: Trade Costs in Asia: The Basis for Effective Trade FacilitationThe Basis for Effective Trade Facilitation
Shintaro HamanakaShintaro HamanakaOffice of Regional Economic Integration Office of Regional Economic Integration Asian Development BankAsian Development Bank
ARTNeT Conference on Empirical and Policy Issues of ARTNeT Conference on Empirical and Policy Issues of Integration in Asia and the PacificIntegration in Asia and the Pacific11--2 November 2012, Colombo, Sri Lanka2 November 2012, Colombo, Sri Lanka

OutlineOutline
The IssueThe Issue Review of Doing Business (DB)Review of Doing Business (DB) Trade Cost Measurement using Trade StatisticsTrade Cost Measurement using Trade Statistics Complementarity between DB and StatisticsComplementarity between DB and Statistics--based based
Trade CostTrade Cost Alternative Indicators of Trade Facilitation ReformsAlternative Indicators of Trade Facilitation Reforms Some Analysis using StatisticsSome Analysis using Statistics--based Trade Costbased Trade Cost

The IssueThe Issue
Lowering trade cost is critical to increase tradeLowering trade cost is critical to increase trade MFN of Asian countries declined: 12.4% in 2000 > 8.4% in 2009; TMFN of Asian countries declined: 12.4% in 2000 > 8.4% in 2009; The he
problem is nonproblem is non--tariff barriers tariff barriers Developing countries cannot export, not because of low competitiDeveloping countries cannot export, not because of low competitiveness veness
but because of high trade costbut because of high trade cost
How to measure trade cost? How to measure trade cost? Many studies estimate level and impact of trade costMany studies estimate level and impact of trade cost Only a limited number of studies measure trade costOnly a limited number of studies measure trade cost
LongLong--term commodityterm commodity--level indicator is necessary:level indicator is necessary: To draw up trade facilitation reform policyTo draw up trade facilitation reform policy To assess the impact of trade facilitation reformTo assess the impact of trade facilitation reform

Overview of Doing BusinessOverview of Doing Business
Widely used surveyWidely used survey--based trade facilitation measurementbased trade facilitation measurement Financial cost, time, number of documentsFinancial cost, time, number of documents
Designed for crossDesigned for cross--country comparison, not for time country comparison, not for time series analysisseries analysis
Historical data set always revised/updatedHistorical data set always revised/updated Time lag: DB 2011Time lag: DB 2011 Released in November 2010Released in November 2010 Data collection completed by June 2010Data collection completed by June 2010 Responses to questionnaire by February 2010Responses to questionnaire by February 2010

Major Problems of DBMajor Problems of DB
Beauty contestBeauty contest Survey contributors Survey contributors local freight forwarders, shipping lines, customs brokers, port and
customs officials, and banks Exporting firms themselves do not contribute any information
Inconsistency between WB Doing Business and WB Inconsistency between WB Doing Business and WB Enterprise Survey (Baker 2010)Enterprise Survey (Baker 2010) Both surveys include the question on number of days exports takeBoth surveys include the question on number of days exports take to to
clear ports and customs, but correlation between the two is veryclear ports and customs, but correlation between the two is very low low (0.13)(0.13)

Procedures and Costs Covered by DBProcedures and Costs Covered by DB
Procedures (PreProcedures (Pre--shipment activities)shipment activities) Packing of goods in seller’s warehouse Inland carriage and handling Terminal (port) handling, including storage if a certain storage period is required Customs, inspections, and technical control All other services performed until departure from port of exit
Costs Costs Documentation fees Administrative fees for customs clearance and technical control Customs broker fees Terminal handling fees Inland transport costs Other costs of required services until departure from port of exit

Assumptions Employed by DBAssumptions Employed by DB Assumptions regarding cargos
Dry cargo 20-foot container 10-ton container Value at US$20,000 Leading trading item chosen from six commodity groups (but no commodity level
data) Textile; Coffee; Electrical equipment; Industrial equipment; Telecommunication
equipment; Metal Assumptions regarding trading firms
More than 60 employees Exports at least 10 percent of the sales Domestically-owned
Assumptions regarding the route Ocean transport From most populated city Through the main port (in the case of landlocked: a port in a neighbor country) To the country’s largest overseas trading partner
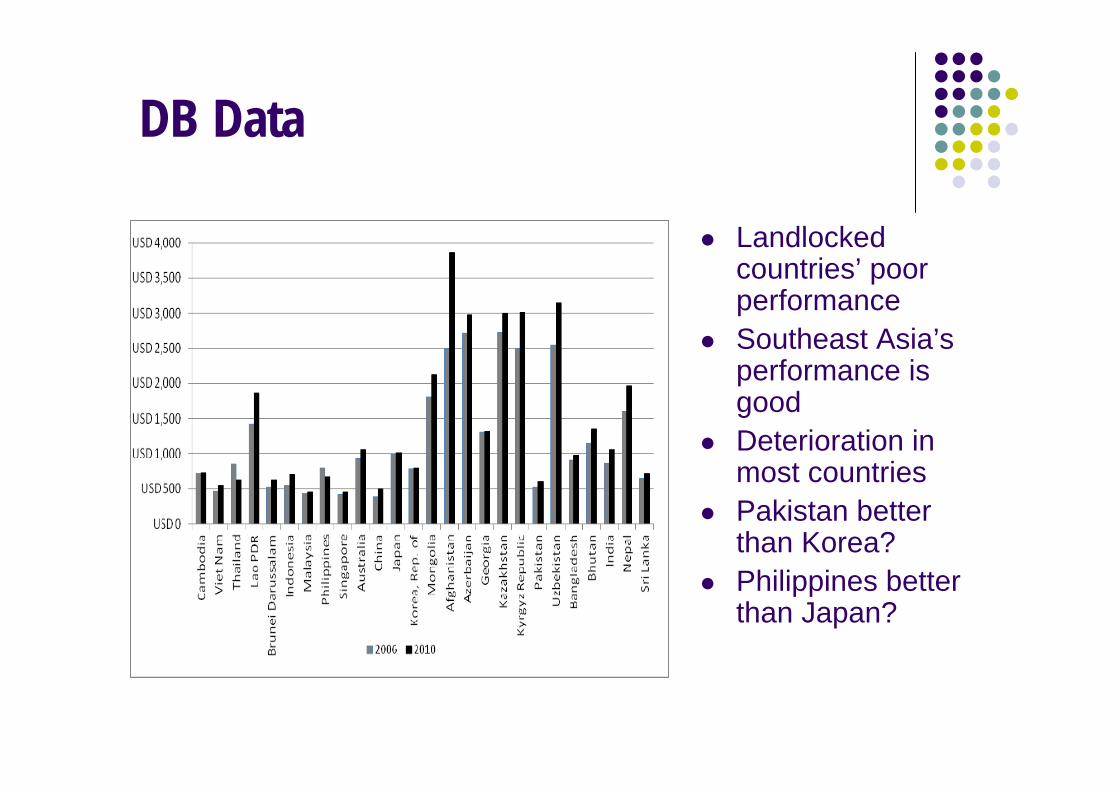
DB Data
Landlocked countries’ poor performance
Southeast Asia’s performance is good
Deterioration in most countries
Pakistan better than Korea?
Philippines better than Japan?

Trade Cost using Trade Statistics: Trade Cost using Trade Statistics: Traditional Mirror ComparisonTraditional Mirror Comparison
The traditional mirror method compares: The traditional mirror method compares: Country ACountry A’’s FOB export figures to Country Bs FOB export figures to Country B Country BCountry B’’s CIF import figures from Country As CIF import figures from Country A
Difference is regarded as trade costsDifference is regarded as trade costs Very problematic because quantity of mirror statistics does not Very problematic because quantity of mirror statistics does not
match match Transit tradeTransit trade Informal trade (smuggling)Informal trade (smuggling)
Difference includes not only trade costs (transport, insurance) Difference includes not only trade costs (transport, insurance) but but also includes various statistical discrepancy also includes various statistical discrepancy

SameSame--side CIFside CIF--FOB RatioFOB Ratio
Several countries publish import figures in both CIF and Several countries publish import figures in both CIF and FOBFOB Those include: US; Australia; Chile; Brazil; New ZealandThose include: US; Australia; Chile; Brazil; New Zealand Only New Zealand data is freeOnly New Zealand data is free
There is no There is no ““quantity problemquantity problem”” because data is from one because data is from one customs officecustoms office
Trade Cost Trade Cost = (CIF import = (CIF import –– FOB import) / FOB importFOB import) / FOB import
Both aggregateBoth aggregate--level and commoditylevel and commodity--levellevel International sectors onlyInternational sectors only
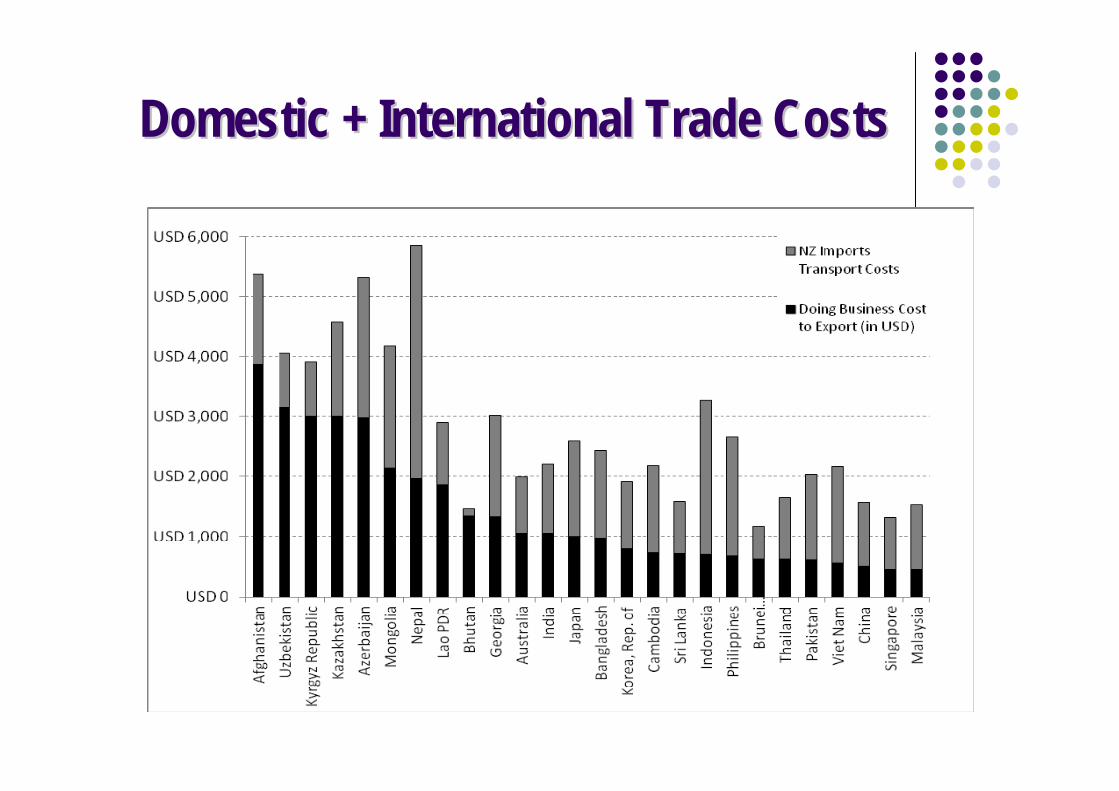
Domestic + International Trade CostsDomestic + International Trade Costs

Alternative Indicator of ReformsAlternative Indicator of Reforms
Good performers in terms of DB are good performers in statisticsGood performers in terms of DB are good performers in statistics--based trade costbased trade cost
Why: If a port is congested, both international and domestic Why: If a port is congested, both international and domestic processes are prolonged, which has financial implicationsprocesses are prolonged, which has financial implications
Airport analogy: When an airport is congestedAirport analogy: When an airport is congested---- Airplanes need to circle around before landingAirplanes need to circle around before landing Takes long time to arrive at a pier Takes long time to arrive at a pier Long immigrationLong immigration Long baggage claimLong baggage claim Long customs clearance etc.Long customs clearance etc.
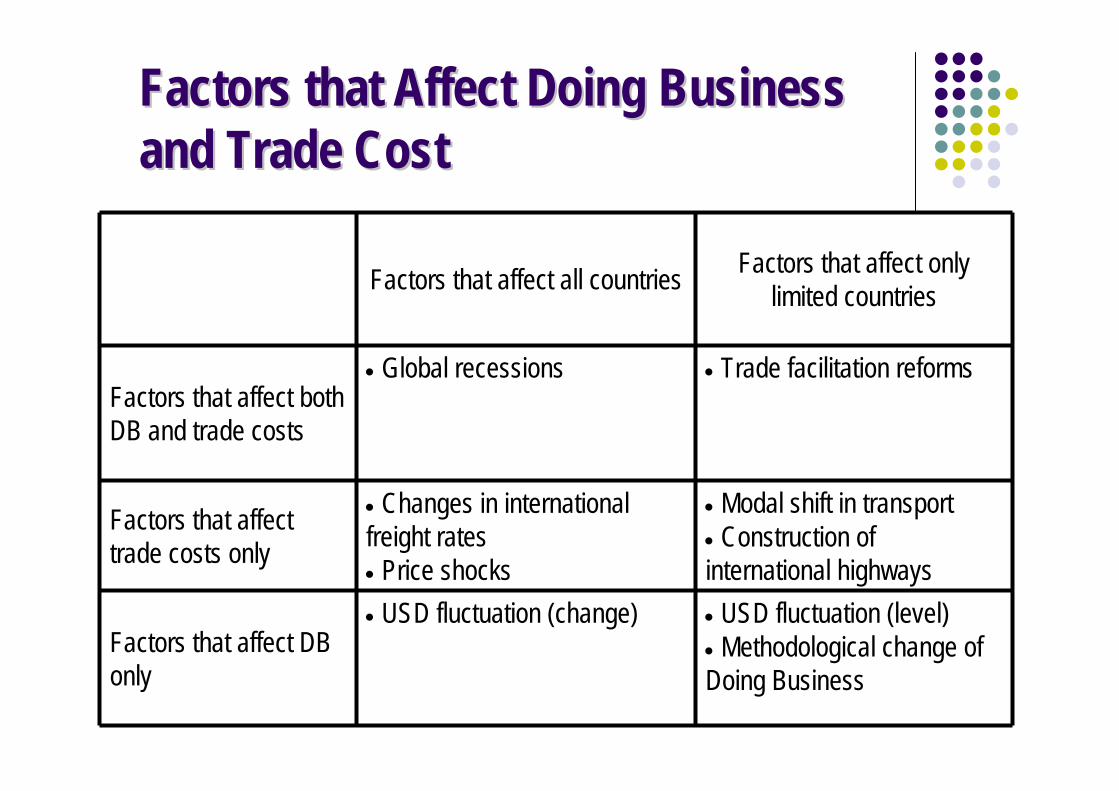
Factors that Affect Doing Business Factors that Affect Doing Business and Trade Costand Trade Cost
Factors that affect all countries Factors that affect only limited countries
Factors that affect both DB and trade costs
Global recessions Trade facilitation reforms
Factors that affect trade costs only
Changes in international freight rates Price shocks
Modal shift in transport Construction of international highways
Factors that affect DB only
USD fluctuation (change) USD fluctuation (level) Methodological change of Doing Business
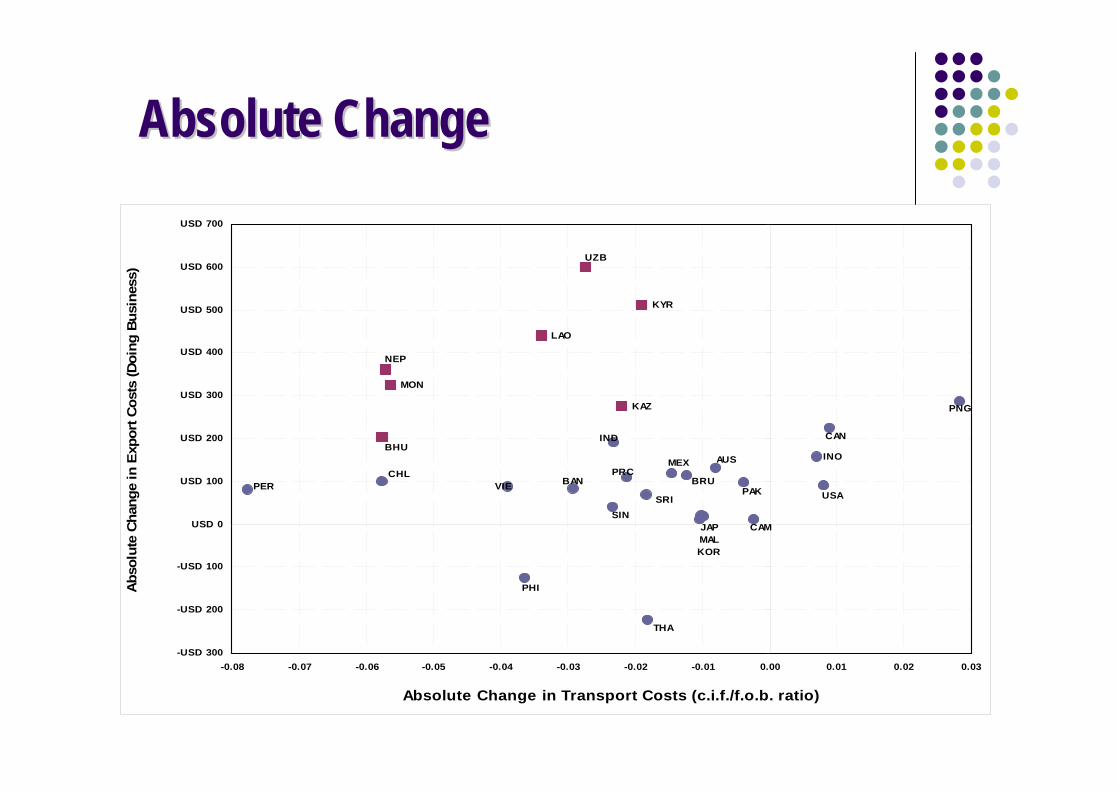
Absolute ChangeAbsolute Change
USA
PNG
PER
MEXCHL
CAN
THA
PHI
JAPMALKOR
CAMSIN
SRI
BANVIE PAK
PRCBRU
AUS INO
INDBHU
KAZ
MON
NEP
LAO
KYR
UZB
-USD 300
-USD 200
-USD 100
USD 0
USD 100
USD 200
USD 300
USD 400
USD 500
USD 600
USD 700
-0.08 -0.07 -0.06 -0.05 -0.04 -0.03 -0.02 -0.01 0.00 0.01 0.02 0.03
Absolute Change in Transport Costs (c.i.f./f.o.b. ratio)
Abs
olut
e Ch
ange
in E
xpor
t Cos
ts (D
oing
Bus
ines
s)

Percentage ChangePercentage Change
USA
PNG
PER
MEX
CHL CAN
THA
PHI
MALKOR
CAM
JAP
SIN
SRI
BAN
VIE PAK
PRC
BRU
AUS
INO
IND
BHU
KAZ
MON
NEP
LAO
KYR
UZB
-0.30
-0.20
-0.10
0.00
0.10
0.20
0.30
0.40
0.50
-1.00 -0.80 -0.60 -0.40 -0.20 0.00 0.20 0.40 0.60
Percentage Change in Transport Costs (c.i.f./f.o.b. ratio)
Perc
enta
ge C
hang
e in
Exp
ort C
osts
(Doi
ng B
usin
ess)

Use of StatisticsUse of Statistics--Based Trade Cost in Based Trade Cost in Conjunction with DBConjunction with DB
Trade Facilitation reforms can be captured not only by Trade Facilitation reforms can be captured not only by DB but also by statisticsDB but also by statistics--based trade costbased trade cost
Advantage of using statistics based trade costAdvantage of using statistics based trade cost Longer time series Longer time series Doing Business is not suitable for time series analysisDoing Business is not suitable for time series analysis Doing Business started in 2006 Doing Business started in 2006
CommodityCommodity--level figures level figures

StatisticsStatistics--based Trade Costbased Trade Cost

Declining Trend of Trade CostDeclining Trend of Trade Cost
2002 2006 2010 No. of countriesHighest 2nd highest Lowest 9Highest Lowest 2nd highest 02nd highest Highest Lowest 92nd highest Lowest Highest 2Lowest 2nd highest Highest 1Lowest Highest 2nd highest 3No data in at least one year 4Total 28

Aggregate level
0.00
0.04
0.08
0.12
0.16
0.20
2001 2002 2003 2004 2005 2006 2007 2008 2009 2010Thailand Viet Nam Cambodia
Very different trend and level. This is partly
because the composition of exports are different
Only Thailand has a clear trend Perhaps trade
amount does matter

Textile
0.00
0.04
0.08
0.12
0.16
0.20
2001 2002 2003 2004 2005 2006 2007 2008 2009 2010Thailand Viet Nam Cambodia
Thailand and Viet Nam: Very similar trend Due to production
network? Higher level does
not seems to imply higher trade costs due to inefficiency Perhaps high-end
products

Footwear
0.00
0.04
0.08
0.12
0.16
0.20
2001 2002 2003 2004 2005 2006 2007 2008 2009 2010Thailand Viet Nam Cambodia
Thailand and Viet Nam: Very similar trend
Cambodia: Increasing trend

Vegetables
0.00
0.04
0.08
0.12
0.16
0.20
2001 2002 2003 2004 2005 2006 2007 2008 2009 20100.00
0.20
0.40
0.60
0.80
1.00
Thailand Viet Nam Cambodia
Levels are very different
Perhaps very different kind of vegetables. The more
disaggregated level, the more likely we compare different products

ConclusionConclusion
DB has several inherent weaknessesDB has several inherent weaknesses StatisticsStatistics--based trade cost also reflect trade facilitation reformsbased trade cost also reflect trade facilitation reforms Longer time series and commodityLonger time series and commodity--level trade cost is available level trade cost is available
in the case of statisticsin the case of statistics--based trade cost based trade cost In using StatisticsIn using Statistics--based trade cost, we should bear in mind based trade cost, we should bear in mind
that: that: Change in trend (not level) should be compared across countries Change in trend (not level) should be compared across countries The lower the breakdown is, the more likely different products aThe lower the breakdown is, the more likely different products are re
compared compared

Future Issues Future Issues
Further research Further research Further detailed analysis on the comparison of DB data and statiFurther detailed analysis on the comparison of DB data and statisticsstics--
based trade cost in terms of changebased trade cost in terms of change Examination of factors that affect DB and/or statisticsExamination of factors that affect DB and/or statistics--based trade costbased trade cost
Use of trade statistics compiled by countries other than New ZeaUse of trade statistics compiled by countries other than New Zealand land More commodities to be studied More commodities to be studied
What explains the variation of discrepancy? What explains the variation of discrepancy?
Construction of database on trade costs? Construction of database on trade costs? Specific commoditySpecific commodity--level actual trade costs seems to be useful for policy level actual trade costs seems to be useful for policy
making. making.

Further Details
Article in Journal of International Commerce, Economics and Policy (JICEP), 3(2). 2012 May
ADB Working Paper Series on Regional Economic Integration No. 95: Measuring Commodity-Level Trade Costs in Asia - The Basis for Effective Trade Facilitation Policies in the Region