measuring customer satisfaction using ordinal variables...
TRANSCRIPT
Statistica Applicata Vol. 20, n. 3-4, 2008 331
MEASURING CUSTOMER SATISFACTION USINGORDINAL VARIABLES:
AN APPLICATION IN A SURVEY ON A CONTACT CENTER
Sergio Zani*, Lara Berzieri**
* Dipartimento di Economia, Università degli Studi di Parma, [email protected]** Ufficio di Statistica, Comune di Parma, [email protected]
Abstract
This paper deals with the problem of measuring Customer Satisfaction using severalordinal variables with different number of categories. Some multivariate methods areapplied to the results of a survey on the users of the Contact Center of the Municipality ofParma, in order to measure the quality of the service and the citizen satisfaction. Differentapproaches for the quantification of ordinal responses are considered and compared. Theresults show that the multidimensional approach yields a more appropriate estimate forclasses of unsatisfied, fairly satisfied and very satisfied respondents.
Keywords: Quantification of ordinal variables, Nonlinear Principal Component Analysis,k-means clustering, overall satisfaction.
1. INTRODUCTION
Customer Satisfaction (CS) is a key performance indicator of the activity ofa firm or a corporation (for a recent review see e.g. Fornel, 2008). CS is an abstractterm and can be considered as a latent variable. The usual measures of CS involvea survey with a set of questions. The overall satisfaction may be measured by asingle direct question or by several manifest variables relating to the differentdomains of satisfaction (Montinaro and Chirico, 2006). These variables are oftenon ordinal scale with different numbers of categories (binary, Likert scale with 5 or7 modalities, scores from 1 to 10, and so on) (De Luca, 2007).
Generally, the responses to the items are scored 0, 1 (for two orderedcategories); or 1, 2, 3 (for three ordered categories); or 1, 2, 3, 4, 5 (for Likert scales)and so on, to indicate increasing levels of CS.
In the literature different approaches have been suggested to analyze this kindof data:
332 Zani S., Berzieri L.
• a priori quantification of each ordinal variable before applying multivariatemethods (see e.g. Rizzi, 2008, for the Italian contributions to this topic, and forrecent works: Gallo, 2007; Manisera, 2007);
• the estimation of scores of qualitative variables within iterative algorithms ofstatistical modelling (Tenenhaus and Young, 1985; Lauro and Esposito Vinzi,2002; Tenenhaus et al., 2005; Lauro et al., 2008);
• latent variables models with ordinal variables (Gifi, 1990; Joreskog and Moustaki,2001; Cagnone and Mignani, 2009; Ferrari and Manzi, 2010);
• Rasch Analysis (Rasch, 1980; Andrich, 1988; Brentari et al., 2007; De Battistiet al., 2010);
• a class of stochastic models for ordinal variables (Piccolo and D’Elia, 2008;Piccolo, 2009; Iannario and Piccolo, 2010);
This paper deals with the problem of measuring the perception of publicservice quality (Lauro et al., 1997; Gori and Vittadini, 1999; Istat, 2001; Office ofPublic Service Reform, 2002; Carpita et al., 2006). We analyze the results of asurvey on a sample of 1,200 users of the Contact Center of Parma Municipality. Thepurpose is to answer to the following questions:1) What is the association between the different “dimensions” (items, attributes)
of the citizen satisfaction?2) Which are the most important manifest variables to set the perceived quality of
the services of the Contact Center?3) How the manifest variables can be weighted in order to obtain a synthetic
indicator of customer satisfaction?4) What are the features of the clusters of the very satisfied, satisfied and
unsatisfied citizens?Therefore, this research may be considered in the context of VIR (Verification
of Impact of Regulation), because it deals with the ex post evaluation of theeffectiveness and efficiency of the choices of the Public Administrations.
The paper is organized as follows. Section 2 briefly presents the IQUELnational research project and the features of the survey on citizen satisfaction.Section 3 shows the main results of the survey using a new simple graphical method:the pyramid of customer satisfaction. The level of association between pairs ofvariables is also presented. In section 4 overall indicators of customer satisfactionare obtained, applying linear and nonlinear principal component analysis to themanifest variables; the scores of these techniques are compared with the scores ofthe direct question on total quality. In Section 5 a new criterion of quantification ofthe ordinal variables is suggested. Section 6 proposes a classification of the usersinto homogeneous clusters using k-means algorithm. Section 7 concludes.
Measuring customer satisfaction using ordinal variables: an application in survey… 333
2. THE IQUEL NATIONAL PROGRAM AND THE CUSTOMERSATISFACTION SURVEY
The acronym IQUEL means “Innovazione e Qualità per gli Enti Locali”(Innovation and quality for local government agencies) and it is a national program,financed by the Italian Council of Ministers in 2008. The work group leader isParma Municipality. The group is formed by several local governments: the RegionEmilia-Romagna, the Municipalities of Bologna, Firenze, Modena, Piacenza,Reggio-Emilia; the Provinces of Padova, Brescia, Chieti, Parma, Pesaro-Urbino,Rimini, Vicenza and also the Department of Economics of the University of Parmaand the Departments of Statistics of the University of Firenze and Padova).
The principal aim of the project is to define a monitoring system to evaluatethe public service quality, by using a peculiar software and other information andcommunication technologies.
The tools created will be used to control the performance achieved, in termsof efficacy, efficiency and customer satisfaction and also to promote a benchmarkingprocess among local governments, to identify and share the results with the bestpractices. Thanks to standardized methodologies, IQUEL will help local governmentagencies to learn from first-class experiences.
One step of the project is to create a system of Customer RelationshipManagement (CRM) suitable for Public Administration, in order to collect all thedata, coming from different sources (telephone, e-mail, sms), related to citizens andcompanies, using all the information to satisfy the needs of the citizens. That’s whyParma Municipality opened in 2008 a Contact Center, that is more than a call center:it is a real CRM instrument.
In this context, a sample survey was planned in order to measure thesatisfaction of the users of the Contact Center. The questionnaire was prepared andinitially tested on about 100 users. It is divided into 3 sections: the first containsgeneral questions on the service used; the second is based on the reason for calling,which can be a request of information, a request of a specific person or office, acommunication of a problem; the third one refers to a summary judgment (opinion)on the Contact Center service and also contains a few data of the respondent.
Stratification is the sampling method used, so that the sample compositionreflects the whole structure of the population of the study. The subpopulations(strata) are defined on the basis of 2 variables: type of user (citizen or organisation)and reason for calling.
The random sample was extracted from the list of the users calling the ContactCenter, in February and March 2009 .
The survey was conducted by Delos, a company operating in Bologna, usingthe method CATI (Computer Assisted Telephone Interview).

334 Zani S., Berzieri L.
The total amount of interviews was fixed at 1,200; this wide sample sizepermits to obtain reliable information for each municipality department, such asdemographic and social services, building, trade, and so on. The respondent rate was58% of the contact attempts. The remaining 42% was separated into 2 groups: peoplewho refused the interview (19%) and persons not found, even after a few telephonecalls. Non respondents were replaced by other names belonging to the same stratum.
Examining the main features of the respondents, we can notice that citizensare about 85% and companies about 15%; females 64% and males 36%. About 48%of the respondents are in the age class 40-64. These features are very similar to theones of the whole population of the Contact Center users.
3. VISUALIZATION OF THE MAIN RESULTS AND RELATIONSBETWEEN THE “DIMENSIONS” OF CS
The data set of 1,200 respondents is partitioned into three groups withreference to the reason for the telephone call: request of information, search of aspecific office or person, communication of a problem (in public services). Theanalysis is carried out for the whole sample and for each group of respondents.
For lack of space, in this paper we examine only the first subset, formed by704 units calling for information. See Zani, Riani and Berzieri (2009) for acomplete analysis.
The general questions on the quality of the service are:• Contact at the first call (no, yes) (CONTACT)• Waiting time (too long, normal, fairly short) (WAITING)• Courtesy of the operator (COURTESY)• Skill of the operator (SKILL)• The specific questions for this subset of respondents are:• Quality of the information provided by the operator (QUALITY)• Speed of the information (SPEED)• Complete answer (no, partly, yes) (COMPLETE)
All the variables whose modalities are not specified are measured on a Likertscale (very dissatisfied, dissatisfied, neither satisfied nor dissatisfied, satisfied, verysatisfied).
In addition, the overall satisfaction for the service of the Contact Center ismeasured by a direct question with scores from 1 to 10 (OVERALL).
A simple figure can show the main results of the survey for the subset ofcitizens asking for information. We order the variables with reference to theirnumber of modalities (from 2 to 10) and represent each variable by a proportional

Measuring customer satisfaction using ordinal variables: an application in survey… 335
bar. At the top there is the variable CONTACT with two categories, at the bottomthe variable OVERALL with ten scores, whose bar is about five time longer thanthe first. We call this plot “the pyramid of the customer satisfaction” (Fig. 1) becauseit shows the different aspects of the quality, highlighting the number of categoriesof each item. The very dissatisfied and the dissatisfied respondents are on the leftside, the satisfied and very satisfied users are on the right. Using different coloursinstead of grids (e.g. green for very satisfied, red for very dissatisfied, and othersuitable colours for intermediate categories) the figure is much more expressive: thearea of satisfaction with reference to the different dimensions is immediatelyvisualized.
Tab. 1 presents the values of the Kendall’s τ association index between pairsof variables representing the different aspects of the satisfaction and Tab. 2 showsthe correlation ratios between such variables and the scores of the overall satisfaction(e.g. Zani and Cerioli, 2007, chapter IV).
Tab. 1: Kendall’s τ association indexes.
CONTACT WAITING COURTESY SKILL QUALITY SPEED COMPLETE
CONTACT 1 0.234 0.134 0.186 0.158 0.246 0.213
WAITING 1 0.238 0.254 0.266 0.284 0.217
COURTESY 1 0.639 0.482 0.523 0.198
SKILL 1 0.641 0.607 0.312
QUALITY 1 0.714 0.448
SPEED 1 0.417
COMPLETE 1
Tab. 2: Pearson’s correlation ratios of the aspects of CS with OVERALL
CONTACT 0.240
WAITING 0.351
COURTESY 0.426
SKILL 0.544
QUALITY 0.552
SPEED 0.555
COMPLETE 0.428
The higher values of association are between QUALHƒY and SPEED, SKILLand QUALITY, COURTESY and SKILL. The variables CONTACT and WAITINGare poorly associated with the other dimensions of CS because 91% of the users getthe link at the first call and only 3.5% consider “too long” the waiting time.

336 Zani S., Berzieri L.
Fig. 1. The pyramid of the satisfaction for the users of the Contact Center
The variables SPEED, QUALITY and SKILL have the larger influence on theoverall CS. We point out that the variables with the smaller number of categoriesare those which show the weakest association.
Measuring customer satisfaction using ordinal variables: an application in survey… 337
4. METHODS FOR SUMMARIZING THE DIMENSIONS OFSATISFACTION
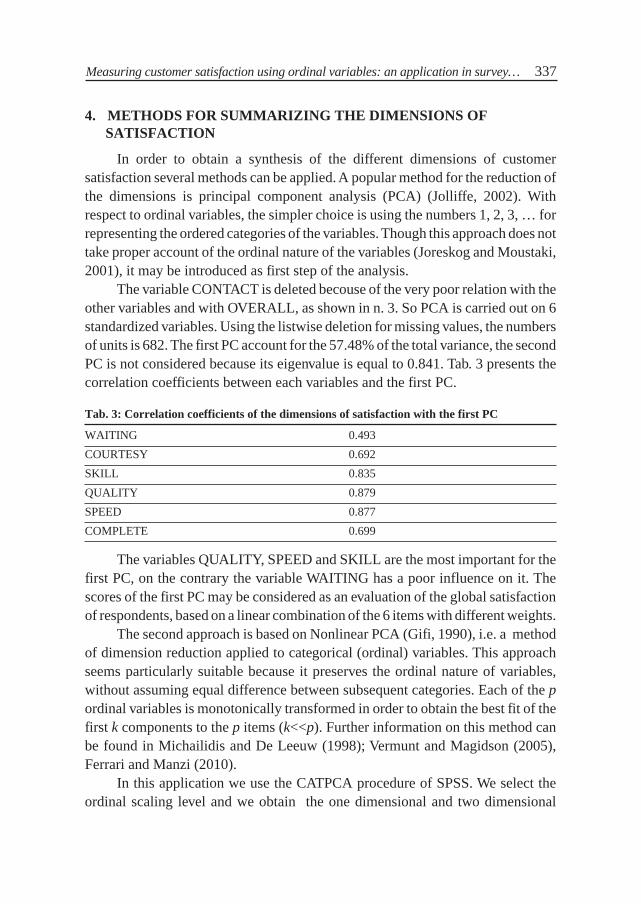
In order to obtain a synthesis of the different dimensions of customersatisfaction several methods can be applied. A popular method for the reduction ofthe dimensions is principal component analysis (PCA) (Jolliffe, 2002). Withrespect to ordinal variables, the simpler choice is using the numbers 1, 2, 3, … forrepresenting the ordered categories of the variables. Though this approach does nottake proper account of the ordinal nature of the variables (Joreskog and Moustaki,2001), it may be introduced as first step of the analysis.
The variable CONTACT is deleted becouse of the very poor relation with theother variables and with OVERALL, as shown in n. 3. So PCA is carried out on 6standardized variables. Using the listwise deletion for missing values, the numbersof units is 682. The first PC account for the 57.48% of the total variance, the secondPC is not considered because its eigenvalue is equal to 0.841. Tab. 3 presents thecorrelation coefficients between each variables and the first PC.
Tab. 3: Correlation coefficients of the dimensions of satisfaction with the first PC
WAITING 0.493
COURTESY 0.692
SKILL 0.835
QUALITY 0.879
SPEED 0.877
COMPLETE 0.699
The variables QUALITY, SPEED and SKILL are the most important for thefirst PC, on the contrary the variable WAITING has a poor influence on it. Thescores of the first PC may be considered as an evaluation of the global satisfactionof respondents, based on a linear combination of the 6 items with different weights.
The second approach is based on Nonlinear PCA (Gifi, 1990), i.e. a methodof dimension reduction applied to categorical (ordinal) variables. This approachseems particularly suitable because it preserves the ordinal nature of variables,without assuming equal difference between subsequent categories. Each of the pordinal variables is monotonically transformed in order to obtain the best fit of thefirst k components to the p items (k<<p). Further information on this method canbe found in Michailidis and De Leeuw (1998); Vermunt and Magidson (2005),Ferrari and Manzi (2010).
In this application we use the CATPCA procedure of SPSS. We select theordinal scaling level and we obtain the one dimensional and two dimensional
338 Zani S., Berzieri L.
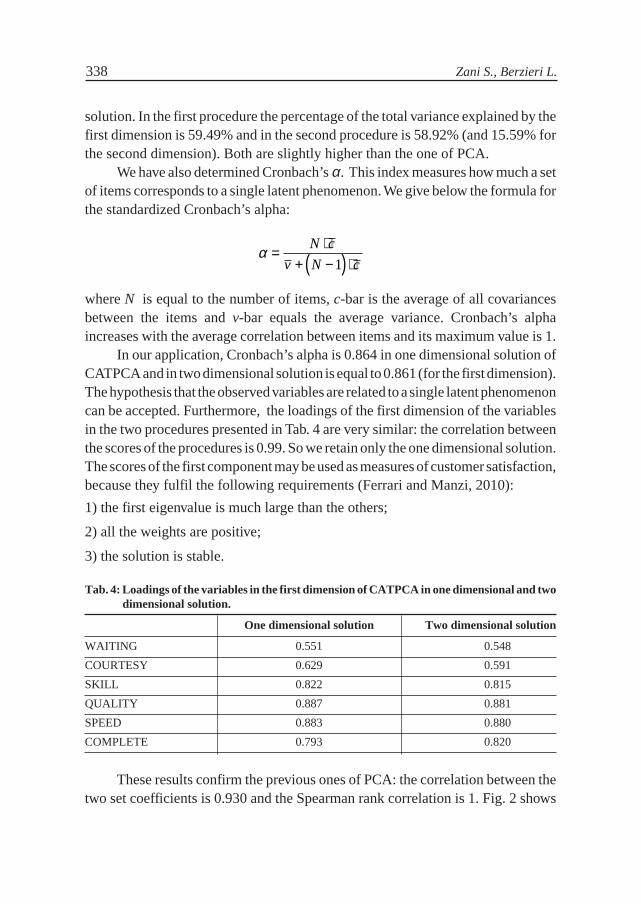
solution. In the first procedure the percentage of the total variance explained by thefirst dimension is 59.49% and in the second procedure is 58.92% (and 15.59% forthe second dimension). Both are slightly higher than the one of PCA.
We have also determined Cronbach’s α. This index measures how much a setof items corresponds to a single latent phenomenon. We give below the formula forthe standardized Cronbach’s alpha:
α =⋅
+ −( ) ⋅N c
v N c1
where N is equal to the number of items, c-bar is the average of all covariancesbetween the items and v-bar equals the average variance. Cronbach’s alphaincreases with the average correlation between items and its maximum value is 1.
In our application, Cronbach’s alpha is 0.864 in one dimensional solution ofCATPCA and in two dimensional solution is equal to 0.861 (for the first dimension).The hypothesis that the observed variables are related to a single latent phenomenoncan be accepted. Furthermore, the loadings of the first dimension of the variablesin the two procedures presented in Tab. 4 are very similar: the correlation betweenthe scores of the procedures is 0.99. So we retain only the one dimensional solution.The scores of the first component may be used as measures of customer satisfaction,because they fulfil the following requirements (Ferrari and Manzi, 2010):
1) the first eigenvalue is much large than the others;
2) all the weights are positive;
3) the solution is stable.
Tab. 4: Loadings of the variables in the first dimension of CATPCA in one dimensional and twodimensional solution.
One dimensional solution Two dimensional solution
WAITING 0.551 0.548
COURTESY 0.629 0.591
SKILL 0.822 0.815
QUALITY 0.887 0.881
SPEED 0.883 0.880
COMPLETE 0.793 0.820
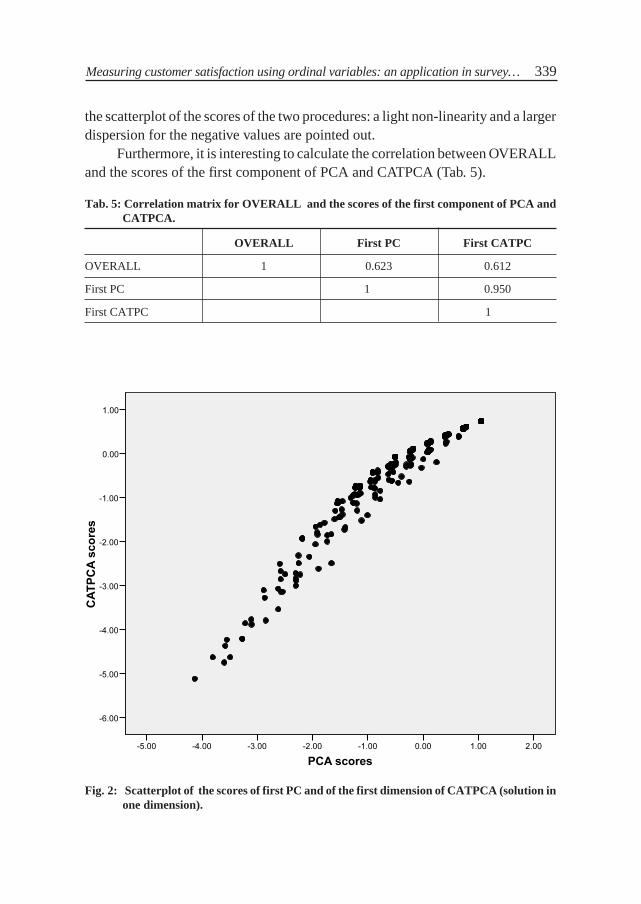
These results confirm the previous ones of PCA: the correlation between thetwo set coefficients is 0.930 and the Spearman rank correlation is 1. Fig. 2 shows
Measuring customer satisfaction using ordinal variables: an application in survey… 339
the scatterplot of the scores of the two procedures: a light non-linearity and a largerdispersion for the negative values are pointed out.
Furthermore, it is interesting to calculate the correlation between OVERALLand the scores of the first component of PCA and CATPCA (Tab. 5).
Tab. 5: Correlation matrix for OVERALL and the scores of the first component of PCA andCATPCA.
OVERALL First PC First CATPC
OVERALL 1 0.623 0.612
First PC 1 0.950
First CATPC 1
Fig. 2: Scatterplot of the scores of first PC and of the first dimension of CATPCA (solution inone dimension).

340 Zani S., Berzieri L.
Fig. 3: Scatterplot for the scores of OVERALL and the scores of first dimension of CATPCA(one dimensional solution).
The results of the two procedures of PCA are very similar, but the OVERALLscores directly stated by the respondents are fairly different from the synthesis ofdifferent items of satisfaction. This means that the directly perceived total qualitycannot be expressed as a simple linear combination of the items.
This result may be partially produced by a few non coherent answers to thesingle items and to the overall satisfaction question. In Fig. 3 the scatterplot ofOVERALL and first dimension of CATPCA is presented (scores 1, 2, 3 ofOVERALL are all considered as 3).
For the subset of units of each score of OVERALL the outliers are identifiedusing the boxplots (not shown for lack of space). Using this procedure we canidentify 22 atypical observations which we delete. In this “clean dataset” of 660units the correlation between OVERALL and the scores of CATPCA is 0.673 andit is slightly higher than the previous one influenced by the bivariate outliers.

Measuring customer satisfaction using ordinal variables: an application in survey… 341
5. A SIMPLE CRITERION OF QUANTIFICATION OF THE ORDINALVARIABLES
The level of customer satisfaction may be considered as a continuum, thatcannot be directly observed (see, among others, Manisera, 2007). It can beconventionally rescaled in the range from 0 to 1: zero is the score of the mostdissatisfied respondents and one is the score of the most satisfied users.
For each question related to the customer satisfaction, the score of thecategories of the corresponding ordinal variables may be fixed taking account of the(relative) frequencies. If the frequency of the first category (very dissatisfied) issmall, its score may be stated near to zero; on the contrary, if there are several verydissatisfied customers for this item, the score of this category must be higher,because its relative frequency corresponds to a longer interval in [0, 1]. And so onfor the other categories of the variables.
Therefore, a simple criterion of quantification is the mid-point of the cumu-lative function of the observed ordinal categories of the item.
With this criterion the scores of the categories present values in the interval[0, 1], their weighted mean is equal to 0.5 and they are equidistant if and only if theirfrequencies are equal. Otherwise, the scores are asymmetrical: the distance betweentwo subsequent scores of the lower (higher) categories is high if the quality of theitem is poor (rich), i.e. when the respondents are concentrated on the first (latest)categories.
In the literature different criteria (e.g. Rasch model, see Bond and Fox, 2007)and other probability distributions have been suggested (see Montinaro andChirico, 2006), but the method we propose is very simple, intuitive to understandand easy to use.
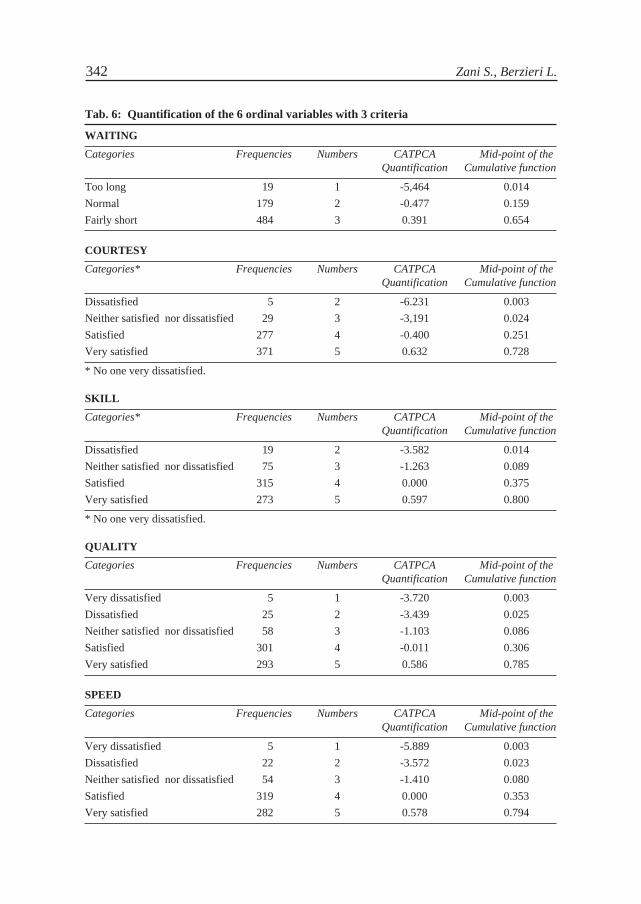
Tab. 6 presents for the 6 variables used in Section 4 the quantification of thecategories with natural numbers and the scores obtained by CATPCA and by thesuggested criterion based on the cumulative function. (For the variables COURTESYand SKILL nobody is very dissatisfied).
The weighted mean of the scores of CATPCA is equal to 0; on the contrary,the weighted mean of the mid-points of the cumulative function is 0.5.
342 Zani S., Berzieri L.
Tab. 6: Quantification of the 6 ordinal variables with 3 criteria
WAITING
Categories Frequencies Numbers CATPCA Mid-point of theQuantification Cumulative function
Too long 19 1 -5,464 0.014
Normal 179 2 -0.477 0.159
Fairly short 484 3 0.391 0.654
COURTESY
Categories* Frequencies Numbers CATPCA Mid-point of theQuantification Cumulative function
Dissatisfied 5 2 -6.231 0.003
Neither satisfied nor dissatisfied 29 3 -3,191 0.024
Satisfied 277 4 -0.400 0.251
Very satisfied 371 5 0.632 0.728
* No one very dissatisfied.
SKILL
Categories* Frequencies Numbers CATPCA Mid-point of theQuantification Cumulative function
Dissatisfied 19 2 -3.582 0.014
Neither satisfied nor dissatisfied 75 3 -1.263 0.089
Satisfied 315 4 0.000 0.375
Very satisfied 273 5 0.597 0.800
* No one very dissatisfied.
QUALITY
Categories Frequencies Numbers CATPCA Mid-point of theQuantification Cumulative function
Very dissatisfied 5 1 -3.720 0.003
Dissatisfied 25 2 -3.439 0.025
Neither satisfied nor dissatisfied 58 3 -1.103 0.086
Satisfied 301 4 -0.011 0.306
Very satisfied 293 5 0.586 0.785
SPEED
Categories Frequencies Numbers CATPCA Mid-point of theQuantification Cumulative function
Very dissatisfied 5 1 -5.889 0.003
Dissatisfied 22 2 -3.572 0.023
Neither satisfied nor dissatisfied 54 3 -1.410 0.080
Satisfied 319 4 0.000 0.353
Very satisfied 282 5 0.578 0.794

Measuring customer satisfaction using ordinal variables: an application in survey… 343
COMPLETE
Categories Frequencies Numbers CATPCA Mid-point of theQuantification Cumulative function
No 36 1 -3.858 0.026
Partly 50 2 -1.249 0.089Yes 596 3 0.268 0.563
The scatterplot in Fig. 4 shows the relationship between the pairs of the 3 kindsof scores e.g. of the variable QUALITY: the monotonic but non-linear relations ofthe scores obtained by the cumulative function are highlighted.
Fig. 4: Scatterplot of the 3 kinds of quantification of the variable QUALITY.
344 Zani S., Berzieri L.
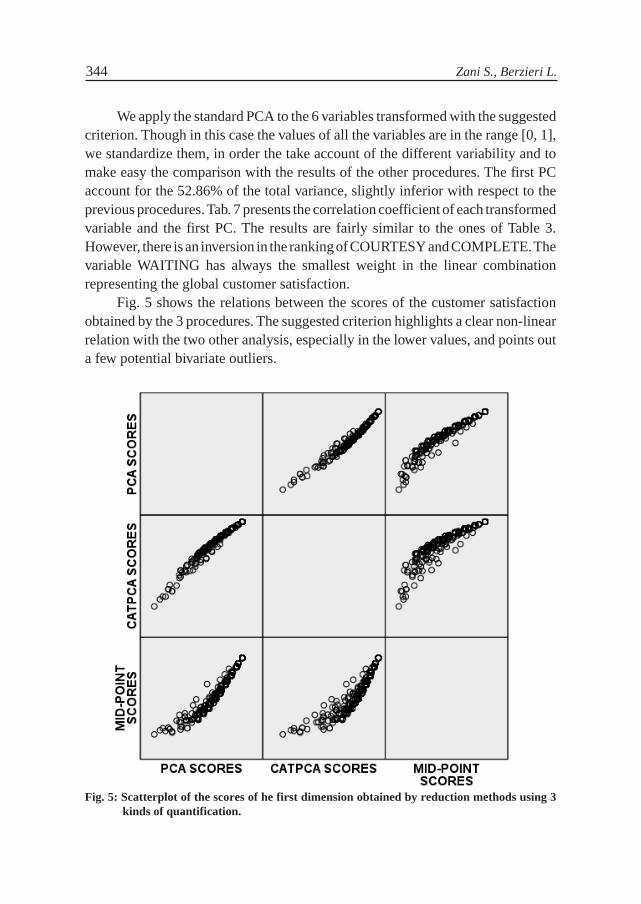
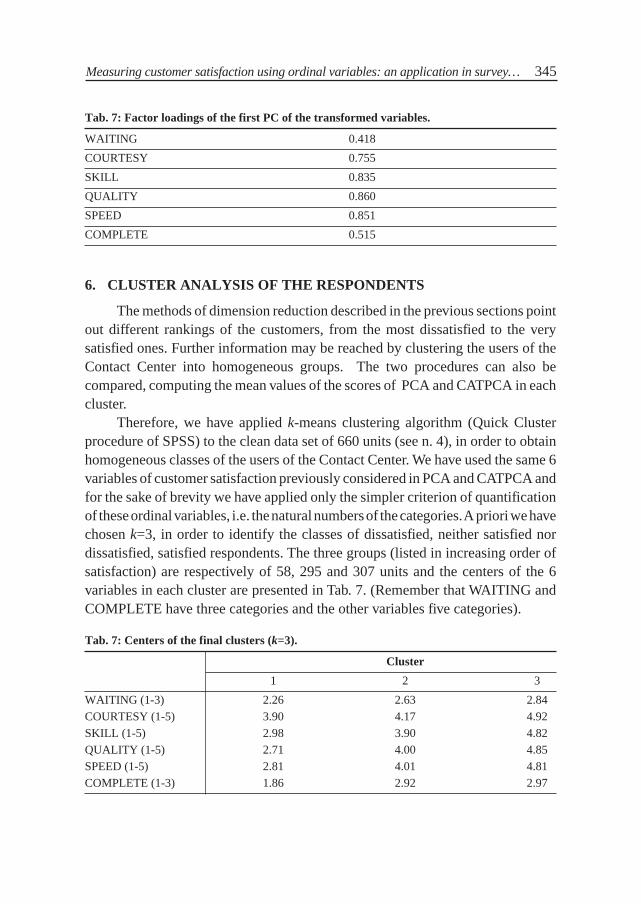
We apply the standard PCA to the 6 variables transformed with the suggestedcriterion. Though in this case the values of all the variables are in the range [0, 1],we standardize them, in order the take account of the different variability and tomake easy the comparison with the results of the other procedures. The first PCaccount for the 52.86% of the total variance, slightly inferior with respect to theprevious procedures. Tab. 7 presents the correlation coefficient of each transformedvariable and the first PC. The results are fairly similar to the ones of Table 3.However, there is an inversion in the ranking of COURTESY and COMPLETE. Thevariable WAITING has always the smallest weight in the linear combinationrepresenting the global customer satisfaction.
Fig. 5 shows the relations between the scores of the customer satisfactionobtained by the 3 procedures. The suggested criterion highlights a clear non-linearrelation with the two other analysis, especially in the lower values, and points outa few potential bivariate outliers.
Fig. 5: Scatterplot of the scores of he first dimension obtained by reduction methods using 3kinds of quantification.
Measuring customer satisfaction using ordinal variables: an application in survey… 345
Tab. 7: Factor loadings of the first PC of the transformed variables.
WAITING 0.418
COURTESY 0.755
SKILL 0.835
QUALITY 0.860
SPEED 0.851
COMPLETE 0.515
6. CLUSTER ANALYSIS OF THE RESPONDENTS
The methods of dimension reduction described in the previous sections pointout different rankings of the customers, from the most dissatisfied to the verysatisfied ones. Further information may be reached by clustering the users of theContact Center into homogeneous groups. The two procedures can also becompared, computing the mean values of the scores of PCA and CATPCA in eachcluster.
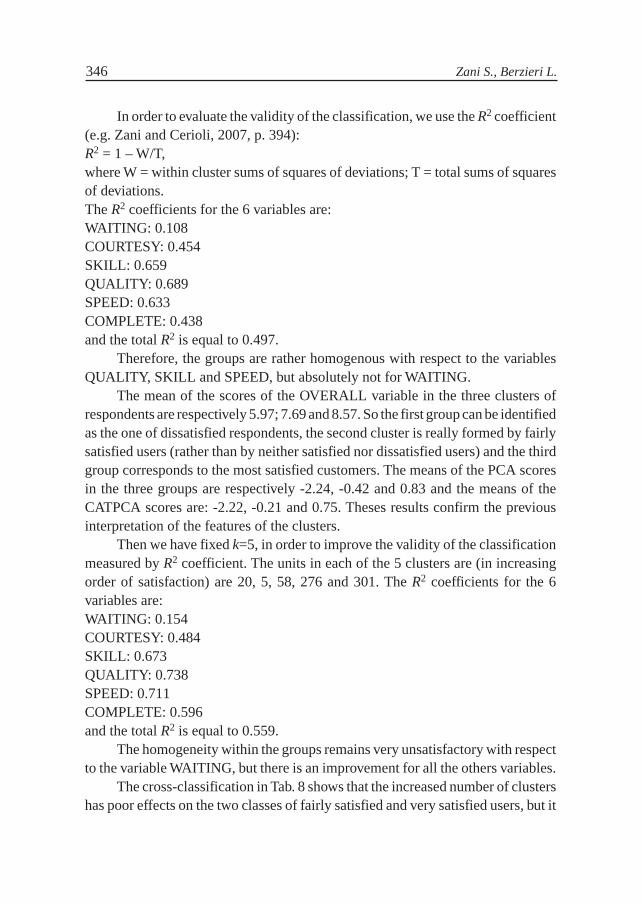
Therefore, we have applied k-means clustering algorithm (Quick Clusterprocedure of SPSS) to the clean data set of 660 units (see n. 4), in order to obtainhomogeneous classes of the users of the Contact Center. We have used the same 6variables of customer satisfaction previously considered in PCA and CATPCA andfor the sake of brevity we have applied only the simpler criterion of quantificationof these ordinal variables, i.e. the natural numbers of the categories. A priori we havechosen k=3, in order to identify the classes of dissatisfied, neither satisfied nordissatisfied, satisfied respondents. The three groups (listed in increasing order ofsatisfaction) are respectively of 58, 295 and 307 units and the centers of the 6variables in each cluster are presented in Tab. 7. (Remember that WAITING andCOMPLETE have three categories and the other variables five categories).
Tab. 7: Centers of the final clusters (k=3).
Cluster
1 2 3
WAITING (1-3) 2.26 2.63 2.84COURTESY (1-5) 3.90 4.17 4.92SKILL (1-5) 2.98 3.90 4.82QUALITY (1-5) 2.71 4.00 4.85SPEED (1-5) 2.81 4.01 4.81COMPLETE (1-3) 1.86 2.92 2.97
346 Zani S., Berzieri L.
In order to evaluate the validity of the classification, we use the R2 coefficient(e.g. Zani and Cerioli, 2007, p. 394):R2 = 1 – W/T,where W = within cluster sums of squares of deviations; T = total sums of squaresof deviations.The R2 coefficients for the 6 variables are:WAITING: 0.108COURTESY: 0.454SKILL: 0.659QUALITY: 0.689SPEED: 0.633COMPLETE: 0.438and the total R2 is equal to 0.497.
Therefore, the groups are rather homogenous with respect to the variablesQUALITY, SKILL and SPEED, but absolutely not for WAITING.
The mean of the scores of the OVERALL variable in the three clusters ofrespondents are respectively 5.97; 7.69 and 8.57. So the first group can be identifiedas the one of dissatisfied respondents, the second cluster is really formed by fairlysatisfied users (rather than by neither satisfied nor dissatisfied users) and the thirdgroup corresponds to the most satisfied customers. The means of the PCA scoresin the three groups are respectively -2.24, -0.42 and 0.83 and the means of theCATPCA scores are: -2.22, -0.21 and 0.75. Theses results confirm the previousinterpretation of the features of the clusters.
Then we have fixed k=5, in order to improve the validity of the classificationmeasured by R2 coefficient. The units in each of the 5 clusters are (in increasingorder of satisfaction) are 20, 5, 58, 276 and 301. The R2 coefficients for the 6variables are:WAITING: 0.154COURTESY: 0.484SKILL: 0.673QUALITY: 0.738SPEED: 0.711COMPLETE: 0.596and the total R2 is equal to 0.559.
The homogeneity within the groups remains very unsatisfactory with respectto the variable WAITING, but there is an improvement for all the others variables.
The cross-classification in Tab. 8 shows that the increased number of clustershas poor effects on the two classes of fairly satisfied and very satisfied users, but it

Measuring customer satisfaction using ordinal variables: an application in survey… 347
splits in 3 sub-classes the group of dissatisfied respondents. As already shown inFig. 2, this subset of respondents has a larger dispersion and is more heterogeneousthan that of the satisfied users.
Tab. 8: Contingency table of the two classifications with 3 and 5 groups
Clusters: k=5 Total
1 2 3 4 5
Clusters: 1 20 5 33 0 0 58 k=3 2 0 0 25 270 0 295
3 0 0 0 6 301 307
Total 20 5 58 276 301 660
7. CONCLUDING REMARKS
There are many approaches for understanding and measuring customersatisfaction. We have focused our paper on highlighting what we think are usefulelements for the analysis of the results of a survey on this topic. As it is usual in thiskind of applications, most of the variables are ordinal with different numbers ofcategories.
Initially we have suggested a simple graphical method – the pyramid ofsatisfaction – for visualizing the entire set of variables, showing at a glance thenumbers of categories and the shares of each class of respondents.
Then we have compared linear and non linear methods for summarising thelevel of satisfaction as function of several variables and we have also related thescores of PCA and CATPCA with the scores (ranging from 1 to 10) of the directanswers to the global level of satisfaction. The correlation coefficients are about0.65 and it points out that the customer satisfaction cannot be completely understoodusing only a single direct question. The combination of direct questioning andmultivariate techniques provides a deeper understanding of the so called “keydrivers” of satisfaction. Furthermore this comparison is useful for identifying anddeleting inconsistent answers (multivariate outliers), i.e. users with high (low) PCAor CATPCA scores and low (high) OVERALL scores.
A simple criterion of quantification of ordinal variables, based on the mid-points of the cumulative function, has been suggested, removing the unrealisticassumption of equal distance between subsequent categories. Standard PCAapplied to these nonlinear scores of the variables is an alternative method withrespect to CATPCA and in this application it has emphasized the degree ofnonlinearity.

348 Zani S., Berzieri L.
Finally a non-hierarchical clustering with 3 and 5 groups has pointed out thefeatures of the homogeneous classes of the users of the Contact Center with respectto their satisfaction.
ACKNOWLEDGEMENTS
The authors thank Marco Riani, Andrea Cerioli and an anonymous referee forhelpful comments on a previous draft of this paper.
REFERENCES
ANDRICH D. (1988), Rasch Models for Measurement, Sage Publications, London.
BOND T.G., FOX C.M. (2007), Applying the Rasch Model: Fundamental Measurement in theHuman Sciences, Lawrence Erlbaum Associates, Mahwah, NJ USA.
BRENTARI E., GOLIA S., MANISERA M. (2007), Models for categorical data analysis: acomparison between the Rasch model and Nonlinear Principal Component Analysis, Statisticae Applicazioni, V, n. 1, 53-77.
CARPITA M., D’AMBRA L, VICHI M., VITTADINI G. (2006), Valutare la qualità: i servizi dipubblica utilità, Edizioni Guerini e associati, Milano.
CAGNONE S., MIGNANI S. (2009), An overview of recent developments in latent variables modelsfor ordinal data, Proceedings of the Conference “Multivariate Methods and Models forevaluating Public Services”, Book of Abstracts, Rimini, 42-43.
DE BATTISTI F., NICOLINI G., SALINI S. (2010), Rasch Model in Customer Satisfaction SurveyData, Quality Technology & Quantitative Management, vol. 7, n. 1, in press
DE LUCA A. (2007), Le ricerche di mercato. Guida pratica e teorica, Franco Angeli, Milano.
FERRARI P.A., MANZI G. (2010), Nonlinear Principal Component Analysis as a Tool for theEvaluation of Customer Satisfaction, Quality Technology & Quantitative Management, vol.7, n. 2, in press.
FORNELL C. (2008), Clienti soddisfatti. Vincitori e vinti nella battaglia per le preferenze deiconsumatori, Franco Angeli, Milano.
GALLO M. (2007), The Scaling Problems in Service Quality Evaluation, Metodoloski Zvezki, vol.4, n. 2, 165-176.
GIFI A. (1990), Nonlinear Multivariate Analysis, Wiley, Chichester.
GORI E., VITTADINI, G. (1999), Qualità e valutazione nei servizi di pubblica utilità, ETAS Libri,Milano.
IANNARIO M., PICCOLO D. (2010), A New Statistical Model for the Analysis of CustomerSatisfaction, Quality Technology & Quantitative Management, vol. 7, n. 2, in press.
ISTAT (2001), La “customer satisfaction” nei servizi pubblici. Casi ed esperienze a confronto,Roma.
JOLLIFFE I.T. (2002), Principal Component Analysis, second edition, Springer, New York.
JORESKOG K.G., MOUSTAKI I (2001), Factor Analysis of Ordinal Variables: A Comparison ofThree Approaches, Multivariate Behavioral Research, vol. 36, n. 3, 347-387.

Measuring customer satisfaction using ordinal variables: an application in survey… 349
LAURO N.C., BALBI S., SCEPI G. (1997), L’analisi multidimensionale dei dati per la misurazionedella Customer Statisfaction nei servizi, Atti del Convegno SIS “La statistica per le imprese”,Torino, vol. 1, 567-581.
LAURO C.N., ESPOSITO VINCI V. (2002), Some contributions to PLS Path Modeling and a systemfor the European Customer Satisfaction, Atti XLI Riunione scientifica della SIS, Milano, 201-210.
LAURO C.N., NAPPO D., GRASSIA M.G., MIELE (2008), Methods of quantification for qualitativemanifest variables in PLS-PM, Proceedings of the Conference on Multivariate StatisticalModelling and High Dimensional Data Mining, Kayseri, Turkey.
MAGAGNOLI U. (1996), Gli strumenti statistici nell’approccio della qualità totale, Atti della XXVIIIRiunione Scientifica SIS, vol. I, Maggioli, Rimini, 249-260.
MANISERA M. (2007), Scoring ordinal variables for constructing composite indicators, Statistica,LXVII, n. 3, 309-324.
MICHAILIDS G., DE LEEUW (1998), The Gifi System of Descriptive Multivariate Analysis,Statistical Science, vol. 13, 307-336.
MOLTENI L., COSTABILE M. (2001), Verso una tipologia dei processi valutativi: differentiapprocci alla misurazione della customer satisfaction, Atti del Convegno intermedio SIS“Processi e metodi statistici di valutazione”, Contributed Papers, Università di Tor Vergata,Roma, 91-94.
MONTINARO M., CHIRICO P. (2006), Customer satisfaction measurement procedures: one-dimensional and multi-dimensional approach, Statistica Applicata, vol. 18, n. 2, 277-296.
OFFICE OF PUBLIC SERVICE REFORM (2002), Measuring and Understanding CustomerSatisfaction, MORI Social Research Institute, London.
PICCOLO D. (2009), A Class of Models for Ordinal Variables: Logical Foundations and StatisticalIssues, Proceedings of the Conference “Multivariate Methods and Models for evaluatingPublic Services, Book of Abstract, Rimini, 38-39.
PICCOLO D., D’ELIA A. (2008), A New Approach for Modelling Consumers’ Preferences, FoodQuality and Preferences, vol. 19, 247-259.
PICCOLO D., IANNARIO M. (2008), Qualitative and Quantitative Models for Ordinal DataAnalysis, Proceedings MTISD 2008, Università del Salento, Lecce, 140-143.
PARASURAM A., ZEITHAML V.A., BERRY L.L. (1988), SERVQUAL: A Multiple-Item Scalefor Measuring Customer Perceptions of Service Quality, Journal of Retailing, 64.
RASCH G. (1980), Probabilistic Models for Some Intelligence and Attainment Tests, Mesa Press,Chicago.
RIZZI A. (2008), Italian contributions to data analysis, Journal Electronique d’Histoire desProbabilités et de la Statistique, vol. 4, n. 2.
TENENHAUS M., YOUNG F.W. (1985), An Analysis and Synthesis of Multiple CorrespondenceAnalysis, Optimal Scaling, Dual Scaling, Homogeneity Analysis and Other Methods forQuantifying Categorical Multivariate Data, Psychometrika, vol 50, n. 1, 91-119.
TENENHAUS M., ESPOSITO VINZI V., CHATELIN Y., LAURO C. (2005), PLS Path Modeling,Computational Statistics and Data Analysis, vol. 48, 159-205.
VEDALDI R. (1997), Modelli interpretativi per la valutazione della customer satisfaction: l’impiegodegli strumenti statistici, Atti del Convegno SIS “La statistica per le imprese”, Torino, vol. 1,583-596.
350 Zani S., Berzieri L.
VERMUT J.K., MAGIDSON J. (2005), Factor Analysis with Categorical Indicators: A Comparisonbetween Traditional and Latent Class Approaches, in: VAN DER ARK A., CROON M.A.,SIJTSMA K. (eds.), New Developments in Categorical Data Analysis for the Social andBehavioral Sciences, Lawrence Erlbaum Associates, Mahwah, NJ, 41-62. (Available at site ofthe first author).
ZANELLA A., CERRI M. (2000), La misura di customer satisfaction: qualche riflessione sulla sceltadelle scale di punteggio, in Valutazione della qualità e customer satisfaction: il ruolo dellastatistica, Vita e Pensiero, Milano, 217-231.
ZANELLA A. (2004), Metodi e modelli statistici per la valutazione della qualità e della customersatisfaction: aspetti oggettivi e soggettivi nell’ottimizzazione della qualità dei beni e servizi,Statistica applicata, n. 4, 393-410.
ZANI S., CERIOLI A. (2007), Analisi dei dati e data mining per le decisioni aziendali, Giuffrèeditore, Milano.
ZANI S., RIANI M., BERZIERI L. (2009), La soddisfazione degli utenti del Contact Center delComune di Parma, Comune di Parma.
MISURE DI SODDISFAZIONE DEL CLIENTE BASATESU VARIABILI ORDINALI:
UN’INDAGINE SUL CONTACT CENTER DEL COMUNE DI PARMA
Riassunto
In questo lavoro si considerano le elaborazioni dei dati forniti da indagini campio-narie sulla customer satisfaction, esaminando il caso d’una ricerca sugli utenti del ContactCenter del Comune di Parma. Com’è abituale in applicazioni di questo tipo, le variabili(risposte al questionario) sono su scala ordinale, ma con un differente numero di modalità(binarie, scale di Likert a 5 modalità, voti da 1 a 10, etc.).
Per una visualizzazione immediata dei risultati dell’inchiesta, si propone un grafico– la piramide della customer satisfaction – che pone in evidenza sia il numero di modalitàdi ogni variabile, sia i livelli di soddisfazione-insoddisfazione per ciascun aspetto rilevato.
Si costruiscono quindi degli indicatori sintetici di soddisfazione, funzione dellediverse risposte, utilizzando metodi lineari e non lineari di riduzione delle dimensioni: PCAe CATPCA. Gli scores di ciascun utente forniti da questi metodi sono confrontati con lerisposte dirette (voti da 1 a 10) alla domanda sulla soddisfazione globale. La correlazionetra i due tipi di misure della customer satisfaction, dell’ordine di circa 0.6, segnala che –almeno in questa applicazione – il grado di soddisfazione del cliente non può essere coltoin maniera completa semplicemente formulando al riguardo una domanda diretta, ma deveessere valutato considerando le varie “facce” del problema. Questo confronto è anche utileper individuare eventuali risposte incoerenti (voto elevato, ma bassi giudizi di soddisfazio-ne sui vari aspetti, o viceversa), che rappresentano potenziali outliers.
Si propone altresì un nuovo metodo di quantificazione delle variabili ordinali, chetiene conto delle frequenze relative cumulate, e presenta una relazione monotona, ma nonlineare con il più semplice criterio di attribuzione di codici 1, 2, 3, … alle modalità ordinatein senso crescente d’una variabile. L’applicazione della tradizionale PCA alle variabili

Measuring customer satisfaction using ordinal variables: an application in survey… 351
così quantificate rappresenta una procedura alternativa alla CATPCA.Infine, una classificazione degli utenti con il metodo di clustering delle k-medie
consente d’individuare i gruppi di clienti insoddisfatti, parzialmente soddisfatti e comple-tamente soddisfatti, ponendo in luce la composizione e le caratteristiche di ciascuna di talicategorie. Per ogni gruppo omogeneo si calcolano anche i valori medi degli scores ottenuticon l’analisi delle componenti principali, lineari e non lineari, stabilendo un nesso tra laprocedura di classificazione e quelle di riduzione delle dimensioni.
Il complesso delle analisi effettuate fa emergere i “fattori chiave” che determinanola soddisfazione dell’utente, la cui conoscenza può essere di grande aiuto nella definizionedelle strategie aziendali.