measuring global value chains with the wiod (world input
TRANSCRIPT

This project is funded by the European Commission, Research Directorate General as part of the 7th Framework Programme, Theme 8: Socio-Economic Sciences and Humanities.
Grant Agreement no: 225 281
Measuring Global Value Chains with the WIODthe WIOD
(World Input-Output Database)
Marcel TimmerGroningen Growth and Development Centre
University of Groningeny g
(presentation at OECD conference, Paris, 21 September, 2010)

Ways to measure GVCs
Case studyFirm-level survey datayInternational trade dataInput-output tables, various initiativesInput output tables, various initiatives
OECDIDE-JETROIDE JETROGTAPWIOD (World Input-Output Database)WIOD (World Input Output Database)

Documentation and infoDocumentation and infoDedicated website to WIOD project at www wiod orgDedicated website to WIOD project at www.wiod.org
This presentation based on paper:
World Input-Output Database (WIOD):Construction, Challenges and Applications
Prepared byAbdul Azeez Erumban
Reitze GoumaBart Los
Robert Stehrerobe t Ste eUmed Temurshoev
Marcel TimmerGaaitzen de VriesGaaitzen de Vries

Aim of WIODAim of WIOD
Time-series of input-output tables with supply broken down by origin: domestically produced or imported (by partner country)
Satellite accounts:Socio economic (labour and capital input by type)Socio-economic (labour and capital input by type)Environmental (energy, emissions to air and water, natural resources))
Period from 1995 to 2006:27 EU countries and 13 other major countries 35 industries and 59 products

List of CountriesList of Countries
• EU-27• plus13 non-EU:plus13 non EU:- Canada - China- United States - India- United States - India- Brazil - Japan
Mexico South Korea- Mexico - South Korea- Turkey - Taiwan
Russia Indonesia- Russia - Indonesia- Australia

National Input-Output (IO) Table (industry by industry type)
Total
y
Industry Final use
Total Use
Domestic Final use
Indu
stry
Intermediate use Exports
OutputValue added
Rest of WorldTotal
ImportsTotal supply

World input-output table (3 regions industry by industry type)(3 regions, industry-by-industry type)
Rest of
Final domestic
use
Final domestic
use
Final domestic
use
Intermediate use
Intermediate use
Intermediate use
Country B WorldCountry ACountry B
Industry
Rest of World
IndustryIndustry Total
Country A
Final use by RoW of
exports from A
Final use by B of exports
from A
Industry Industry
Intermediate use by RoW of imports from
A
IndustryIn
dust
ry Intermediate use of
domestic output
Country A Output in A
Final use of domestic
output
Total
Intermediate use by B of
imports from A
Final use by RoW of
exports from B
Final use of domestic
output
Intermediate use by RoW of imports from
B
Country B
Indu
stry Final use by
A of exports from B
Output in B
Intermediate use by A of
imports from B
Intermediate use of
domestic output
Final use of domestic
output
Final use by B of exports from RoW
Intermediate use by B of
imports from RoW
Intermediate use of
domestic output
Rest of World (RoW)
Indu
stry Final use by
A of exports from RoW
Output in RoW
Intermediate use by A of
imports from RoW
p
Output in RoWOutput in AValue added Value added
Output in BValue added

WIOD: What’s new?WIOD: What s new?
Time series benchmarked on National Accounts dataTime-series benchmarked on National Accounts data National supply and use tables as the basisLinked with bilateral international trade dataLinked with bilateral international trade data Including trade in servicesImproved allocation of imports to use category (BEC-like)Socio-economic satellite accounts (labour by skill; capital by type)Constant price tables(B d ffi i l t ti ti ith i f t i(Based on official statistics with maximum of transparency in calculations)

Dataflows and construction steps in WIOTPublic
statistics National accounts Supply and use tablesInternational trade
statistics (time-series) (infrequent) (time-series)
Total Final demand by type Supply (Basic price) Imports and exportsy yp pp y ( p ) p pTotal Export/Import Use (Purchasers' price) on bilateral basis
Value added by industry - of goodsGross output by industry - of services
For each country
HarmonisationEstimation
Supply (Basic price)Use (Basic price)
Bilateral import shares by use
Time series for each Use (Basic price)
Valuation matrix
Estimation
S l (B i i )
shares by use for each country
Supply (Basic price)Valuation matrix
Domestic use (Basic price)Import use (Basic price) by
delivering country
Time series for each country
Estimation
Time series World input-output tables

Methodologiesg
1. Time-series of SUTs at purchasers’ pricesp pExtrapolation and benchmarking of SUTs to National Accounts statistics, based on SUT-RAS method (Temurshoev and Timmer 2009)2009)
2. From SUTs at purchasers’ prices to basic pricesConstruction of net tax, trade and transport margin matrices
3. From national to inter-country SUTsBreakdown of Use table into domestic and imported (by delivering country) y)Relying on imports from international trade statistics Not simple proportional method, but distinction between intermediate consumer and capital goods This is based on aintermediate, consumer and capital goods. This is based on a new classification of HS6-digit products to end-use(In later stage use import tables from NSIs if available)

Methodologiesg
4. From SUTs to inter-country input-output tableTechnology assumptions (on product sales or production)Rest of World: exports to RoW is calculated as residual and can pbecome negative
5 From current price to constant price tables5. From current price to constant price tablesNational deflators based on industry gross output deflators, and row wise deflation of SUT. At later stage add in more information from national accountsfrom national accounts International deflators (PPPs): World Bank ICP expenditure PPPs adjusted and allocated to industries (for 2005)


The iPod example(Linden Dedrick & Kraemer 2009 )(Linden, Dedrick & Kraemer, 2009 )

Stylised I-Pod value chainStylised I-Pod value chain
JapanHard drive
KoreaKoreaConsumer USA CHINA Memory
Retail AssemblyUSAUSA
ProcessorsUSAApple Others
Battery

I-Pod value chain (in $)I-Pod value chain (in $)
JapanHard drive
96Retail Factory
96299 150 Korea
Consumer USA CHINA Memoryl bl 3
price price
Retail Assembly 369 5 USA
Processors13USA 13
Apple Others80 Battery
3333

Breakdown of iPod $299 retail price
Japan, $96.00
Distribution and reital, $69.00
Korea, $2.50
USA $13 50
Apple, $80.00
USA, $13.50Other, $33.00
China, $5.00C a, $5.00

Some lessonsSome lessons
I d i d lt f f t d l h iI-pod is end-result of fragmented value chainMade in China does not mean that China captures most of the value. Japan and US do.Assembly taking place in China by low-skilled workers at low wages adds little value to the productExport statistics might be misleading ($150 from China to US). ItExport statistics might be misleading ($150 from China to US). It is the value added content of trade that counts (only $5).
BUT How to generalise this (and other) case studies?BUT How to generalise this (and other) case-studies?Firm-level data with information where intermediate inputs are being sourced is scarce.Value chains are complex!

Value chain in value chainValue chain in value chain
Japan CHINA CHINA
Hard drive HDDHard drive HDDAssembly Japan
KoreaCHINA Memory PhilippinesCHINA Memory PhilippinesI‐pod
Assembly USA OthersProcessors
OthersBattery

WIOD approach to global l h i l ivalue chain analysis
U i i d t d t f N ti l St ti ti l I tit t (NSI ) th tUsing industry data from National Statistical Institutes (NSIs) that is collected and made consistent within the framework of the National Accounts
Relying on input-output techniques to measure the direct and indirect inputs into productionp p
Decompose contribution of each country to value chains into value added by factor inputs:value added by factor inputs:
various types of labour (low-, medium-, and high-skilled) Physical capital.
Provide trends over time

Factor content measurement
number of countries (C), industries (N) and factors (F)( ), ( ) ( ) B = (direct) factor inputs per unit of gross output (FC x NC) (I-A)-1 = Leontief inverse of world IO table (NC x NC) The factor inputs required per unit of final demand (both direct and indirect): B* = B (I-A)-1B B (I A) B* = factor inputs per unit of final demand (FC x NC) B* contains coefficients. The amounts of factor inputs that can be attributed to observed levels of final demand can be found by K=B* D in which D is an NC*NC diagonal matrix with final demand levels and K is the FC*NC matrix of amounts of factor inputs attributed to each of the NC final demand levelsfinal demand levels.

Example of Input-output relations
REST OF GERMANY WORLD
Final consum.
Final consum.consum. consum.
Car manufact.
Other sectors
All sectors
sectors

100
Global Value Chain of Final Output from German transport equipment manufacturing (1995 )
Other EU
ROWROW
CHN CHNJPN JPNKOR KORUSA USA
80
100 Total final expenditure (domestic and foreign) on output from German automotive industry ( l )Other EU
Other EU
60
80
%)
(≤ sales)
German share is partly due to f t i t d l d i
DEU40
60
Shar
es (% factor inputs deployed in
automotive industry
But also in other GermanDEU
DEU
20
But also in other German industries that deliver intermediate inputs to automotive industry
0
Foreign countries capture share due to delivery of intermediate inputs (direct or indirect)1995 2006inputs (direct or indirect)
Nationality is based on location of production factors, not ownershipp , p

CHNJPN JPNKOR KORUSA USA100
Global Value Chain of Final Output from German transport equipment manufacturing (1995 and 2006)
Other EU
Other EU
ROWROW
CHN CHNJPN JPN
80Other EU
60
s (%
)
DEU
DEU
40Shar
es
DEU
20
01995 2006

Global Value Chain of Final Output from
ROW Med skill labour
ROW High skill labour ROW High skill labour100
Global Value Chain of Final Output from German transport equipment manufacturing (1995 and 2006)
O Hi h kill l b
ROW IT CapitalROW NIT Capital
ROW NIT Capital
ROW Low skill labour
ROW Low skill labour
ROW Med skill labourROW Med skill labour
80
Own High skill labour
Own High skill labour
ROW IT Capital
ROW NIT Capital
60
es (%
)
Own Medium skill labour
Own Medium skill labour40Shar
e
Own NIT Capital Own NIT Capital
Own Low skill labourOwn Low skill labour20
Own IT Capital Own IT Capital01995 2006

Global Value Chain of Final Output from
ROW Low skill labourROW Med skill labour ROW Med skill labourROW Med skill labourROW High skill labour ROW High skill labour ROW High skill labour ROW High skill labour100
Global Value Chain of Final Output from transport equipment manufacturing (Germany, China, Japan and USA 2006)
Own High skill labour
Own High skill labour
ROW Capital
ROW CapitalROW Capital
ROW Capital
ROW Low skill labour
ROW Low skill labour ROW Low skill labourROW Med skill labour
80
Own Medium skill labour
Own Medium skill labourOwn High skill labour
g
Own High skill labour
ROW Capital
60
es (%
)
Own Low skill labourOwn Low skill labourOwn Medium skill labour Own Medium skill labour40Sh
are
O C it l
Own CapitalOwn Capital
Own CapitalOwn Low skill labour
Own Low skill labour
20
Own Capital
0DEU CHI USA JAP

Global Value Chain of Final Output from
JPN
100
Global Value Chain of Final Output from Global transport equipment manufacturing (1995 and 2006)
USA
USA
JPN
80
KORDEU
DEU
USA
60
es (%
)
Other EU
Other EUKOR
40Shar
e
ROW
ROW20
CHNCHN
01995 2006

100
Global Value Chain of Final Output from Global transport equipment manufacturing (1995 and 2006)
Low skill labour Low skill labour
80
Medium skill labourMedium skill labour
60
s (%
)
High skill labourHigh skill labour
40Shar
es
NIT CapitalNIT Capital20
IT Capital IT Capital01995 2006

Global Value Chain of Final Output from
Other EU
100
Global Value Chain of Final Output from Global textile manufacturing (1995 and 2006)
DEUJPNKOR
USA
USA
Other EUOther EU
80
ROW
DEU
JPN
KOR
USA
60
es (%
)
ROWDEU
40Shar
e
CHN
ROW
20
CHN0
1995 2006

100
Global Value Chain of Final Output from Global textile manufacturing (1995 and 2006)
OECD Other
OECD Other
80
ROW Capital
OECD Low skill labour
60
s (%
)
ROW Low skill labour
ROW Other labour
ROW Capital
OECD Low skill labour
40Shar
es
CHN Other labour
CHN Capital
CHN Capital
ROW Low skill labour
ROW Other labour
20
CHN Low skill labourCHN Low skill labourCHN Other labour
CHN Capital
01995 2006

Issues on the tableIssues on the table
Global value chain is in nominal value ($). Changes can be due ($) gto changes in factor prices and changes in factor quantities. E.g. in German automotive case:
Is the wage of German medium-skilled workers relative to other gGerman (and foreign) workers squeezed?Or is their employment going down?
We have the price data to make the breakdownpOwnership versus location:
Who owns the returns on capital? Disconnect in case of foreign ownershipownershipLess of an issue for labour compensation
Capital compensation is partly payment for investment made in the past E g Chinese textile makers buy Japanese machinerythe past. E.g. Chinese textile makers buy Japanese machinery. In dynamic models we can trace this. Decomposition techniques are silent on causality

Factor content of net exports, China (1995 and 2006)
259,888
250,000
300,000
1995 2006
150,000
200,000
49,465
67,828
50,000
100,000
ons
of
US$
5,943
-29,412
-7,106
-20,957
50 000
0
,
Capital Low skill Medium skill High skill
Mill
io
-86,224-100,000
-50,000
-150,000
Factor content of net exports is defined as factors needed to satisfy domestic final demand minus available factors

300,000
Factor content of net exports, China (1995 and 2006)
1995 2006 143 464
160,000
Factor content of net exports, Germany (1995 and 2006)
1995 2006259,888
150,000
200,000
250,000$
1995 2006 143,464
80 000
100,000
120,000
140,000
$
1995 2006
5,943
49,465
29 412
-7,106
67,828
-20,957
0
50,000
100,000
Capital Low skill Medium skill High skill
Mill
ions
of
US$
71,217
23,539 21,763
20,000
40,000
60,000
80,000
Mill
ions
of
US$
-29,412
-86,224
-150,000
-100,000
-50,000
-20,567
-3,730
-13,091-10,620
-40,000
-20,000
0
Capital Low skill Medium skill High skill
China Germany
80,24480,000
100,000
Factor content of net exports, Japan (1995 and 2006)
-52 929
-22,342
-3,571 -3,315
-18,946 -21,817
-50,000
0
Capital Low skill Medium skill High skill
Factor content of net exports, USA (1995 and 2006)
30,130
48,493
19,26122,888
31,625
0
20,000
40,000
60,000
f U
S$
52,929
-95,932
-200,000
-150,000
-100,000
f U
S$
-16,354
-60,000
-40,000
-20,000
0
Capital Low skill Medium skill High skill
Mill
ions
o
-350,000
-300,000
-250,000
Mill
ions
o
1995 2006
-73,679
-100,000
-80,000 1995 2006-414,116
-450,000
-400,000
Japan USA

Environmental li tiapplications
E i l lliEnvironmental satellite accounts:Energy use Greenhouse gases (CO2 and others), g ( 2 )Ozone depleting gases Acidifying emissions to air
Same input-output technique as for global value chainSame input-output technique as for global value chain analysis. Now e.g. emissions per unit of gross output is used. C b f t i t f t CO itt d l b ll iCarbon footprint of a country: CO2 emitted globally in production to satisfy domestic final demand Carbon footprint minus available factors is emissions embodied in net trade

Embodied CO2 emissions of final German domestic demand
1,200,000
Embodied CO2 emissions of final German domestic demand (1995 and 2006)
ROW
ROW
1,000,000
kt C
O2)
GER GER600,000
800,000
Emis
sion
s (k
ChinJap
RUS
RUS400,000
E
US US
rest EU rest EU
ChinJapRUS
0
200,000
US US01995 2006

Emissions embodied in net trade
2,000,000
(China, Germany, US and Japan in 1995 and 2006)
1995 20061,566,311
1,200,000
1,600,000
(kt
CO
2)
599,100
400 000
800,000
Em
issi
on
s (
0
400,000
Germany Japan United States China-202,041
-303,564 -359,133
-214,626-309,283
-800,000
-400,000
-1,044,829-1,200,000

Future work
D t i tData improvements
Testing by users (parts public autumn 2011; full May 2012)g y (p p ; y )
Provide further analysis D iti f h i l b l l h i i tDecomposition of changes in global value chains into changes in technology and changes in demandSimilarly for pollution indicators (C02 plus other GHG)Link to timing of WTO ascension and Kyoto-protocol participationBring in dynamic IO-models (investment)g y ( )Testing Heckscher-Ohlin-Samuelson theory

Future work
D t i tData improvementsImproving bilateral trade in servicesConstant price series
N ti l d fl tNational deflatorsPurchasing power parities for output and intermediate inputsVolume masures of labour and capital
Improving factor input data for non OECD countries (as part of work byImproving factor input data for non-OECD countries (as part of work by World KLEMS consortium)Comparing our use-classification of trade flows with official import IO tables.Processing export trade tables for Mexico and Chinag p
Testing by users (parts public autumn 2011; full May 2012)
Provide further analysis !

Additional materialAdditional material

Who is in WIOD?Who is in WIOD?University of Groningen (The Netherlands)University of Groningen (The Netherlands)Institute for Prospective Technological Studies (Spain)Wiener Institut für Internationale Wirtschaftsvergleiche (Austria)g ( )Zentrum für Europäische Wirtschaftsforschung (Germany)Österreichisches Institut für Wirtschaftsforschung (Austria)Konstanz University of Applied Sciences (Germany)The Conference Board Europe (Belgium)C fCPB Netherlands Bureau for Economic Policy AnalysisInstitute of Communication and Computer Systems (Greece)Central Recherche SA (France)Central Recherche SA (France)OECD (France)

Code NACE Description1 AtB Agriculture, Hunting, Forestry and Fishing2 C Mining and Quarrying3 15t16 Food, Beverages and Tobacco4 17t18 Textiles and Textile Products
Columns in USE Table
5 19 Leather, Leather and Footwear6 20 Wood and Products of Wood and Cork7 21t22 Pulp, Paper, Paper , Printing and Publishing8 23 Coke, Refined Petroleum and Nuclear Fuel9 24 Chemicals and Chemical Products
10 25 Rubber and Plastics11 26 Other Non Metallic Mineral
Columns in Use t bl
11 26 Other Non-Metallic Mineral12 27t28 Basic Metals and Fabricated Metal13 29 Machinery, Nec14 30t33 Electrical and Optical Equipment15 34t35 Transport Equipment16 36t37 Manufacturing, Nec; Recycling17 E Electricity, Gas and Water Supply table17 E y, pp y18 F Construction19 50 Sale, Maintenance and Repair of Motor Vehicles Retail Sale of Fuel20 51 Wholesale Trade and Commission Trade, Except of Motor Vehicles 21 52 Retail Trade, Except of Motor Vehicles ; Repair of Household Goods22 H Hotels and Restaurants23 60 Inland Transport24 61 Water Transport25 62 Air Transport26 63 Other Supporting and Auxiliary Transport Activities; Activities of Travel Agencies27 64 Post and Telecommunications28 J Financial Intermediation29 70 Real Estate Activities30 71t74 Renting of M&Eq and Other Business Activities30 71t74 Renting of M&Eq and Other Business Activities31 L Public Admin and Defence; Compulsory Social Security32 M Education33 N Health and Social Work34 O Other Community, Social and Personal Services35 P Private Households with Employed Persons36 Financial intermediation services indirectly measured (FISIM)36 y ( )37 Total38 Final consumption expenditure by households39 Final consumption exp. by non-profit organisations serving households 40 Final consumption expenditure by government41 Final consumption expenditure42 Gross fixed capital formation43 Changes in inventories and valuables44 Gross capital formation45 Exports46 Final uses at purchasers' prices47 Total use at purchasers' prices
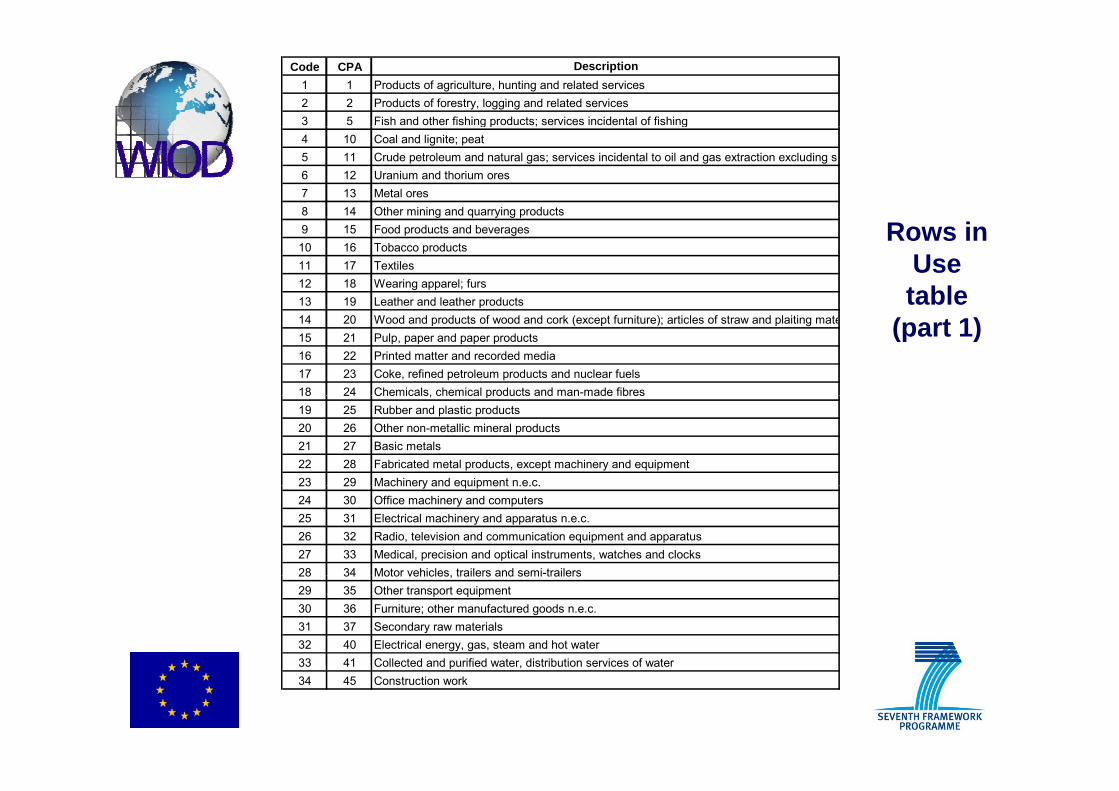
Code CPA Description1 1 Products of agriculture, hunting and related services2 2 Products of forestry, logging and related services3 5 Fish and other fishing products; services incidental of fishingg p ; g4 10 Coal and lignite; peat5 11 Crude petroleum and natural gas; services incidental to oil and gas extraction excluding su6 12 Uranium and thorium ores7 13 Metal ores8 14 Other mining and quarrying products
Rows in Use table
g q y g p9 15 Food products and beverages10 16 Tobacco products11 17 Textiles12 18 Wearing apparel; furs13 19 Leather and leather products
(part 1)p
14 20 Wood and products of wood and cork (except furniture); articles of straw and plaiting mate15 21 Pulp, paper and paper products16 22 Printed matter and recorded media17 23 Coke, refined petroleum products and nuclear fuels18 24 Chemicals, chemical products and man-made fibres18 24 Chemicals, chemical products and man made fibres19 25 Rubber and plastic products20 26 Other non-metallic mineral products21 27 Basic metals22 28 Fabricated metal products, except machinery and equipment23 29 Machinery and equipment n.e.c.23 29 Machinery and equipment n.e.c.24 30 Office machinery and computers25 31 Electrical machinery and apparatus n.e.c.26 32 Radio, television and communication equipment and apparatus27 33 Medical, precision and optical instruments, watches and clocks28 34 Motor vehicles trailers and semi-trailers28 34 Motor vehicles, trailers and semi trailers29 35 Other transport equipment30 36 Furniture; other manufactured goods n.e.c.31 37 Secondary raw materials32 40 Electrical energy, gas, steam and hot water33 41 Collected and purified water distribution services of water33 41 Collected and purified water, distribution services of water34 45 Construction work

35 50 Trade, maintenance and repair services of motor vehicles and motorcycles; retail sale of a36 51 Wholesale trade and commission trade services, except of motor vehicles and motorcycle37 52 Retail trade services, except of motor vehicles and motorcycles; repair services of person38 55 H t l d t t i38 55 Hotel and restaurant services39 60 Land transport; transport via pipeline services40 61 Water transport services41 62 Air transport services42 63 Supporting and auxiliary transport services; travel agency services
Rows in Use table
43 64 Post and telecommunication services44 65 Financial intermediation services, except insurance and pension funding services45 66 Insurance and pension funding services, except compulsory social security services46 67 Services auxiliary to financial intermediation47 70 Real estate services
(part 2)48 71 Renting services of machinery and equipment without operator and of personal and house49 72 Computer and related services50 73 Research and development services51 74 Other business services52 75 Public administration and defence services; compulsory social security services53 80 Education services54 85 Health and social work services55 90 Sewage and refuse disposal services, sanitation and similar services56 91 Membership organisation services n.e.c.57 92 Recreational, cultural and sporting services57 92 Recreational, cultural and sporting services58 93 Other services59 95 Private households with employed persons60 Total61 Cif/ fob adjustments on exports62 Direct purchases abroad by residents62 Direct purchases abroad by residents63 Purchases on the domestic territory by non-residents 64 Total intermediate consumption/final use at purchasers' prices65 Compensation of employees 66 Other net taxes on production 67 Operating surplus gross67 Operating surplus, gross 68 Value added at basic prices69 Output at basic prices