measuring technology - siemens building technologies
TRANSCRIPT

Building Technologies s
Measuring Technology

1.1 General 51.2 Measured variable 71.2.1 Comparison value 81.3 Measured value (measurement result) 81.4 Principle of measurement 81.5 Method of measurement 81.6 Measuring by counting 91.7 Analog-to-digital and digital-to-analog converters 101.8 Measured section / measuring apparatus 111.9 Equipment terms 131.10 Operating rules for measuring instruments 17
2.1 General 182.2 Steady-state response 182.3 Dynamic response 182.3.1 Without time delay 192.3.2 With time delay 202.3.3 With delay due to one storage element 202.3.4 With delay due to multiple storage elements 212.4 Time constants for temperature sensors 22
3.1 Tolerance 233.1.1 Steady-state tolerance 233.1.2 Dynamic tolerance 233.2 Measuring error 243.2.1 Steady-state errors 243.2.2 Dynamic errors 253.2.2.1 Time lag 263.3 Instant of measurement 273.4 Troubleshooting 28
4.1 General 294.2 Temperature 304.2.1 Principles of temperature measurement 304.2.2 Change in restistance 314.3 Humidity 334.3.1 Principles of relative humidity [% rH] measurement 344.3.2 Principle of capacitive humidity measurement 354.3.3 Principle of absolute humidity (x) measurement 364.4 Pressure measuring apparatuses 374.4.1 Methods for measurement 384.4.1.1 Differential pressure measurement method: Basics 384.4.1.2 Differential pressure measurement: Flow resistance 414.4.1.3 Speed measurement method 414.4.1.4 Flow measurement method 434.4.2 Measurement in gases/air and fluids 444.4.2.1 Prandtl’s pitot tube 444.4.2.2 Inclined-tube manometer 454.4.2.3 U-tube rmanometer 464.4.2.4 Closed-ring rmanometer 464.4.2.5 Elastic pressure meters 464.4.2.6 Spring loaded diaphragms and bellows 484.4.2.7 Measurement of pressure using electrical effects 494.4.2.8 Vane anemometer 504.4.2.9 Hot-wire anemometer 51
1. Basics of Measuring Technology
2. Response
3. Tolerance and Measuring Errors
4. Measured Variables in HVAC
Contents
3

4.4.3 Measurement in fluids 524.4.3.1 Filling chamber meter 524.4.3.2 Displacement meter 524.4.3.3 Oval wheel meter 534.5 Heat volume measurement 544.6 Air quality 554.6.1 CO2 sensor 554.6.2 VOC sensor 574.7 Solar radiation sensor 604.8 Wind sensor 60
5.1 Introduction 615.2 Basic information on sensor placement 625.2.1 Flow patterns, speed profiles 625.2.2 Time constant of sensors in liquids 635.2.3 Placement of a sensor 635.2.4 External interference 635.2.5 Measurement problems 645.2.6 Examples of sensor placement 645.3 Temperature measurement 665.3.1 Temperature measurement in water 665.3.2 Temperature measurement in air 675.3.3 Measuring the outdoor air temperature or weather 685.3.4 Temperature measurement in air ducts 705.3.5 Room temperature measurement 725.4 Speed measurement 735.4.1 Speed measurement devices 735.4.2 Speed sensors 745.4.3 Pressure sensor placement 755.5 Two final comments 78
6.1 Measuring concept 796.2 Measuring planning 806.2.1 Organizational planning 806.2.2 Technical planning 806.2.2.1 Measuring apparatus 816.2.2.2 Installation 816.2.3 Evaluation of measurements 826.2.4 Final report 826.2.5 Checklists 83
5. Placement and Installation of Sensors
6. Measuring Concept /
Measuring Planning
4
5
Metrology and instrumentation denotes the sum of the procedures and devices used for empirical determination (measurement) of scientific and technical quantities that can be expressed numerically.Further tasks of metrology and instrumentation are the verification of compliance with dimensional tolerances, consumption metering,production monitoring as well as, in general terms, the control of technical processes to measured values (within the scope of instru-mentation and control).The road from the beginnings of measurement, with early attempts at defining distance and time, to mechanical and electronic measuringdevices has been long and difficult, involving thousands of years ofhuman cultural history.
In the age of building control and facility management (management,operation and maintenance of buildings), precise measurement of physical quantities is of great importance. Decisions on changes or statements on energy consumption figures and building maintenancecosts depend on the accuracy of measured values. In the control loop,precise measured value acquisition is highly significant for the accu-racy and stability of the control-action result. The selection of the correct measuring apparatus is decisive for a correct measurementresult, and a correct (i.e. reliable) measurement result is important for a meaningful evaluation.
The basic concepts of measurement are defined in the standards DIN 1319 and VDI/VDE 26000 Sheet 2.
The International System of Units SI (Système International d’Unité) aswe know it today has created a simple order for units of measurement.
The seven base units of the SI system.
The term “sensor” [L. sentire to perceive or sense] arose with the development of modern technologies, especially microelectronics. The sensor is the part of the measuring or recording equipment that is directly exposed to the quantity to be measured; it also denotes a device that reacts to electromagnetic radiation (e.g. IR sensor) ortouch (e.g. sensor button).
The sensor contains at least the sensing element and the hardwarerequired to fulfill the measuring task. It supplies a standardized electrical measuring signal, e.g. 0 (4) ... 20 mA or 0 … 10 VDC, or itchanges its electrical resistance as a function of the measured value.This change of resistance can also be standardized, e.g. as per DIN. In relatively large systems, there are usually numerous different mea-sured values. The measured values are summarized on instrument or control panels or on a computer.
Quantity Unit SymbolTemperature kelvin KLength meter mTime second sElectric current ampere AMass kilogram kgLuminous intensity candela cdAmount of substance mole mol
1.1 General
Basic units
Sensor
1. Basics of Measuring Technology

6
Measured values must frequently be transmitted over long distancesbetween the measurement location and the monitoring location,making telemetry equipment necessary. However, extensive measur-ing equipment and long transmission distances frequently cause errors and falsified measurement results.
The purpose of measuring instruments is to enable physical quantitiessuch as pressure, temperature, humidity or consumption, e.g. energy,fuels, flow volumes etc., to be measured and monitored or to enablefaults or losses to be detected. They are an important tool for econo-mical operations management.
The processes in metrology can be divided into five areas:• Measuring• Testing• Calibration testing• Calibration• Adjustment
The individual processes are defined as follows:
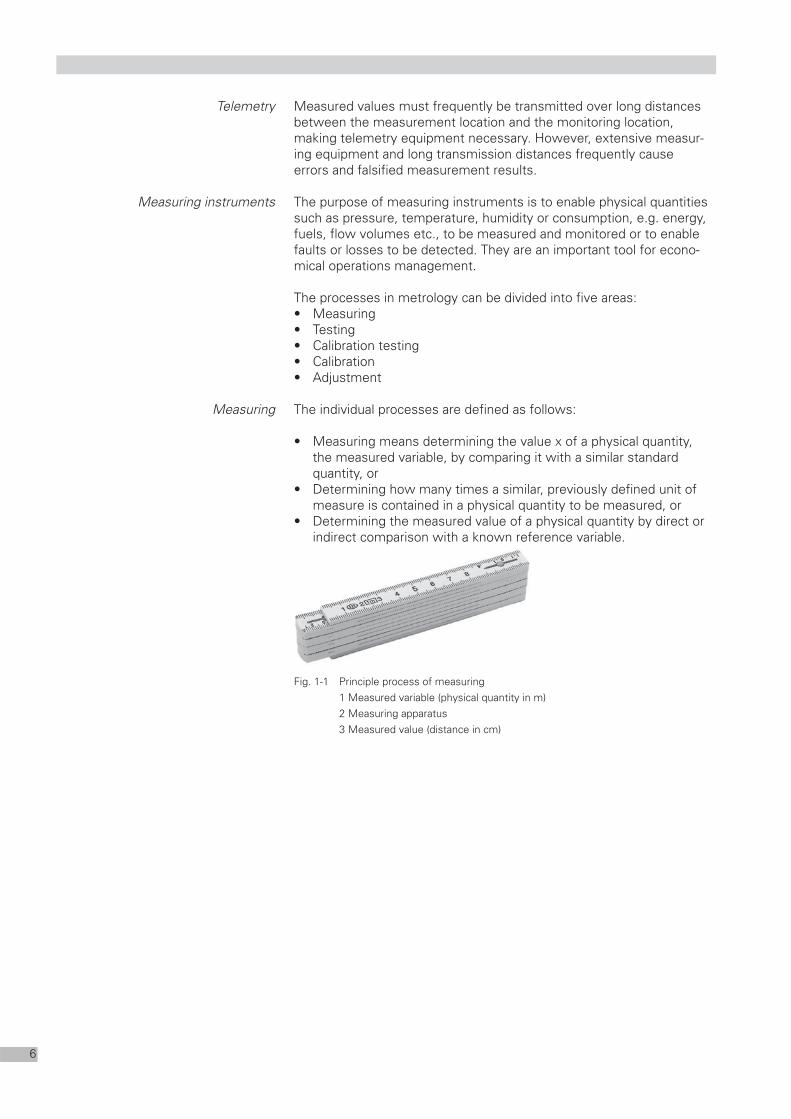
• Measuring means determining the value x of a physical quantity, the measured variable, by comparing it with a similar standard quantity, or
• Determining how many times a similar, previously defined unit ofmeasure is contained in a physical quantity to be measured, or
• Determining the measured value of a physical quantity by direct orindirect comparison with a known reference variable.
Fig. 1-1 Principle process of measuring1 Measured variable (physical quantity in m)2 Measuring apparatus3 Measured value (distance in cm)
Telemetry
Measuring instruments
Measuring

Testing means to determine whether an object to be tested complieswith predefined conditions. Limits of error and tolerances are eva-luated, and a distinction is made between objective and subjectivetesting.
Example, room temperature:You are too hot, so you open the window:• Subjective testing: based on sensory perception
You measure the temperature and determine that it is 26 °C:• Objective testing
The processes of testing and measuring are closely related.
Calibration testing is an official activity (DIN 1319). In the process ofcalibration testing, it is determined whether the test candidate (e.g.temperature measuring device) complies with a given calibration specification. Deviations are defined in the calibration certificate andofficially recorded.
Calibration determines the relationship between the reading (outputvariable) and the measured value (input variable). Example: in the case of a known scale, the display error of a given measuring device is determined by calibration (application of a known input variable).
A measuring device is set such that the reading deviates as little aspossible from the measured value considered to be correct, or itremains within given limits of error. Adjustment requires interventionthat permanently changes the measuring device.
Verification of the zero adjustment is an important task in the use ofmeasuring devices. High-quality indicating devices often provide a zero checking facility.
Caution! Potential source of error if zero is set incorrectly.
The major part of our day-to-day work involves metrological processes,which is why further terms must be explained in the following.
The measured variable is normally a physical quantity whose value is to be determined by measuring. Example for the measured variable oftime.
Measuring is the acquisition of the physical quantity. The more accu-rate the measurement the greater the metrological effort will be!Measuring is a complex process. Reliable and accurate measuring isthe prerequisite of a good control-action result!
We receive a measurement result by comparing the measured valuewith a known “comparison value”.
Measured variable Symbol Units
Time t year, month, week, day,hour, minute, second
Testing
Calibration testing
Calibration
Adjustment (balancing)
Zero adjustment
1.2 Measured variable
7

The basic prerequisites for any measuring process are as follows:1. A clear definition of the quantity x to be measured (measured
variable)2. A convention (legal stipulation) for the comparison value.
Both of these prerequisites are not always given:
The temperature of a body or the pressure of a gas are, for example,simple measured variables for which international conventions havebeen defined.
In the case of temperature, for example, the freezing and boiling points of water at a pressure of 1013 mbar (sea level) are available as reference points. Intermediate values are defined by convention via interpolation with standard platinum resistance thermometers.
Other variables, such as “comfort” or “air quality” are very difficult to quantify. Often there are no appropriate comparison values, or they are not generally known or recognized.
A measured value is the value that is determined and indicated at theoutput (indicator scale) as the representation of a measured variable. It is indicated as the product of a numerical value and the unit of themeasured variable.
Specific principles of measurement are applied in order to determinemeasured variables. The principle of measurement is the characteristic physical pheno-menon that is used for measuring. The following principles of mea-surement can be used, for example, for measuring temperature:• Linear expansion• Radiation• Thermoelectric effect• Variation of electrical resistance
The practical application of a principle of measurement gives rise to amethod of measurement. A distinction is made between direct and indirect methods of mea-surement.
In the case of direct methods of measurement, also referred to ascomparative or relative methods of measurement, the desired value of the measured variable is determined by comparison with a referencevalue of the same measured variable. Measurements where the mea-sured value is received directly, without supplementary calculationsand usually from the reading of a single measuring device, can also be classified as direct methods of measurement (example: resistancethermometer: resistance = temperature).
In the case of indirect measurements, the desired value of a measuredvariable is derived from different physical variables. The measuredvalue is determined from these variables using the given physical rela-tionship (quantity equation).
Measured variable Measured value Unit(numerical value)
Time 3 h
1.2.1 Comparison value
1.3 Measured value
(measurement result)
1.4 Principle of measurement
1.5 Method of measurement
Direct methods of measurement
Indirect methods of measurement
8

A further distinction is made between analog and digital methods ofmeasurement.
A method of measurement and a measuring apparatus are said to beanalog if the measured variable is assigned by the method or device to an output variable which is an unambiguous, continuous represen-tation of the measured variable. The measured value normally appearswithin the measuring range as a continuous, variable position of a pointer against a scale.
Analog measurement is used where trend measurement and rapidvisual acquisition and evaluation of a measured value (pointer deflec-tion, significance) is required.
A method of measurement and a measuring apparatus are said to be digital if the measured variable is acquired time-discretely andassigned to an output variable via a conversion process (device) inwhich the measured variable is displayed numerically in very small,fixed steps (quantization of the measured variable). The measuredvalue is indicated as the sum of the quantization units or of impulses.
The measured values can be printed, stored, electronically transmittedand processed. Convenient reading is possible, because only a digit orseries of digits has to be read.
Examples of measuring methods and equipment
In association with digital methods of measurement, counting is usedincreasingly in metrology as a method of determining a measuredvalue.
Counting is the determining of a number of elements or eventsthat are in some respect similar.
The following are counted, for example: objects, pulses, revolutions,elementary particles.
Counting is performed by sensory perception or primarily using coun-ting equipment, e.g. person-counting equipment in a department storefor ventilation system operation.
Measured Principle of Method of Measuringvariable measurement measurement apparatusTemperature variation of length direct, analog bimetallic element
variation of volume direct, analog thermometervariation of direct, analog measuring bridge,electrical resistance resistance
thermometerHumidity variation of length indirect, analog hygrometer
temperature indirect, analog thermometercomparisoncapacitance direct, analog diffusion
Pressure elastic deformation direct, analog barometric cellbulging of a diaphragm direct, analog diaphragm
Flow volume differential pressure indirect, analog measuring orifice,(orifice) manometerstatic and dynamic indirect, analog pitot tubepressure
Speed of pulse counting iindirect, digital photocell,rotation impulse counter
Analog
Advantages:
Digital
Advantages:
1.6 Measuring by counting
9

Measured values in the form of counts can be converted to other measured variables by data processing.
Example, speed measurement:– Counting of wheel revolutions per unit time– Conversion to speed
(= wheel circumference * wheel revolutions / time)
In most cases, the sensors used in building services and HVAC sys-tems technology supply an analog current, voltage, resistance or pres-sure signal as the measured value. This signal can be used directly with conventional analog equipment.In digital systems, an analog input signal (e.g. measured value) must be converted to a digital input value that can be understood by micro-computers. This is accomplished using an analog-to-digital converter, or A/D con-verter for short.The reverse process, i.e. conversion of a digital output value into ananalog output signal, is also frequently required (e.g. output of an ana-log actuating signal). The component used for digital-to-analog conver-sion is called a D/A converter.
The accuracy (resolution) of an A/D or D/A converter depends on thenumber of steps with which the analog signal can be represented. A 10 bit A/D converter can divide an analog signal into “2 to the power of 10” = 1024 steps, for example.
Fig. 1-2 illustrates the process using a 3 bit A/D converter which onlypermits “2 to the power of three” = 8 steps (very low resolution). x1 is the analog input variable for the A/D converter. The correspondingoutput variable x2 is shown in the table. The first bit from the rightrepresents the value 1, the middle bit represents the value 2, and theleft bit represents the value 4.
If x2 is taken as the input variable of a D/A converter, the resultant output variable is the analog signal x3, which corresponds to the digitalsignal x2.
Fig. 1-2 Analog-to-digital and digital-to-analog converters1 Quantizing error2 Error due to time-discrete measurement
(signal x1 leaves the time-discrete maintained value of x2[t1] behind)
0 1 2 3 4 5 6 7 8 87650 1 2 3 4
111
110
101
100
011
010
001
000
7
6
5
4
3
2
1
7
6
4
5
3
2
1
0
1
2 3
1 2 3
t x2
0 000
1 001
2 011
3 101
4 110
5 111
6 111
7 110
8 011
B21-2
1
2
1
1.7 Analog-to-digital and
digital-to-analog converters
A/D converter
Accuracy (resolution)
10
Although sequential connection of an A/D converter and a D/A con-verter makes no practical sense, the example clearly shows the errorarising through digitization, the so-called quantizing error 1, and theerror due to time-discrete measurement 2. The resolution (high bit count) is decisive for the accuracy of the digital measurement result.
Where does the measured section end and the measuring apparatusbegin?
Measured sections are systems or components in which the value tobe measured is influenced. They are not sections in the geometricalsense. The measured section cannot be defined until the function of the system and the purpose of the measurement are known. Themore precisely they are known the more precisely the measured section can be defined. The measured section also includes interference variables that affectthe value to be measured from the outside.
The measuring apparatus contains all of the functions required for theoutput (display) of the measured value. The term measuring instrumentis generally used for the measuring apparatus, and it is considered as a single device.
The measured section (1) and measuring apparatus (6) constitutethe measuring system (10).
Fig. 1-3 Water temperature measurement using an immersion sleeve and a thermometer1 Measured section (consisting of 2, 3, 4 and 5)2 Water, medium, measured variable3 Pipe, system4 Immersion sleeve5 Transfer medium6 Measuring apparatus (consisting of 7, 8 and 9)7 Thermometer8 Indicator scale9 Measuring fluid, sensing element10 Measuring system (consisting of 1 and 6)
1.8 Measured section /
measuring apparatus
Measured section
Measuring apparatus
11

The transfer medium (contact medium, e.g. oil or heat transfer paste)makes the connection between the measured section and the mea-suring apparatus. It can have a considerable effect on the quality of ameasuring apparatus.
As Fig. 1-3 clearly shows, the water temperature not is being directlymeasured but the temperature of the transfer medium (oil) whichforms the interface between the measured section and the measuringapparatus.The water, pipe, immersion sleeve and oil are all parts of the measuredsection in this case. From physics we know that all of these materialshave a different thermal response.
The bulb at the bottom of the thermometer is the sensing element, the capillary tube provides the transfer, and the top of the measuringfluid with the scale provides the temperature indication. They are allparts of the measuring apparatus.
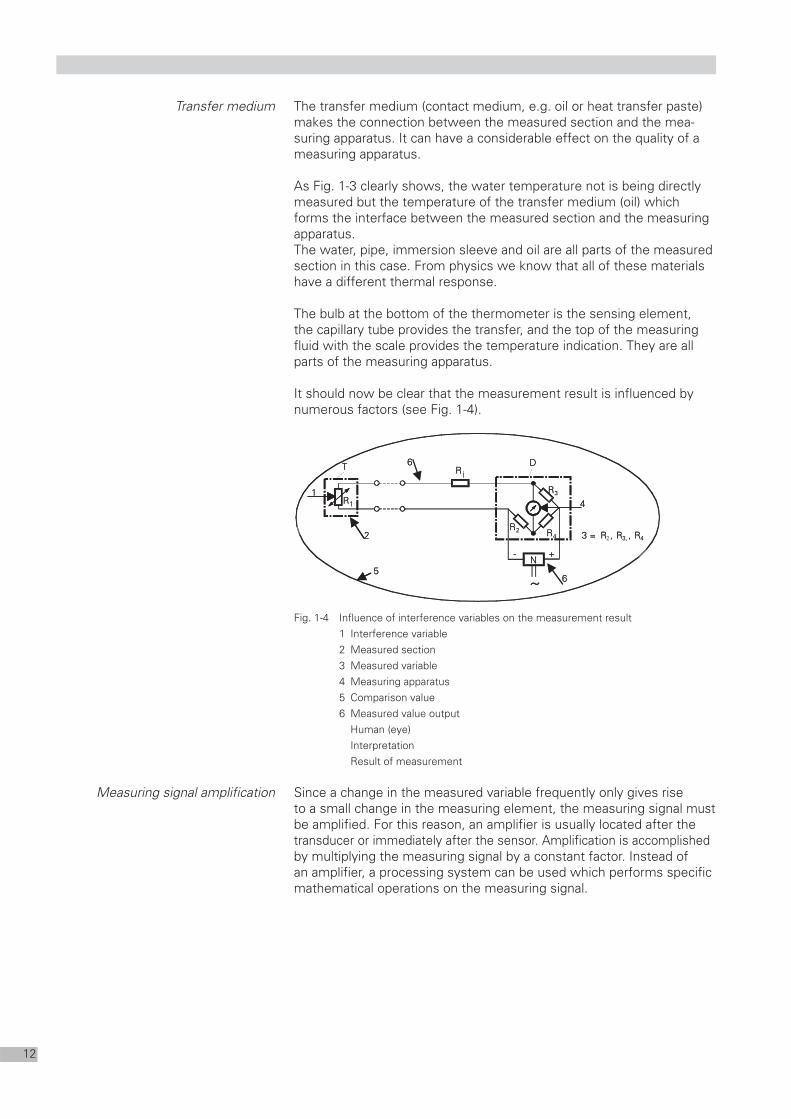
It should now be clear that the measurement result is influenced bynumerous factors (see Fig. 1-4).
Fig. 1-4 Influence of interference variables on the measurement result1 Interference variable2 Measured section3 Measured variable4 Measuring apparatus5 Comparison value6 Measured value output
Human (eye)InterpretationResult of measurement
Since a change in the measured variable frequently only gives riseto a small change in the measuring element, the measuring signal mustbe amplified. For this reason, an amplifier is usually located after thetransducer or immediately after the sensor. Amplification is accomplishedby multiplying the measuring signal by a constant factor. Instead of an amplifier, a processing system can be used which performs specificmathematical operations on the measuring signal.
~
+ - N
T
R 1
R j D
R 2
R 3
R 4
6
6
1
5
3 = R 2, R 3, , R 4
4
2
~
+ - N
T
R 1
R j D
R 2
R 3
R 4
6
6
1
5
3 = R , R 3, , R 4
4
2
Transfer medium
Measuring signal amplification
12

If the components of the measuring apparatus are some distanceapart, remote transmission of the signals is necessary. The transmis-sion can take place via electrical wires, pressure lines or by wirelessmeans.
In any transmission of measured values, information can be lost or(especially in the case of analog signals) falsified. This information lossgives rise to false indications and incorrect results, which is a majorproblem for the measuring apparatus.
If the measured value is to be observable for human beings, the indication must be made perceivable to a sensory organ. In most cases that organ is the eye. The most commonly used indications are as follows:• Position of a pointer on a scale (analog)• Direct numerical display (digital)• Plotted indication on paper
If a large number of measured values are present and need to be used for some purpose at a later date, the values are stored and evaluated by a processing system.
Measuring devices can be classified according to the following criteria:1. According to the quantity to be measured:
measuring devices for temperature, pressure, humidity, speed,energy etc.
2. According to design:• Indicating device as an operating aid• Recording device as an aid for operation monitoring and
subsequent tracking of operational processes
3. Counting device (meter) for determining room occupancy and consumption figures as well as for billing
Name Thermocouple Resistancethermometer
Bimetallicthermometer
Liquid-in-glassthermometer
Cable sensor Duct sensor(for humidity)
Sensor or fillingmaterial
Fe constantan,PtRh-Pt,Cu constantan,NiCr-Ni
Platinum, nickel.Cu,semiconductorceramic
Fe alloys Mercury, alcohol Cu, Ms brightnickel-plated
Printed circuitboard withelectronics:capacitance = f(humidity)
Measuring range -20..2000 °C -200..700 °C -20..250 °C -200..500 °C -10..100 °C 10..90 %rH
Sensitivity 30...60 �V 0.4...0.6 % ΔR/Ksemiconductor:3 %/K
0.15 % / 100 K Up to 10 mm/K
Achievableaccuracy
0.5 K 0.1 Ksemiconductor:0.5 K
1.5 % of range 0.02 K ± 5 %
Response timeof sensor inwater
1 s 1..10 s 1..20 s 5..20 s 62.5 s -
Scale graduation Linear Linear Linear Linear Linear Linear
Specialapplication
For hightemperatures,for temperaturedifferences (veryaccurate:0.01 K)
For lowtemperatures,telemetry (self-heating error)
Cheap airthermometer(with switch, ifapplicable)
Laboratory andcheckmeasurements
For difficult space conditions
For measuringrelative humidityin ducts
Remote transmission
Indication
Measured value processing
Examples of measuring apparatuses
1.9 Equipment terms
Classification of measuring devices
13

The basic components of an indicating instrument are as follows:• Measuring element, sensor or pickup, e.g. the hair bundle in a
hygrometer• Measuring or processing system• Indicating system (pointer, scale, display)
Each measuring apparatus can be shown as a “black box” whose input signal is the measured variable and whose output signal is a measured value as a representation of the measured variable.
Fig. 1-5 Measuring apparatus consisting of numerous auxiliary devices1 Measuring apparatusT/2 Measured variable3 Pickup, sensor4 Measuring signalD/5 Adapter, measuring amplifier, processor6 Auxiliary device7 Auxiliary power8 Output, visual output (indicator, plotter, meter), indirect output9 Measured value
The measuring apparatus includes all auxiliary devices for sensing ameasured variable, conditioning and reproducing a measuring signaland outputting a measured value.
A measuring instrument can consist of a single device (e.g. a liquid-in-glass thermometer). Generally, however, measuring instruments are only parts of measuring apparatuses (e.g. resistance thermometer,measuring orifice etc.).
∼+− N
T
R1
R j
D
R2
R3
R4
4
6/7
3
1
8
3 = R2 , R3, , R4
+− N
T
R1
R j
D
R2
R3
R4
4
6/7
3
1
8
3 = R2 , R3, , R4
Components of an indicating instrument
Measuring apparatus
Measuring instruments
14

The parts of a measuring apparatus that are not so decisive for itsmetrological characteristics are referred to as auxiliary devices.
The auxiliary power is the energy that must be intermittently or per-manently supplied to the measuring instrument to maintain its functionand which is not derived from the respective input signal.
A distinction is made between these two signal types in all measuringinstruments. The input signal can be the measured variable itself, in which case theterm pickup is used. The output signal can be a pointer position, inwhich case the device is referred to as an indicator (e.g. thermometer).
Measuring instruments can also have more then one input or outputsignal.
The measuring range is the portion of the indicating range within which the indicating error remains within given limits. The measuringrange and indicating range can be identical. Some measuring instru-ments have multiple measuring ranges with different error limits, e.g.multimeter for current, voltage and resistance.The measuring range is characterized by the measuring range lowerlimit and the measuring range upper limit (Fig. 1-6, measuring range 20 to 140 °C). The measuring span is the difference between the lower and upper limit of the measuring range (120 Kelvin in thisexample).
Fig. 1-6 Measuring range1 Measuring range lower limit2 Measuring range upper limit3 Measuring span
In the case of indicating and recording instruments, a distinction can be made between the measuring range (range of the measuredvariable) and the signal range (range of the measuring signal). An indicating instrument for connection to an NTC element has, for example, a measuring range of 0 to + 30 °C, which corresponds to a signal range of 0-10 VDC.
Auxiliary device
Auxiliary power
Input and output signals
Measuring range
Indication and accuracy
15

The difference between the measured value and actual value is referred to as the error and is expressed as an absolute error in unitsof the measured variable or as a relative error in percent of the mea-suring range upper limit (see chapter 4, “Tolerance and measuringerror”).The measurement accuracy indicates the maximum permissible positive and negative deviation of the indicated value as a function of the full scale value, e.g. ± 1.5 V from the full scale value 150 V.
Fig. 1-7 Example, accuracy
The quality class or accuracy class indicates the plus/minus relativeerror as a percentage of the full scale value that is permissible for ameasuring instrument, e.g. quality class 0.5 = maximum permissibleerror of ± 0.5 % of the full scale value.
In order for the measuring error to remain within the limits indicated on the measuring instrument, the specified application must be observed. The symbols for the application of measuring apparatusesare specified in the standards and indicated on the measuring instru-ments.
Fig. 1-8 Symbols and notes on measuring instruments
Moving-coilinstrumentwith built-inrectifier
Example Positions of normal use
Verticalposition
Horizontalpostion
Inclined position,e.g. 60° angle ofinclination
Direct current
Alternating current
Direct andalternating current
Type of current Test voltages
Test voltage500 V
Test voltage greaterthan 500 V (e.g. 2 kV)
No voltage testing
2
060°
Special note Accuracy classes of measuring instruments as per VDE 0410
Caution!Refer tooperatinginstructions!
The indicating error as apercentage of the full scalevalue gives the accuracy class
Precision measuring instruments Industrial measuring instruments
0.1 0.2 0.5 1 1.5 2.5 5
Caution! Refer tooperating instructions!Electrody. instrument
Three-pase insturmentwith single meas. elementastaticIndicat. error = 1.5 %Nom. frequency 50 Hz
Inclined normal position (60° angle)Test voltage 2 kV
ast 1.5 50 Hz 260°Order of symbolson the scale:
Caution! Refer tooperating instructions!Operating principle ofmeasuring elementType of measured current Accuracy classNormal conditions andzones of exposurePostion of normal useTest voltage
1.
2.
3.
4.5.
6.7.
Moving-coilinstrument
For directcurrentIndicating error = 0.1 %
Normal position horizontal
Test voltage 500 V
0.1
2
B21-7
0,5
Absolute and relative error
16

These transfer the measuring signals from the measuring element to the measuring mechanism and connect measuring devices in a manner corresponding to the physical nature of the measuring signal(e.g. resistance thermometer leads). Interference can enter the mea-suring apparatus via the signal conductors, causing falsification of themeasurement result. Line resistance must be compensated for, ifappropriate.
The value of a measured variable indicated by a measuring instrumentis never totally error free. The error limits in practical metrology are the agreed or guaranteed maximum upward or downward deviationsfrom the specified indication of an otherwise defined value.
Every measurement result is falsified by the imperfections of the measured object, measuring instruments and methods of measure-ment. Measurement results are also falsified by the influence ofambient conditions and of the observer. Falsifying ambient conditionsare, for example, temperature, air pressure, humidity, external elec-trical and magnetic fields. Falsifying personal influences depend on the characteristics and skills of the observer, e.g.:• Attention• Practice• Visual acuity• Ability to estimate• Stamina
This topic is covered in detail in chapter “Tolerance and measuringerror”.
In order to prevent errors due to incorrect use and inappropriate application of measuring instruments, it is important to observe the following points:
1. Observe the operating instructions
2. Select the appropriate measuring instrument
3. Select the appropriate accessory equipment
4. Check (adjust) the zero position
5. Observe the operating limits: position, temperature etc.
6. Avoid overloading
7. Start with the largest measuring range
8. Select the appropriate measuring range
9. Use the arresting device if appropriate
10. Handle measuring instruments with care
11. When storing multimeters, set the highest alternating current value
Signal conductors
Measuring errors,sources of error
1.10 Operating rules for
measuring instruments
17

Every measuring system, the measured section or measuring appara-tus, or parts thereof, respond to physical quantities. The term “respond”refers to the description of a reaction. The response describes, forexample, how the output value (resistance) of a temperature sensorbehaves in relation to the input signal (temperature).
A distinction is made between the steady-state response and the dynamic response.
The steady-state response indicates the relationship between the inputvariable and the output variable in the steady-state condition.
Fig. 2-1 Steady-state characteristic of a PTC temperature sensor
Figure 2-1 shows that the sensor’s resistance is 1000 Ω at a tempera-ture of 0 °C, and approximately 1100 Ω at 20 °C, for example. There-fore, a temperature change of 20 K gives rise to a 100 Ω change in theresistance of this sensor. From these two differences, the transfer co-efficient KP can be calculated using the following formula:
The dynamic response refers to the relationship between the change in the input variable �xe and the change in the output variable �xa
as a function of time �t.
The dynamic response of the system to be investigated can be evalua-ted via a sudden change of the input signal (step function). The result is referred to as the step response.
Ω=Ω
=Δ
Δ=
Δ
Δ=
ϑ
[Ω]
ϑ [°C]
1100
1000
0°C 20°C
R
2.1 General
2.2 Steady-state response
Steady-state condition
2.3 Dynamic response
Step response
2. Response
18
What happens to the output variable xa in Fig. 2-2 if the input variable xe
suddenly changes by a random value �xe?
Fig. 2-2 Recording of the transient response via the “step function”1 Input, measured variable, action, step function2 Measuring apparatus or measured section or measuring system3 Output, measured value, reaction, step response
In metrology, the step response provides information on why and howa measurement result changes. It gives us a look into the type of trans-mission and transfer of variables and helps us to assess and evaluatereactions.
Therefore, the criterion for these examinations is always the time fac-tor, i.e. the size of the delay until the steady-state condition is reached.These delays can be caused by so-called storage elements (mass, timedelay).
For practical use in HVAC, however, it is sufficient to describe the following four typical responses:1. Without time delay (PTo system)2. With dead-time response (PTo-TT system)3. With delay due to one storage element (PT1 system)4. With delay due to multiple storage elements (PTn system)
If the control valve in Fig. 2-3 is suddenly opened through a given stroke (step function) a simultaneous change occurs in the measuredvariable at the “flow volume” sensor.
Fig. 2-3 Response without time delay, e.g. flow volume change
Δy
Δx
y2
y1
x1
x2
t0
t
t
y x
V
t0
V
xe
t0
t0t
xa
1
t
3?
Δxe Δxa
21 32
2.3.1 Without time delay
19

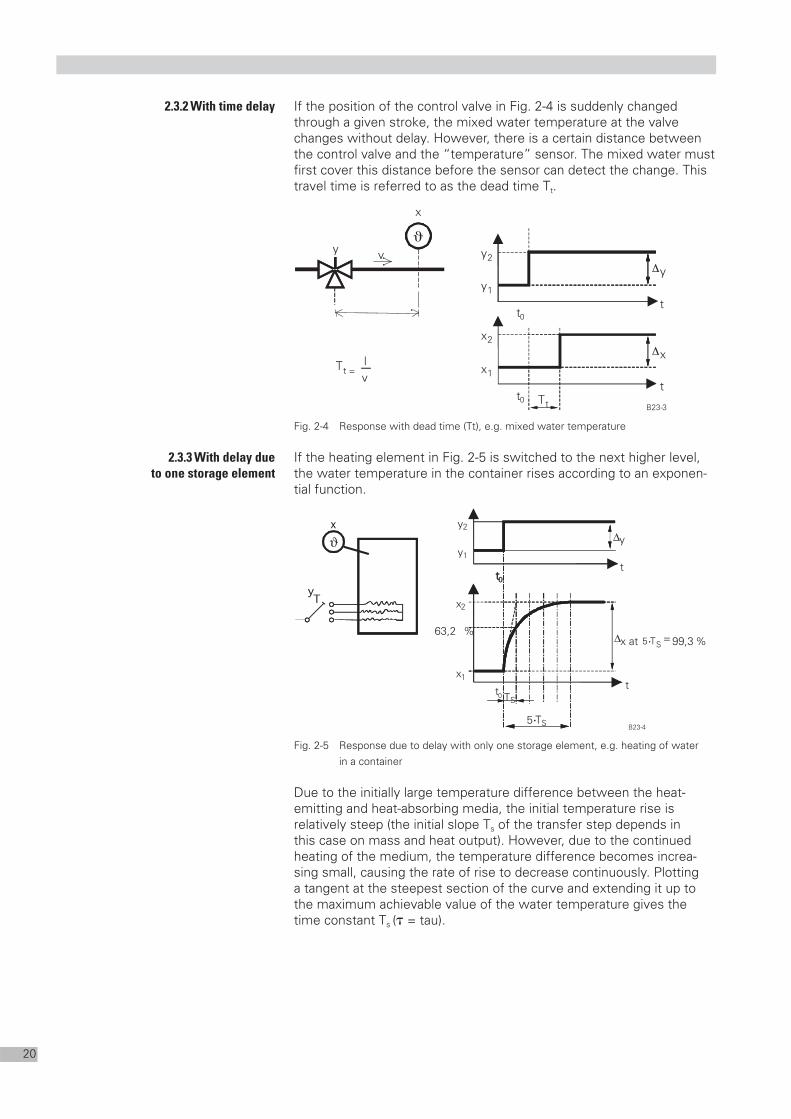
If the position of the control valve in Fig. 2-4 is suddenly changedthrough a given stroke, the mixed water temperature at the valve changes without delay. However, there is a certain distance betweenthe control valve and the “temperature” sensor. The mixed water mustfirst cover this distance before the sensor can detect the change. Thistravel time is referred to as the dead time Tt.
Fig. 2-4 Response with dead time (Tt), e.g. mixed water temperature
If the heating element in Fig. 2-5 is switched to the next higher level,the water temperature in the container rises according to an exponen-tial function.
Fig. 2-5 Response due to delay with only one storage element, e.g. heating of water in a container
Due to the initially large temperature difference between the heat-emitting and heat-absorbing media, the initial temperature rise is relatively steep (the initial slope Ts of the transfer step depends in this case on mass and heat output). However, due to the continuedheating of the medium, the temperature difference becomes increa-sing small, causing the rate of rise to decrease continuously. Plotting a tangent at the steepest section of the curve and extending it up tothe maximum achievable value of the water temperature gives thetime constant Ts (� = tau).
ϑ
5·TS
TSt0
Δx at 5·TS= 99,3 %
Δy
t
t
x2
x1
63,2 %
y2
y1
t0
x
Ty
B23-4
ϑ
t0
Δy
Δx
y2
y1
x1
x2
t0
t0
t
t
y
B23-3Tt
ϑ
x
v
vlTt =
ϑ
2.3.2 With time delay
2.3.3 With delay due
to one storage element
20
The time constant Ts is the time that the output variable xa wouldrequire for 100 % change if the initial rate of change were to remainconstant.
Or in simplified terms: 1 Ts is the time that elapses until the measuredvariable x reaches a value of 63.2 % of the total change �x.
The subsequent changes after Ts behave in the same manner, i.e. eachoccurs with the same time interval and the same percentage of theremaining amount, until after 5 time constants 99.8 % of the final valueis reached. This must be considered in all measurements.
A sudden change of the position of the control valve in Fig. 2-6 by the amount �y initially only produces a gentle rise with a small rate ofchange at the sensor (room air temperature). In the area of the inflec-tional tangent, the rate of rise of the room air temperature is greater. It then decreases again until the final value is reached.
Fig. 2-6 Response characteristic with two or more storage elements, e.g. heating of a room
The first time segment is referred to as the delay time Tu, the secondas the balancing time Tg.
The greater the number of storage elements the more gentle the riseof the temperature change will be. If the examples shown in Fig. 2-4and Fig. 2-5 also contained dead-time elements, these would, of course, also have to be taken into consideration.
Knowledge of the response of the individual components of the mea-suring apparatus and of the measured section makes it possible toassess why measurement results do not change in the same way asthe input variable and especially what the decisive causes are.
y2
y1
x2
x1
x
t0t
t
Δy
TgTu
ϑ
xΔy
B23-5
ϑ
xΔ
2.3.4 With delay due
to multiple storage elements
21

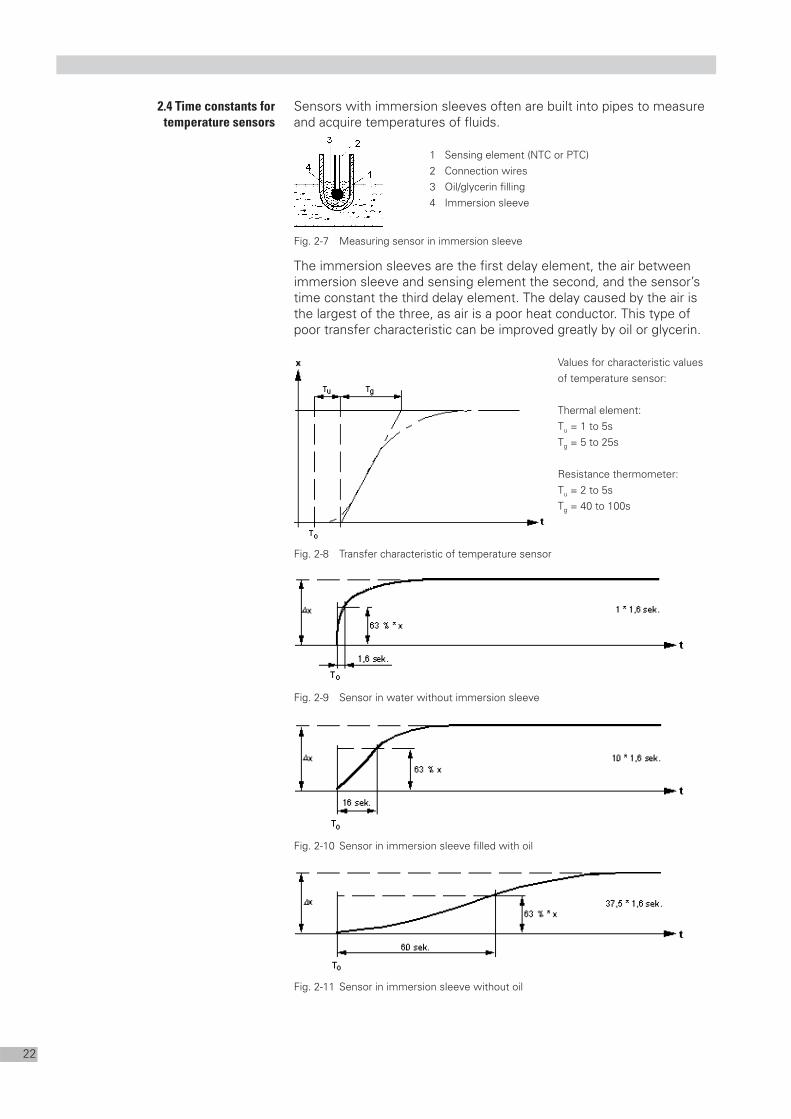
Sensors with immersion sleeves often are built into pipes to measureand acquire temperatures of fluids.
1 Sensing element (NTC or PTC)2 Connection wires3 Oil/glycerin filling4 Immersion sleeve
Fig. 2-7 Measuring sensor in immersion sleeve
The immersion sleeves are the first delay element, the air betweenimmersion sleeve and sensing element the second, and the sensor’stime constant the third delay element. The delay caused by the air isthe largest of the three, as air is a poor heat conductor. This type ofpoor transfer characteristic can be improved greatly by oil or glycerin.
Values for characteristic values of temperature sensor:
Thermal element:Tu = 1 to 5sTg = 5 to 25s
Resistance thermometer:Tu = 2 to 5sTg = 40 to 100s
Fig. 2-8 Transfer characteristic of temperature sensor
Fig. 2-9 Sensor in water without immersion sleeve
Fig. 2-10 Sensor in immersion sleeve filled with oil
Fig. 2-11 Sensor in immersion sleeve without oil
2.4 Time constants for
temperature sensors
22

Tolerance is not an error but a limit for the permissible deviation of ameasurement from the specified value. If the deviation is above orbelow the tolerance limits, it is classified as an error.
Tolerances can be defined as absolute values (°C, bar etc.) or as rela-tive values (percentage of the measuring range); they can be definedasymmetrically as a plus tolerance (+) and a minus tolerance (-) or symmetrically as a plus-minus tolerance (±). Example: with a specifiedvalue of + 20 °C and a tolerance of ± 1 K , the permissible measuredvalue is between 19 °C and 21 °C, so it has a tolerance band of 2 K.
In instrumentation and control, a distinction is made between two different types of tolerance: steady-state tolerance and dynamic tole-rance.
Steady-state tolerance is the deviation from the given value (setpoint)in the steady-state condition of a control system (stable state).
Fig. 3-1 Steady-state tolerance1 Desired value2 Continuously measured value3 Tolerance (±)4 Error
Dynamic tolerance is the deviation quantity arising from dynamic processes. Therefore, only the deviation during the unstable state of the control system, i.e. during the transient recovery process, is considered.
A tolerance specification can also contain both types of permissibledeviation. Example: the permissible steady-state deviation from thesetpoint is ± 1 K, and the permissible dynamic deviation is ± 0.5 K.Such tolerance specifications are common in the case of highly sen-sitive thermodynamic processes or procedures, e.g. in test rooms ortest sections.
B24-1
3.1 Tolerance
3.1.1 Steady-state tolerance
3.1.2 Dynamic tolerance
Steady-state and dynamic tolerance
3. Tolerance and Measuring Errors
23
An unexpected measurement result or a divergence from a controlcheck is usually interpreted as a measuring error. However, an incor-rect measurement result is not necessarily a measuring error.
A distinction is made between systematic errors and random errors:• Systematic errors have a specific amount and a specific sign, e.g.
+ 0.5 °C or 0.1 bar. Therefore, detectable systematic errors can becompensated by corrections.
• Random errors vary unequally in terms of amount and sign; theyare usually not detectable, and they make the result unreliable.
The measuring error is the difference between the actual measuredvalue of a measured variable (measured value) and the true value of the measured variable, where the origin of the difference is to befound in the measuring apparatus.
Error = measured value minus true value = absolute error quantity.
Incorrect measurement results whose origin is in the measuredsection or in the interpretation (reading, evaluation) are not measuring errors but:– measuring concept errors, planning errors, installation errors,
system faults– behavioral errors (human), interpretation errors, evaluation errors
Measuring errors cannot always be identified and corrected in advanceaccording to a plan. In many cases, they occur irregularly. However,they can be reduced by careful planning.
A measurement can never be performed ideally, i.e. without mea-suring error and duration. Measuring mainly deviates from the ideal in two points, which are explained in the following.
It is not possible to build a totally accurate measuring apparatus at reasonable cost. It will exhibit steady-state errors according to the principle of measurement and hardware design. Additionally, the relationship between the measured variable and the output signal is frequently non-linear, i.e. the transfer coefficient is not constant.Changes can also occur over time, e.g. due to ageing.The steady-state error is a deviation outside of the permissible tole-rance (deviation from the true value) in the steady-state condition (stable state – constant deviation).
• The accuracy of the measuring apparatus must be appropriate forthe given control task.
• In order to prevent falsification of the measurement results due tooutside influences (e.g. at the immersion sleeve or at the tube ofthe duct sensor), the manufacturer’s installation instructions mustbe observed.
• Observe the notes on sensor positioning (representative location,see chapter 5.4).
3.2 Measuring error
What is a measuring error?
3.2.1 Steady-state errors
Recommendations:
24
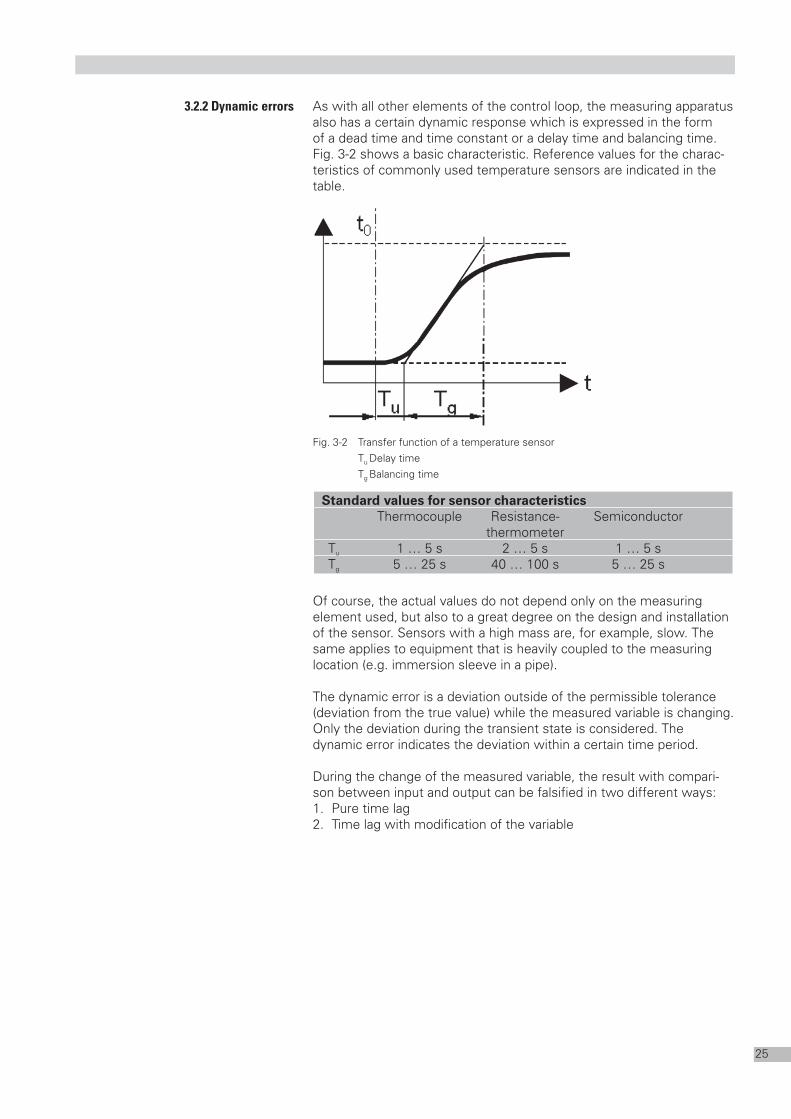
As with all other elements of the control loop, the measuring apparatusalso has a certain dynamic response which is expressed in the form of a dead time and time constant or a delay time and balancing time.Fig. 3-2 shows a basic characteristic. Reference values for the charac-teristics of commonly used temperature sensors are indicated in thetable.
Fig. 3-2 Transfer function of a temperature sensorTu Delay timeTg Balancing time
Of course, the actual values do not depend only on the measuring element used, but also to a great degree on the design and installationof the sensor. Sensors with a high mass are, for example, slow. Thesame applies to equipment that is heavily coupled to the measuringlocation (e.g. immersion sleeve in a pipe).
The dynamic error is a deviation outside of the permissible tolerance(deviation from the true value) while the measured variable is changing.Only the deviation during the transient state is considered. The dynamic error indicates the deviation within a certain time period.
During the change of the measured variable, the result with compari-son between input and output can be falsified in two different ways:1. Pure time lag2. Time lag with modification of the variable
Standard values for sensor characteristicsThermocouple Resistance- Semiconductor
thermometerTu 1 … 5 s 2 … 5 s 1 … 5 sTg 5 … 25 s 40 … 100 s 5 … 25 s
3.2.2 Dynamic errors
25

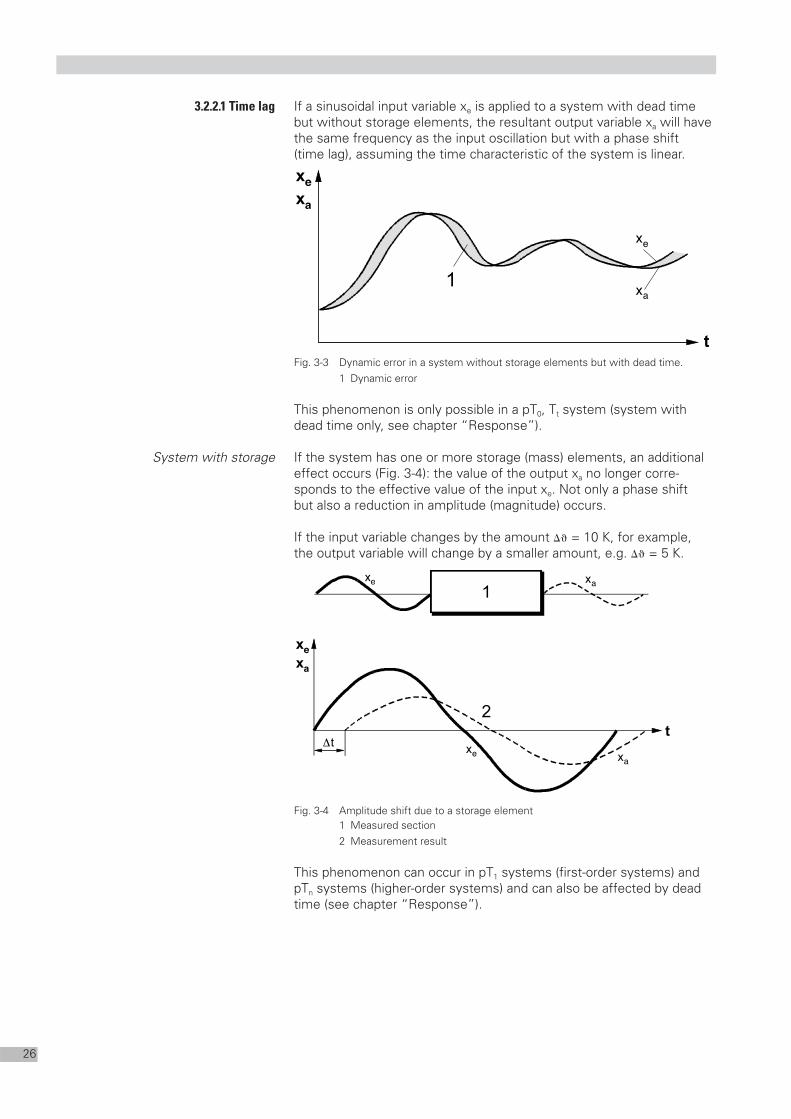
If a sinusoidal input variable xe is applied to a system with dead timebut without storage elements, the resultant output variable xa will havethe same frequency as the input oscillation but with a phase shift (time lag), assuming the time characteristic of the system is linear.
Fig. 3-3 Dynamic error in a system without storage elements but with dead time.1 Dynamic error
This phenomenon is only possible in a pT0, Tt system (system withdead time only, see chapter “Response”).
If the system has one or more storage (mass) elements, an additionaleffect occurs (Fig. 3-4): the value of the output xa no longer corre-sponds to the effective value of the input xe. Not only a phase shift but also a reduction in amplitude (magnitude) occurs.
If the input variable changes by the amount �� = 10 K, for example, the output variable will change by a smaller amount, e.g. �� = 5 K.
Fig. 3-4 Amplitude shift due to a storage element1 Measured section2 Measurement result
This phenomenon can occur in pT1 systems (first-order systems) andpTn systems (higher-order systems) and can also be affected by deadtime (see chapter “Response”).
e
a
Δ
e
e
a
a
e
a
e
a
3.2.2.1 Time lag
System with storage
26

Since the entire measuring system constitutes a chain, the modifica-tions are transferred sequentially through to the result. Each part of themeasuring system can be additionally influenced by interference varia-bles which also affect the measurement result. These facts should betaken into consideration in troubleshooting. If such distortions of themeasurement result (reading) occur within the measuring apparatus,i.e. on the instrumentation side, there is a measuring error caused byselecting too slow a measuring apparatus.
Errors also occur in measurements where a number of measured variables are required to generate a common result. Even if only one of the measured variables is transmitted to the common processingunit with the wrong value or at the wrong time, the result will be a proportional magnification of the error by the multiplication factor incorporated in the processor.
• The time constant of the measuring apparatus must correspondto the response of the measured section. Relatively slow-reactingmeasuring devices can be highly suitable for slow measured sections. However, for measuring rapidly changing processes, the measuring reaction (time constant) must be at least equally fast.
• Observe the manufacturer’s installation instructions which aim atmaking the acquisition of the measured variable as far as possibledelay-free.
• Incorrect sensor placement in the sense that the acquired mea-sured variable is not representative for the intended control task.Example: the air flow speed measured at a certain point is notalways meaningful with regard to the average speed in the duct.
• Select a distance between the manipulation point and the mea-suring point that is just large enough to ensure proper mixing of themedium. If the distance between the manipulation and measuringpoints is too large, the result will be a certain dead time. The greaterthe distance and the smaller the medium flow speed the greaterthe dead time will be.
• Work with sensible medium flow speeds (no oversized pipes andducts).
If measurements are to be taken periodically, the reading intervalsmust be regular. Irregular readings give rise to uncertainties and distor-tions with regard to interpretation. Otherwise, as shown in Fig. 3-5, an instantaneously read result may be incorrect under certain circum-stances, because the measured variable was not in the steady-statecondition at the time of reading. The measured variable reaches a higher or lower measured value at an earlier or later time.
Fig. 3-5 When is the correct time for reading?1 Incorrect: Time of reading not in steady-state condition2 Correct: Time of reading in steady-state condition
Recommendations:
3.3 Instant of measurement
27

The greater part of correcting an error is locating it. This requires themost time. In addition to solving the technical problem, there is alsothe orderly sequence of operations to be considered.
The first step is indispensable: determining how an error arises andwhere its origin is. You must try to logically reconstruct the develop-ment process of the error. In this way, you arrive at assumptions about the occurrence of errors. However, the assumptions must still be tested via comparison with the technical documentation (mea-suring plan – data – plant schematic).
Such assumptions (also known as hypotheses) always start with theinitial situation of the error (a hypothesis is an assumption without proof).
In order to assess a measurement result, all factors of the overall measurement must be taken into consideration. Therefore, the following questions may be helpful for quickly identifying an error:
• What is the purpose of the measurement?• What are the measurement conditions (permissible deviation,
tolerance guarantee)?• What is the principle of the measured section?• What is the sequence of functions from the measured section
to the measuring apparatus?• What is the principle of the measuring apparatus?
This initial situation is the most important part of troubleshooting. It provides a basis for all further procedure. You should not proceed any further until the origin of the error is clearly identified. Get a clearconcept of the error via the following logical process: observe, makeassumptions, test your assumptions, reconstruct the occurrence of the error.
When looking for the cause of an incorrect measurement result, a subdivision of the process into the following three questions suggestsitself. Is the cause of the incorrect measurement result to be found in:• The measuring apparatus?• The measured section?• Human behavior?
3.4 Troubleshooting
Procedure
28

The most important measured variables in HVAC systems are as follows:• Temperature• Relative humidity• Speed• Pressure• Volume flow
The main purpose of HVAC technology is to provide a defined climatein a room. In order to do so, the variables listed above must be keptwithin appropriate tolerances so that, for example, the comfort ofhuman occupants is not affected, or so that the room air conditions for a manufacturing process are maintained.
In this connection, four measuring locations with principally differentboundary conditions can be distinguished:
• Outside air with extreme states:– cold in winter, with high relative humidity and low absolute
humidity– hot in summer, generally with medium relative humidity and
sometimes high absolute humidity
• Central building services:this is where the plant equipment for treatment of the energymedia, i.e. water and air is located
• Transport paths:these include pipes (supply, return) and air ducts (supply air, exhaustair) with appropriate junctions (manifolds)
• Rooms:with various installations, contact surfaces to the outside or to adjacent rooms, with or without windows.
In all of these places or parts of the system, measuring locations forverification or control purposes are defined, i.e. measuring points forthe respective measured variable.The following basic requirement applies to all measuring points: thesame measurement results should be received under the same boundary conditions at different measurement times. This requiresabsolutely accurate measuring devices, and the metrologist must consider which is the correct measuring method, i.e. the correct sensor, and what is the measuring process for each location.
4.1 General
Measuring location
4. Measured Variables in HVAC
29

Temperature is a measure of the thermal state of a homogeneousmaterial, or more precisely a measure of the average kinetic energy of its molecules.
The most familiar methods of temperature measurement are based ona range of body or material characteristics that vary with temperature:• expansion of solids, liquids or gases (liquid-in-glass thermometer)• change in electrical resistance, e.g. of a nickel or platinum wire
(resistance thermometer, temperature sensor)• thermal e.m.f. (electromotive force), luminous and thermal radiation
Based on the property that, with a change in temperature, a specific,proportional change in length occurs, almost any material could beused for temperature measurement.
In the case of liquid-in-glass thermometers, the expansion of the liquidis used to directly indicate the temperature, as in a clinical thermometer.
If two metal strips with very different coefficients of thermal expansionare permanently joined together (bimetallic element), they curve accor-ding to temperature (Fig. 4-1). The difference in elongation can be usedfor temperature measurement, via an appropriate system of levers, orused as a temperature-dependent switch (thermostat).
Fig. 4-1 Applications of bimetallic curvature1 Functioning principle2 Bimetallic thermometer3 Bimetallic switch4 Delayed relay (with heating resistor), e.g. for thermal feedback
Fig. 4-2 Application via torsion of a spiral bimetallic strip
B22-1
4.2 Temperature
4.2.1 Principles of
temperature measurement
Material expansion
30

Similar to the change in volume or elongation of materials as a result of a temperature change, the conductivity of electrical conductors isalso temperature dependent, i.e. their electrical resistance changes asa function of temperature. Most such materials have a Positive Tempe-rature Coefficient (PTC), which means that their electrical resistanceincreases with rising temperature. The most common materials of this kind are platinum wire (Pt measuring element) and nickel wire (Ni measuring element). Pt 100 means: this platinum element has a resistance of 100 ohms at 0 °C.Pt 1000 means: this platinum element has a resistance of 1000 ohmsat 0 °C.Rated measured resistance Pt 100 (DIN EN 60751). Change of resi-stance for platinum ≈ 0.4%/K. The line length thus affects the mea-suring result; as a consequence, measuring equipment with three orfour wires is employed for measurement.
Ni 1000 means: this nickel element has a resistance of 1000 ohms at 0 °C.
Other substances, such as carbon, have a Negative Temperature Coefficient (NTC), which means that their electrical resistance decrea-ses with rising temperature. These NTC elements consist of pulverized and sintered (iron, nickeland cobalt dioxide) titanium compounds and fillers. They are genera-ted in the form of pearls, sticks and disks. The change in resistance is about 10 times that of metallic resistance, i.e. ca. 5% K. For tempe-rature changes of 1 K, resistance changes of 1000 ohms are possible.Line length is a negligible factor.
Fig. 4-3 Function of a PTC element Function of an NTC element
For temperature sensing and processing, the temperature-dependentresistor is placed in the diagonal branch of a Wheatstone bridge.
Fig. 4-4 Wheatstone bridge circuit with line compensation resistor Rj
T Temperature sensor R1 Measuring elementRj Compensation resistor D Measuring device (measuring apparatus)N Voltage source
∼
+−N
T
R1
Rj
D
R2
R3
R4
R1/R3 = R2/R4
∼
+−
∼
+−
∼
+−
∼
+−
∼
+−
Pt 100 NTCR [kΩ]
100
0 °C ϑ [°C]25 °C
2
ϑ [°C]
R [Ω]
4.2.2 Change in resistance
Wheatstone bridge
31

The bridge is aligned to the measuring element’s resistance value atthe onset of measuring, resulting in a display = zero at the measuringdevice.The current in the diagonal branch of the bridge circuit provides a measure for the resistance of the resistance thermometer or of thesetpoint/actual comparator circuit in a temperature controller. A con-stant voltage source is a prerequisite for exact measurement, becausethe indication is proportional not only to the current but also to the supply voltage.
In some cases the line length must be taken into account (line resi-stance falsifies the measurement result, and the line resistance is set to a fixed value, e.g. 10 ohms, with Rj).
Three-wire circuits affect temperature deviations on all three wires andresult in homogenous change in resistance on all three bridges, thusavoiding changes in the initial voltage. The influence of the ambienttemperature on the remote line is compensated for.
Fig. 4-5 Wheatstone bridge circuit, three-wire circuit with line balancing resistance Rj
Here, the measuring element is supplied by a constant power source in the measuring device. The power supplied to the sensor is thusmaintained constant along the remote line even for changes in resi-stance due to different line lengths or ambient conditions. A secondwire pair is used to measure non-volatile voltage drop on the measu-ring element. This circuit allows for very accurate measurementswithout line balancing and without ambient conditions along the remo-te line.
Fig. 4-6 Four-wire circuit with constant power source
I = konst. ≈= 24V~
10V=
. ≈=
∼
+−N
T
R1
RjD
R2
R3
R4
∼
+−
∼
+−
∼
+−
Two-wire circuit
Three-wire circuit
Four-wire circuit
32
The term humidity refers to the amount of water contained in a substance. In the case of air humidity, the water is homogeneouslymixed with the air in a gaseous state.
As with any other substance, air can only absorb a limited amount ofwater. This limit is referred to as saturation. Below the saturation limit, “humidair” is indistinguishable from “dry air” to the human eye – it is comple-tely colorless and transparent. Above the saturation limit, the excesswater precipitates in the form of very fine water droplets as a mist orcloud. The maximum amount of absorbed water at the saturation limitdepends on air pressure and temperature. It rises progressively withincreasing air temperature. At an altitude of 0 m above sea level and 0 °C it is 3.8 g/kg of air, for example. At 20 °C it is already 14.7 g/kg.
Air humidity can be expressed as a numerical value using the variablesof absolute humidity and relative humidity.
The term “absolute humidity” refers to the ratio of the weight of waterabsorbed in the air to the weight of the dry air. The unit is [g/kg].
The expression “relative humidity” means the following: the quantityof water absorbed in the air in proportion to the maximum possiblewater quantity (expressed in % relative humidity, % rH).
Air at a temperature of 20 °C (1) can absorb a maximum of 14.7 g ofwater per kg of air (14.7 g/kg) (2). Let us assume that the current watercontent is 7.35 g/kg. Therefore, the relative humidity is 50 % rH (3). These relationships are visualized on the psychrometric chart, on whichthe various states can be presented in graphic form.
4.3 Humidity
Absolute humidity
Relative humidity
Example:
33

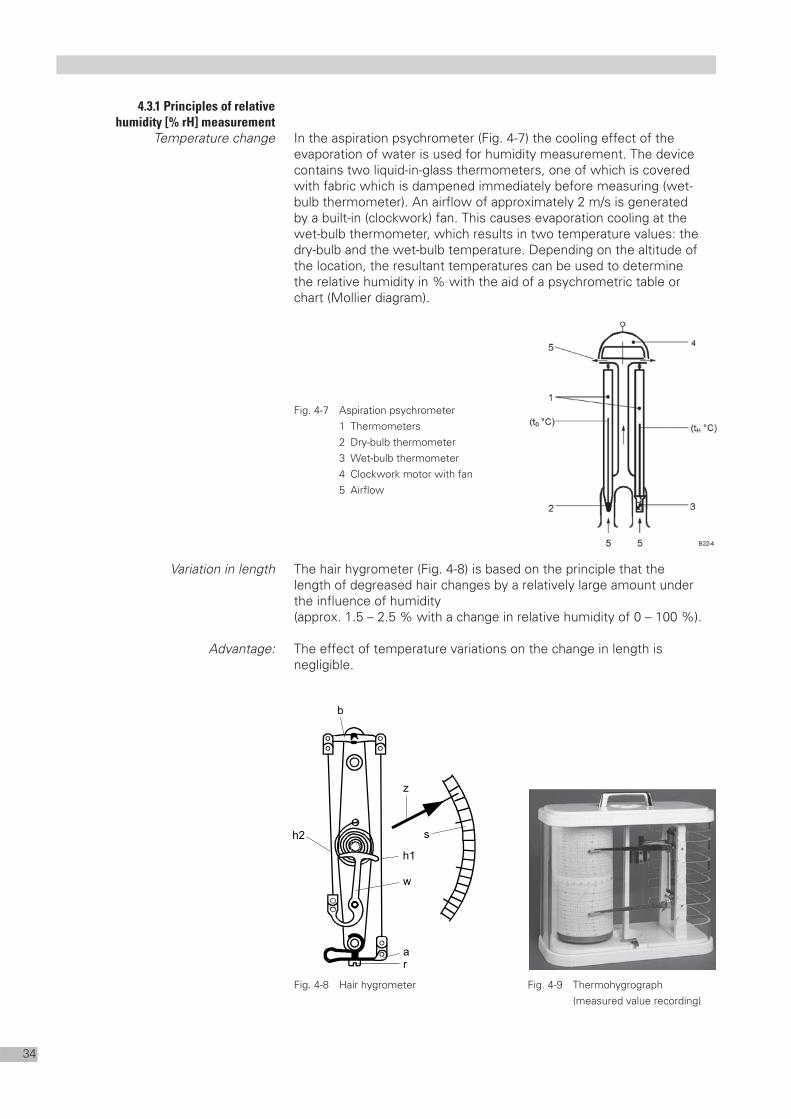
In the aspiration psychrometer (Fig. 4-7) the cooling effect of the evaporation of water is used for humidity measurement. The devicecontains two liquid-in-glass thermometers, one of which is coveredwith fabric which is dampened immediately before measuring (wet-bulb thermometer). An airflow of approximately 2 m/s is generated by a built-in (clockwork) fan. This causes evaporation cooling at thewet-bulb thermometer, which results in two temperature values: thedry-bulb and the wet-bulb temperature. Depending on the altitude ofthe location, the resultant temperatures can be used to determine the relative humidity in % with the aid of a psychrometric table or chart (Mollier diagram).
Fig. 4-7 Aspiration psychrometer1 Thermometers2 Dry-bulb thermometer3 Wet-bulb thermometer4 Clockwork motor with fan5 Airflow
The hair hygrometer (Fig. 4-8) is based on the principle that the length of degreased hair changes by a relatively large amount underthe influence of humidity (approx. 1.5 – 2.5 % with a change in relative humidity of 0 – 100 %).
The effect of temperature variations on the change in length is negligible.
Fig. 4-8 Hair hygrometer Fig. 4-9 Thermohygrograph(measured value recording)
4.3.1 Principles of relative
humidity [% rH] measurement
Temperature change
Variation in length
Advantage:
34

A hair bundle (h1) attached at point (a) is connected via a double lever(b) to another hair bundle (h2) in order to increase the effective length.This is connected to a pointer mechanism (w) which transfers thechange in length of the hair as a function of relative humidity to a pointer (z) on a scale. It is important that the measuring element is continually exposed to a certain humidity level and that the surround-ing air can circulate freely.
This principle is frequently applied in a measuring device with an integrated temperature measuring element, the so-called thermo-hygrograph (Fig. 4-9).
In recording devices, the measuring element is connected to a fiber or metal-tipped recording pen instead of a pointer. The clockwork mo-tor draws a paper chart past the recording pens over a defined period(e.g. 24 hours or 1 week), and the measured values are plotted on it in the form of a graph.
The measuring element of the sensor (Fig. 4-10) consists of a capacitorwith a polymer dielectric and very thin gold electrodes. Humidity entersthe dielectric through the electrodes, changing the capacitance of thecapacitor. This change in capacitance is electronically processed, ampli-fied and output, e.g. as a 0 – 10 V DC signal. The signal corresponds,for example, to a relative humidity of 0 – 100 % (Fig. 4-11).
Fig. 4-10 Capacitive humidity measuring element1 Porous covering electrode2 Humidity-absorbent polymer3 Base electrodes4 Substrate
Fig. 4-11 Schematic diagram of a capacitive humidity sensor
�
B22-8
is equivalent to 0 – 100 % rH
Function:
4.3.2 Principle of capacitive
humidity measurement
35
The measurement of absolute humidity is of interest in all cases wherethe quantity of water absorbed in air or a gas needs to be known.
Absolute humidity is measured by determining the partial pressure ofwater vapor in air e.g. with the aid of hygroscopic lithium chloride LiCL.
Lithium chloride LiCl, the lithium salt of hydrochloric acid, forms colorless, strong hygroscopic crystals at a melting point of 610 °C and a density of 2.07 g/cm3. Lithium chloride is generated from a watery lithium hydroxide or lithium carbonate solution with hydrogen chloride and subsequentdephlegmation and draining.
• Fluxing agent for soldering and welding• Basic element to generate lithium (fused mass electrolysis)• Due to the high hygroscopic effect as draining agent, measuring
of absolute humidity, also for room dehumidification
A temperature measuring element coated by a fiber glass sleevesoaked in LiCL. This coating contains two neighboring, corrosion-resistant precious metal electrodes in helical form. Alternating current applied to the electrodes generates a heating effect of current in the LiCL solution, which extracts the water takenfrom the environment by the hygroscopic LiCL solution until the water vapor pressure equals the partial pressure of the water vapor in the ambient air and the solution becomes crystalline. The crystalline LiCL has a higher el. resistance, the current and thusheating effect of current decrease, the LiCL reabsorbs humidity. Thus,a temperature is generated at which there is no exchange of humiditybetween LiCL and the ambient air on average. This temperature isused to measure the water vapor partial pressure of the ambient air.
• High maintenance (lithium chloride must be renewed• Passive measuring equipment (works only with voltage present)• Current, better solution employs enthalpy calculation.
Fig. 4-12 Diagram for capacitive humidity sensor1 Temperature measuring element2 Fiber glass sleeve3 Electrode wires
4.3.3 Principle of absolute
humidity (x) measurement)
Lithium chloride LiCl
Employment
Principle
36

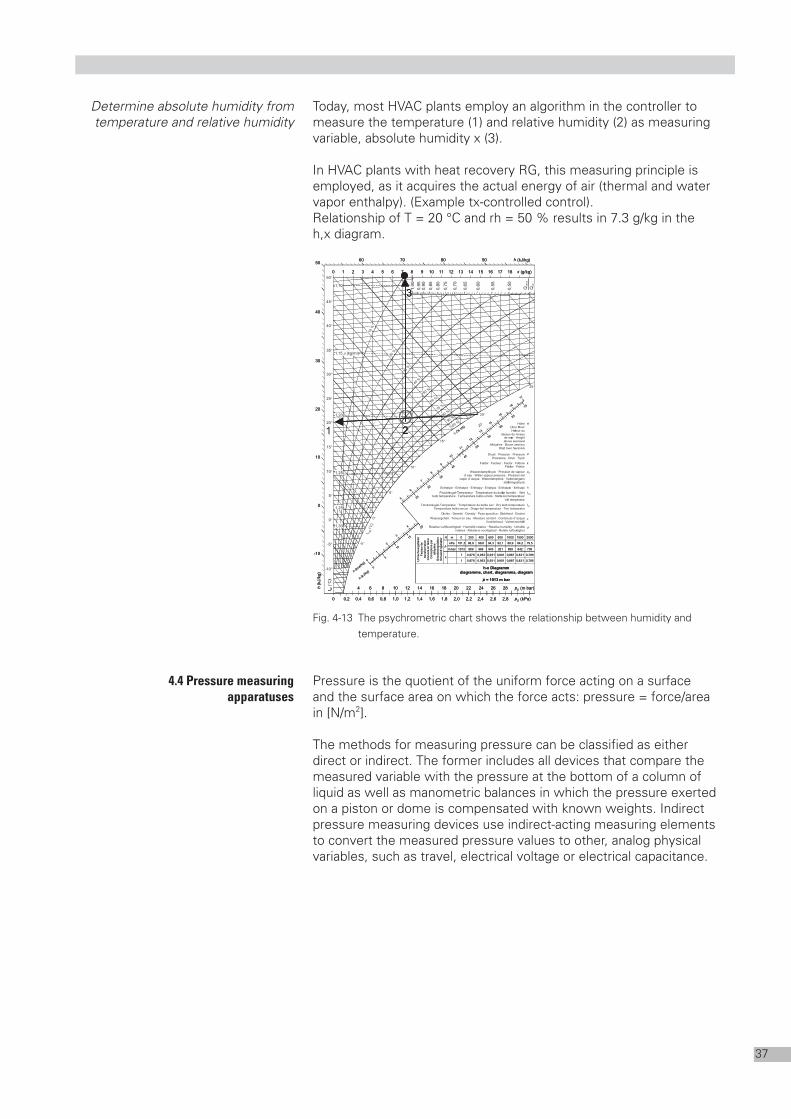
Today, most HVAC plants employ an algorithm in the controller to measure the temperature (1) and relative humidity (2) as measuringvariable, absolute humidity x (3).
In HVAC plants with heat recovery RG, this measuring principle isemployed, as it acquires the actual energy of air (thermal and watervapor enthalpy). (Example tx-controlled control).Relationship of T = 20 °C and rh = 50 % results in 7.3 g/kg in the h,x diagram.
Fig. 4-13 The psychrometric chart shows the relationship between humidity and temperature.
Pressure is the quotient of the uniform force acting on a surface and the surface area on which the force acts: pressure = force/area in [N/m2].
The methods for measuring pressure can be classified as either direct or indirect. The former includes all devices that compare themeasured variable with the pressure at the bottom of a column ofliquid as well as manometric balances in which the pressure exerted on a piston or dome is compensated with known weights. Indirectpressure measuring devices use indirect-acting measuring elements to convert the measured pressure values to other, analog physical variables, such as travel, electrical voltage or electrical capacitance.
Determine absolute humidity fromtemperature and relative humidity
4.4 Pressure measuring
apparatuses
37
We differentiate between four different methods:• Differential pressure measurement• Speed measurement• Bypass measurement• Flow measurement
Each of these methods has technical and economic advantages to be weighted for each application. Refer to the table at the end of this chapter.
Below is a definition and brief explanation of each method, followed by a more detailed explanation of each method.
This method employs the direct relationship between pressure drop at flow resistance and volumetric flow. The basis is Bernoulli’s equa-tion supplemented by empirical correction factors, which describes thedependence of the flow’s speed (prop. volumetric flow) of pressure.
Speed is measured in one or several points within a flow cross section,allowing for calculating the volumetric flow.
In flow measurement by the differentialpressure method, the cross-sectionalarea of the pipe is reduced at a singlelocation,which increases the flow speedat the same volume flow rate.
The most important basic physical princi-ples of the differential pressure methodare provided in the following.
Fig. 4-14 Pressure and flow progression at an orifice
Bernoulli’s equation states that, in frictionless, steady-state fluid flows,the sum of the kinetic energy, potential energy and pressure is con-stant along a flow line. It is as follows for incompressible fluid flows:
v velocityh heightp absolute pressureρ density
.constpghv2
2 =++ ρρ
4.4.1 Methods for measurement
Differential pressure measurement
Speed measurement
4.4.1.1 Differential pressure
measurement method: Basics
Introduction
Bernoulli’s equation
38
Bac
k p
ress
.
Press. progression:in the pipe centerat the pipe wall
Residualpressureloss

Bernoulli’s equation assumes frictionless flow, which does not exist inreality. Therefore, the ideal calculation presented here must be modi-fied to reflect the actual conditions using correction factors. Result:
α flow coefficientε correction factorp absolute pressureρ densityA0 cross-sectional area
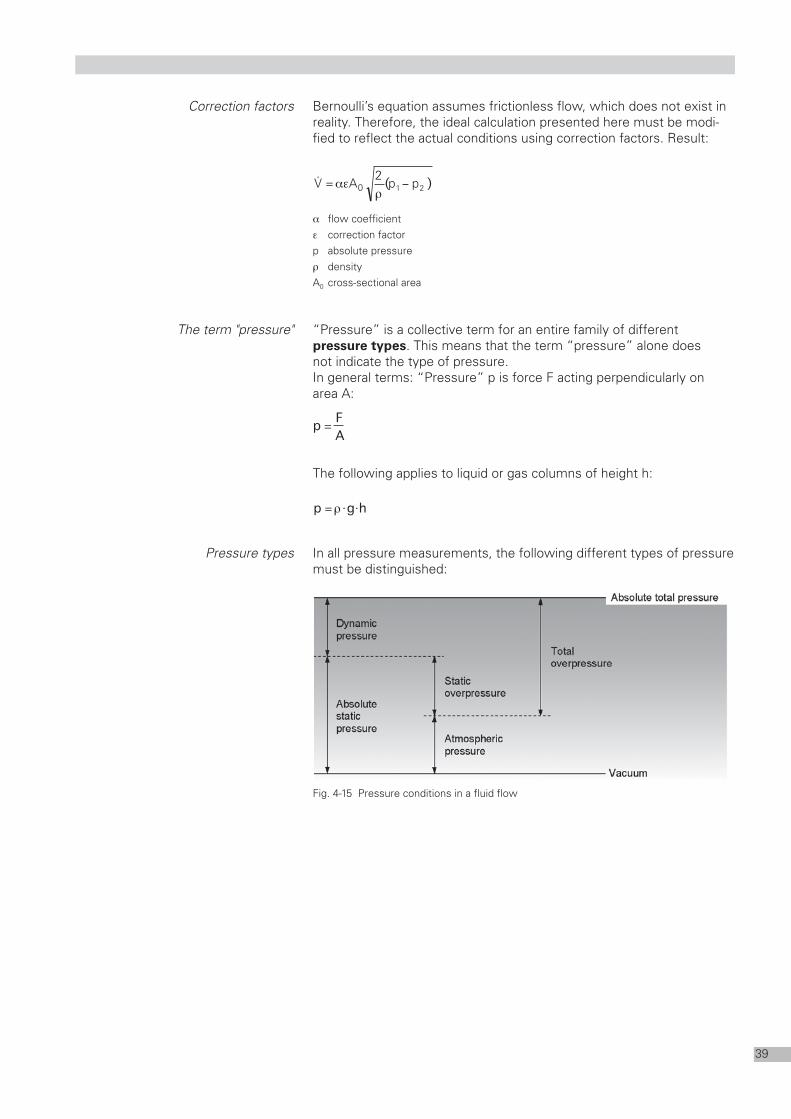
“Pressure” is a collective term for an entire family of different pressure types. This means that the term “pressure” alone does not indicate the type of pressure. In general terms: “Pressure” p is force F acting perpendicularly on area A:
The following applies to liquid or gas columns of height h:
In all pressure measurements, the following different types of pressuremust be distinguished:
Fig. 4-15 Pressure conditions in a fluid flow
hgp ⋅⋅ρ=
A
Fp =
)pp(2
AV 210 −ρ
αε=·
Correction factors
The term "pressure"
Pressure types
39

Pressure acting on a particle entrained in a fluid flow at the speed offlow. Static pressure is measure perpendicular to the speed vector.
Static pressure of a fluid with respect to the absolute vacuum.
Absolute static pressure of a fluid minus atmospheric pressure.
Pressure resulting from the kinetic energy of a fluid. Dynamic pressureis zero in a fluid at rest.
Static overpressure plus dynamic pressure.
Absolute total pressure characterizes the energy state of a fluid aftercomplete conversion of its flow energy into pressure energy. It repre-sents the sum of the absolute static pressure and dynamic pressure.
Pressure difference created by a flow resistance, which is used tomeasure the flow rate or flow speed.
If v1 = 0, at small pressure differences, Bernoulli’s equation (see alsochapter 1 ibid)…:
…produces the outflow speed:
For cross-sectional area A, outflowing mass flow M is calculated as follows:
Where A cross-sectional area m2
v outflow speed ms-1
�p (p1 – p2) differential pressure N(m2)-1
ρΔρ p2AvAM ==
ρ
Δ
ρ
p212
2)pp(2vv =
−==
( ) ( )222
211 v
2pv
2p
ρ+=
ρ+
Static pressure
Absolute static pressure
Static overpressure
Dynamic pressure
Total pressure
Absolute total pressure
Differential pressure
Basic principles for small pressure differences
Outflow speed
Mass flow
40
[kgs-1]
[ms-1]

In the basic principles of the differential pressure method, we used the“pressure and flow progression at an orifice” picture as the most sim-ple illustration for flow resistance. In fact, however, the differentialpressure method is not limited to a given type of flow resistance.
“Flow resistance” is often used in theoretical considerations. The term “throttling device” is frequently encountered in practice.
The following are particularly suitable as flow resistances;• Orifice,• Nozzle, and• Venturi nozzle.We will discuss the properties of these three flow resistances in thefollowing.
Most simple type of flow resistance (suitable for differential pressuremeasurement).
Standard orifices can be used for the following:• Pipe diameter D in the range 50…1000 mm.• Opening ratios μ of 0.05 … 0.64
A typical feature of orifices is the contraction ofthe airflow in the orifice. The amount of contraction, expressed by con-traction coefficient μ, has a decisive influence onflow coefficient α.This in turn depends, among other things, on theReynolds number Re – see the “flow coefficientsfor standard orifices” picture.
Fig. 4-16 Standard orifice (cp. DIN 1952)
All speed measurement principles have one thing in common: Theymeasure speed w only at a single point in the pipe or duct cross-sec-tion. Annubar flow measurement is an exception.
As you know from the theory, the speed is not the same everywhere.If the laws of fluid dynamics are observed, i.e. if a sufficiently long inlet and outlet is provided, the average speed can be calculated by the following approach.
)85.0...8.0(vv max=
4.4.1.2 Differential pressure
measurement: Flow resistance
Terminology
In practice …
Orifice
Application
Properties
4.4.1.3 Speed measurement method
Point measurement
Average speed
41
Pip
e in
tern
al d
iam
eter
D
Another approach is the selection of the measuring point in the cross-section. It can be determined as follows. However, the laws of fluiddynamics must also be observed here.
The measurement expense becomes considerably greater if you wantto determine the volume flow rate more precisely, or if there is no fullydeveloped flow.Precise measurements can only be achieved with grid measurementcovering the different speeds over the entire cross-section.
The loop method is mainly used in large ducts and downstream ofinstalled elements (filters, heat exchangers, etc.). The measuringinstrument, which is usually a vane anemometer, is moved uniformly in several loops over the entire cross-section.• The measuring instrument must be capable of automatic averaging.• The measurement must be repeated at least twice. It is only
suitable for quick checking.
Speed measurements by the grid method in a defined pipe or ductcross-section can be performed by one of the following procedures.They are applied under the following conditions in particular:• Non-uniform speed distribution, and therefore also a• Shortened inlet section.
All methods of measurement are referred to as trivial where no particular assumptions can be made about the speed profile. Thespeed profile is measured point-by-point on any number of measure-ment lines. The number of measuring points depends on the cross-sectional area and on the expected speed profile.
In rectangular cross-sections,the measurement cross-sec-tion can be divided into areasof equal size.The centroidal axis method(next section) should be app-lied for circular and annularcross-sections.
Fig. 4-17 Division of a rectangular cross-section into equally large measurement areas (o: measuring points)
v approx. at 0.119 D
Measuring point selection
Note
Loop method
Note
Grid measurements
Trivial methods
42

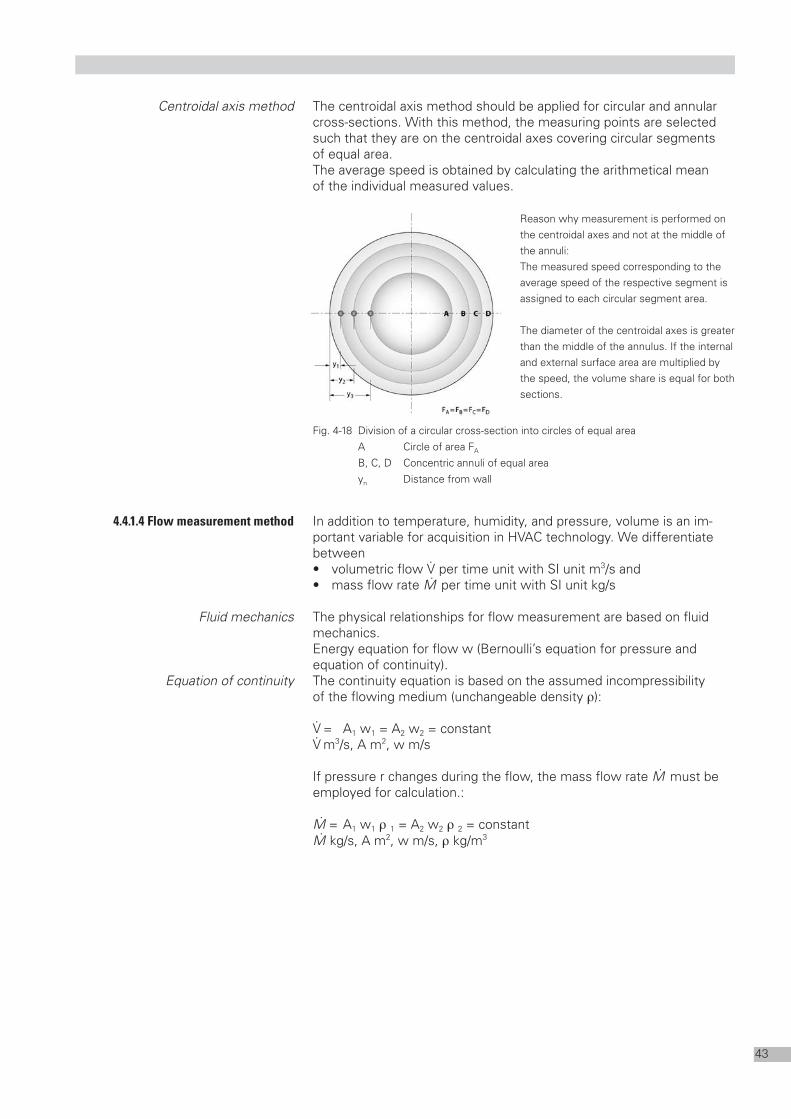
The centroidal axis method should be applied for circular and annularcross-sections. With this method, the measuring points are selectedsuch that they are on the centroidal axes covering circular segments of equal area. The average speed is obtained by calculating the arithmetical mean of the individual measured values.
Reason why measurement is performed onthe centroidal axes and not at the middle ofthe annuli:The measured speed corresponding to theaverage speed of the respective segment isassigned to each circular segment area.
The diameter of the centroidal axes is greaterthan the middle of the annulus. If the internaland external surface area are multiplied bythe speed, the volume share is equal for bothsections.
Fig. 4-18 Division of a circular cross-section into circles of equal area
A Circle of area FA
B, C, D Concentric annuli of equal area
yn Distance from wall
In addition to temperature, humidity, and pressure, volume is an im-portant variable for acquisition in HVAC technology. We differentiate between• volumetric flow V
.per time unit with SI unit m3/s and
• mass flow rate M.
per time unit with SI unit kg/s
The physical relationships for flow measurement are based on fluidmechanics.Energy equation for flow w (Bernoulli’s equation for pressure and equation of continuity).The continuity equation is based on the assumed incompressibility of the flowing medium (unchangeable density ρ):
V.
= A1 w1 = A2 w2 = constant V.
m3/s, A m2, w m/s
If pressure r changes during the flow, the mass flow rate M.
must beemployed for calculation.:
M.
= A1 w1 ρ 1 = A2 w2 ρ 2 = constant M.
kg/s, A m2, w m/s, ρ kg/m3
Centroidal axis method
4.4.1.4 Flow measurement method
Fluid mechanics
Equation of continuity
43

The pitot tube measures total pressure and static pressure. The diffe-rence between them is the dynamic pressure, which can be used tocalculate speed according to the following formula:
The pitot tube measures total pressureand static pressure. The difference bet-ween them is the dynamic pressure,from which the speed can be calculatedaccording to the following formula:
ρ = air density
Fig. 4-19 Pressure measurement using a pitot tube
The pitot tube is used to determine speed indirectly.
If there is a change of cross-sectional area in a duct, the static pressure rises or falls. The dynamic pressure changes in the oppositedirection, because the speed varies according to the new cross-sectio-nal area. If friction is neglected, Bernoulli’s equation applies along aflow stream:
With the terms ρstat 1, v1 und ρstat 2, v2 the equation is as follows:
Fig. 4-20 Decrease in static pressure with a narrowed cross-section
A2A1
v1 v2
ρstat1 ρstat2
PPPPssssttttaaaattttPPPPssssttttaaaatttt
PPPPddddyyyynnnnPPPPddddyyyynnnn
PPPPssssttttaaaatttt
PPPPddddyyyynnnn
PPPP
PPPPggggeeeessss
PPPP
LuftrichtungLuftrichtung
ρstat ρstat ρstat
ρdyn ρdyn ρdyn
ρges
Air flow direction
2vρ
2vρ
22
2stat
21
1stat⋅+=⋅+ ρρ
ρges = ρstat + ρdyn = constant
2v
ρ2
dyn⋅
=ρ
4.4.2 Measurement in
gases/air and fluids
4.4.2.1 Prandtl’s pitot tube
Note
Bernoulli’s equation
44
ρdynρ2
v =
ρtot ρstat ρdyn

In a ventilation system with obstructions, deflections, etc., pressurelosses occur do to friction, which the fan must overcome be increasingthe static pressure. The following picture shows a typical pressure pro-gression in such a system.
Fig. 4-21 Pressure progression in a ventilation system:
As relatively low-cost devices, inclined-tube manometers are used for pressure measurement in HVAC. Their advantages are a compactdesign, relatively high precision, and reliability.
Most important values of commer-cially available inclined-tube mano-meters:Pressure range 0...750 PaReading accuracy 3 ... 10 %
Fig. 4-22 Principle of the inclined-tube manometer
The following pictures show (a) a simple, variable inclined-tube manometer, and (b) a high-precision inclined-tube manometer of commercially available types.
Fig. 4-23 Simple inclined-tube manometer Fig. 4-24 El. measuring instrumentfor two pressure ranges (variable)
The pressure difference is determined by the fluid’s hydrostatic pressure.
P = ρ * h * g (g = force of gravity = constant)
Caution: Note the medium’s density.
++++
pges1
pges2
p dyn
1
p sta
t1
p dyn
2
p ges
1p g
es2
Δpge
s
p0
Pressure losses due to friction
4.4.2.2 Inclined-tube manometer
Inclined-tube manometer
Principle
45
0 1
2
3
4
5
67

The U-tube manometer consists of a U-shaped glass tube filled with acolored liquid of known density (Fig. 4-25). To perform the measure-ment, one or both of the limbs are connected to the respective measuring points. The pressure or pressure difference gives rise to a difference in the height of the liquid in the two limbs of the U-tube.
Fig. 4-25 U-tube manometer Fig. 4-26 Closed-ring manometer1 Bearing (needle bearing)2 Counterweight3 Separating wallP1,2 Pressure connections
Practical application of the U-tube manometer:measuring low pressures or pressure differences, e.g. for filter monitoring.
The closed-ring manometer shown in Fig. 4-26 (ring balance) is a ringthat is half filled with a sealing liquid and mounted on a rotating bea-ring. The pressure difference acting on the separating wall (3) causes a deflection of the ring until the lifted weight (2) gives rise to a corre-sponding counter-torque.
Practical application of the closed-ring manometer:measuring low pressures or pressure differences, e.g. for monitoringoperating rooms.
Pressure measuring devices contain measuring elements that maydeform elastically under density. This movement is transferred to a dial train.Depending on the application, devices featuring tubes, diaphragm or capsule element gauge systems are better suited.
5 − 500 − 5
4 − 400 − 4
3 − 300 − 3
2 − 200 − 2
1 − 100 − 1
0 − 0 − 0
2 − 200 − 2
3 − 300 − 3
4 − 400 − 4
5 − 500 − 5
mbar mbarP
1 g/cm2
4.4.2.3 U-tube rmanometer
4.4.2.4 Closed-ring rmanometer
4.4.2.5 Elastic pressure meters
46

Fig. 4-27 Tube spring system, Bourdon tube pressure gauge MAN-R (company Kobold)Measured range: -1 to 0 ... 0 to 1000 bar
The measuring element consists of a flat pipe closed at the end andcurved to an arc of a circle of ca. 270°. If the interior is pressurized, theoval cross section puts pressure on the arc, effecting a larger radius ofcurvature. As the tube spring is finally anchored at the open ending, thechanges to the radius of curvature result in a shift of the tube end. Thischange is indicated via a lever and rotary system.
Fig. 4-28 Diaphragm pressure gauge system Diaphragm pressure gaugeMeasured range: 0 to 40 mbar ... 0 to 40 bar system MAN-P (company. Kobold)
These measuring devices contain a measuring element made from a springy metal plate attached to the circumference between flanges.If the pressures at both sides of the diaphragm differ, the diaphragmcurves to the corresponding side in accordance with the pressure difference.Fig. 4- shows two cross sections with a) vertical and b) horizontal diaphragms and one-sided pressure connection. Adding a pressure connection to the second side and sealing the pressurized spaceagainst atmosphere results in a diaphragm pressure difference mea-suring device. Measuring devices with vertical arrangement offer better transfer possibilities and can also be integrated in panels. Formeasuring ranges below 1000 Pa, the diaphragm’s stroke is insufficientand a capsule element gauge system must be employed.
Tube spring system
Diaphragm pressure system
47

Fig. 4-29 Capsule element gauge system Capsule element gauge MAN-K (company Kobold)Measured range: -25 to 0 mbar ... -600 to 0 mbar
The measuring devices consists of two interconnected diaphragms as shown in Fig. 4-29. One diaphragm is fixed; as a result, the second diaphragm doubles stroke for pressure changes.
In this measuring system, the pressure to be measured is converted to a force by a slack diaphragm or metal bellows, whereby the forceacts on a helical spring (Fig. 4-30). Suitable materials for slack dia-phragms are, for example, rubber, leather and highly flexible plastics.
Fig. 4-30 Principle of slack-diaphragm pressure measuring devices
When pressure p acts on diaphragm surface A, the spring is compres-sed until the spring force equals the resultant force of p x A. The strokeof the helical spring is proportional to the pressure or measuring force,i.e. there is a linear relationship between pressure and spring travel.The travel of the spring is transferred to a pointer, recording pen, plun-ger coil or voltage divider.
With double-sided pressurization of the slack diaphragm, differentialpressures can be measured.
Slack diaphragm pressure gauges are generally suitable for measuringpositive, negative and differential pressure with measuring ranges between 0 – 50 and 0 – 3000 [Pa].The field of application in HVAC is very broad, ranging from filter anddrive belt monitoring to measuring apparatuses for pressure control in ventilation systems.
A
p
A
pB22-12
Capsule element gauge system
4.4.2.6 Spring loaded
diaphragms and bellows
Measuring range 0 – 50 Pa or 0 – 3000 Pa
48

There are various methods of electrically measuring pressure. Forexample, the resistance of a wire changes with pressure. The rela-tionship between pressure and resistance is linear and for some materials the resistance is also temperature independent. This measuring technique was earlier used to measure high pressure (from 3000 to 30000bar).A further method relies on the pressure dependence of the surfaceresistance of conductors. To increase the conductor surface area(mostly carbon in laminate form) the laminates are molded into a pile. Errors in the region of ±1 – 3% can be reached if very precise production methods are used. Measuring devices which apply thismethodology are especially suitable for recording quickly changingpressures because of the high natural frequency.
These method applies the effect that crystals such as quartz, turma-line, Rochelle salt, amongst others have the property that they can becharged with electricity proportional to the pressure on their surface.Quickly changing pressures an pressure oscillations can be easily re-corded using these methods. When the charge is very small then thepotential difference must be amplified. Further, this method may beused applying various laminates in layers in order to reach a highercharge by using a larger surface area.
• Piezoresistive measuring system• Output signal DC 0 ...10 V• Sensor completely encapsulated in a cast
synthetic resin• Measurement unaffected by temperature
changes• High temperature stability• No mechanical ageing, no mechanical creepage• Internal thread UNF 7/16
Fig. 4-31 Pressure sensor to measure over and under pressure in HVAC applications with cold fluids or gases (Siemens Product)
QBE621-P...U pressure sensors are suitable for the measurement ofstatic and dynamic positive and negative pressures in HVAC applica-tions, particularly in hydraulic and refrigeration systems using liquid or gaseous media. The sensor operates on piezoresistive measuringprinciples. The ceramic diaphragm (thick-film hybrid technology) measures the pressure through direct contact with the medium. Themeasurement is converted electronically into a linear output signal ofDC 0 … 10 V.
4.4.2.7 Measurement of
pressure using electrical effects
Measuring range 300 kPa to 3000 kPa
Piezoresistive system
Usage
49

Fig. 4-32 Pressure sensor applying the piezoelectric principle for VAV-installations (Picture from Siemens)
In ventilation/air conditioning systems, volumetric flow measurementnormally is as described in Fig. 4-19, via dynamic pressure, or via hotwire or vane anemometer.
In a vane anemometer, there is ideally the following relationship between peripheral speed vu and air speed v
Where α is the angle of attack between the vane and the direction of flow.
In case of rapid speed variation, vane anemometers measure an excessively high average value. Additionally, correction is required in case of great changes of density. A density change of some 10%gives rise to a speed measurement deviation of approximately 5%.
If a vane anemometer is used in small pipe diameters Ak where the ratio of the effective anemometer cross-section Ag to the pipecross-section is greater than 0.01, correction is required according to the following formula:
.displk
gk.eff v
A
AAv
−=
αtgvvu ⋅=
Type Pressure Range SignalQBE621-P10U -1 ... 9 bar -100 ... 900 kPa -14.5 ... 130 psi DC 0 ...10 VQBE621-P25U -1 ... 24 bar -100 ... 2.4 MPa -14.5 ... 348 psi DC 0 ...10 V
50
Type overview
4.4.2.8 Vane anemometer
Function
Properties
(Correction formula)

Vane anemometers are especially suitable for quick checks on the plantand for measuring speeds in excess of 1 m/s.
Fig. 4-33 Indicator of a vane anemometer with standard measuring head (middle) and special measuring head (right)
The flow of air past an electrically heated sensor cools it down, so that the sensor’s temperature provides a measure of flow speed atconstant heating power, or the heating power provides a measure of flow speed at constant temperature.
Hot-wire anemometers have a short response time, and are especiallysuitable for low speeds from 0.1 ms-1. Thermal probes have a robustdesign, so their response time is longer, otherwise the same condi-tions apply as to hot-wire anemometers. Temperature compensationand dust pollution are a particular problem. Hot-wire anemometers are highly sensitive measuring instruments, and they should be treatedas such.
Fig. 4-34 Indicator of a hot-wire anemometer (left) with a universal measuring probe (middle) and a special measuring probe for room airflows (right)
Important• In the case of low-turbulence flow (e.g. in clean rooms) greater
room airflow speeds are permissible than with highly turbulent flow.• Generally speaking, greater room airflow speeds are permissible at
higher room air temperatures than at lower room air temperatures.
4.4.2.9 Hot-wire anemometer
Properties
51

We differentiate between two methods to measure volumetric flow in fluids:
A. Still mediumB. Flowing medium
Fluids in containers can be measured indirectly. To this end, the leveland the current fluid volume are determined via the know maximumcontainer volume.Possible procedures:• Inspection glass• Swimmer• Conducting capacity
Normally, the time-dependent flowing volume of the flowing medium,i.e. the flow volume, is of interest.Possible procedures:• Filling chamber meter• Displacement meter• Flow speed measuring equipment
In this method, the medium to be measured flows into a measuringchamber. When full, the medium is transported out of the chamber to the next destination and the chamber is refilled.
Fig. 4-35 Drum meter1 Inlet2 Direction of flow3 Measuring chamber4 Outlet
The measuring device features a movable chamber driven solely by the flowing medium, whereby the number of rotations is counted.
Fig. 4-36 Oval wheel meter (function)
4.4.3 Measurement in fluids
Still medium
Flowing medium
4.4.3.1 Filling chamber meter
4.4.3.2 Displacement meter
52

In this method, the flow volume is determined via flow speed and agiven flow cross section.When measuring the speeds, applicable influences of laminar or turbulent flow forms must be noted, as the speed profile in these flowpipes differs. Also, pressure losses in the fluid must be accounted forduring measuring.There are many ways to determine the throughput rate.
The medium flows tangentially onto a vertically positioned wheel whose number of rotations is transferred directly to a dial train (or indirectly via magnetic coupling) by means of a gear train.The result is displayed in volume or speed units.
We differentiate between single or multi-beam meters.
Fig. 4-37 Oval wheel meter1 Impeller wheel2 Measuring chamber
Mechanical single-beam impeller wheel meter to mea-sure consumption of cold or hot water. Display ofcumulated consumption. Versions with or withoutremote query output. Housing made from nickel-platedbrass, dry running meter with magnetic transfer androtary metering mechanism.Horizontally mounted = class AVertically mounted = class BMechanical single-beam water meters are availablefrom Siemens Building Technologies to a rated flow of2,5 m3/h. ’Cold water WFK... and hot water WFW...Rated pressure 10 bar Pressure drop 250 mbar (bei Qn) Impulse value 10 l/Imp. Current limit 100 mA Cable length ca. 1,5 m
The Siemeca™ water meters are electronic dry runningmeters available as single-beam and measured capsuleelement meters. They are employed to acquire hot orcold water consumption in residential and industrialareas. They transmit wireless current measured valuesand consumption of the set day to the desired datagathering device.The water meters are available in different shapes anddifferent sizes, allowing for equipping all standardplants. Residential users can view individual consump-tion on a large, easy-to-interpret display.The integrated lithium battery provides energy to thedevice for more than one calibration period.
Fig. 4-38 Siemeca™ impeller The water meter is available as cold water meter wheel water meter WFC2.. and hot water meter WFH2...
Flow speed measuring equipment
4.4.3.3 Oval wheel meter
53

As energy consumption and saving are also subject to laws, measuringheat volumes is an important function of building automation and control.Heat volume Q is measured (indirect) via the product of flow and temperature difference with the following formula:
Q = m * c * �� [kg * J/kg K * K] = [J]
Fig. 4-39 Diagram of a district heating relay stationa) with direct feedb) with indirect feed
A Distribution network connection 1 Heat meter (normally integrated in return)B Relay station 2 Differential pressure controllerC Internal consumer circuit 3 Secondary flow temperature control
4 Heat transfer
0 0 0Σ
1
23
A B C
1
2
3
4
A B C
B64-14
0 0 0Σ
4.5 Heat volume measurement
54

Electronic meters determine the volumetric flow by means of electricalimpulse generators such as impeller wheel meters with induction flowmeter or ultrasound measuring devices. The flow and return tempera-tures are acquired via resistance thermometers. An electronic compu-ting system processes the signals to form the product and digitallydisplay the values followed by possible data recording.
The Siemeca™ heat meters are electronic dry running meters. They feature flow acquisitionwithout magnetic field and highly accurate temperature sensors. They are used to acquire consumption, heating or cooling energy consumption, in residential and industrial areas.
Measurement accuracy Class 3 as per EN 1434 Rated pressure 10 bar Application 1...90 °C Temperature difference min. 3 K
Fig. 4-40 Siemeca™ Electronic Sensing element Pt 500heat meter temperature sensor
Battery life 8 years (7 years fordevices with radio data transmission)
Odors and scents have a significant effect on our comfort in rooms.Unpleasant odors can not only cause psychological discomfort but also physical symptoms such as headaches, nausea and loss of appetite, even without any toxic effect of the odiferous substances.For this reason, the operation of ventilation and air-conditioning sys-tems is subject to legal requirements which specify a minimum volume of fresh supply air according to the present (or planned) number of occupants in the room.The technical evaluation of room air quality by sensors is in no waycomparable to the human nose. However, they still give astoundingresults for determining the fresh air demand with indoor air quality control. In this regard, volatile organic compounds (VOC) and carbondioxide (CO2) are of special interest.
Carbon dioxide (CO2) is produced by respiration as well as by all combustion or oxidation processes. CO2 is an odorless gas which, in small quantities, has no known effects on human beings.
• CO2 concentration in a space is an indicator of the number of peoplein the space
• CO2 also has health implications (our breathing is controlled by CO2
content) and hence our sense of well-being and ability to concen-trate are affected when certain ppm levels are exceeded:
• CO2 is measured in volume % or ppm (parts per million)
The CO2 content in normal outdoor air is approximately 0.033 volume %or 330 ppm.
4.6 Air quality
4.6.1 CO2-sensor
55

Fig. 4-41 CO2 concentration levels and limit values
From a concentration of 1000 to 2000 ppm (parts per million = numberof cm3 per m3) upwards, the pH of blood moves into the acidic range(reduced oxygen transport). Air quality cannot be determined directlyvia CO2. However, it provides valuable guideline information on the airconsumption or number of occupants in a room.
The CO2 content of air can be determined using a CO2 measuring element as a comparison value.
The CO2 sensor is based on photo-acoustic measurements. The principle was discovered as early as 1880 by A.G. Bell and J. Tyndal. Only three separate components are required for this measuring principle:• source of infrared radiation (IR)• pressure-insulated measuring cell• microphone with signal conditioning
A miniature bulb shines through an optical filter into the measuring cell. The filter only allows light in the infrared range (with a wavelengthof around 4.26 µm) to pass through. The CO2 molecules are stimula-ted by light at this wavelength, absorb the radiated energy and releaseit again as they collide with other molecules. This causes a slight in-crease in pressure inside the measuring cell. If the light-source is perio-dically switched off, the pressure differences can be detected by a sensitive microphone and evaluated electronically, i.e. converted intothe measured signal. This measured signal is proportional to the CO2
content. An advantage of this method of measurement is that there isno need for regular recalibration of the zero point.
Concentration[ppm]330 Concentration in normal outdoor air
1’000 Upon entering a room 20 % of people will bedissatisfied with the prevailing air quality
1’500 Limit value specified in DIN 19462’000 Sensitive persons complain of headaches4’000 Maximum value in a classroom at the end of lessons5’000 MAC value (Maximum Acceptable Concentration
in the workplace) 100’000 Sufficient to extinguish a candle in the room and
cause loss of consciousness
Measuring principle
56

The advantages of the photo-acoustic measurement principle overother methods are as follows:• Measured signal and the CO2 concentration are directly proportional• Highly sensitive method• Zero point very stable (relative measurement, no calibration
necessary)
Fig. 4-42 CO2 measurement based on the principle of photo-acoustic measurement
Poor-quality air, which causes an unpleasant smell in the nose and isreferred to as stale air, is mainly caused by so-called volatile organiccompounds (VOC).
VOCs are contained in products containing solvents, such as adhesives, paints and varnishes, thinners as well as cleaning and care products. An effect like alcohol or narcotics is common to all organic solvents. Depending on the compound, tiredness and drowsiness can occur at various concentrations, and even nausea and headaches at higher concentrations. Humans also emit small quantities of VOC components into the room air:• through respiration• via sweat and other bodily secretions• tobacco smoke
Without further signal processing, however, the commercially available VOC sensors are not sufficiently accurate or reliable for use in air conditioning applications, as we need to be able to measure even the smallest concentrations of VOC. However, with an intelligent algorithm, the VOC concentration can be adapted to the current qualityof the supply air, and can then measure even very low concentrationsof VOC reliably and stably.
other principles
IR-Filter 4.26μm
Air Filter Photo Acoustics Measuring
Signal
CO 2 -Concentration
CO 2
A.G.Bell, J.Tyndal
4.6.2 VOC sensor
57

VOC levels are detected using a gas sensor based on the Taguchi principle (Fig. 4-38). Essentially, this consists of a sintered ceramic tube containing a filament. Flat-panel thick-film technology sensorshave been developed in recent years. The sensor tube is highly porousand thus has a very large surface area. It consists of doped tin dioxide(SnO2). This sensitive material works on the redox principle.
When the sensor tube is heated to 400 °C, free electrons form on thesensor surface. These attract oxygen atoms, which settle on the surface. Ideally, any gases or vapors coming into contact with the sensor surface will be oxidized, giving CO2 and water vapor. In this process, the oxygen required for the oxidation process is removedfrom the sensor surface. This frees electrons, thereby changing theresistance of the semiconductor. This change in resistance can bemeasured. The oxygen used in combustion is replaced by oxygen from the air. The mixed gas sensor can thus detect all gases capable of oxidation in proportion to their concentration and redox potential.
The Taguchi principle of measurement has long been used with suc-cess for the detection of gas leaks. It has rarely been used for the measurement of air quality in HVAC systems. One reason, certainly, is that the required measuring range is at the lowest sensitivity zone of the Taguchi sensor, where the base value of the sensor signal is relatively widely scattered and subject to drift. Another reason is that,except in relation to CO2, there is no technical literature with quanti-fiable and binding statements in relation to odor and air quality.
Fig. 4-43 VOC measurement with gas sensor based on the Taguchi principle
Stainless steel Precious metal Sensor Heating
Synthetic material
Ni connector
Electrode
Semiconductor (tin dioxide)
Electrode Heating coil
Diameter: 17 mm Hight: 10 mm
Measuring principle
58

Today, combined CO2VOC measurements are seen as the optimumsolution for air quality control.
In relation to odor, the terms olf, decipol and percentage dissatisfied(PD) are used, derived from the Fanger’s theories). These variables cannot be measured like CO2, but they do indicate the relationship between odor, the number of air changes and the degree to whichoccupants of a space find the air quality satisfactory. They cannot be used for control purposes, but are useful e.g. when defining set-points (cf. Fig. 4-41, value for 1000 ppm CO2).
1 olf is equivalent to the air pollution caused by a “standard person”A “standard person” is an adult in a sedentary occupation, with ahygiene standard of 0.7 baths per day. The “olf” unit is used to indicatethe pollution load caused by both objects and people. It is not a directlymeasurable variable: it can only be determined on the basis of the perceived air quality.
1 decipol represents the perceived air quality in a room with a pollutionload of 1 olf and a ventilation rate of 10 l/s or 36 m3/h. The decipol is the unit of measurement of perceived air quality.
The perceived air quality is defined using data from a number of testpersons, whereby the “percentage dissatisfied” is established on the basis of the number who find the air quality unsatisfactory. Thesevalues are recorded in relation to the outside air rate, which in turn, is related to the number of people occupying the space.
Fig. 4-44 Relationship of Percentage Dissatisfied (PD) to the outside air rate per person
QPA63.1 QPA63.2 AQP 63.1Air quality sensor Air quality sensor Air quality calculatorCO2 + VOC CO2 + VOC
Fig. 4-45 Air quality sensor (picture Siemens)
Percentage Dissatisfied (PD)
0.0010.0020.0030.0040.0050.00
0 20 40 60 80 100 120
Outside air rate per person [m3/h, Pers.]
Dis
sati
sfie
d i
n %
%
Increased use of combinedCO2/VOC measurement
Other indicators
olf
decipol
PD = Percentage Dissatisfied
59

In order to determine solar radiation, the sensor uses two measuringelements which both measure the ambient temperature. One mea-suring element is exposed to the sun, the other is covered. The diffe-rence between the two measured temperature values is directly pro-portional to the solar radiation. It is amplified by an electronic circuitand output as a DC 0 – 10 V signal which corresponds to a solar radiation of 0 – 1000 W/m2.The sensor must be installed at least 3 m above ground at a suitablemounting location.
Fig. 4-46 Solar radiation sensor QAS92 (Siemens) Sensor to measure solar radiation;Output signal DC 0...10V.
The QAS92 solar radiation sensor is used as reference sensor in heat-ing, ventilation and air conditioning plants intended to employ solar radiation compensation. This is required in buildings with large win-dows or with large areas exposed to direct solar radiation, especially if thermostatic radiator valves cannot be employed.
In order to determine wind speed, the sensor uses two measuring elements. One measures the ambient temperature, and the other iscontinually heated to a temperature 10 K higher. The electrical powerrequired to do so is directly proportional to the wind speed. The power demand is processed by an electronic circuit and output as a DC 0 – 10 V signal which corresponds to a wind speed of 0 – 20 m/s.
The sensor must be mounted on the building wall exposed to windmax. 0.5 m from the building corner and at least at 67% of the build-ing/zone height. Areas sheltered from wind, increased wind speedsdue to trees or other barriers as well as installation in air hoods mustbe avoided.
Fig. 4-47 Wind sensor QAV 92 (Siemens) Sensor to measure wind speed; Output signal DC 0...10 V.
The QAV92 wind sensor is employed as a reference sensor in heatingsystems with planned wind reference conduction which is necessary in buildings or for building parts exposed to strong winds that lead tosignificant impact on room temperature.
4.7 Solar radiation sensor
Principle
Application
4.8 Wind sensor
Principle
Application
60

The purpose of this chapter is to:• show the professional placement of sensors – mainly with regard
to speed and pressure measurement,• point out the most common sensor placement errors.
The course material is all at the same level. It is suitable both for studyand reference purposes.
The knowledge presented here is basically intended for practical use.However, it can also provide a basis for later discussions on the topicof VAV.
Although the use of negative material is frowned upon in modern training, we will use such material in this chapter: experience hasshown that basic errors can creep in more easily without negativeexamples.
It has become a matter of course in modern control equipment to indicate the actual values of various physical variables to at least onedecimal place (e.g. temperature, humidity, pressure, etc.). With suchhighly developed equipment, correct measured value acquisitionseems to be automatically taken for granted.
The reality of the matter is, in fact, rather different. Sensor placementstill remains a critical point of failure in the control loop. In the follow-ing, we will attempt to point out common points of failure from practi-cal experience in order to prevent operating faults, poor operatingbehavior, inefficient functions, elevated energy consumption or incom-plete utilization of potential energy savings.
To look at the matter from a different perspective: incorrectly or unfavorably positioned sensors can at some point give rise to operating faults or poor operating behavior. This is ultimately bad for public relations.
The information in the following is intended to help you identify and eliminate the most common sensor placement errors. A general viewof fluid flow, pressure conditions and measuring methods is followedby tips with a special emphasis on the placement and installation ofmeasuring equipment such as speed and pressure sensors in ducts.
5.1 Introduction
Goal
Structure of course material
Material present
Note
High-precision indication…
…for fuzzy data
PR aspect
Outlook
61
5. Placement and Installation of Sensors

62
Liquids and gases basically exhibit two different flow patterns:
In the case of laminar flow, the flowstreams are maintained.The individual layers glide over eachother giving rise to a parabolic speedprofile.
Fig. 5-1 Speed profile with laminar flow
In the case of laminar flow. the flowstreams decay and are lost. Lateral andmixing motion occurs. The middle areassupply energy to the outer layers. Theslower outer particles migrate inwards,where they have a braking effect. Thismakes the speed profile more uniform.
Fig. 5-2 Speed profile with turbulent flow
In a given pipe, the transition from laminar flow to turbulent flowoccurs at a certain critical speed (“critical Reynolds number”). Literature: Recknagel/Sprenger, 62nd edition, page 182.
Laminar flow is relatively rare in the HVAC field. It is desirable in ventilation systems, because it is quiet, but it is undesirable in heatexchangers, because it decreases heat transmission.
The volume flow rate is calculated by multiplying the average speed as determined from the speed profiles by the cross-sectional area. If a speed sensor is intended for volume flow measurement, the respec-tive speed profile must be determined. This is done with the aid ofpitot tubes, vane anemometers, thermoelectric anemometers andother devices that are positioned at a series of measuring points overthe entire cross-section of the pipe or duct.
5.2 Basic information on
sensor placement
5.2.1 Flow patterns, speed profiles
Refresher
Laminar flow
Turbulent flow
Critical speed
Volume flow measurement

63
This picture shows an excerpt from ameasurement sheet for a circular cross-section. At least 10 measuring points arerequired.A rectangular or other cross-section isdivided into sections of equal surfacearea.Measurement is performed at the centerof gravity of each section.
Fig. 5-3 Measurement sheet for a circular cross-section (excerpt)
For measurements in pipes, sensors are installed in immersion sleeves.The immersion sleeve constitutes the first time-delay element, and theair between the immersion sleeve and measuring element the second.The third time-delay element is the time constant of the sensor.
Of these three sequential delays, the one caused by the air gap bet-ween the immersion sleeve and the sensor is the greatest, becausethe thermal conductivity of air is poor. This poor response characteristiccan be vastly improved by filling the air gap with heat transfer paste.
For the placement of a sensor, a location must be chosen that meetsthe following criteria:• Optimum measuring location in control terms• Accessible for electrical staff• Accessible for commissioning• Accessible for checking and service
The illustrations in the following provide installation tips for correct placement of various sensors.
Sensors must be installed and connected in such a way that the sensorsignal is not permanently or intermittently falsified by external interfe-rence. This can introduce external interference into the measurement:• electrically: via the sensor leads, and/or• physically: via incorrect measured values
Sensor leads must be selected and installed according to the specifications of the control supplier.
The conduits for the sensor leads (plastic pipe/high-strength conduit)can cause an airflow to the measuring location, which falsifies the measured value (e.g. by cooling the temperature sensor). Therefore,such conduits must be sealed.
The requirements on the control system (stability, tolerance etc.) determine whether point measurement (with the appropriate sensors)is sufficient or whether averaging measurement is required.Averaging measurement is always necessary if measurements have to be taken in stratified media.
5.2.2 Time constant of sensors in liquids
5.2.3 Placement of a sensor
Criteria
5.2.4 External interference
Take care
Connections
Sealing
Requirements on control
Note
Bestimmung der Eintauchtiefe siehe Rückseite 1:11
2:12 3:13 4:14 5:15 6:16 7:17 8:18 9:1910:20
Eintauchtiefe z [cm]
10987654321
11
20
19
18
17
16
15
14
13
12
0.3496·ρ273.15·ϑ1
γ = ã
g2pv dyn ⋅
=

64
The most common measurement problems are caused by temperaturestratification. Temperature stratification occurs in all air treatment pro-cesses (heating/cooling, humidification/dehumidification, convergenceof two air flows). Stratification also occurs with other physical variables(e.g. humidity, fluid flow, pressure, etc.).
Stratification is only eliminated to a limited degree by the fans, and theducting network is also barely able to mix stratified air (e.g. angles/T-pieces with baffles). The results of stratification are as follows:• Uneven loading of filters (partial icing or soiling of individual filter
cells)• Uneven utilization of heat exchanger surfaces, uneven air outlet
temperature• Poor control response, frost hazard, frost alarm• In case of radial fans with double-sided intake, temperature
stratification in the pressure-side ducting right up to the air outlets (one side of the room cold, the other warm)
Fig. 5-4 Sensor placement examples
30 cm
Each sensor should have atightly sealable measuring port
Connect cable from below to preventthe ingress of water into the sensorhousing
max.
Incorrect installationImmerse the entire active length ofthe sensor in the medium
Incorrect installation Note inclination
The sensing element is position-independent, but the medium to bemeasured (water/air) must flow around its entire length
File the contact surface bare, and fill the gap between the sensor and pipe withthermolube in order to improve thermalconduction
Do not use rode sensors wherestratification can occur (e.g. downstreamof mixing dampers, heating coils,coolers or HRUs) – see averaging
The entire length of a rod sensor mustbe exposed to the airflow
Each sensor should have an inspectionport
Install against the direction of flow
30 cm
max.
5.2.5 Measurement problems
Stratification
5.2.6 Examples of sensor placement

65
Fig. 5-5 Sensor placement examples
Maintain a suffiently large distance between mixing point and sensor downstream ofwhere water flows of different temperature are mixed (because of stratification)
Fig. 5-6 Sensor placement examples
d
d
Mixing distance 10 x d
Mixing distance 10 x d
Seal plastic conduits/high-strenghtconduits! (drafts occur in these conduits)

66
The decisive factor for the quality of measuring equipment in flowingmedia is primarily good mixing at the measuring point. A secondaryconsideration is the distinction between immersion sensors and clamp-on sensors.
A few criteria for determining the measuring point are listed below:• At least 1 m downstream of the mixing point, e.g. globe valve
or mixing valve• Always downstream of the circulation pump (however the
turbulence in a circulation pump does not automatically guaranteegood mixing)
• Immersion depth at least to the middle of the pipe• Wherever possible, install the immersion sensor in a bend with
the direction of flow against the sensor
• Bare metal pipe surface for optimal heat transmission at the sensing element
• Tight mechanical connection using a clamping band• Thermo-lubricant only according to the measuring equipment
manufacturer’s recommendations• Give preference to a straight section of pipe instead of an elbow• Where possible, integrated into the pipe insulation or at least
directly enclosed
• Pipe insulation thickness and electrical connection (draught through the conduit)
• Nominal pipe sizes with storage behavior
Fig. 5-7 a: Mounting of clamp-on sensors b: Mounting of immersion sensors
5.3 Temperature measurement
5.3.1 Temperature measurement
in water
Mixing!
Criteria for determining the measuring point
For immersion sensors
For clamp-on sensors
Pitfalls

67
Fig. 5-8 a: QAD22 clamp-on sensor b: QAE22 immersion sensor
For temperature measurement in air, the same basic requirementsapply as for measurement in water. However: these requirements aremany times more difficult to meet in air than in water – in ducts be-cause of the much larger dimensions and isothermal flow conditions,and in free-flowing air (outdoor air temperature, room temperature) due to additional flow disturbances.
Temperature sensors for air can be roughly classified according to technology and mechanical design:• Rod sensors• Cartridge sensors with capillary tube – averaging sensors• Room sensor – outdoor sensors• Wind influence sensor – solar sensors
• Unlike sensors for liquid media, the technology of air temperaturesensors allows them to be mounted in any position.
• Since the probes of some of the sensors are considerably moreextensive because of their intended use, special attention must bepaid to the respective criteria.
Siemens devices
5.3.2 Temperature measurement in airt
Air is more difficult!
Summary
Mounting properties
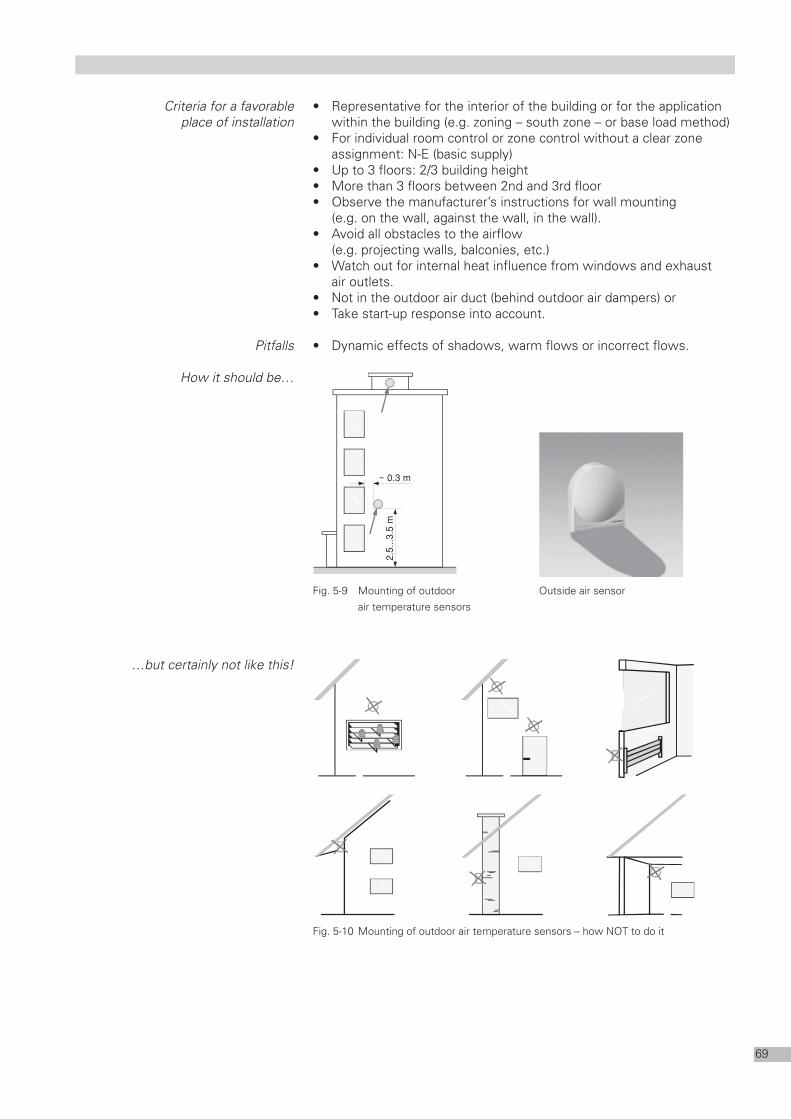
68
Different types and technologies require different places of installation.Observe the following criteria for the most important air temperaturesensors:
The statement “always install the outdoor sensor on the north side”,which used to be generally applicable in the heating industry is certain-ly no longer valid as such today, but must be considered in a more differentiated light. Observe the following criteria:
Criteria for determining the place of installation (overview)
5.3.3 Measuring the outdoor
air temperature or weather
The good old days….
Type Symbol Observe on installation
Rod sensors • Ensure that the medium to be measuredcompletely flows around the sensor ele-ment
• 1 inspection port per sensor• Do not use rod sensors if stratification is
possible (e.g. downstream of mixingdampers, heating coils, coolers)
Capillary tube • Always install the device head higher than sensors the sensor cartridge
• Tilt the sensor cartridge downwards• The ambient temperature at the device
head must be higher than that at the sensor cartridge
Averaging sensors • Distance from heat exchanger to sensor at least 50 mm
• The entire sensor length must be in the air duct
• Distribute the sensing element evenlyover the entire cross-section
Room sensors Install room sensors:• at a height of approx. 1.5 m in the
occupied zone• at least 50 cm from the nearest wall• away from direct sunlight• with thermal insulation on solid walls• not on exterior walls, in alcoves or
between shelves• Only install near supply pipes (e.g. electrical
cables) if they are fully insulated
Outdoor sensors • Never expose to direct sunlight• Never install on facades with a large
quantity of rising heat• Do not install over ventilation outlets
Clamp-on sensors • Mounting surface must be bare• Sensor must be in close physical contact• Always use thermo-lubricant between
sensor and mounting surface

69
• Representative for the interior of the building or for the applicationwithin the building (e.g. zoning – south zone – or base load method)
• For individual room control or zone control without a clear zoneassignment: N-E (basic supply)
• Up to 3 floors: 2/3 building height• More than 3 floors between 2nd and 3rd floor• Observe the manufacturer’s instructions for wall mounting
(e.g. on the wall, against the wall, in the wall).• Avoid all obstacles to the airflow
(e.g. projecting walls, balconies, etc.)• Watch out for internal heat influence from windows and exhaust
air outlets.• Not in the outdoor air duct (behind outdoor air dampers) or• Take start-up response into account.
• Dynamic effects of shadows, warm flows or incorrect flows.
Fig. 5-9 Mounting of outdoor Outside air sensor
air temperature sensors
Fig. 5-10 Mounting of outdoor air temperature sensors – how NOT to do it
Criteria for a favorable place of installation
Pitfalls
How it should be…
…but certainly not like this!
~ 0.3 m
2.5.
..3.5
m

70
The basic requirement of good mixing as already mentioned in the context of water temperature sensors applies equally to duct temperature sensors.
Depending on the operating mode and season, different isothermalconditions can be encountered, especially in the case of central air treatment. The main causes are the mixing chamber and any heatexchanger: although the stratification caused by the mixing chambercan dissipate downstream, the temperature conditions of a heating coil or cooler can produce new layers. Depending on the magnitude of the temperature spread, the rotary action of the fan is often not suf-ficient to eliminate it. In meteorology, this phenomenon is referred toas “inversion”, which can give rise to very stable conditions. If the con-ditions are unclear, determine the measuring point via multiple tempe-rature measurements over one or more duct cross-sections using amobile probe.• Unfavorable mixing chamber configuration• Rod sensor length
If placement of a sensor in non-isothermal flow is unavoidable, e.g. due to limited space in an air handling unit, use an averaging sensor.Note that, although the sensor measures the average temperature, itdoes not eliminate the stratification. If the stratified flow is divided, differing temperatures must be expected in the individual partial flows.
Sensors close to air treatment equipment (e.g. in the direct vicinity of heat exchangers) are influenced by radiation to a greater extent. Thisis often the case with averaging sensors. Radiant heat can also exert a considerable influence on temperature measurement in the case ofelectric heating coils (high surface temperatures).
The temperature distribution downstream of a heating coil is largelydetermined by the temperature spread on the water side. The risk ofstratification is reduced by appropriate piping within the heat exchangerand by mixing temperature control.
• Averaging sensors in case of stratification• Sensors close to air treatment equipment
Place of installation of a duct temperature sensor:• Straight air duct without temperature stratification or radiant heat
influence• After air washers, minimum distance 1 m with good drip screens,
otherwise correspondingly greater• Distance downstream of steam humidifiers depends on degree of
humidification and air speed (observe manufacturer’s instructions).
5.3.4 Temperature measurement
in air ducts
Mixing!
Inversion
Pitfalls
Non-isothermal flow
Sensors close to air treatment equipment
Temperature distribution
Pitfalls

71
Fig. 5-11 Mixing of outdoor air and recirculated air
Fig. 5-12 Degree of mixing with different mixing chamber designs
Fig. 5-13 QAM22 duct sensor
• For supply air temperature control– If a fan is installed downstream of the last air treatment element:
downstream of the fan – If no fan is present, or it is not situated downstream of the last
air treatment element: downstream of the last air treatment element at a distance of at least 0.5 m!
• For extract air temperature control, always upstream of the extractair fan
• As a limit sensor for supply air, as close as possible air inlet into theroom
• For dew point control, directly downstream of the air washer’s drip screen
• Manually bend the sensor rod such that it runs diagonally throughthe duct, or
• Draw the sensor rod in equidistant loops across the entire ductcross-section.
• The sensor rod must not touch the duct wall.
Sup Dampers
m/s Type OU RE
1
2
3
3.1
4
2.9
3.4
2.4
2.4
3.4
a
a
a
a
x
d
d
d
o
o
d
d
d
d
o
1.0
0.8
0.6
0.4
0.2
00 0.2 0.4 0.6 0.8 1.0
Ove
rall
degr
ee o
f m
ixin
g M
Ratio of outdoor air to supply
123
3.1
41.1
1.21.51.3
1.4
1.1
1.2
1.3
1.4
1.5
3.7
5.0
2.9
5.0
2.9
a
a
a
a
g
d
d
o
o
o
d
d
o
o
o
1, 2, 3: all dampersthrottled against flow direction
3.1 like 3, but without outdoor air damper
4 no dampers, regulation in duct x no dampers
o open
d throttling
a against flow direction
g in flow direction
=1.19 kg/m3 + 19 °C
=1.32 kg/m3 – 1 °C–5 ° C
UL
AL
+ 22 °C
ρ
ρ
Siemens devices from practice QAM22
Placement
Note

72
Room temperature control normally pertains to the occupied zone of a room. The occupied zone is difficult to reach in many cases, becausea sensor can only rarely be placed in the center of the room.
• Therefore, the following applies to the place of installation:• Install at the edge of the occupied zone.• Avoid unfavorable locations, such as heat sources (radiators,
secondary heat sources, electrical equipment, etc.).• Air circulation must be guaranteed, so do not install sensors in
alcoves.• Avoid direct sunlight.• Do not place on surfaces with greatly varying temperatures
(flue walls, exterior walls).• Do not install in direct draughts.
• Flow changes depending on plant operating state (fan coil units).• Moving solar irradiance.• Ingress of lower-temperature air through wiring conduits• Thermostatic valves• Wall influence
Fig. 5-14 a: Room sensor installation b: Room sensor installation (NOT like this!)
Fig. 5-15 Room sensor without and with setpoint adjustment
5.3.5 Room temperature measurement
Occupied zone
Place of installation
Pitfalls
Places of installation
Siemens devices

73
In the case of vane anemometers, there is a choice of several manufacturers. Devices made by Schiltknecht are frequently used.They are very practical and user-friendly+ The advantage over the pitot tube is the direct speed read-off.
Additionally, devices that enable the average speed value to be determined are also available commercially.+ Another practical feature is the measuring range switchover, which
enables speeds in the lower range, i.e. < 1 m/s, to still be read offproperly.
The thermoelectric anemometer is especially suitable for low speedsbelow 5 m/s. + Even values down to a few cm/s can be measured..+ This device is mainly suitable as a complement to measuring
devices for higher speeds.
Devices with digital indication of instantaneous values are mainly suitable for constant speeds. In the case of varying speeds, however, it is not easy to read off the values. Conventional devices with dialgages generally permit better estimation of the average value than therapidly changing numbers on a digital display.
The following flow pattern shows the speed profiles in the idealduct/pipe downstream of a 90° deflection with turbulent flow at thestart. It shows that a highly distorted speed profile occurs directly afterthe elbow, so that even partial backflows can be observed. The rule-of-thumb formula for minimum duct/pipe length until the initial profile isachieved again is also indicated.
Fig. 5-16 Speed profiles in an ideal (frictionless) pipe
Fig. 5-17 Speed profiles in an ideal (rectangular, frictionless) duct
a
b baba2
6l .min + =
D6l .min = D
5.4 Speed measurement
5.4.1 Speed measurement devices
Vane anemometers
Average speed value
Thermoelectric anemometer
Digital indication and instantaneous values
Wind tunnel measurements

74
Sufficient settling distances are a major requirement for the measure-ment of flow speeds. Otherwise the same requirements apply as forpressure measurement.
The picture before shows that clear speed measurements are only possible if sufficient settling distances are present• upstream or downstream of elbows and junctions,• downstream of single-element dampers and fans, or• changes of cross-section.
Changes of cross-section are usually indicated in multiples of the pipediameter. In the case of rectangular ducts of sides a and b, the equiva-lent diameter Dgl is calculated using the following formula:
The images shown in the picture below point out possible placementerrors (left), and indicate the necessary settling distances (right).
The sensors must be installed in such a way that they obstruct only anegligible part of the total cross-section.
• Speed is readily measurable downstream of resistances such asheating coils, coolers and filters, because the flow profile exhibitsquite uniform development in such locations.
• Downstream of heat exchangers, however, a certain distance isrequired for the flow to settle.
Unfavorable or incorrect placements are shown on the left,favorable/correct placements are shown on the right.
Preferably not like this… …but this is good!
Distance fromobstruction
Sensor in the middle of the duct
ba +ba2
Dgl⋅ ⋅ =
5.4.2 Speed sensors
Settling distances
Important
Placement examples

75
Preferably not like this… …but this is good!
Fig. 5-18 Placement of speed sensors
Fig. 5-19 Speed sensor QVM 62.1 (picture from Siemens)
Knowledge of the flow conditions in the duct are important for exactinstallation of a pressure sensor. In case of direction changes (e.g. afterbends) or after changes of cross-sectional area, air speed w rises and,with it, dynamic pressure Pdyn increases quadratically. Therefore, themeasurement results also vary of course. All disturbances of the airflow must be avoided, especially for staticpressure measurement.
Placement downstream of filters and flowstraighteners is good because there is noswirl there
Place sensors upstream of diffusers andconfusers
Filters settle the flow
5.4.3 Pressure sensor placement
Important

76
• Minimum distance downstream of a change in flow approx. 6 Dgl
• Since, according to Bernoulli, the total pressure remains constant,the static pressure in the duct decreases. It can even fall below theambient pressure. Then air is drawn in through the vent.
• Arrange sensors side by side(When measuring static pressure, the probe must not detect anypart of the dynamic pressure. This is always the case to a certaindegree in turbulent flows. Therefore, the sensor’s installation mustavoid any disturbance of the airflow by other sensors or by intrinsicdisturbance).
• The probe should be mounted on a duct wall that is parallel to theairflow.
• The air tubes between the measuring point and the sensor must betightly sealed and dry.
• In the case of differential pressure measurement, also ensure thatsimilar, comparable flow conditions are present on both sides.
• Exact, burr-free drilling of duct wall openings• Use the same tube.
In the case of differential pressure measurement, ensure that the twomeasuring points exhibit similar, comparable interior flows at all expec-ted air speeds, otherwise the pressure difference will be influenced,and the measurement will be undermined.If the static pressure in a duct is measured without a probe but simplywith an opening in the duct wall, measuring errors can occur depen-ding on the quality of the hole.
Fig. 5-20 Wall drilling for static pressure measurement
Install sensors vertically. In caseof deviations in the mountingposition, a measuring error ofsome 15 Pa can be expectedregardless of the measuringrange (due to the diaphragm’sown weight)..
Fig. 5-21 Differential pressure sensor installation
Fig. 5-22 Correct arrangement of two devices
Arrange sensorsside by side
Attach the sensor and measuringinstrument to the same tube
∅ 1 1
∅1
+1% -11 % +0.6 %
30°
∅
Take care!
Differential pressure measurement
Δp
77
The placement of two devices in the way shown above only applies todiaphragm sensors (static sensors).
This differential pressure sensor is suitable for direct mounting on airducts, walls and ceilings, as well as in control panels. Please note:• The sensor should be mounted vertically.• Wherever possible, the pressure connections should be at the bot-
tom and situated higher than the connected probes in the air duct.• Horizontal mounting (with the hinged cover at the top or bottom) is
not recommended, because this gives rise to certain measuredvalue deviations.
• If the pressure connections point upwards or are lower than theprobes, condensate can gather in the sensor and destroy it.
Fig. 5-23 Differential pressure sensor QBM65-... (picture from Siemens)
The normal place of installation is directly on the air duct. The devicecan be attached to a DIN mounting rail or mounted directly on a verticalor horizontal surface.• The “+” connection must be connected to the higher-pressure side• The “–” connection must be connected to the lower-pressure side• Course impurities can be intercepted by making a twist in the air
supply tube.
A 100% volume flow rate, volume flow controller fully open (BP1)B Throttling via the volume flow controller, no pressure control (BP3)C Fan speed reduction (BP2)D Like C, pressure measurement at p0 (BP4)
Fig. 5-24 Pressure sensor placement for fan control, pressure progression in the ducting
Room
Pre
ssur
e
P P0
VFC
???≠
???≠
A
B15
03-1
9
Limitation
Duct pressure control

78
Curve A shows the pressure progression in the ducting with the volume flow controller fully open and at the maximum volume flowrate. Negative pressure with respect to the environment builds up inthe inlet duct towards the fan. The fan provides the necessary pressure rise for the ducting; the positive pressure downstream of the fan dissipates towards the room according to ducting design.
In the absence of open-loop fan control or closed-loop pressure control,approximately the pressure progression shown by curve B resultsfrom setting a smaller volume flow rate (via the volume flow control-ler).
“Approximately” because in reality the fan will produce a different pressure difference according to its pressure-volume flow rate characteristic, which is not reflected in the picture.
Without throttling via the volume flow controller but with a reducedvolume flow rate (by reducing the fan speed), the pressure progressionas per curve C is produced. In more complex systems, direct fan speedcontrol with the volume flow rate as the setpoint can only be achievedwith considerable control effort, because the sum of all partial volumeflow rates must be determined as the reference variable.
A compromise is pressure control in the ducting, provided the pressuresensor is meaningfully placed. If the pressure sensor is installed immediately upstream of the volume flow controller, the ideal pressureprogression in the ducting as per curve C is also achieved.
If the pressure sensor is unsuitably installed, e.g. if the sensor ismoved to point p0, the result is the pressure progression as per curveD. This automatically gives rise to higher fan drive energy consumption.
The position of the pressure sensor for fan control has an influence on the plant’s energy consumption. The following picture shows a simplified system with a qualitative view of the pressure progression in the ducting.
We would like to conclude with a few words of advice that are equallyimportant and applicable both to you and to your customers:
Do not try to correct measuring errors due to incorrectly placedsensors with additional measures.
After working through this information you are able to place sensors correctly first time around.
Curve A
Curve B
Note
Curve C
Compromise…
Curve D
Energy consumption vs. pressure sensor position
5.5 Two final comments
Everyone can benefit
Now you know for sure!

79
The term “concept” denotes an outline plan.
A measuring concept contains only the basic conditions. Detailed conditions belong in the domain of measuring planning.
If a measuring task is set, it must be considered as soon as the targetsare defined whether a measuring concept is necessary. It will hardly benecessary in case of simple measuring tasks. A measuring conceptbecomes indispensable, however, if the target definition requires mea-suring on a larger scale with simultaneous measuring of various mea-sured variables over an extended period of time.
A well-devised concept provides an overview of the costs to be expec-ted, of how many measuring devices of what kinds must be deployedand of who should organize, supervise, check and evaluate the mea-surements.
The significance of all measurement results and the question of howthey can be interpreted must be clearly outlined in advance in the concept.
Before commencing the development of the measuring concept, up to and including the final report, the applicable form of contract for the measurements (service contract or job order) must first be defined.
Different boundary conditions apply for consulting engineers, contrac-tors, operators and experts. This gives rise to different concepts foreach of these specialist fields:
Fig. 6-1 Measuring concept
Consulting eng. Contractor Operator Expert
Measuring Concept
ProjectEstimateModernization
Optimization
CommissioningAcceptanceGuarantee
Optimization
MonitoringOperationOperating costs
Optimization
AssessmentsInvestigationsResearch &
development
6.1 Measuring concept
Concept types
6. Measuring Concept / Measuring Planning
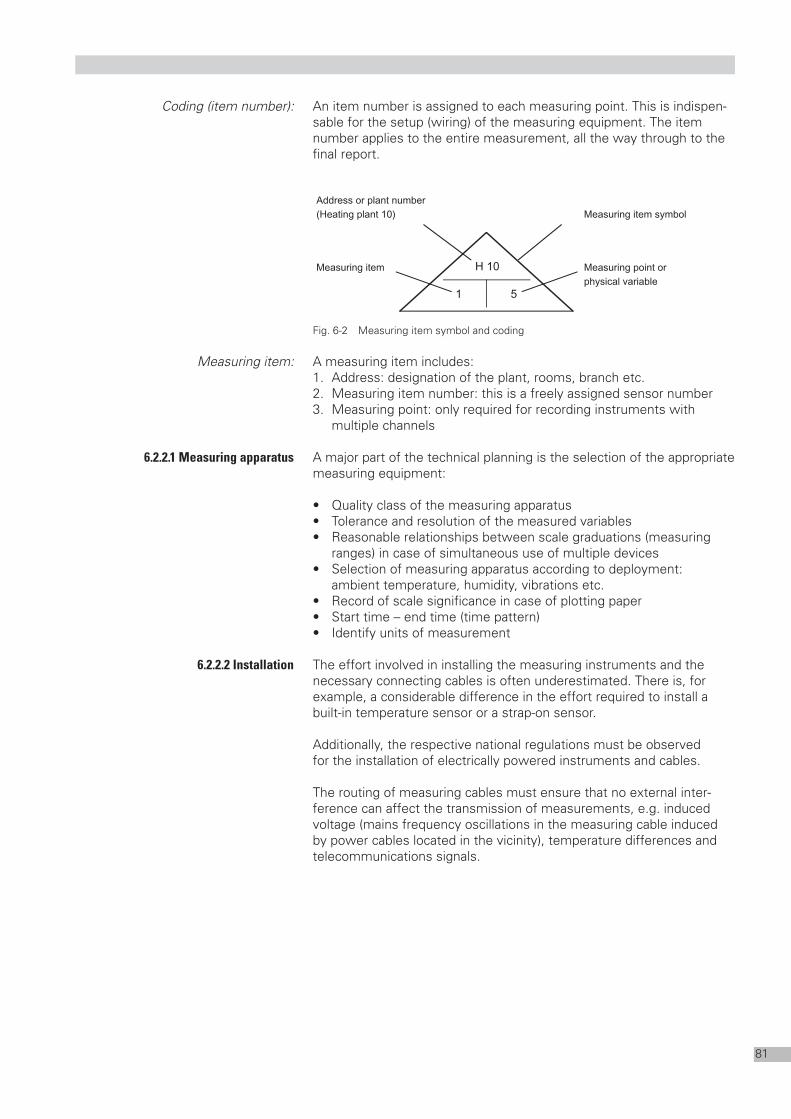
80
Measuring planning can commence if and when a proper measuringconcept is present. The measuring plan includes the following in theorder indicated:• Organization• Execution• Evaluation• Final report
In order to develop a measuring plan, all necessary information mustbe obtained. This includes operating specifications, schematics and function chartsas well as system data. In case of existing systems, a survey on sitewill provide useful information for planning.
Organizational planning determines how the execution of the measu-ring tasks should be handled. This part of the planning provides thebasis for cost-effective handling of the measuring job.
In detail, organizational planning includes the following points:• Who is responsible for the execution of the job?• Within what timeframe are the measurements to be performed
(date, season etc.)?• Measurement time: at what time of day is which measured variable
to be measured and for how long?• Clarification of needs: are instruments, installation means, building-
side prerequisites present?
A summary of the technical situation can include both existing documents and documentation that must be created.
The measuring points are marked in the facility plans (plans and eleva-tions). This will demonstrate what scope of measuring installations and whichbuilding-side prerequisites are necessary.
The creation of a separate measuring schematic is recommended. Asimple, clear, synoptic presentation gives the best possible overview ofthe relationships. It must provide information on all principle functionalprocesses (control). The measuring points are indicated with the appli-cable symbols and connected with the respective measuring instru-ments via function lines.
6.2 Measuring planning
6.2.1 Organizational planning
6.2.2 Technical planning
Technical situation:
Plan of measuring points
Measuring schematic

81
An item number is assigned to each measuring point. This is indispen-sable for the setup (wiring) of the measuring equipment. The itemnumber applies to the entire measurement, all the way through to thefinal report.
Fig. 6-2 Measuring item symbol and coding
A measuring item includes:1. Address: designation of the plant, rooms, branch etc.2. Measuring item number: this is a freely assigned sensor number3. Measuring point: only required for recording instruments with
multiple channels
A major part of the technical planning is the selection of the appropriatemeasuring equipment:
• Quality class of the measuring apparatus• Tolerance and resolution of the measured variables• Reasonable relationships between scale graduations (measuring
ranges) in case of simultaneous use of multiple devices• Selection of measuring apparatus according to deployment:
ambient temperature, humidity, vibrations etc.• Record of scale significance in case of plotting paper• Start time – end time (time pattern)• Identify units of measurement
The effort involved in installing the measuring instruments and thenecessary connecting cables is often underestimated. There is, forexample, a considerable difference in the effort required to install abuilt-in temperature sensor or a strap-on sensor.
Additionally, the respective national regulations must be observed for the installation of electrically powered instruments and cables.
The routing of measuring cables must ensure that no external inter-ference can affect the transmission of measurements, e.g. induced voltage (mains frequency oscillations in the measuring cable inducedby power cables located in the vicinity), temperature differences andtelecommunications signals.
Address or plant number
(Heating plant 10)
Measuring point or
physical variable
Measuring item
Measuring item symbol
H 10
1 5
Coding (item number):
Measuring item:
6.2.2.1 Measuring apparatus
6.2.2.2 Installation
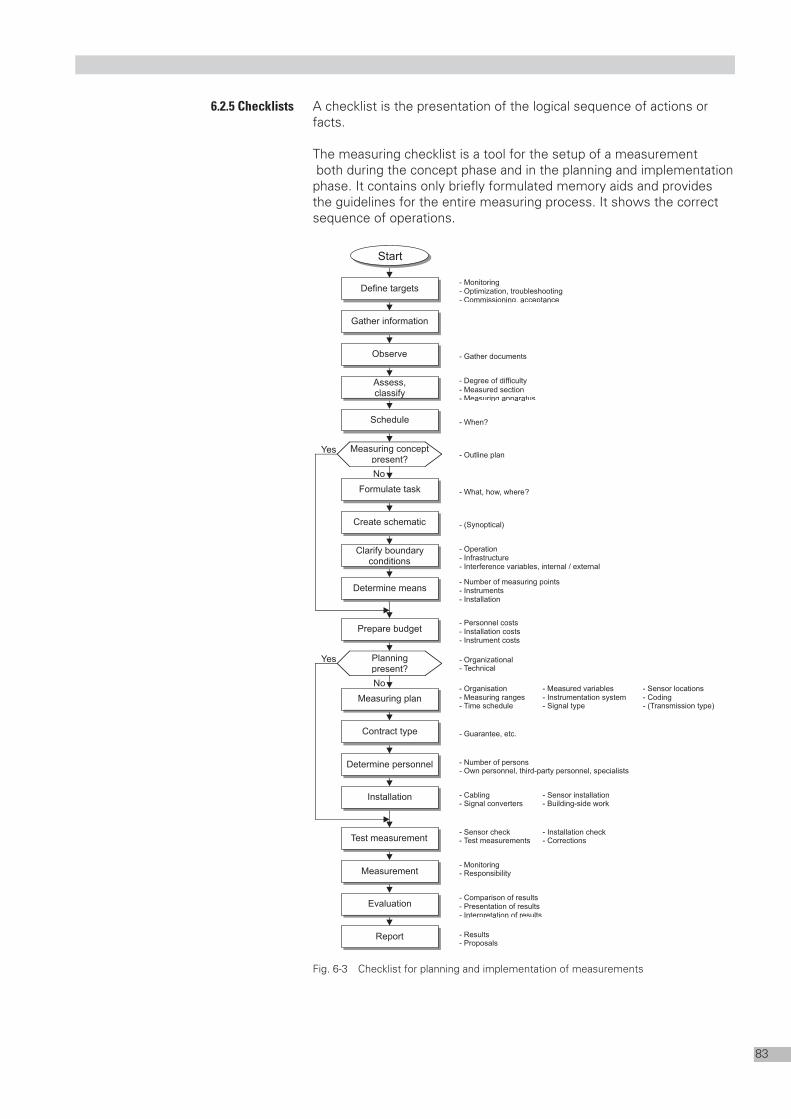
82
When all measurement results are present, they must be processed by the responsible specialist.
The first step is to sort the results:• for comparable time parameters (time axis t)• for optically comparable measuring ranges • Sort out unimportant auxiliary measured variables and results
with measuring errors.
After sorting, the results are presented in graphic form on the commontime axis so that initial relationships can be identified and so that anassessment is possible, e.g. to determine whether a system fault ispresent or whether the control functions are incorrect. With correctmeasurements, the evaluation shows where the error is located sothat appropriate action can be taken to improve the system.
If the measurement results are required for calculations, whether forperformance auditing or for the modernization of building servicessystems, mainly maxima and minima are required instead of functionalprocesses (dynamic method of measurement). The interpretation ofthese values provides the basis for calculation.
In the final report, the knowledge gained from the measurements must be summarized, and a concluding assessment must be made.Therefore, it includes information on:• The system state• Identified errors• Corrective action implemented• Work to be done
6.2.3 Evaluation of measurements
6.2.4 Final report

83
A checklist is the presentation of the logical sequence of actions orfacts.
The measuring checklist is a tool for the setup of a measurementboth during the concept phase and in the planning and implementationphase. It contains only briefly formulated memory aids and providesthe guidelines for the entire measuring process. It shows the correctsequence of operations.
Fig. 6-3 Checklist for planning and implementation of measurements
- Monitoring- Optimization, troubleshooting- Commissioning, acceptance
Start
Define targets
Gather information
Observe
Assess,classify
Schedule
Planningpresent?
Yes
No
Measuring conceptpresent?
Yes
No
Formulate task
Create schematic
Clarify boundaryconditions
Determine means
Prepare budget
Measuring plan
Contract type
Installation
Test measurement
Measurement
Evaluation
Report
- Gather documents
- Degree of difficulty- Measured section- Measuring apparatus
- When?
- Outline plan
- What, how, where?
- (Synoptical)
- Operation- Infrastructure- Interference variables, internal / external
- Number of measuring points- Instruments- Installation
- Personnel costs- Installation costs- Instrument costs
- Organizational- Technical
- Organisation - Measured variables - Sensor locations- Measuring ranges - Instrumentation system - Coding- Time schedule - Signal type - (Transmission type)
- Number of persons- Own personnel, third-party personnel, specialists
- Cabling - Sensor installation- Signal converters - Building-side work
Determine personnel
- Guarantee, etc.
- Sensor check - Installation check- Test measurements - Corrections
- Monitoring- Responsibility
- Comparison of results- Presentation of results- Interpretation of results
- Results- Proposals
6.2.5 Checklists

84
References
The content of this brochure is an except from the training module«BO2MC – Measuring technology» produced by:Siemens Switzerland LtdHVP TrainingGubelstrasse 22CH-6301 Zug
• Recknagel, Sprenger, Schramek: «Taschenbuch für Heizung +Klimatechnik»
• «Handbuch der Klimmatechnik» C.F. Müller Verlag• Fachartikel «Die Ventilator-Kennline» Ing. Josef Lexis• Buderus «Handbuch für Heizungstechnik»• «Impulsprogramm Haustechnik» Bundesamt für Kulturfragen,
CH-Bern
References
More References
ASN-No. Titel
0-91899-de Das h, x-Diagramm0-91899-en The psychrometric chart
0-91900-de Gebäudeautomation – Begriffe, Abkürzungen und Definitionen
0-91900-en Building automation
0-91910-de Messtechnik0-91910-en Measuring technology
0-91911-de Regeln und Steuern von Heizungsanlagen0-91911-en Control of heating plants
0-91912-de Regeln und Steuern von Lüftungs-/Klimaanlagen0-91912-en Control of ventilation and air conditioning plants
0-91913-de Regeltechnik0-91913-en Control technology
0-91914-de Kältetechnik0-91914-en Refrigeration technology
0-91915-de Wärmerückgewinnung im Kältekreislauf0-91915-en Heat recovery in the refrigeration
0-91916-de Einführung in die HLK- und Gebäudetechnik0-91916-en Introduction to building technology
0-91917-de Hydraulik in der Gebäudetechnik0-91917-en Hydraulics in building systems
0-91918-de Stetige Leistungsregelung im Kältekreislauf0-91918-en Modulating capacity control in the refrigeration cycle
Richtlinien FühlermontageBestell-Nr. Z-F01040501DE
More technical brochures

85

86

www.siemens.com/buildingtechnologies
Siemens Switzerland LtdBuilding Technologies DivisionInternational HeadquartersGubelstrasse 22CH-6301 ZugTel +41 41 724 24 24Fax +41 41 724 35 22
Siemens Building Technologies LtdBrunel HouseSir William Siemens Square, FrimleyCamberleySurrey, GU16 8QDUnited KingdomTel +44 1276 696000Fax +44 1276 696133
Siemens LtdBuilding TechnologiesUnits 1006-10 10/F, China Resources Building 26 Harbour Road Wanchai, Hong KongTel +852 2870 7888Fax +852 2870 7880
The information in this document contains general descriptions of technical options available,which do not always have to be present in individual cases. The required features should thereforebe specified in each individual case at the time of closing the contract.
Subject to change • Order no. 0-91910-en •© Siemens Switzerland Ltd • Printed in Switzerland • 10804 Ni/Ah