measuring the we will examine: nation’s income and growth · 18-04-03 4 nominal gdp real versus...
TRANSCRIPT
18-04-03
1
Measuring the Nation’s Income
and Growth
Art Lightstone
We will examine:
• GNP vs GDP • income and expenditure approaches to measurement • real versus Nominal GDP • potential GDP • what GDP does not measure
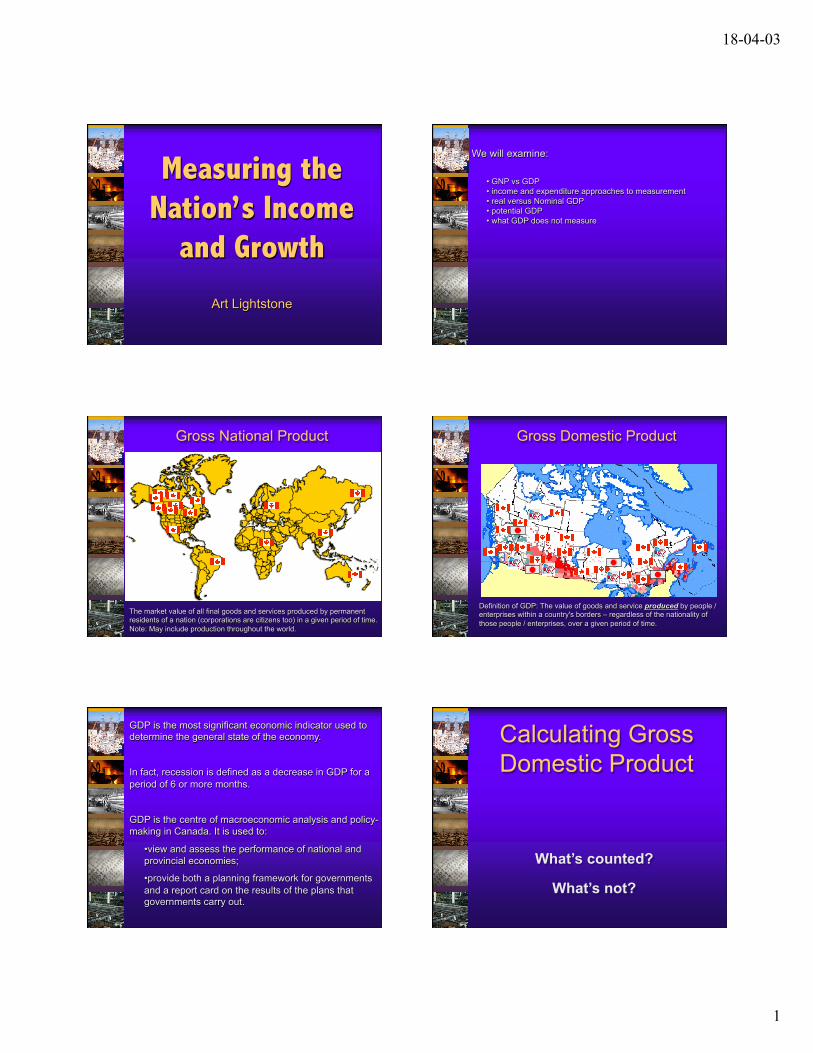
Gross National Product
The market value of all final goods and services produced by permanent residents of a nation (corporations are citizens too) in a given period of time. Note: May include production throughout the world.
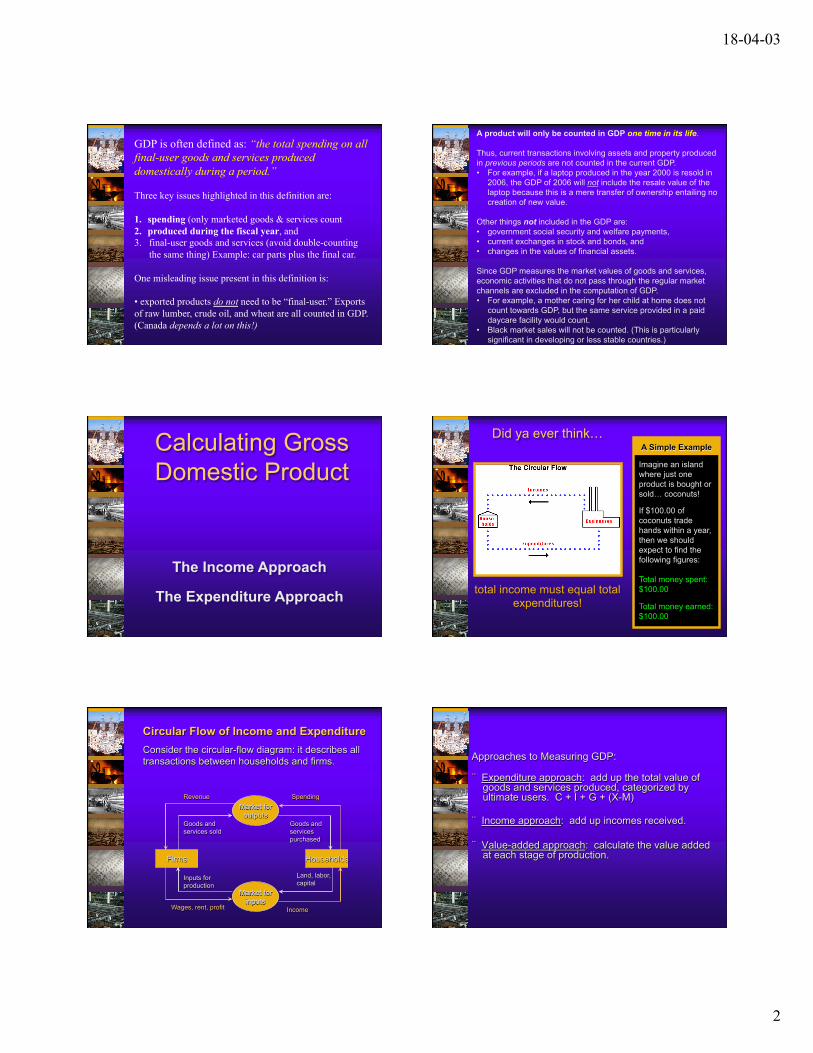
Gross Domestic Product
Definition of GDP: The value of goods and service produced by people / enterprises within a country's borders – regardless of the nationality of those people / enterprises, over a given period of time.
GDP is the most significant economic indicator used to determine the general state of the economy.
In fact, recession is defined as a decrease in GDP for a period of 6 or more months.
GDP is the centre of macroeconomic analysis and policy-making in Canada. It is used to:
• view and assess the performance of national and provincial economies;
• provide both a planning framework for governments and a report card on the results of the plans that governments carry out.
Calculating Gross Domestic Product
What’s counted?
What’s not?
18-04-03
2
GDP is often defined as: “the total spending on all final-user goods and services produced domestically during a period.” Three key issues highlighted in this definition are: 1. spending (only marketed goods & services count 2. produced during the fiscal year, and 3. final-user goods and services (avoid double-counting
the same thing) Example: car parts plus the final car. One misleading issue present in this definition is: • exported products do not need to be “final-user.” Exports of raw lumber, crude oil, and wheat are all counted in GDP. (Canada depends a lot on this!)
A product will only be counted in GDP one time in its life. Thus, current transactions involving assets and property produced in previous periods are not counted in the current GDP. • For example, if a laptop produced in the year 2000 is resold in
2006, the GDP of 2006 will not include the resale value of the laptop because this is a mere transfer of ownership entailing no creation of new value.
Other things not included in the GDP are: • government social security and welfare payments, • current exchanges in stock and bonds, and • changes in the values of financial assets. Since GDP measures the market values of goods and services, economic activities that do not pass through the regular market channels are excluded in the computation of GDP. • For example, a mother caring for her child at home does not
count towards GDP, but the same service provided in a paid daycare facility would count.
• Black market sales will not be counted. (This is particularly significant in developing or less stable countries.)
Calculating Gross Domestic Product
The Income Approach
The Expenditure Approach
Did ya ever think…
total income must equal total expenditures!
A Simple Example
Imagine an island where just one product is bought or sold… coconuts!
If $100.00 of coconuts trade hands within a year, then we should expect to find the following figures:
Total money spent: $100.00
Total money earned: $100.00
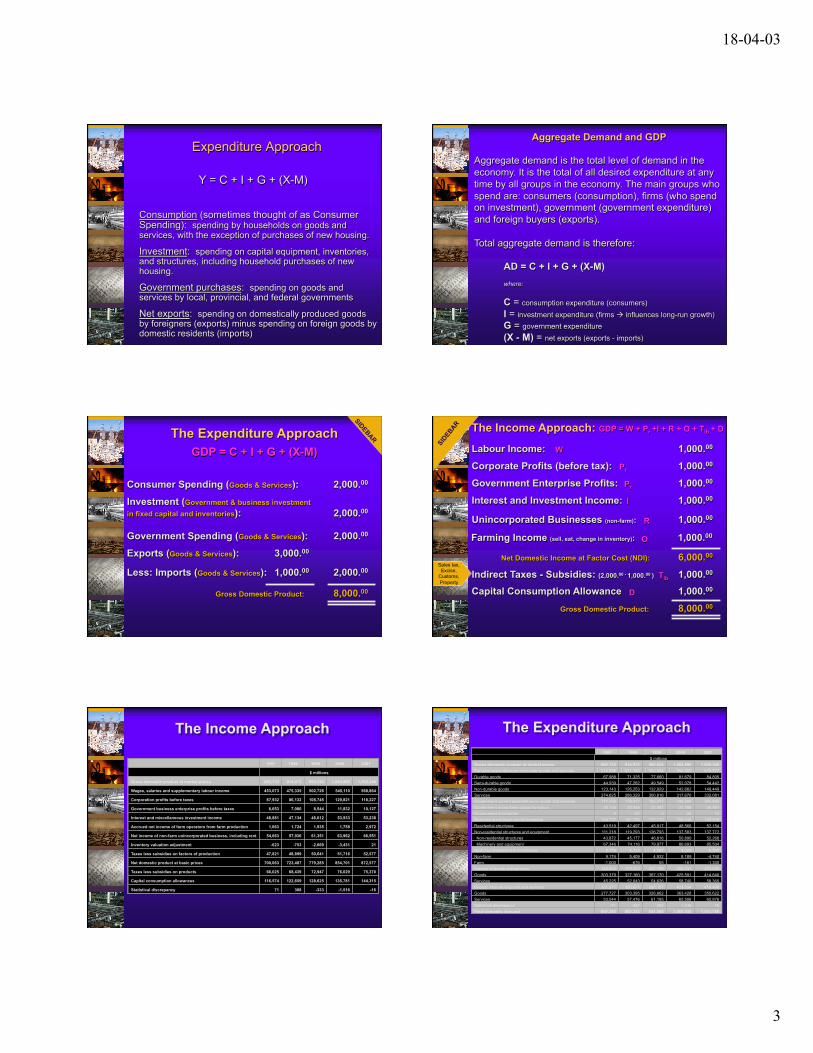
Circular Flow of Income and Expenditure Consider the circular-flow diagram: it describes all transactions between households and firms.
Firms Households
Market for outputs
Market for inputs
Land, labor, capital
Inputs for production
Wages, rent, profit Income
Goods and services sold
Goods and services purchased
Spending Revenue
Approaches to Measuring GDP: ¨ Expenditure approach: add up the total value of
goods and services produced, categorized by ultimate users. C + I + G + (X-M)
¨ Income approach: add up incomes received.
¨ Value-added approach: calculate the value added at each stage of production.
18-04-03
3
Expenditure Approach
Y = C + I + G + (X-M)
Consumption (sometimes thought of as Consumer Spending): spending by households on goods and services, with the exception of purchases of new housing.
Investment: spending on capital equipment, inventories, and structures, including household purchases of new housing.
Government purchases: spending on goods and services by local, provincial, and federal governments
Net exports: spending on domestically produced goods by foreigners (exports) minus spending on foreign goods by domestic residents (imports)
Aggregate Demand and GDP Aggregate demand is the total level of demand in the economy. It is the total of all desired expenditure at any time by all groups in the economy. The main groups who spend are: consumers (consumption), firms (who spend on investment), government (government expenditure) and foreign buyers (exports). Total aggregate demand is therefore:
AD = C + I + G + (X-M) where:
C = consumption expenditure (consumers) I = investment expenditure (firms à influences long-run growth) G = government expenditure (X - M) = net exports (exports - imports)
The Expenditure Approach
Consumer Spending (Goods & Services): 2,000.00
Investment (Government & business investment in fixed capital and inventories): 2,000.00
Government Spending (Goods & Services): 2,000.00
Exports (Goods & Services): 3,000.00
Gross Domestic Product: 8,000.00
Less: Imports (Goods & Services): 1,000.00 2,000.00
GDP = C + I + G + (X-M)
SIDEBAR
The Income Approach: GDP = W + Pr +I + R + O + Tib + D
Labour Income: 1,000.00
Corporate Profits (before tax): 1,000.00
Government Enterprise Profits: 1,000.00
Interest and Investment Income: 1,000.00
Farming Income (sell, eat, change in inventory): 1,000.00
Unincorporated Businesses (non-farm): 1,000.00
Net Domestic Income at Factor Cost (NDI): 6,000.00
Indirect Taxes - Subsidies: (2,000.00 - 1,000.00 ) 1,000.00
Capital Consumption Allowance 1,000.00
Gross Domestic Product: 8,000.00
W
Pr
Pr
I
O
R
Tib
D
Sales tax, Excise,
Customs, Property
SID
EBAR
1997 1998 1999 2000 2001 $ millions
Gross domestic product at market prices 882,733 914,973 980,524 1,064,995 1,092,246 Wages, salaries and supplementary labour income 453,073 475,335 502,726 545,110 568,864 Corporation profits before taxes 87,932 86,132 108,745 129,821 118,227 Government business enterprise profits before taxes 6,653 7,080 8,544 11,832 10,127 Interest and miscellaneous investment income 48,881 47,134 48,012 53,933 53,238 Accrued net income of farm operators from farm production 1,663 1,724 1,935 1,758 2,972 Net income of non-farm unincorporated business, including rent 54,663 57,936 61,351 63,962 66,551 Inventory valuation adjustment -623 -753 -2,669 -3,431 21 Taxes less subsidies on factors of production 47,821 48,899 50,641 51,716 52,577 Net domestic product at basic prices 700,063 723,487 779,285 854,701 872,577 Taxes less subsidies on products 66,025 68,439 72,947 76,029 75,370 Capital consumption allowances 116,574 122,659 128,625 135,781 144,315 Statistical discrepancy 71 388 -333 -1,516 -16
The Income Approach
1997 1998 1999 2000 2001 $ millions
Gross domestic product at market prices 882,733 914,973 980,524 1,064,995 1,092,246 Personal expenditure on consumer goods and services 510,695 531,169 560,954 594,089 620,777 Durable goods 67,988 71,325 77,660 81,679 84,805 Semi-durable goods 44,939 47,262 49,549 52,078 54,442 Non-durable goods 123,143 126,253 132,929 142,662 149,449 Services 274,625 286,329 300,816 317,670 332,081 Government current expenditure on goods and services 171,756 179,317 185,317 196,004 204,492 Government gross fixed capital formation 20,104 20,046 22,587 23,788 26,561 Government inventories 5 -27 -3 24 13 Business gross fixed capital formation 154,737 161,790 172,710 186,149 189,926 Residential structures 43,519 42,497 45,917 48,566 52,154 Non-residential structures and equipment 111,218 119,293 126,793 137,583 137,772 Non-residential structures 43,872 45,177 46,816 50,890 52,268 Machinery and equipment 67,346 74,116 79,977 86,693 85,504 Business investment in inventories 8,174 4,733 4,987 8,028 -6,040 Non-farm 9,174 5,409 4,932 8,189 -4,740 Farm -1,000 -676 55 -161 -1,300 Exports of goods and services 348,604 379,203 421,796 484,331 473,000 Goods 303,379 327,160 367,170 425,591 414,640 Services 45,225 52,043 54,626 58,740 58,360 Deduct: Imports of goods and services 331,271 360,871 388,157 428,934 416,498 Goods 277,727 303,395 326,962 363,428 350,622 Services 53,544 57,476 61,195 65,506 65,876 Statistical discrepancy -71 -387 333 1,516 15 Final domestic demand 857,292 892,322 941,568 1,000,030 1,041,756
The Expenditure Approach

18-04-03
4
Real versus Nominal GDP Q: If I received a 3% raise last year, am I
necessarily better off financially? A: Not if inflation was 4%!!! Nominal GDP: the production of goods and services valued at
current prices. Real GDP: the production of goods and services valued at
constant prices. CPI: (Consumer Price Index) an index measuring the
price increase for a “standard basket of goods” occurring over a period of one year.
Is it real growth, or is it just inflation?
If we experience inflation over a period of time, and we also experience economic growth, then we have two phenomenon acting on the value of our GDP at the same time. However, only ONE phenomenon is actually related to economic growth! The other is just inflation. We need a way to filter out the effects of inflation so that we can see how much of our growth is economic growth.
Basic Idea
Imagine we made the exact same crate of potatoes in 2017, but now imagine we sold that crate of potatoes for $110.00.
$110.00
Imagine we made one crate of potatoes in 2016. Imagine we sold that crate of potatoes for $100.00.
$100.00
It’s plane to see that we did not actually make any more goods in 2017 than we did the year before, but inflation makes it look like we made 10% more stuff! All we need to do is “tare away” the inflation from the 2017 GDP (10% in this case), and we’ll be left with the real GDP for 2017. Be careful, though! If you simply multiply the 2017 GDP by 10%, then you will calculate inflation on the inflation! Rather, you need to tare away the inflation by dividing the 2017 GDP by 1.10. Thus, $110.00 / 1.10 = $100.00 Voila! We tore away the inflation!
A Slightly More Complicated Example
Imagine we made three crates of potatoes in 2017, but now imagine we sold those three crates of potatoes for $315.00.
$315.00
Imagine we made two crates of potatoes in 2016. Imagine we sold the two crates for $100.00.
$200.00
It’s plane to see that we did make more goods in 2017 than we did the year before, but inflation is also adding to the mix. Once again, we just need to “tare away” the inflation from the 2017 GDP (5% in this case), and we’ll be left with the real GDP for 2017. Be careful, though! Don’t multiply the 2017 GDP by 5%! Rather, you need to divide the 2017 GDP by 1.05. Thus, $315.00 / 1.05 = $300.00 Voila! $300.00 is the real GDP for 2017!
From Inflation to the GDP Deflator Whereas the CPI reflects inflation’s impact on a theoretical basket of goods, the GDP deflator measures inflation’s impact on actual spending. There will always be a difference between the rate of inflation as measured by the CPI, and how much that inflation influences actual GDP. The CPI reflects a theoretical “basket of goods.” However, we don’t actually make or sell a simple “basket of goods” within our economy. The influence that inflation has on the actual value of the goods and services produced by our economy is calculated through the GDP deflator.
Real versus Nominal GDP GDP deflator: a measure of the increase in GDP that can be
attributed to inflation. It is not the same as inflation. Calculated: (Nominal GDP/Real GDP)*100 For example, if this year’s nominal GDP was $43.6 billion, but our
real GDP was $41.4 billion, then…
43.6 41.4
( ) * 100 = 1.05 ( ) * 100 = 105
Whereas the CPI reflects inflation’s impact on a theoretical basket of goods, the GDP deflator measures inflation’s impact on actual spending. Example: The price of chicken increases relative to the price of beef. Thus, more is spent on beef as a substitute for chicken. A fixed market basket measurement would miss this change. Having said that, there is rarely much difference between CPI and the GDP deflator.
18-04-03
5
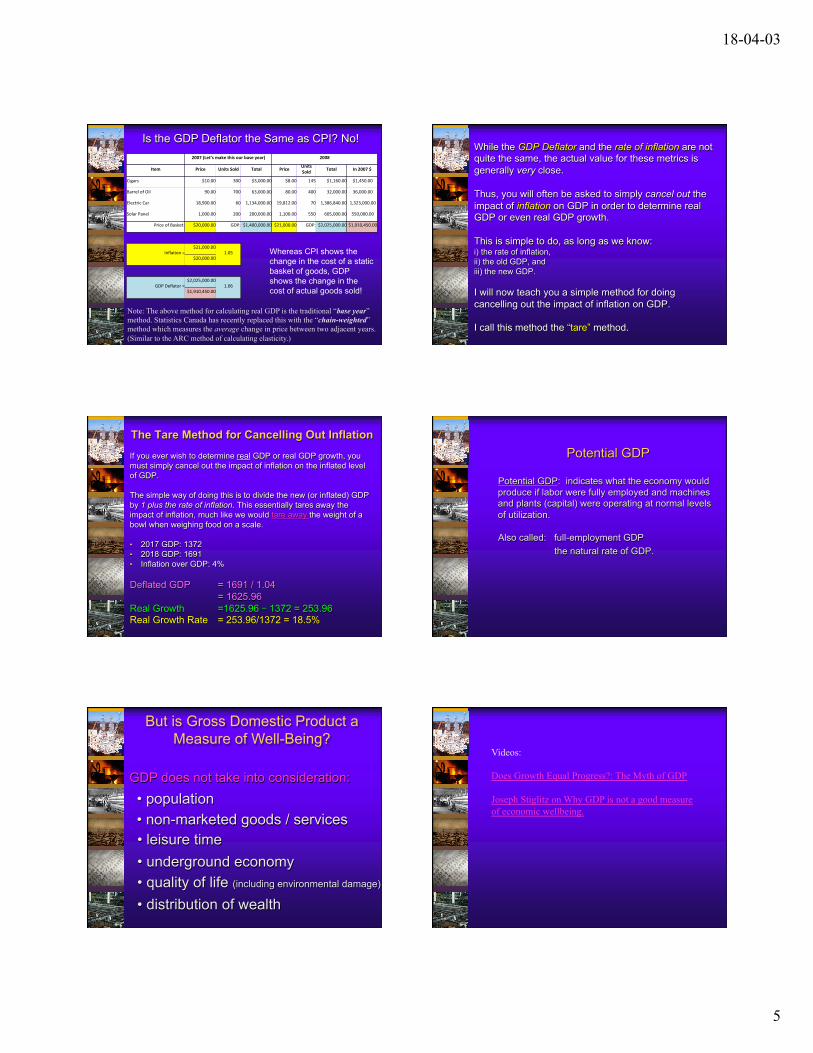
Is the GDP Deflator the Same as CPI? No!
Whereas CPI shows the change in the cost of a static basket of goods, GDP shows the change in the cost of actual goods sold!
Note: The above method for calculating real GDP is the traditional “base year” method. Statistics Canada has recently replaced this with the “chain-weighted” method which measures the average change in price between two adjacent years. (Similar to the ARC method of calculating elasticity.)
2007(Let’smakethisourbaseyear) 2008
Item Price UnitsSold Total Price UnitsSold Total In2007$
Cigars $10.00 300 $3,000.00 $8.00 145 $1,160.00 $1,450.00
BarrelofOil 90.00 700 63,000.00 80.00 400 32,000.00 36,000.00
ElectricCar 18,900.00 60 1,134,000.00 19,812.00 70 1,386,840.001,323,000.00
SolarPanel 1,000.00 200 200,000.00 1,100.00 550 605,000.00 550,000.00
PriceofBasket: $20,000.00 GDP:$1,400,000.00$21,000.00 GDP:$2,025,000.00$1,910,450.00
Inflation=$21,000.00
1.05$20,000.00
GDPDeflator=$2,025,000.00
1.06$1,910,450.00
While the GDP Deflator and the rate of inflation are not quite the same, the actual value for these metrics is generally very close. Thus, you will often be asked to simply cancel out the impact of inflation on GDP in order to determine real GDP or even real GDP growth. This is simple to do, as long as we know: i) the rate of inflation, ii) the old GDP, and iii) the new GDP. I will now teach you a simple method for doing cancelling out the impact of inflation on GDP. I call this method the “tare” method.
The Tare Method for Cancelling Out Inflation If you ever wish to determine real GDP or real GDP growth, you must simply cancel out the impact of inflation on the inflated level of GDP. The simple way of doing this is to divide the new (or inflated) GDP by 1 plus the rate of inflation. This essentially tares away the impact of inflation, much like we would tare away the weight of a bowl when weighing food on a scale. • 2017 GDP: 1372 • 2018 GDP: 1691 • Inflation over GDP: 4% Deflated GDP = 1691 / 1.04
= 1625.96 Real Growth =1625.96 – 1372 = 253.96 Real Growth Rate = 253.96/1372 = 18.5%
Potential GDP
Potential GDP: indicates what the economy would produce if labor were fully employed and machines and plants (capital) were operating at normal levels of utilization.
Also called: full-employment GDP
the natural rate of GDP.
But is Gross Domestic Product a Measure of Well-Being?
• population
• leisure time • non-marketed goods / services
• underground economy • quality of life (including environmental damage)
• distribution of wealth
GDP does not take into consideration:
Videos: Does Growth Equal Progress?: The Myth of GDP Joseph Stiglitz on Why GDP is not a good measure of economic wellbeing.