medical imaging processing - welcome to ece at mcmaster university
TRANSCRIPT

EE 4BF3 1
Medical Imaging Processing
Chapter 2: Image Acquisition Systems

EE 4BF3 2
2.1a: Introduction
A biomedical image acquisition system captures and records localized information about the physical and/or functional properties of tissues or components of tissues (e.g., cells) Accuracy – is the image a realistic representation of the targeted object?Efficiency – how long will it take to acquire the image?Most imaging systems are computerized and need computers to do some postprocess work, especially to produce 3D images

EE 4BF3 3
2.1b: Image FormationSome form of energy is measured after its passage through an interaction with a region of the bodyMathematical estimates are computed and images produced of the 2D and 3D distribution of sensor readings on interactions of the energy with body tissueThe interactions include absorption, attenuation, nuclear magnetic disturbances, etc.Many structures can be imaged simultaneouslyMany types of instrumentation may be used to measure the interactions between energy and tissues

EE 4BF3 4
2.1c: Image Characteristics
Image comparisons can be made based on some characteristics:
Inherent spatial resolution Contrast resolutionTemporal resolution
Other imaging system characteristics:Images of structureImages of function

EE 4BF3 5
2.1d: Spatial Resolution
In discrete digital images, each pixel (2D) or voxel(3D) has specific dimensions in the measurement space of the objectThe limits to spatial resolution in the final image are the smallest dimensions of the object differentiable by the total imaging system, including image reconstruction The resolution and dimensions may differ for each orthogonal direction represented in a volume image (anisotropic) or they may be equal (isotropic)

EE 4BF3 6
2.1e: Contrast Resolution
In an image, individual structures are recognized by localized differences in signal strength (e.g., the amount of absorption, reflection, etc.) among immediately adjacent structuresContrast resolution is the ability of an imaging system to detect differences in signal intensity between two structuresContrast resolution is dependent on image acquisition, the energy form used, and the physical properties of the structures being imagedIt usually specified as a percentage of the largest signal difference that can be detected and quantified

EE 4BF3 7
2.1f: Temporal Resolution
Two definitions – the “aperture time” and the frame (or repetition) rate”The aperture time is the amount of time the system takes to capture the signal information to form a single image
key component in eliminating motion artifactThe frame rate is the image repetition rate, defined by the smallest interval of time required to produce successive imagesBoth definitions do not include image reconstruction time or final image formation time

EE 4BF3 8
2.1g: More about Frame Rate
The frame rate limits the ability of the system to acquire 4D data sets (with the time line)In most cases, the frame rate of the imaging system is mechanically/electronically limited It may be triggered by physiological events to acquire “gated” images“Gated” images are taken in accordance to the time intervals of certain repeated physiological events, e.g., heart beat, breath

EE 4BF3 9
2.2a: Biomedical Acquisition Systems
Conventional radiographyConventional axial tomographyX-ray computed tomography (CT)Magnetic resonance imaging (MRI)Nuclear medicine imagingUltrasoundBiomagnetic imaging Microscopy imaging

EE 4BF3 10
2.2b: Conventional Radiography
Signal acquisition – a beam of X-rays passing through the body is differentially absorbed and scattered by structures in the beam path
physical densityatomic composition of the structuresenergy of the X-ray beam
The differential absorption pattern is recorded by an X-ray recorder
radiographic filmdigital radiographs (store, process, transport)

EE 4BF3 11
2.2c: Siemens X-ray MachinesFilm-based analogy multix top machines

EE 4BF3 12
2.2d: A Chest X-ray Picture

EE 4BF3 13
2.2e: Other Use of X-ray Machines

EE 4BF3 14
2.2f: X-ray Image Characteristics
X-ray is mostly used for structural imaging, the parameter recorded is the energy absorptionDimensionality is strictly 2D (a projection of a 3D structure onto a 2D plane)Spatial resolution is high, from 1.0 to 0.5 mm²Contrast resolution is on the order of 1% of full rangeTemporal resolution is about 10 millisecondsDigital radiographic images are usually represented over a 12-bit dynamic range from 0 to 4,096

EE 4BF3 15
2.2g: 3D Superposition in Radiographs
The attenuation is dependent on path length through an object as well as on the physical density and atomic composition of the objectWe cannot see from the film the different materials through which the beam passedThe attenuation at different points along the beam path “add up” and are superimposed onto the same points on the detectorRegions where high density differences exist between structures can be seen clearly

EE 4BF3 16
2.2h: More X-ray Picture (Lung and Heart)
EE 4BF3 17
2.3a: Conventional Axial Tomography
Conventional axial tomography was developed in an attempt to overcome the superposition problem The X-ray source and photographic detector are moved in opposite directions parallel to the plane of the body to be imagedDistribution of densities of the focal plane will be sharply recorded, outside of the focal plane will be blurredIt cannot overcome the superposition problem entirely, may blur the structure boundary

EE 4BF3 18
2.3b: Illustration of Conventional Axial Tomography

EE 4BF3 19
2.4a: X-ray Computed Tomography (CT)
CT collimates the beam to minimize scatter, and eliminates superposition by scanning around a transaxial plane Recorded intensity differences can be less than 0.1%, individual attenuation coefficients of structures in the beam path can be determined to within 0.5% accuracyA full 3D representation can be obtained by reconstructing several cross sections of 2D slices, “stacking” the cross section like a roll of coins

EE 4BF3 20
A collimator is a device used to filter a stream of rays (such as X-rays) so that only those travelling parallel to each other in a certain direction are allowed through.

EE 4BF3 21
2.4b: CT Machine for Body

EE 4BF3 22
2.4c: CT-Machine (Scanning)

EE 4BF3 23
2.4c: A 3D Reconstructed CT View of Kidneys and Ureters

EE 4BF3 24
2.4d: 3D CT View of Chest (Pulmonary Vessels)
EE 4BF3 25
2.4e: Signal Acquisition
Conventional X-ray CT scanners use a single X-ray tube that rotates through a full 360° rotations while recording projections at fine angular increments during the rotation (every 0.5° to 1°)The projection images are processed in a computer and an image is formed through mathematical reconstruction techniquesX-ray beam forms a flat fan-beam geometry and the projects are coplanar, the detector is a curvilinear array of solid state elements

EE 4BF3 26
Plane X-ray imaging
TransmittedAbsorbedScattered
Detector
Tube

EE 4BF3 27
Towards 3D imaging
Mathematical results: Radon transformation
1917
Computers can perform complex mathematics to
reconstruct and process imagesLate 1960’s:
X-ray imaging1895
Development of CT(computed tomography)
1972Also known as CAT (Computerized Axial Tomography)

EE 4BF3 28
Radon Transformation
• Mathematical transformation (related to Fourier) • Reconstruction of the shape of object (distribution f(x,y)) from the multitude of 2D projections ),( θsg

EE 4BF3 29
CT imaging

EE 4BF3 30
CT Scanner

EE 4BF3 31
CT imaging, inventing (1972)
Sir Godfrey Hounsfield Engineer for EMI PLC 1972Nobel Prize 1979 (with Alan Cormack)

EE 4BF3 32
CT imaging, availability (since 1975)
Original CT image (128x128) from the CT scanner circa 1975. In 1975 physicians were fascinated by the ability to see the soft tissue structures of the brain.
1974
CT image (512 x 512) using a state-of-the-art CT system. Note the two black "pea-shaped" ventricles and the subtle delineation of gray and white matter.
25 years later

EE 4BF3 33
Principle of a CT ScannerPrinciple of a CT ScannerPrinciple of a CT Scanner

EE 4BF3 34
30 Years of CT

EE 4BF3 35
First Generation Scanners

EE 4BF3 36
Second Generation Scanners

EE 4BF3 37
Third Generation Scanners

EE 4BF3 38
Fourth Generation Scanners

EE 4BF3 39
Fifth Generation Scanners

EE 4BF3 40
CT Chest Images

EE 4BF3 41
2.4f: Illustration of CT Systems
a: 1st generation: translate rotate pencil beam geometry
b: 2nd generation: translaterotate fan beam geometry
c: 3rd generation: rotate only geometry
d: 3rd generation: off-set mode geometry

EE 4BF3 42
2.4g: Spiral (Helical) CT
The projection acquisition process traces out a spiral trajectory rather than a sequence of parallel, flat projection fansThis is achieved by a combination of continuous beam-detector rotation and continuous table movement causes the projection data to be acquired along a spiral path. It is fast It is the X-ray CT imaging system of choice for acquiring 3D volume images of many structuresGood for the application of 3D visualization and quantitative analysis techniques

EE 4BF3 43
2.4h: Spiral CT
Photo simulation of spiral CT on abdomen
Virtual reality 3D image of lungs
EE 4BF3 44
2.4i: Image Formation/Reconstruction
Tomography is the graphic representation of a cut, or slice, and implies the formation of 2D cross-sectional images free of blurring from structures not in the planes of interest, the tomogramsComputed tomography (CT) is the formation of tomograms of X-ray absorption coefficients by the method of reconstruction from recorded projectionsThe term CT may be applicable to any techniques that requires computation in order to reconstruct an image with non-ambiguous resolution in 3D

EE 4BF3 45
2.4j: Computed Tomography
All biomedical imaging systems that produce 3D volume images use computed tomographyIt is a computer implementation of an appropriate inversion formula to mathematically reconstruct adjacent cross sections of an object from measured fluctuations of some energy traversing the object from several different directionsIt reconstructs 3D images from a series of 2D projects, or reconstructs 2D distribution of X-ray attenuation coefficients in a plane (slice) from a number of 1D projections

EE 4BF3 46
2.4k: CT NumbersThe CT number produced by X-ray scanner systems is an expression of the relationship of the linear attenuation of X-rays by a given material (tissue) to that by water for the same X-ray energy, it is
CT Number = ( ) /w wk µ µ µ⋅ −
wµwhere µ is the attenuation coefficient of the material and is the attenuation coefficient of water
The CT number is often called the Hounsfield unit (H), in honor of the inventor of the first X-ray CT scanner

EE 4BF3 47
2.4l: Hounsfield Unit
A Hounsfield unit (H) is given by
1 0 0 0 ( 1)w
H µµ
= ⋅ −
To obtain the value of the attenuation coefficient relative to water
1 / 1 0 0 0w
Hµµ
= +

EE 4BF3 48
2.4m: Image Characteristics
The spatial resolution of voxels of CT data ranges from 0.1 to 1 mm² in the plane of acquisition, with the slice thickness ranging approximately from 1 to 10 mm. With spiral CT, the thickness can be reduced to 0.5mmThe CT data is represented in a calibrated set of numbers (the Hounsfield scale), ranging in discrete value from -1,000 to 1,000. They are often shifted in positive range (0 t0 2,048), stored as a 16-bit computer value
EE 4BF3 49
2.5a: Magnetic Resonance Imaging (MRI)
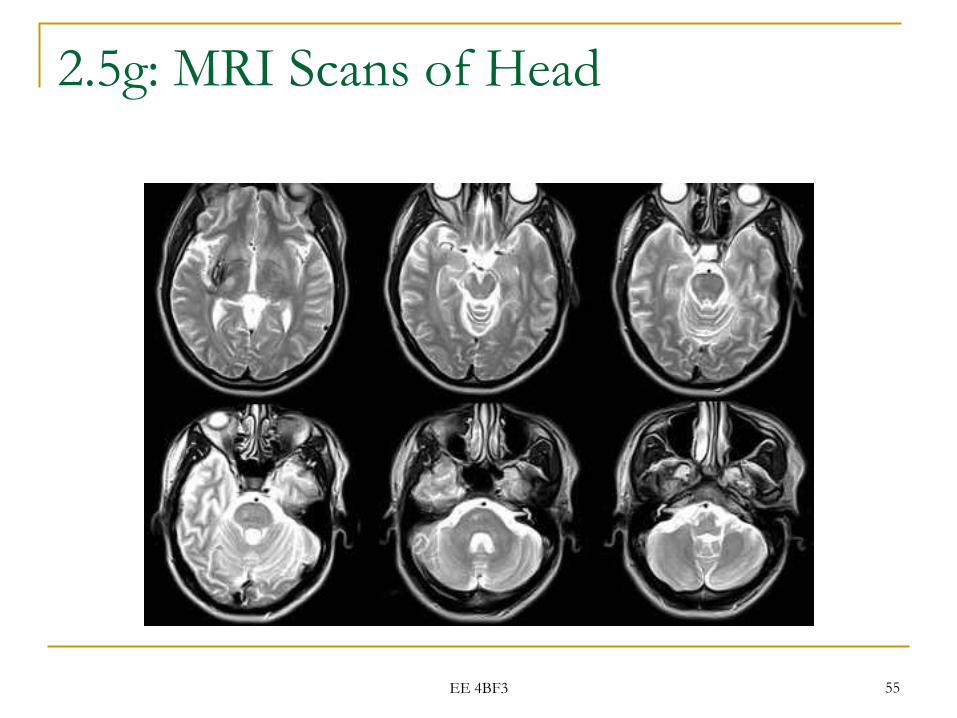
MRI provides mechanism for intricate control of the signal being measured through modulation of the magnetic field and radiofrequency pulse sequences used to alter the spins of protons in the structure being imaged It is noninvasive, does not use ionizing radiation, as in the X-rayMRI images the distribution of protons, and is an excellent soft tissue imaging modality, providing highly detailed structural images. (CT is better for higher density structures, such as bones)

EE 4BF3 50
2.5b: MRI Machines

EE 4BF3 51
2.5c: Signal Acquisition
Hydrogen nuclei (protons) are imaged due to their strong magnetic moment and prevalence in the soft tissues of the body (water molecules)The externally applied magnetic field is called the B0 field in MRI, which makes the spin line up with the fieldThe full collection of spinning results in a net magnetic moment for all spins in the direction of the externally applied magnetic field

EE 4BF3 52
2.5d: Radiofrequency Pulses & MRI Signal
The precessional frequency of a given atomic nucleus about the B0 field axis is given by (Larmor)
0B Fγ =where F is the precessional frequency, B0 is the strength of the externally applied magnetic field, and γ is a property of the magnetic moment for the specific type of nucleus under considerationFor hydrogen γ = 4,257 Hz/G, and the common field of strength B0 = 1.5Tesla, and F = 63.855 MHz

EE 4BF3 53
2.5e: MRI Signal
The radio frequency (RF) pulses distribute energy to the protons, causing them to absorb energy when the RF pulses are on, and dissipate that energy when off. This is the “resonance”The RF frequency perpendicular to the B0 external magnetic field is called the B1 field.The net magnetic moment rotated about the B0 field induces a current (AC) in a coil of wire located in the transverse plane. The signal from the induced current is the source of signal for MR imaging

EE 4BF3 54
2.5f: MRI Scan of Body (Liver and Kidneys)
EE 4BF3 55
2.5g: MRI Scans of Head

EE 4BF3 56
2.5h: Public Recognition
The 2003 Nobel Prize in Physiology or Medicine was awarded to Paul C. Laterbur at the University of Illinois at Urbana, and Peter Mansfield at the University of Nottingham in England They are not doctors (chemist and physicist)Dr. Raymond Damadian, the MRI patent (1974) holder, was not one of the recipients. He published his first MRI paper in 1971

EE 4BF3 57
2.5i: Magnetic Moment Relaxation
The RF energy can move the net magnetic moment away from the B0 field axis by a flip angle. Once the RF energy is turned off, the spins will begin to realign themselves with the external B0 field. This process is called “relaxation”If a 90° RF pulse is used to rotate the net magnetic moment into the transverse plane and then turned offer, the receiver coil oriented in the transverse plane will initially have a current proportional to the full magnetic moment, but will diminish graduallyThe signal in the transverse plane has a characteristic exponential decay rate time constant, called the T2* constant

EE 4BF3 58
2.5j: T2 Relaxation Time
The variation in precession rates of spins causes dephasing of the contribution of each individual proton’s magnetic moment to the net magnetic moment, causing it to decayThe dephasing is related to the physical properties of the tissues being imaged. The T2 constant, or spin-spin relaxation, is measured as these spin decay and come back into alignment

EE 4BF3 59
2.5k: Exponential Decay of Signal Strength (Brain White Matter T2=0.07S)

EE 4BF3 60
2.5l: T1 Relaxation Time
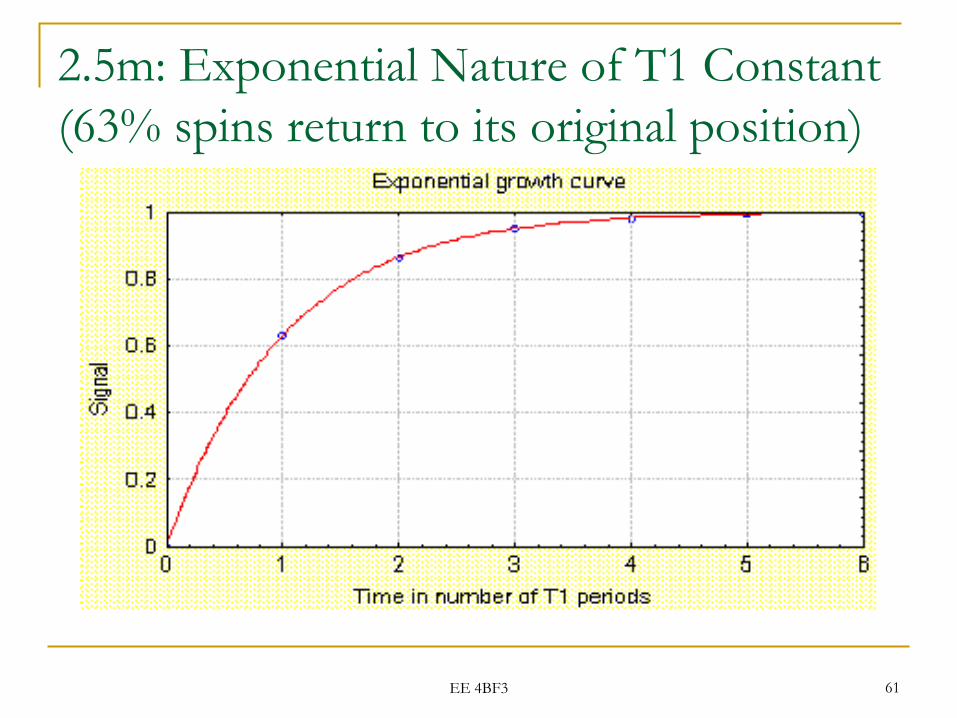
Immediately after a 90° pulse, the net magnetic moment along the longitudinal plane is zero. It will increase as the spins return to their alignment in this plane with B0This is the spin-lattice relaxation process and is characterized by an exponential time constant T1A coil in the longitudinal direction can measure the buildup of signal along the external field axis as spins return to equilibriumT1 relaxation time can be computed for different imaged tissues in the body
EE 4BF3 61
2.5m: Exponential Nature of T1 Constant(63% spins return to its original position)

EE 4BF3 62
2.5n: T2* Relaxation Time and T2 Time

EE 4BF3 63
2.5o: Echo Time (TE) and Repetition Time (TE)
The time between the original 90° pulse and the rephasing of the individual magnetic moments is called the “echo time” (TE) and is specified in the pulse sequence designThe time needed for repeated excitation and echo formation is called “repetition time” (TR)The “flip angle” is the one that formed by the protons after the RF pulse moving the net magnetic moment away from the B0 fieldThese are the parameters used to design specific “pulse sequence” to image various structures in the body

EE 4BF3 64
2.5p: Magnetic Field Gradients and Spatial Localization
Position information can be encoded into the signal by adding a magnetic field gradientThe resonance frequency of the protons will vary along the gradient axis as each will have a slightly different magnetic field3D spatial position can be encoded by adding gradients along three orthogonal spatial axesSpecial coils are used to produce these spatially varying field gradients for encoding the spatial position of any voxel in MRI

EE 4BF3 65
2.5q: Surface Coils and Paired Saddle Coils
Image spines, shoulders Image knees
EE 4BF3 66
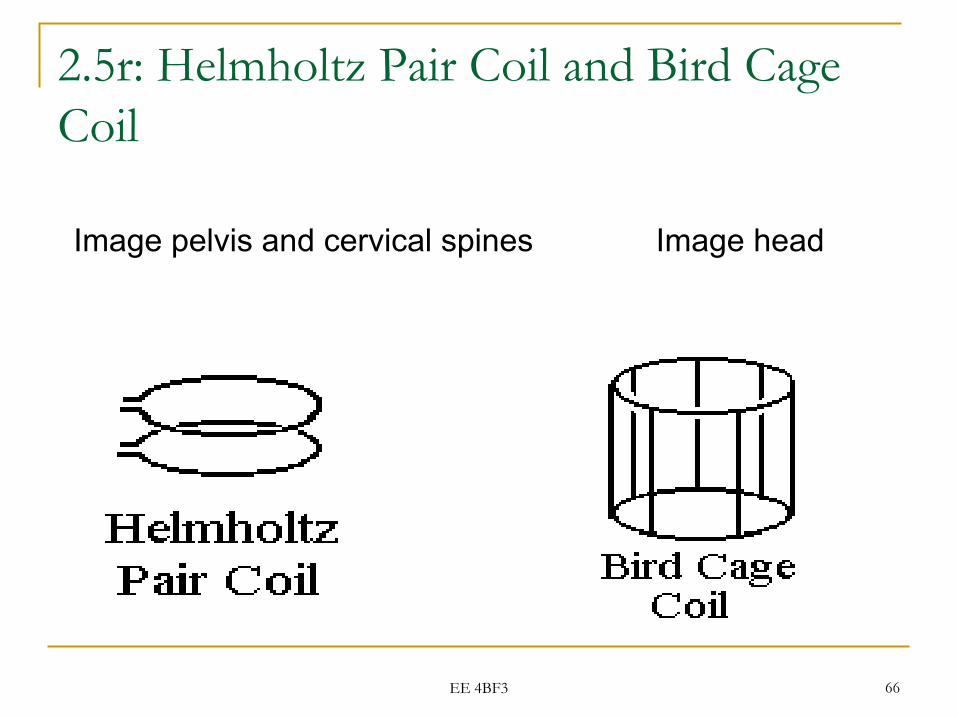
2.5r: Helmholtz Pair Coil and Bird Cage Coil
Image pelvis and cervical spines Image head

EE 4BF3 67
2.5s: Signal Acquisition & Reconstruction
Signals are acquired as sums of all of the frequency components, each with distinct amplitudes and relative phases in the frequency domainThey must be transformed into the spatial representation of the image using a Fourier transformThe frequency space (k-space) data can be processed in many ways to reduce artifacts, noise, or correct for any inhomogeneities in signal or spatial encoding

EE 4BF3 68
2.5t: Image Characteristics
The value at any given voxel in an MR image is a measure of the MR signal amplitude for the mobile protons contained within the discrete bounds of that 3D voxelA T2-weighted image is acquired with a long TR time and TE is prolonged to the range of tissue T2 valuesA T1-weighted image is obtained by a short TR time in the range of the T1 values for tissues and very short TE. This very short TE does not allow time for significant decay of the transverse relaxation, i.e., no T2 difference
EE 4BF3 69
2.5u: MRI Volume Images (2D to 5D)
2D images are single-slice reconstruction from a single section of structure (with a thickness)3D images can be reconstructed from either 2D multiple adjacent slice techniques or true 3D volume acquisitionsMost MR images are reconstructed into 256X256 matrix (interpolated from frequency and phase encodings ranging from 128 to 256) with 1 to 128 sections in a given volume imageThe in-plane spatial resolution ranges from 0.5 to 1 mm, with the slice thickness from 1 to 10 mm

EE 4BF3 70
2.5v: Some Definitions
The matrix size is the number of frequency encoding steps, in one direction, and the number of phase encoding steps, in the other direction of the image planeThe frequency encoding depends on how rapidly the signal is sampled by the scanner. Increasing the sampling rate has no time penalty The Field-of-View (FOV) is the total area that the matrix of phase and frequency encoding covers. Dividing the FOV by the matrix size gives the voxelsize
EE 4BF3 71
2.6a: Nuclear Medicine Imaging
Nuclear medicine imaging systems image the distribution of radioisotopes distributed within the body, preferably to a specific organ or structure of interestIt provides a direct representation of metabolism or function in the organ or structure being imagedTwo main technologies: single photon emission computed tomography (SPECT) and positron emission tomography (PET)

EE 4BF3 72
2.6b: Single Photon Emission CT(SPECT)
SPECT systems image the distribution of radiopharmaceuticals that emit photons upon decay – using a gamma cameraImage reconstruction is similar to X-ray CTPatients will be injected or inhaled a small amount of physiologic radioisotopic tracersIts principal strength is its ability to provide functional information by the use of radiopharmaceuticals that are indicator of invivo biochemical or hemodynamic functions

EE 4BF3 73
2.6c: SPECT Illustration

EE 4BF3 74
2.6d: Positron Emission Tomography (PET)
PET produces transverse tomographic images of the distribution of positron-emitting radionuclidessystematically administered to the subject under studyThe image data is supplied by the detection of the annihilation radiation emitted as a result of the annihilation of positrons in matterRadionuclides commonly used are carbon-11. nitrogen-13, oxygen-15, etcPET is very useful in the study of biochemical processes of fundamental importance in biology and medicine
EE 4BF3 75
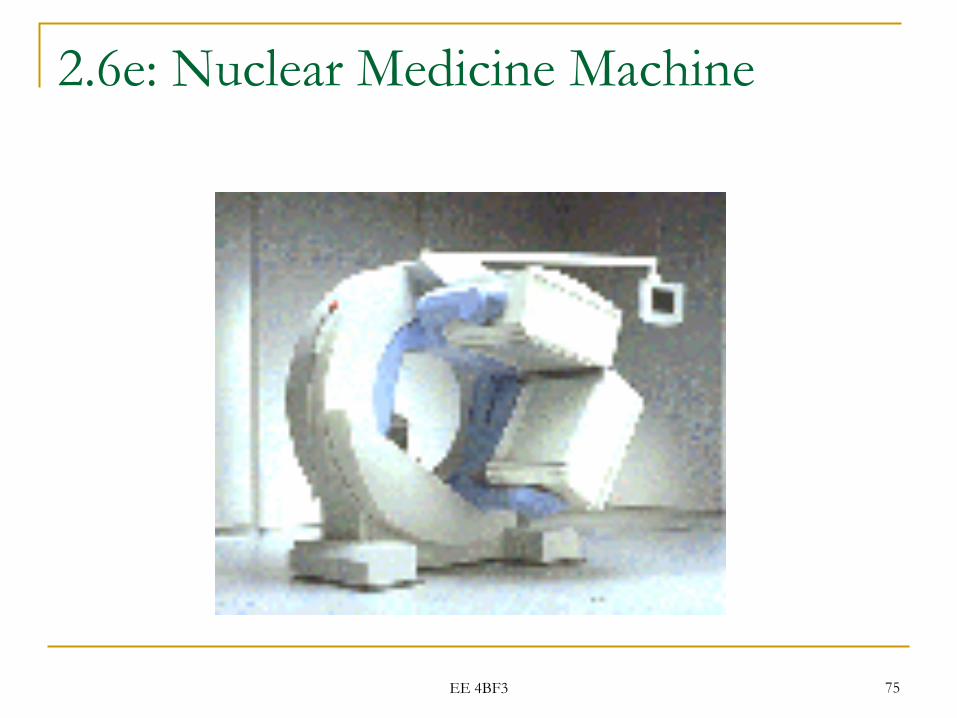
2.6e: Nuclear Medicine Machine

EE 4BF3 76
2.6f: Nuclear Medicine Imaging Machine
EE 4BF3 77
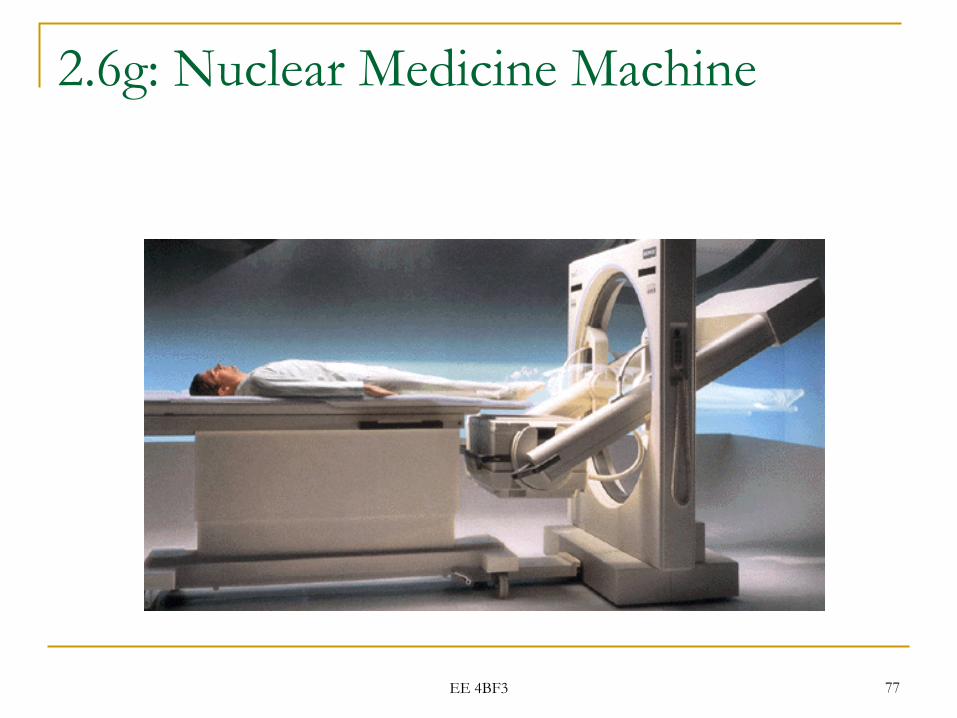
2.6g: Nuclear Medicine Machine

EE 4BF3 78
2.6h: Images of PET (Bones)

EE 4BF3 79
2.6i: PET and MRI Images
Combined
MRI
PET

EE 4BF3 80
2.6j: PET (Hearts)
Rest
Exercised

EE 4BF3 81
2.7a: Ultrasound
Ultrasound is acoustical energy that contains frequencies higher than the upper audible limitIn diagnostic imaging context, longitudinal waves usually have frequencies between 0.5 and 15MHzThe basis of ultrasonic imaging is to determine information about intrinsic tissue properties from observations of the way in which probing waves are perturbed or “scattered” by the tissuesB-scan imaging records pulse echoes from a single transducer over time and shape and is tomographic

EE 4BF3 82
2.6b: New Ultrasound Techniques
New generation ultrasound techniques usually employ a computer to reconstruct images from raw or measured dataSmall ultrasound transducers can be made sufficiently small to be inserted into body for internal imagingThe biggest advantages of ultrasound imaging is that the system is inexpensive and the procedure is safe

EE 4BF3 83
2.6c: Ultrasound Machine
EE 4BF3 84
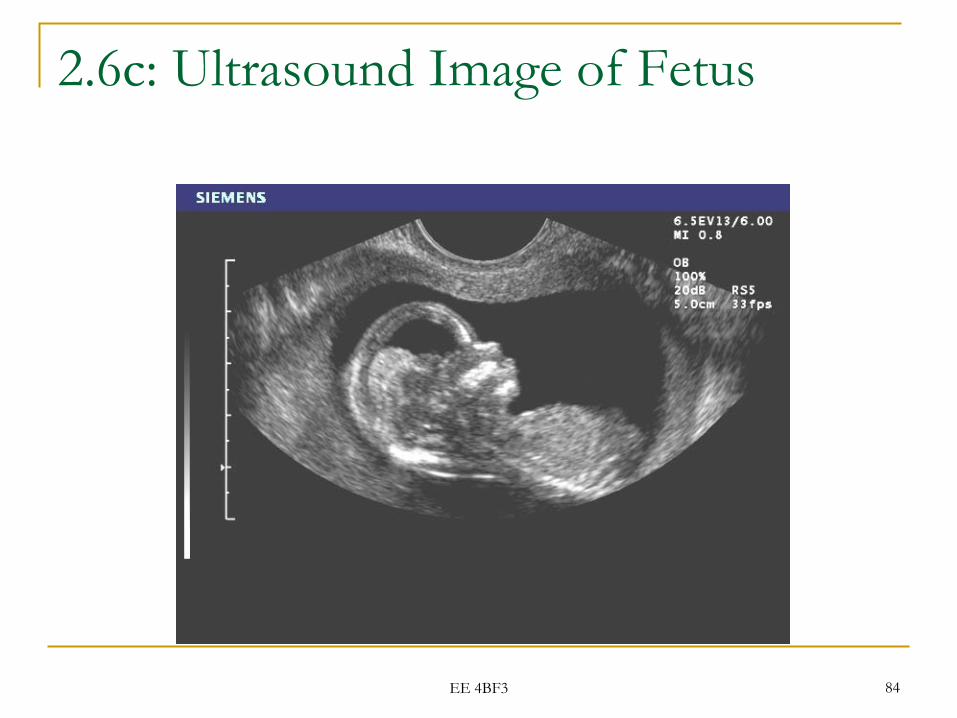
2.6c: Ultrasound Image of Fetus

EE 4BF3 85
2.6e: Ultrasound Image of Kidney