membrane-bound hydrogenase i from the hyperthermophilic
TRANSCRIPT
Membrane-Bound Hydrogenase I from the HyperthermophilicBacterium Aquifex aeolicus: Enzyme Activation, Redox
Intermediates and Oxygen Tolerance
Maria-Eirini Pandelia,†,‡ Vincent Fourmond,‡,§ Pascale Tron-Infossi,§
Elisabeth Lojou,§ Patrick Bertrand,§ Christophe Leger,§
Marie-Therese Giudici-Orticoni,§ and Wolfgang Lubitz†,*
Max-Planck-Institut fur Bioanorganische Chemie, Stiftstrasse 34-36,D45470, Mulheim a.d. Ruhr, Germany, and CNRS UPR 9036, Institut de Biologie de la
Méditerranée, 31 chemin Joseph Aiguier, 13402 Marseille Cedex 20, France
Received December 23, 2009; E-mail: [email protected]
Abstract: The membrane-bound hydrogenase (Hase I) of the hyperthermophilic bacterium Aquifex aeolicusbelongs to an intriguing class of redox enzymes that show enhanced thermostability and oxygen tolerance.Protein film electrochemistry is employed here to portray the interaction of Hase I with molecular oxygenand obtain an overall picture of the catalytic activity. Fourier transform infrared (FTIR) spectroscopy integratedwith in situ electrochemistry is used to identify structural details of the [NiFe] site and the intermediatestates involved in its redox chemistry. We found that the active site coordination is similar to that of standardhydrogenases, with a conserved Fe(CN)2CO moiety. However, only four catalytic intermediates could bedetected; these correspond structurally to the Ni-B, Ni-SIa, Ni-C, and Ni-R states of standard hydrogenases.The Ni-SI/Ni-C and Ni-C/Ni-R midpoint potentials are approximately 100 mV more positive than thoseobserved in mesophilic hydrogenases, which may be the reason that A. aeolicus Hase I is more suitableas a catalyst for H2 oxidation than production. Protein film electrochemistry shows that oxygen inhibits theenzyme by reacting at the active site to form a single species (Ni-B); the same inactive state is obtainedunder oxidizing, anaerobic conditions. The mechanism of anaerobic inactivation and reactivation in A.aeolicus Hase I is similar to that in standard hydrogenases. However, the reactivation of the former ismore than 2 orders of magnitude faster despite the fact that reduction of Ni-B is not thermodynamicallymore favorable. A scheme for the enzymatic mechanism of A. aeolicus Hase I is presented, and the resultsare discussed in relation to the proposed models of oxygen tolerance.
1. Introduction
Hydrogenases (Hases) are enzymes that catalyze the reversibleheterolytic splitting of dihydrogen:1 H2hH- + H+h 2H+ + 2e-.They can be classified according to the metal content of theiractive sites into three distinct classes:2 [NiFe]-, [FeFe]- and [Fe]-(or iron-sulfur cluster-free) hydrogenases. For all 3 classes,structural information has been derived from X-ray crystallo-graphy.3-7 Most hydrogenases are inhibited by molecularoxygen. This inhibition is reversible for the representatives ofthe [NiFe] class, whereas for the other two groups exposure to
oxygen mostly leads to irreversible degradation. Recently thestrict requirement for anaerobic conditions has been re-examinedon the grounds of the discovery of enzymes that can performcatalysis under atmospheric conditions. In particular, [NiFe]hydrogenases from hyperthermophilic (e.g., Aquifex aeolicus)8
or Knallgas bacteria (e.g., Ralstonia eutropha)9 have shownincreased oxygen tolerance and have allegedly a strong potentialto be used in future biotechnological hydrogen-related process-es.10,11 Hereafter, the well-studied oxygen-sensitive [NiFe]enzymes from the DesulfoVibrio and Allochromatium specieswill be referred to as “standard” hydrogenases to differentiatethem from the oxygen tolerant enzymes derived from, forexample, Ralstonia and Aquifex species.
A. aeolicus VF5 is one of the most hyperthermophilic bacteriaknown to date with an optimum growing temperature of 85 °C.12
It is a microaerobic, obligate chemolithoautotrophic bacterium
† Max-Planck-Institut fur Bioanorganische Chemie.‡ These authors contributed equally to this work.§ Laboratoire de Bioenergetique et Ingenierie des Proteines.
(1) Vignais, P. M. Results Probl. Cell Differ. 2008, 45, 223–252.(2) Vignais, P. M.; Billoud, B. Chem. ReV. 2007, 107, 4206–4272.(3) Volbeda, A.; Charon, M. H.; Piras, C.; Hatchikian, E. C.; Frey, M.;
Fontecilla-Camps, J. C. Nature 1995, 373, 580–587.(4) Nicolet, Y.; Lemon, B. J.; Fontecilla-Camps, J. C.; Peters, J. W. Trends
Biochem. Sci. 2000, 25, 138–143.(5) Shima, S.; Pilak, O.; Vogt, S.; Schick, M.; Stagni, M. S.; Meyer-
Klaucke, W.; Warkentin, E.; Thauer, R. K.; Ermler, U. Science 2008,321, 572–575.
(6) Armstrong, F. A.; Fontecilla-Camps, J. C. Science 2008, 321, 498–499.
(7) Ogata, H.; Lubitz, W.; Higuchi, Y. Dalton Trans. 2009, 37, 7577–7587.
(8) Guiral, M.; Tron, P.; Belle, V.; Aubert, C.; Léger, C.; Guigliarelli,B.; Giudici-Orticoni, M. T. Int. J. Hydrogen Energy 2006, 31, 1424–1431.
(9) Ludwig, M.; Cracknell, J. A.; Vincent, K. A.; Armstrong, F. A.; Lenz,O. J. Biol. Chem. 2009, 284, 465–477.
(10) Mertens, R.; Liese, A. Curr. Opin. Biotechnol. 2004, 15, 343–348.(11) Lojou, E.; Giudici-Orticoni, M. T.; Bianco, P. J. Electroanal. Chem.
2005, 577, 79–86.
Published on Web 05/04/2010
10.1021/ja910838d 2010 American Chemical Society J. AM. CHEM. SOC. 2010, 132, 6991–7004 9 6991
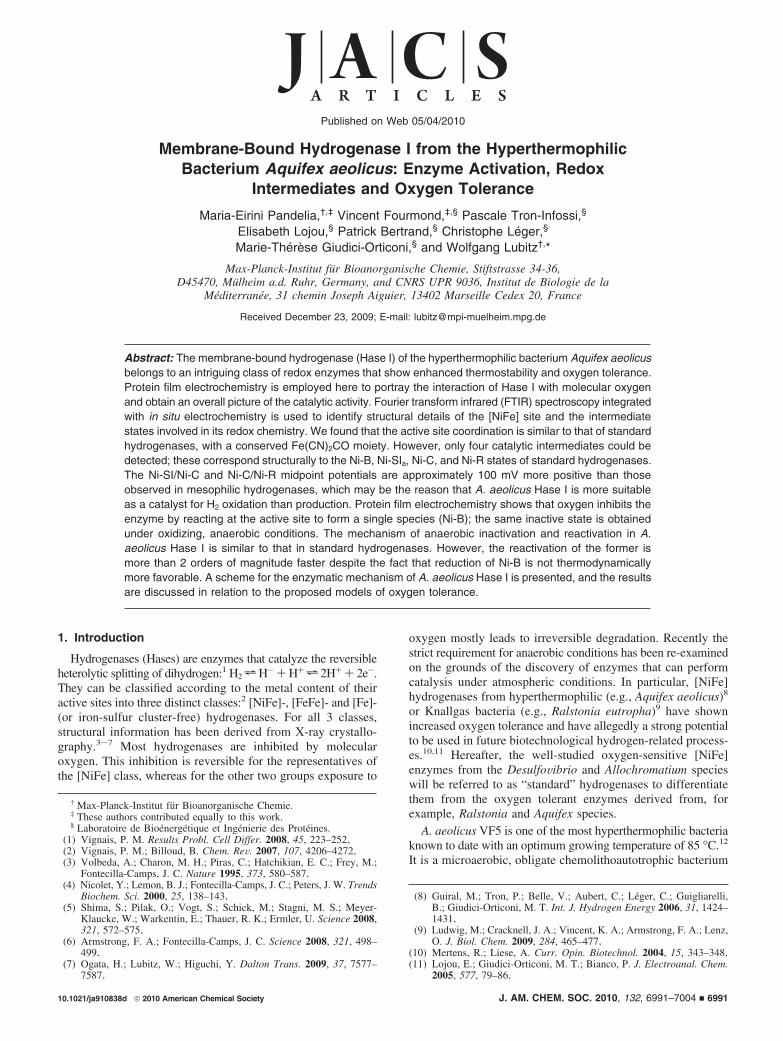
that encodes three distinct [NiFe] hydrogenases.13 Among theseenzymes, Hydrogenase I (Hase I) is a membrane attachedhydrogenase, which is proposed to be involved in the aerobicrespiration using hydrogen as the electron donor. It consists ofthree subunits (Hase I-cytb complex):13 a large subunit (70 kDa)that contains the nickel-iron center, a small subunit (40 kDa)that harbors the electron relaying iron-sulfur centers and adihaem cytochrome b subunit (27 kDa), cf. Figure 1. It can alsobe purified without its native electron acceptor cytb.13
Though a crystal structure of the A. aeolicus Hase I is notyet available, a combination of techniques has been put forwardto characterize its electronic and physicochemical properties.The sequence motif for the binding of the active center in thelarge subunit is well preserved and electron paramagneticresonance (EPR) studies have shown nickel signals typical ofmesophilic hydrogenases.13,14 This suggests a similar electronicstructure and molecular symmetry of the spin carrying [NiFe]center (Figure 1). Additionally, in the small subunit, theexistence of one [Fe3S4] and two [Fe4S4] clusters has beensuggested by the presence of the ten conserved cysteines andone histidine, though the EPR signals were found to be morecomplex than those in standard hydrogenases (e.g., in Desulfo-Vibrio).13,15
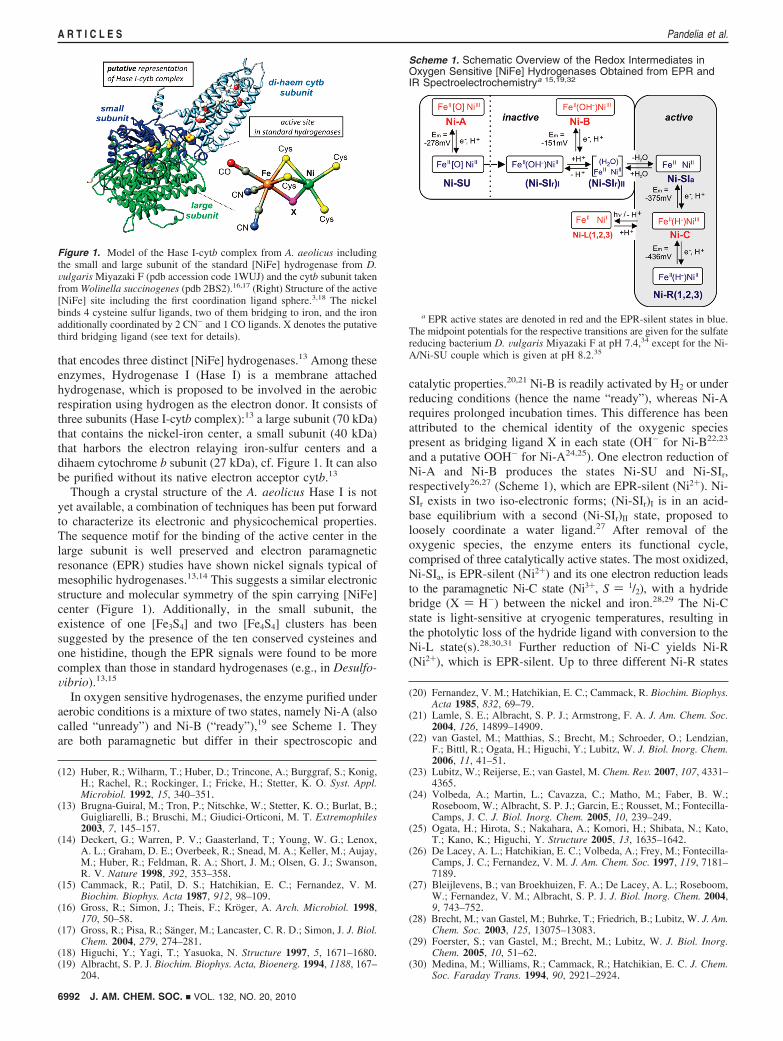
In oxygen sensitive hydrogenases, the enzyme purified underaerobic conditions is a mixture of two states, namely Ni-A (alsocalled “unready”) and Ni-B (“ready”),19 see Scheme 1. Theyare both paramagnetic but differ in their spectroscopic and
catalytic properties.20,21 Ni-B is readily activated by H2 or underreducing conditions (hence the name “ready”), whereas Ni-Arequires prolonged incubation times. This difference has beenattributed to the chemical identity of the oxygenic speciespresent as bridging ligand X in each state (OH- for Ni-B22,23
and a putative OOH- for Ni-A24,25). One electron reduction ofNi-A and Ni-B produces the states Ni-SU and Ni-SIr,respectively26,27 (Scheme 1), which are EPR-silent (Ni2+). Ni-SIr exists in two iso-electronic forms; (Ni-SIr)I is in an acid-base equilibrium with a second (Ni-SIr)II state, proposed toloosely coordinate a water ligand.27 After removal of theoxygenic species, the enzyme enters its functional cycle,comprised of three catalytically active states. The most oxidized,Ni-SIa, is EPR-silent (Ni2+) and its one electron reduction leadsto the paramagnetic Ni-C state (Ni3+, S ) 1/2), with a hydridebridge (X ) H-) between the nickel and iron.28,29 The Ni-Cstate is light-sensitive at cryogenic temperatures, resulting inthe photolytic loss of the hydride ligand with conversion to theNi-L state(s).28,30,31 Further reduction of Ni-C yields Ni-R(Ni2+), which is EPR-silent. Up to three different Ni-R states
(12) Huber, R.; Wilharm, T.; Huber, D.; Trincone, A.; Burggraf, S.; Konig,H.; Rachel, R.; Rockinger, I.; Fricke, H.; Stetter, K. O. Syst. Appl.Microbiol. 1992, 15, 340–351.
(13) Brugna-Guiral, M.; Tron, P.; Nitschke, W.; Stetter, K. O.; Burlat, B.;Guigliarelli, B.; Bruschi, M.; Giudici-Orticoni, M. T. Extremophiles2003, 7, 145–157.
(14) Deckert, G.; Warren, P. V.; Gaasterland, T.; Young, W. G.; Lenox,A. L.; Graham, D. E.; Overbeek, R.; Snead, M. A.; Keller, M.; Aujay,M.; Huber, R.; Feldman, R. A.; Short, J. M.; Olsen, G. J.; Swanson,R. V. Nature 1998, 392, 353–358.
(15) Cammack, R.; Patil, D. S.; Hatchikian, E. C.; Fernandez, V. M.Biochim. Biophys. Acta 1987, 912, 98–109.
(16) Gross, R.; Simon, J.; Theis, F.; Kroger, A. Arch. Microbiol. 1998,170, 50–58.
(17) Gross, R.; Pisa, R.; Sanger, M.; Lancaster, C. R. D.; Simon, J. J. Biol.Chem. 2004, 279, 274–281.
(18) Higuchi, Y.; Yagi, T.; Yasuoka, N. Structure 1997, 5, 1671–1680.(19) Albracht, S. P. J. Biochim. Biophys. Acta, Bioenerg. 1994, 1188, 167–
204.
(20) Fernandez, V. M.; Hatchikian, E. C.; Cammack, R. Biochim. Biophys.Acta 1985, 832, 69–79.
(21) Lamle, S. E.; Albracht, S. P. J.; Armstrong, F. A. J. Am. Chem. Soc.2004, 126, 14899–14909.
(22) van Gastel, M.; Matthias, S.; Brecht, M.; Schroeder, O.; Lendzian,F.; Bittl, R.; Ogata, H.; Higuchi, Y.; Lubitz, W. J. Biol. Inorg. Chem.2006, 11, 41–51.
(23) Lubitz, W.; Reijerse, E.; van Gastel, M. Chem. ReV. 2007, 107, 4331–4365.
(24) Volbeda, A.; Martin, L.; Cavazza, C.; Matho, M.; Faber, B. W.;Roseboom, W.; Albracht, S. P. J.; Garcin, E.; Rousset, M.; Fontecilla-Camps, J. C. J. Biol. Inorg. Chem. 2005, 10, 239–249.
(25) Ogata, H.; Hirota, S.; Nakahara, A.; Komori, H.; Shibata, N.; Kato,T.; Kano, K.; Higuchi, Y. Structure 2005, 13, 1635–1642.
(26) De Lacey, A. L.; Hatchikian, E. C.; Volbeda, A.; Frey, M.; Fontecilla-Camps, J. C.; Fernandez, V. M. J. Am. Chem. Soc. 1997, 119, 7181–7189.
(27) Bleijlevens, B.; van Broekhuizen, F. A.; De Lacey, A. L.; Roseboom,W.; Fernandez, V. M.; Albracht, S. P. J. J. Biol. Inorg. Chem. 2004,9, 743–752.
(28) Brecht, M.; van Gastel, M.; Buhrke, T.; Friedrich, B.; Lubitz, W. J. Am.Chem. Soc. 2003, 125, 13075–13083.
(29) Foerster, S.; van Gastel, M.; Brecht, M.; Lubitz, W. J. Biol. Inorg.Chem. 2005, 10, 51–62.
(30) Medina, M.; Williams, R.; Cammack, R.; Hatchikian, E. C. J. Chem.Soc. Faraday Trans. 1994, 90, 2921–2924.
Figure 1. Model of the Hase I-cytb complex from A. aeolicus includingthe small and large subunit of the standard [NiFe] hydrogenase from D.Vulgaris Miyazaki F (pdb accession code 1WUJ) and the cytb subunit takenfrom Wolinella succinogenes (pdb 2BS2).16,17 (Right) Structure of the active[NiFe] site including the first coordination ligand sphere.3,18 The nickelbinds 4 cysteine sulfur ligands, two of them bridging to iron, and the ironadditionally coordinated by 2 CN- and 1 CO ligands. X denotes the putativethird bridging ligand (see text for details).
Scheme 1. Schematic Overview of the Redox Intermediates inOxygen Sensitive [NiFe] Hydrogenases Obtained from EPR andIR Spectroelectrochemistrya 15,19,32
a EPR active states are denoted in red and the EPR-silent states in blue.The midpoint potentials for the respective transitions are given for the sulfatereducing bacterium D. Vulgaris Miyazaki F at pH 7.4,34 except for the Ni-A/Ni-SU couple which is given at pH 8.2.35
6992 J. AM. CHEM. SOC. 9 VOL. 132, NO. 20, 2010
A R T I C L E S Pandelia et al.

can be observed depending on pH.27,32 All redox steps arecoupled to proton transfer events.27,32,33 Similar reactions occurupon interaction of the enzyme with molecular hydrogen. Thecatalytic cycle of these enzymes consists of the states Ni-SIa,Ni-C and Ni-R. In the case of Hase I from A. aeolicus, most ofthe intermediate states described above for the standard hydro-genases have not yet been identified.
Electrochemical approaches such as protein film electrochem-istry36,37 and electrochemistry in solution32,38 proved invaluablefor the characterization of redox enzymes. In particular, adsorptionof hydrogenases on an electrode that substitutes for their physi-ological redox partner provides a dynamic approach for studyinginherent catalytic properties, and delineates reactions both with thesubstrate and inhibitors.39-41 Furthermore, in situ electrochemistryintegrated with Fourier transform infrared (FTIR) spectroscopy hascontributed greatly to the characterization of all intermediate statesof the standard hydrogenases32 by relating redox changes in theactive site to detectable shifts of the infrared absorption bands,corresponding to the stretching vibrations of the CO, CN- ligandsof the iron.42,43 This also enables the determination of the numberof CN- and CO ligands at the metals. Some oxygen tolerantenzymes have been proposed to have more than three such ligandsbound to the [NiFe] site.44
For the A. aeolicus Hase I no FTIR data are available andthe vibrational frequencies of its redox states are unknown.Although there are some recent, still incomplete studies onoxygen-tolerant enzymes such as R. eutropha,9,45,46 for the A.aeolicus Hase I the exact intermediate states, the potentials ofthe related redox transitions and the activation/inactivationprocesses have not been elucidated. Thus, in the present study,we combine FTIR spectroscopy to define the structural andredox properties of the intermediates generated in solution, andprotein film electrochemistry to characterize the kinetics of(in)activation, either when the enzyme is transiently exposedto O2 or when its redox state responds to electrode potentialsteps. The results obtained are compared to those of other
hydrogenases (both standard and oxygen tolerant) in order togain insight into the function of the Hase I from A. aeolicusand to better understand the reasons this enzyme is so resistantto oxidative inactivation.
2. Experimental Procedures
2.1. Protein Purification. Isolation and purification of the HaseI from A. aeolicus separately or together with its native electronacceptor, a dihaem b-type cytochrome, was carried out as previouslydescribed13 in a 50 mM Tris-HCl buffer pH 7.0 in the presence of5 - 10% glycerol and 0.01% n-dodecyl-�-D-maltoside (DDM).
2.2. Electrochemical Measurements-Electrochemistry in-Solu-tion. Electrochemical measurements in solution were carried outin an Optically Transparent Thin Layer Electrochemical (OTTLE)cell designed by Moss et al.38,47 Twenty-five microliters of250 µM protein were placed on a 8.5 µm thick gold (Au) mini-grid (70% transparent to infrared), which serves as the workingelectrode. A platinum (Pt) foil is used as the counter and an Ag/AgCl (1 M KCl) as the reference electrode. The cell potential wasadjusted by an EG&G 283A potentiostat (Princeton AppliedResearch). Calibration of the reference electrode prior to and aftereach measurement was performed by monitoring the reduction ofmethyl viologen with cyclic voltammetry (-448 mV, pH 7.0). Thetemperature was regulated in the range 4 to 40 °C by passing waterthrough the metallic body of the cell in a closed external circuitwith a thermostat (LAUDA). For the pH dependent redox titrationsthe buffering solutions used (50 mM concentration) were: MES-NaOH (pH 6.4), HEPES-NaOH (pH 7.4) and Tricine-NaOH (pH8.4). In the case of the soluble form of Hase I (without cytb)titrations were carried out in the presence of redox mediating agents.The mediators added in the protein solution were: methyl viologen,benzyl viologen, neutral red, phenosafranine, anthraquinone-2-sulfonate, anthraquinone-1,5-disulfonate, 2-hydroxy-1,4-naphtho-quinone, potassium indigo tetrasulfonate, methylene blue, phenazinemethosulfate and naphthoquinone. Their redox potentials and pHdependence have been reported elsewhere.48,49 Their relativeconcentration with respect to the protein content was 1:3. Poten-tiometric titrations of the Hase I copurified with the cytb werecarried out in the absence of any electron-transfer reagents to avoidinhibition of the quinone binding site of cytb. In all solutions, KClwas added to a final concentration of 150 mM. Results with orwithout electron mediating agents in solution are similar, althoughlonger equilibration times are required in the absence of mediators.After each potential step, an equilibration time of 10-15 min wasallowed prior to recording the infrared spectra in the absence ofmediators, while in the presence of mediators the equilibration timewas shortened to 3 min. All potentials referred in the present workare quoted with respect to the standard hydrogen electrode potential(SHE).
2.3. Electrochemical Measurements-Protein Film Electrochem-istry (PFE). In protein film electrochemistry, electron transferbetween the electrode and the enzyme is direct, and the activity ismeasured as a current (positive ) oxidation, negative ) reduction)whose magnitude is proportional to the turnover rate.36,37,50 Thefact that the active site of the enzyme is buried in the protein doesnot preclude a fast electron transfer, provided it is “wired” to theelectrode by a chain of redox centers that permits fast intramolecularelectron exchange.51 In A. aeolicus Hase I, like in the prototypical
(31) Kellers, P.; Pandelia, M. E.; Currell, L. J.; Gorner, H.; Lubitz, W.Phys. Chem. Chem. Phys. 2009, 11, 8680–8683.
(32) De Lacey, A. L.; Fernandez, V. M.; Rousset, M.; Cammack, R. Chem.ReV. 2007, 107, 4304–4330.
(33) Leger, C.; Jones, A. K.; Roseboom, W.; Albracht, S. P. J.; Armstrong,F. A. Biochemistry 2002, 41, 15736–15746.
(34) Fichtner, C.; Laurich, C.; Bothe, E.; Lubitz, W. Biochemistry 2006,45, 9706–9716.
(35) Millo, D.; Pandelia, M. E.; Utesch, T.; Wisitruangsakul, N.; Mroginski,M. A.; Lubitz, W.; Hildebrandt, P.; Zebger, I. J. Phys. Chem. B 2009,113, 15344–15351.
(36) Vincent, K. A.; Parkin, A.; Armstrong, F. A. Chem. ReV. 2007, 107,4366–4413.
(37) Leger, C.; Bertrand, P. Chem. ReV. 2008, 108, 2379–2438.(38) Best, S. P. Coord. Chem. ReV. 2005, 249, 1536–1554.(39) Leger, C.; Dementin, S.; Bertrand, P.; Rousset, M.; Guigliarelli, B.
J. Am. Chem. Soc. 2004, 126, 12162–12172.(40) Jones, A. K.; Lamle, S. E.; Pershad, H. R.; Vincent, K. A.; Albracht,
S. P. J.; Armstrong, F. A. J. Am. Chem. Soc. 2003, 12, 8505–8514.(41) Vincent, K. A.; Parkin, A.; Lenz, O.; Albracht, S. P. J.; Fontecilla-
Camps, J. C.; Cammack, R.; Friedrich, B.; Armstrong, F. A. J. Am.Chem. Soc. 2005, 127, 18179–18189.
(42) Happe, R. P.; Roseboom, W.; Pierik, A. J.; Albracht, S. P. J.; Bagley,K. A. Nature 1997, 385, 126.
(43) Pierik, A. J.; Roseboom, W.; Happe, R. P.; Bagley, K. A.; Albracht,S. P. J. J. Biol. Chem. 1999, 274, 3331–3337.
(44) Happe, R. P.; Roseboom, W.; Egert, G.; Friedrich, C. G.; Massanz,C.; Friedrich, B.; Albracht, S. P. J. FEBS Lett. 2000, 466, 259–263.
(45) Saggu, M.; Zebger, I.; Ludwig, M.; Lenz, O.; Friedrich, B.; Hilde-brandt, P.; Lendzian, F. J. Biol. Chem. 2009, 284, 16264–16276.
(46) Burgdorf, T.; Loscher, S.; Liebisch, P.; van der Linden, E.; Galander,M.; Lendzian, F.; Meyer-Klaucke, W.; Albracht, S. P. J.; Friedrich,B.; Dau, H.; Haumann, M. J. Am. Chem. Soc. 2005, 127, 576–592.
(47) Moss, D. A.; Leonhard, M.; Bauscher, M.; Mantele, W. FEBS Lett.1991, 283, 33–36.
(48) Fultz, M. L.; Durst, R. A. Anal. Chim. Acta 1982, 140, 1–18.(49) Prince, R. C.; Linkletter, S. J. G.; Dutton, P. L. Biochim. Biophys.
Acta 1981, 635, 132–148.(50) Armstrong, F. A.; Belsey, N. A.; Cracknell, J. A.; Goldet, G.; Parkin,
A.; Reisner, E.; Vincent, K. A.; Wait, A. F. Chem. Soc. ReV. 2009,38, 36–51.
(51) Leger, C.; Lederer, F.; Guigliarelli, B.; Bertrand, P. J. Am. Chem.Soc. 2006, 128, 180–187.
J. AM. CHEM. SOC. 9 VOL. 132, NO. 20, 2010 6993
Hase I of the Hyperthermophilic Bacterium Aquifex aeolicus A R T I C L E S

[NiFe] enzymes from A. Vinosum and D. fructosoVorans, this chainconsists of iron-sulfur clusters ([FeS]3,52), one of which is exposedat the surface of the enzyme and can directly exchange electronseither with the electrode or the soluble redox partner. The exactamount of enzyme adsorbed onto the electrode is unknown, andtherefore the absolute value of the turnover rate cannot be deduced.However, provided that the electroactive coverage is constant, anyrelative change in the current can be interpreted to result from achange in activity. In many cases film desorption also contributesto the decrease in current over time.53 A. aeolicus Hase I, however,forms very stable films when adsorbed onto a rotating pyrolyticgraphite edge electrode (the typical time constant of the decay isabout one to two hours if the temperature remains below 45 °C).This makes data interpretation straightforward, as shown in the maintext.
Protein film electrochemistry experiments (cyclic voltammetryand chronoamperometry) were carried out in a glovebox filled withN2, using the electrochemical setup and equipment previouslydescribed.39 The two-compartment electrochemical cell was ther-mostatted at the desired temperature value using a water circulationsystem. The rotating pyrolytic graphite edge working electrode(PGE) (area A ≈ 3 mm2) was used in conjunction with an electroderotator, a platinum wire was used as a counter electrode, and asaturated calomel electrode (SCE), located in a side arm containing0.1 M NaCl and maintained at room temperature, was used as areference. All potentials are quoted versus the standard hydrogenelectrode (SHE), ESHE ) ESCE + 241 mV.
The electrochemical cell contained a buffer mixture of MES,CHES, TAPS, HEPES and sodium acetate (5 mM each) and0.1 M NaCl; the temperature (T) and pH are indicated in eachcaption. Hase I was adsorbed onto the pyrolytic graphite electrodeas previously described;39 protein films were prepared by paintingthe electrode with about half a microliter of a stock enzyme solution(∼5-10 µM of enzyme in the mixed buffer at pH 7). The enzyme-coated electrode was inserted in the electrochemical cell containingthe buffer mixture at pH 7, 40 °C, under an atmosphere of H2. Thelow potential poise that we use to activate standard hydrogenases39
made no difference in the intensity of the signal, consistent withthe earlier observation that the enzyme shows no lag in solutionassays of H2 oxidation.8
For determining the kinetics of O2 inhibition, we employedmethods we have previously developed to characterize oxygensensitive enzymes.39,54-56 The activity is measured at a fixedpotential, after small aliquots of a buffer, saturated with pure oxygenat room temperature and kept in a capped serum bottle, are injectedwith gastight syringes into the cell solution, which is continuouslyflushed with H2. For the experiments in Figure 7, where O2 is addedin the cell while the enzyme is oxidizing H2 under one atmosphereof H2, we injected a volume of 200 µL into a 3 mL buffer; thisleads to an instant decrease in H2 concentration of about 6%. Asthe Km of the enzyme for H2 is small, the dilution of H2 uponinjecting the oxygen-saturated solution does not significantly
decrease the turnover rate. This is demonstrated in Figure S1 ofthe Supporting Information, which shows that when 500 µL ofsolution saturated with N2 is injected in a 3 mL solution saturatedwith H2, the H2-oxidation catalytic current decreases by only 1.5%.The bimolecular rates of inhibition are converted to units ofs-1(atm(air))-1 considering that atmospheric air contains 21% O2.The concentrations of O2 were calculated using the Henry constants1.25 mM(atm(O2))-1.
The electrochemical data were analyzed with a program calledSOAS,57 which is available for download from the web: http://bip.cnrs-mrs.fr/bip06/.
2.4. Fourier Transform Infrared (FTIR) Spectroscopy. Infraredmeasurements were carried out on a Bruker IFS 66v/s FTIRspectrometer with 2 cm-1 resolution. The detector was a photo-voltaic mercury-cadmium-telluride (MCT) element (Kolmar Tech-nologies). The sample chamber was purged with N2 to avoidcontributions in the spectra from vapor absorption. The softwarefor data recording consisted of the OPUS package (Bruker Optics).Analysis and further processing was performed with MATLAB 6.5(Mathworks). For the potentiometric titrations the CO peak absorp-tion intensities at each potential value corresponding to all the redoxstates were added. The individual peak intensities of the respectivestates were further normalized by dividing by the sum of all peakintensities for that potential value. The sum of all the individualnormalized intensities equals to unity. For the titrations thesenormalized IR intensities of each redox intermediate have beenplotted as a function of the applied potential (vs SHE); seeSupporting Information for a detailed description. For the experi-ments at temperatures below 200 K, an Oxford InstrumentsOptistatCF cryostat with an ITC 503 temperature controller wasused. Illumination of the samples in the cryostat was performedby a slide projector (halogen lamp, 24 V, 250 W).
2.5. EPR Spectroscopy. EPR measurements were carried outwith a continuous wave (cw) E-300 X-band spectrometer (at ∼9.4GHz) equipped with a rectangular cavity (TE102) and an OxfordInstruments helium flow cryostat with an ITC 503 temperaturecontroller.
3. Results
The [NiFe] hydrogenase from the hyperthermophilic bacte-rium A. aeolicus has been obtained in two forms; as aheterodimeric enzyme consisting of the [NiFe] site and the iron-sulfur clusters (Hase I) and as a heterotrimer including ad-ditionally the dihaem b-type cytochrome subunit (Hase I-cytb).The protein film electrochemistry experiments were performedon the soluble Hase I, while the solution redox titrations werecarried out for both forms at 4, 25, and 40 °C. The spectro-electrochemical results were identical within error for alltemperatures, thus only the data at 25 °C are shown. Potentio-metric titrations of the Hase I-cytb complex were carried out inthe absence of any electron-transfer mediators to avoid interac-tion with the quinone binding site of cytb. All processes werereversible and independent of the addition of mediators.
3.1. FTIR-Electrochemistry in Solution. Infrared spectros-copy detects the absorbance corresponding to the vibrations ofthe diatomic ligands bound to the active site, which appear inthe spectra as bands at specific frequency positions. For theintrinsic ligands to Fe, bands in the region from 1970 to 1900cm-1 are associated with the CO stretching vibrations, whilebands between 2105 and 2040 cm-1 are related to the coupledCN- vibrations. These values are similar in enzymes derivedfrom different species.32 Transitions between the possible redoxintermediates are observed as shifts of these bands toward lower
(52) Dementin, S.; Belle, V.; Bertrand, P.; Guigliarelli, B.; Adryanczyk-Perrier, G.; De Lacey, A. L.; Fernandez, V. M.; Rousset, M.; Leger,C. J. Am. Chem. Soc. 2006, 128, 5209–5218.
(53) Fourmond, V.; Lautier, T.; Baffert, C.; Leroux, F.; Liebgott, P. P.;Dementin, S.; Rousset, M.; Arnoux, P.; Pignol, D.; Meynial-Salles,I.; Soucaille, P.; Bertrand, P.; Leger, C. Anal. Chem. 2009, 81, 2962–2968.
(54) Baffert, C.; Demuez, M.; Cournac, L.; Burlat, B.; Guigliarelli, B.;Bertrand, P.; Girbal, L.; Léger, C. Angew. Chem., Int. Ed. 2008, 47,2052–2054.
(55) Liebgott, P. P.; Leroux, F.; Burlat, B.; Dementin, S.; Baffert, C.;Lautier, T.; Fourmond, V.; Ceccaldi, P.; Cavazza, C.; Meynial-Salles,I.; Soucaille, P.; Fontecilla-Camps, J. C.; Guigliarelli, B.; Bertrand,P.; Rousset, M.; Léger, C. Nat. Chem. Biol. 2009, 6, 63–70.
(56) Leroux, F.; Dementin, S.; Burlat, B.; Cournac, L.; Volbeda, A.; Champ,S.; Martin, L.; Guigliarelli, B.; Bertrand, P.; Fontecilla-Camps, J. C.;Rousset, M.; Leger, C. Proc. Nat. Acad. Sci. U.S.A. 2008, 105, 11188–11193.
(57) Fourmond, V.; Hoke, K.; Heering, H. A.; Baffert, C.; Leroux, F.;Bertrand, P.; Leger, C. Bioelectrochem. 2009, 76, 141–147.
6994 J. AM. CHEM. SOC. 9 VOL. 132, NO. 20, 2010
A R T I C L E S Pandelia et al.

or higher frequencies, and are correlated with an increase or adecrease in the electron density at the Fe, respectively.58 Suchshifts result from changes in the coordination number of the Feion, in the hydrogen bonding of the CN- ligands with nearbyamino-acids, in the electronic state of the nickel and moregenerally in the electron delocalization at the [NiFe] site.59-61
Therefore, this set of three bands is characteristic for theelectronic and structural details of the active site and canaccurately describe each redox state.
3.1.1. Oxidized Inactive Enzyme.Ni-B. Figure 2a shows the FTIR spectrum of the as isolatedHase I-cytb complex from A. aeolicus at a resting potential of+224 mV at 25 °C and pH 7.4 in the absence of any redoxmediators. In this spectrum three main bands are observed; oneCO stretching vibration at 1939 cm-1 and two CN- vibrationsat 2081 and 2092 cm-1. This shows that the coordination ofthe active site with respect to standard hydrogenases is foundto be preserved and consistent with a Fe(CN)2CO moiety. Onthe basis of the EPR spectrum of the as-purified enzyme13 (alsocf Figure 3) and of previous studies on hydrogenases, this setof peaks corresponds to the Ni-B state23,32 (see Table 1 andSupporting Information). The related FTIR bands for an oxygen-sensitive (D. fructosoVorans)62 and an oxygen-tolerant (MBHR. eutropha)45 hydrogenase are included for comparison. A bandof low intensity at 2098 cm-1 and a shoulder at 2079 cm-1 are
also observed, but this is neither related to Ni-A nor to extraCN- ligands as will be discussed in the following. The absenceof Ni-A and the presence only of Ni-B in the FTIR (and EPR)13
is consistent with the observation (described below) that theenzyme is quickly activated and indicates an electronic con-figuration of the active center in this state that is similar to theoxygen-sensitive hydrogenases.
3.1.2. Enzyme Activation in the Electrochemical Cell.Ni-SIa. The enzyme could be fully activated in the electrochemi-cal cell at 25 °C by applying a potential of -326 mV for 20min. The protein was subsequently reoxidized at +100 mV.The obtained spectrum is identical to that of Figure 2a, whichexcludes that the low intensity band at 2098 cm-1 correspondsto any of the unready states (i.e., Ni-A, Ni-SU), since reoxidationin the electrochemical cell (anaerobic) leads only to the “ready”inactive state Ni-B.27,32 At a potential of -184 mV all the bandsshift toward lower frequencies (Figure 2b). The CO band appearsat 1927 cm-1 and the two coupled CN- shift to 2077 and 2087cm-1, respectively. Such shifts are consistent with a reductionof the Ni-B state to an EPR-silent (Ni2+, d8) species. Accordingto the mechanistic scheme of the standard hydrogenases, thisstate should correspond to (Ni-SIr)I. However, by taking intoaccount that the CN- stretching vibrations of a specific redoxstate are within 0-6 cm-1 similar to [NiFe] enzymes fromdifferent organisms, the CN- bands in Figure 2b resemble moreclosely those of the Ni-SIa
63,64 state and not those of (Ni-SIr)I
(see Table 1, Table S1, Supporting Information). This indicatesthat the latter does not accumulate sufficiently to be detected.(58) Bagley, K. A.; Duin, E. C.; Roseboom, W.; Albracht, S. P. J.;
Woodruff, W. H. Biochemistry 1995, 34, 5527–5535.(59) Lai, C. H.; Lee, W. Z.; Miller, M. L.; Reibenspies, J. H.; Darensbourg,
D. J.; Darensbourg, M. Y. J. Am. Chem. Soc. 1998, 120, 10103–10114.(60) De Lacey, A. L.; Santamaria, E.; Hatchikian, E. C.; Fernandez, V. M.
Biochim. Biophys. Acta, Protein Struct. Mol. Enzymol. 2000, 1481,371–380.
(61) Darensbourg, M. Y.; Lyon, E. J.; Smee, J. J. Coord. Chem. ReV. 2000,206, 533–561.
(62) De Lacey, A. L.; Stadler, C.; Fernandez, V. M.; Hatchikian, E. C.;Fan, H. J.; Li, S. H.; Hall, M. B. J. Biol. Inorg. Chem. 2002, 7, 318–326.
(63) The stretching vibrations corresponding to the Ni-SIa and the (Ni-SIr)II are reported to be identical within error.27 Thus, the loosely boundwater ligand in (Ni-SIr)II is suggested to affect the electronic densityonly slightly leading to shifts that are difficult to resolve in the FTIRspectra. At temperatures g25°C the loosely bound water ligand iseasily liberated leading to Ni-SIa within a fraction of a second, whichis the case in our experiments (25, 40 °C).
(64) Kurkin, S.; George, S. J.; Thorneley, R. N. F.; Albracht, S. P. J.Biochemistry 2004, 43, 6820–6831.
Figure 2. FTIR spectra of the Hase I-cytb complex from A. aeolicus at 25°C, pH 7.4. (a) the as-isolated enzyme at the resting potential of +224mV, (b) enzyme after full activation poised at -184 mV, (c) at -224 mV,(d) at -294 mV, (e) at -424 mV and (f) reoxidized at +24 mV. The proteinsolution did not contain any electron mediating reagents.
Figure 3. (a) EPR spectrum of the “as-isolated” Hase I from A. aeolicus,(b) EPR spectrum of the as-isolated Hase I after heating the enzyme at 343K (70 °C) for 15 min and then freezing it in a cold ethanol/liquid N2 bath.Both spectra were recorded at 70 K. (c) Low-temperature FTIR spectrum(at 70 K) of the “preheated” enzyme. Other experimental conditions: (EPR)microwave frequency 9.456 GHz, microwave power 10 mW, modulationamplitude 1 mT, (FTIR): resolution 2 cm-1, 2000 averages.
J. AM. CHEM. SOC. 9 VOL. 132, NO. 20, 2010 6995
Hase I of the Hyperthermophilic Bacterium Aquifex aeolicus A R T I C L E S

When the experiment was performed at 4 °C to decelerate theinactivation,27 no additional bands could be observed that couldbe associated with (Ni-SIr)I. At this temperature, the bands ofthe EPR-silent state assigned to the Ni-SIa, shifted by ap-proximately 1-2 wavenumbers. This small shift was reversibleat higher temperatures and it might correspond to the formationof the “inactive“(Ni-SIr)II, likely to occur under these conditions(4 °C). These shifts were more pronounced in samples reducedwith H2 and left at 4°C in the IR cell for several hours (> 4h)(Figure S2, Supporting Information).
Ni-C. Lowering the potential further to -224 mV led to theappearance of a redox intermediate with a CO vibration at 1949cm-1 and CN- bands very similar to those of the Ni-SIa state(Figure 2c, Table 1). This spectrum is consistent with theappearance of the catalytically active Ni-C state, which carriesa hydride ligand (H-)28 that can be photodissociated at tem-peratures lower than 170 K31,58 (Scheme 1). To confirm this,the Hase I-cytb complex was reduced with H2 and the samplewas subsequently examined using EPR and FTIR at cryogenictemperatures (100 K). A rhombic signal with g-values 2.21, 2.15,and 2.01 confirmed the presence of Ni-C, which upon illumina-tion converted to a light-induced form with g-values 2.28, 2.12,and 2.05 (Ni-L2 state). Illumination of the sample in the FTIRat the same temperature resulted in the disappearance of onlythe 1949 cm-1 CO band and its related CN- bands, demonstrat-ing that these can be uniquely assigned to the Ni-C state. In theFTIR titration, the amount of Ni-C is almost maximal at apotential of -294 mV and corresponded to 35-40% of theenzyme molecules (Figure 2d), as estimated from the integratedintensity of the CO band corresponding to this state.
Ni-R. Ni-C is formed in substoichiometric amounts andconverts at slightly more negative potentials to another state,characterized by one CO band at 1910 cm-1 and two CN-
stretching bands at 2047 and 2066 cm-1 (-424 mV, Figure 2e).This appears to be the most reduced state of the enzyme, as nofurther spectral changes take place by applying more negativepotentials. This intermediate is thus assigned to the Ni-R state(EPR-silent, Ni2+). On the basis of the stretching vibrations,the observed Ni-R in Hase I is not the typical form (Ni-R1)found in mesophilic hydrogenases32,45 at neutral pH (bothanaerobic and aerobic), but resembles more the so-called Ni-R2 state (Table S2, Supporting Information).
3.1.3. Reoxidation in the Electrochemical Cell. Reoxidation ofthe enzyme at +24 mV resulted in the infrared spectrum shownin Figure 2f, which again corresponds to the Ni-B state (Table1). The CN- band at 2098 cm-1 is also present, showing that itis related neither to the Ni-A nor to the Ni-SU states.Interestingly, at the same position relative to the high-frequencyCN- peak belonging to Ni-B, an additional band of similar smallintensity has also been observed in the case of the as-isolated/reoxidized membrane bound hydrogenase (MBH) from R.
eutropha.45 In the case of A. aeolicus the second CN- bandvibrationally coupled to the 2098 cm-1 band is most likelyobserved as a shoulder of the 2081 cm-1 peak at 2079 cm-1.The corresponding CO band is not resolved, presumably dueto an overlap with that of the Ni-B state. These additional FTIRspectroscopic features (Figures 2a, f) can therefore correspondto a slightly different conformation of another readily activatedoxidized state (Ni-X).
Electron paramagnetic resonance experiments have shownthat at such positive potentials an additional state is present(Figure 3, Figure S3, Supporting Information). This state isdifferent from Ni-A and could be identified by pulsed Q-bandEPR spectroscopy because it has different relaxation propertiescompared to Ni-B and the iron-sulfur clusters (Figure S4,Supporting Information). Further experiments were performedon frozen solutions of as-isolated enzyme preparations that wereincubated, prior to the measurements, for 15 min at 70 °C (closeto the enzyme’s physiological temperature). The resultingfindings are shown in Figure 3, in which the extra signals arenow absent from both the EPR and FTIR spectra. The additionalfeatures in the infrared measurements can be thus related to theparamagnetic state denoted Ni-X. The yield of the latter issubstoichiometric relative to Ni-B and varies between differentsamples (e.g., 16-30% of the paramagnetic states with the restof the molecules being in the Ni-B state). Further experimentsare needed to obtain a more detailed picture of the active siteconformation in this state.
3.1.4. Potentiometric Titration at pH 7.4 (Hase I-cytb). Figure4A shows the potentiometric titration for the Hase I-cytbcomplex at pH 7.4, in which the redox transitions betweendifferent states are monitored via changes in the infrared spectraas a function of the applied potential. FTIR spectra wererecorded with potential steps of 20 mV. The normalizedabsorption of all states was fitted as described in the SupportingInformation by assuming all transitions correspond to one-electron processes. Activation of the enzyme starting from theNi-B state resulted in Ni-SIa, without the (Ni-SIr)I state being adetectable intermediate. This redox transition corresponds to aone-electron process with an apparent midpoint potential of-105 mV. The Ni-SIa/Ni-C couple has a value of -295 mV,while the midpoint potential for the Ni-C/Ni-R couple wasestimated to be -300 mV. All processes were fully reversibleand the error in the value determination is (10 mV.
3.1.5. Potentiometric Titration at pH 7.4 (Hase I). The poten-tiometric titration corresponding to the Hase I without the cytbat pH 7.4 is presented in Figure 4B. Results were within erroridentical to those obtained for the Hase I-cytb enzyme (Table2). The only difference is related to the Ni-C intermediate. Ni-Cappears in the same potential range as in the case of Hase I-cytb;however it is of a significant lower yield. Such difference mayresult from the presence of mediators that were used for titrating
Table 1. Comparison of the Infrared Stretching Vibrations of the CO and CN- Diatomic Ligands of the [NiFe] Hydrogenases from A.aeolicus, D. fructosovorans and R. eutropha (MBH) at 25 °Ca
A. aeolicusb D. fructosovoransc R. eutropha (MBH)d
state vCO (cm-1) vCN-asym (cm-1) vCN-sym (cm-1) vCO (cm-1) vCN-asym (cm-1) vCN-sym (cm-1) vCO (cm-1) vCN-asym (cm-1) vCN-sym (cm-1)
Ni-B 1939 2081 2092 1946 2080 2091 1948 2081 2098Ni-SIa 1927 2077 2087 1933 2074 2087 1936 2075 2093Ni-C 1949 2078 2088 1951 2074 2086 1957 2075 2097Ni-R2 1910 2047 2066 1922 2051 2067 1921 2048 2064Ni-Xe - 2079 2098 nd nd nd 1943 2082 2104
a Error in the values is (1 cm-1. b Data from this work. c Data from ref 62. d Data from ref 45; nd stands for not determined. e Values assigned tothe unknown state Ni-X that is putatively assigned to a readily activated state, which is EPR-active (see text, Figure 3 and Supporting Information).
6996 J. AM. CHEM. SOC. 9 VOL. 132, NO. 20, 2010
A R T I C L E S Pandelia et al.

the Hase I alone (without the cytochrome b); it may also occurthat the presence of the cytochrome slightly stabilizes the Ni-Cstate, although the mechanism by which the active site couldsense the remote subunit remains to be determined.
3.1.6. Effect of pH on the Redox Processes. The potentiometrictitrations of the Hase I-cytb complex were carried out also forpH values 6.4 and 8.4, see Figures 4C and D, respectively. AtpH 6.4 the yield of the Ni-C state was increased, in agreementwith previous observations on standard hydrogenases.26,27
However, at a higher pH of 8.4, the Ni-C could not be detectedas an intermediate in the reduction from Ni-SIa to Ni-R, whichshows that in a more basic environment this state becomes lessstable. The reduction potentials for all intermediates were pH-dependent demonstrating that the redox processes are coupledto proton transfer (Table 2).
An additional result of these titrations was that only one Ni-Rstate can be observed. This finding was unexpected, since Ni-Rcommonly exists in more than one protonation state(s), depend-ing on pH.32 Such a situation does not apply for Ni-R in HaseI-cytb. At all three pH values examined, no additional bandsassociated with different forms of this most reduced state of
the enzyme were detected (Figure S5 in Supporting Informa-tion). Furthermore, the change in pH did not result in theappearance of additional signals that could be related to the (Ni-SIr)I state, as has been observed previously in standard hydro-genases. This is likely to result from differences in inherentthermodynamic properties that govern the reactivation of thecomplex, such as the pKa of the amino acid participating in thetransition from (Ni-SIr)I to (Ni-SIr)II/Ni-SIa in standard hydrog-enases.
The above IR electrochemical experiments yielded informa-tion on the detectable redox intermediates of Hase I, theirspectroscopic IR signatures as well as the midpoint potentialsof the transitions involved. In the next section, our study isextended by using protein film electrochemistry (PFE) with theaim to determine the catalytic properties of Hase I and to studythe reaction of the enzyme with O2.
3.2. Protein Film Electrochemistry. 3.2.1. Catalytic Activityof Hase I. Figure 5 shows a typical voltammetric signature ofA. aeolicus Hase I, from which several important properties ofthe enzyme can be derived73 and compared to those of other[NiFe] hydrogenases.41,65,66
Under oxidative conditions the enzyme reversibly inactivates;as the potential is scanned above 0 mV vs SHE the H2-oxidationcurrent decreases, while activity is recovered on the reverse scan.This anaerobic oxidative inactivation has been observed withall [NiFe] hydrogenases characterized to date; it correspondsto the reversible formation of the “ready” inactive state Ni-B.36
(65) Cracknell, J. A.; Wait, A. F.; Lenz, O.; Friedrich, B.; Armstrong, F. A.Proc. Nat. Acad. Sci. U.S.A. 2009, 106, 20681–20686.
(66) Lukey, M. J.; Parkin, A.; Roessler, M. M.; Murphy, B. J.; Harmer, J.;Palmer, T.; Sargent, F.; Armstrong, F. A. J. Biol. Chem. 2010, 285,3928–3938.
Figure 4. Potential dependent behavior of the redox intermediates of the Hase I from A. aeolicus at three different pH values, (A) 7.4 (with cytb), (B) 7.4(without cytb), (C) 6.4 (with cytb), and (D) 8.4 (with cytb). The temperature was 25 °C and redox mediators were present in solution only for the case ofHase I without the cytb. Note that the direction of the x axis from right to left goes from high to low potentials. Different x scales are used for different pHvalues.
Table 2. Midpoint Redox Potentials for the Intermediate RedoxStates of the Hase I-cytb from A. aeolicus at Different pH Valuesand Comparison with Those Measured for Hase I at pH 7.4a
pH Ni-B/Ni-SIa couple Ni-SIa/Ni-C couple Ni-C/Ni-R couple
Hase I-cytb6.4 -73 -264 -2707.4 -105 -295 -3008.4 -128 -340 -340
Hase I7.4 -105 -295 -297
a Potentials are quoted vs the standard hydrogen electrode potential(SHE). The error is (10 mV.
J. AM. CHEM. SOC. 9 VOL. 132, NO. 20, 2010 6997
Hase I of the Hyperthermophilic Bacterium Aquifex aeolicus A R T I C L E S

No reductive activity is observed at low potentials, demon-strating that the Hase I from A. aeolicus is a much more efficientcatalyst for H2 oxidation than H2 production. This agrees withthe previous observation that Hase I can reduce protons at lowpotentials and under N2 atmosphere,67 but only with a maximalrate that is much lower than the maximal rate of H2 oxidation.In this respect, A. aeolicus Hase I resembles the membranebound enzyme (MBH) from R. eutropha (Figure 2 in ref 68)and differs from the prototypical D. fructosoVorans enzyme,which shows significant H+ reduction activity (Figure 1 in ref39).
The vertical line at +77 mV in Figure 5 marks the value ofthe so-called “switch potential”, Esw, which represents the pointon the scan toward low potentials where the activity switchesback on. This parameter is a phenomenological marker ofoxygen tolerance, since the greater Esw, the easier the reductiveactivation of the enzyme. Indeed, the values of Esw in the caseof the A. aeolicus, R. eutropha68 and E. coli Hyd-166 enzymesare about 200 mV more positive than in oxygen-sensitivehydrogenases.40 For the A. Vinosum hydrogenase, there is a fairagreement between the value of Esw and the reduction potentialof the Ni-B species.40 This, however, is not the case for A.aeolicus Hase I: Esw (Figure 5) is about 180 mV above thereduction potential of Ni-B (Table 2).
Figure 6 shows the result of a chronoamperometric experi-ment aimed at studying the inhibition by O2. This consists ofinjecting into the electrochemical cell aliquots of solutionssaturated with O2 while the enzyme is oxidizing H2. Theresulting dilution of H2 is negligible (cf Methods and FigureS1, Supporting Information). The electrode potential is high inthis experiment, to avoid reduction of O2 on the electrode.39
We added successively in the electrochemical cell two aliquotsof O2 saturated buffer to achieve final concentrations of 75 and165 µM, respectively. After each injection, the oxygen con-centration initially increases (the mixing time is lower than 0.1s)and then exponentially decreases with a typical time constant
of about 15s (the exact value depended on the experimentalconditions, and was measured independently by monitoringdirect O2 reduction on a bare electrode poised at a low potentials,as described in ref 39). Figure 6 shows that after oxygen isinjected, the catalytic current resulting from hydrogen oxidationactivity quickly drops, but it is fully recovered after oxygenhas been flushed away. This agrees with a previous study, whereA. aeolicus Hase I was shown to retain an H2 oxidizing abilityeven after exposure to approximately 100 µM O2 at 60 °C.67
The results presented in Figure 6 for A. aeolicus are similarto those reported for the oxygen-tolerant MBH enzyme fromR. eutropha.69 In contrast, standard hydrogenases are irreversiblyinactivated by O2 under such oxidizing conditions, and theiractivity is recovered only after reduction.21,39
3.2.2. Kinetics of (In)Activation; Reaction with O2 andAnaerobic Oxidation. The nature of the inactive state formedunder oxidizing conditions was further investigated, either whenthe electrode is poised at a high potential or upon exposure tooxygen. Figure 7A shows six chronoamperograms, recorded inexperiments during which the enzyme was first oxidized underanaerobic conditions by stepping the electrode potential up (att ) 0 s) and then further inhibited by injecting an aliquot ofsolution saturated with O2 in the electrochemical cell (at t )1000 s). These chronoamperograms were successively recordedwith the same enzyme film, after a short reactivation period atE ≈ -400 mV (open circuit) preceding each potential step. Nocontribution from the capacitive current is seen in Figure 7Abecause the current was monitored after a 20 s equilibrationperiod. Also, the contribution from the direct reduction ofoxygen is negligible in the potential range used here.
We first focus on the first half (t < 1000 s) of eachchronoamperogram (anaerobic inactivation). The dashed lineoverlaying the first part of the red chronoamperogram in themain panel of Figure 7A is an example of the perfect fit ofeach signal to:
The activity decreases exponentially toward a current i∞ withan apparent time constant 1/k inact
app . The value of i∞ depends on(67) Luo, X. J.; Brugna, M.; Tron-Infossi, P.; Giudici-Orticoni, M. T.;
Lojou, E. J. Biol. Inorg. Chem. 2009, 14, 1275–1288.(68) Goldet, G.; Wait, A. F.; Cracknell, J. A.; Vincent, K. A.; Ludwig,
M.; Lenz, O.; Friedrich, B.; Armstrong, F. A. J. Am. Chem. Soc. 2008,130, 11106–11113.
(69) Vincent, K. A.; Cracknell, J. A.; Lenz, O.; Zebger, I.; Friedrich, B.;Armstrong, F. A. Proc. Nat. Acad. Sci. U.S.A. 2005, 102, 16951–16954.
Figure 5. Cyclic voltammogram showing the anaerobic oxidative inactiva-tion and reductive activation of A. aeolicus Hase I adsorbed on a rotatingdisk graphite electrode. Arrows mark the direction of the scan. The hydrogenoxidation activity decreases above E ) 20 mV, when the potential is beingswept upward, and it is recovered on the reverse scan. The reductionpotential of the hydrogen couple E0(H+/H2) is marked by a green verticalline. The parameter Esw (switch potential) denotes the position of the firstinflection point of the scan toward low potentials. Experimental conditions:pH 7, T ) 40 °C, 1 bar H2. The enzyme-coated electrode was rotated at ahigh rate (ω ) 4 krpm) to avoid any limitation from mass transport of H2,and the electrode potential was swept slowly (V ) 0.3 mV/s).
Figure 6. Change in hydrogen oxidation activity (current i) of the A.aeolicus Hase I, measured at E ) +210 mV after addition of two oxygen-saturated buffer aliquots into the electrochemical cell solution. The finalconcentrations were 75 and 165 µM, respectively, before O2 was flushedaway from the solution by a stream of hydrogen. The potential was steppedfrom the open-circuit potential (OCP) to +210 mV and held for 650 s priorto recording the signal shown here, during which the activity decreases byabout 70% (consistent with the observations in Figure 7, see below).Experimental conditions: pH 7, T ) 40 °C, 1 bar H2.
i ) (i0 - i∞) exp(-kinactapp t) + i∞ (1)
6998 J. AM. CHEM. SOC. 9 VOL. 132, NO. 20, 2010
A R T I C L E S Pandelia et al.

potential; this reveals that an equilibrium is reached betweenthe active and the anaerobically inactive enzyme.
The enzyme activates or inactivates depending on theelectrode potential (E) because ki and/or ka depend on E. Whenequilibrium is reached, the fraction of the enzyme in the activestate equals ka/(ki + ka) and the relaxation rate is then given by
It is important to realize that the apparent rate constant ofthe exponential relaxation, at t < 1000 s in Figure 7, is equal toki + ka and not to ki, a point which has been previouslyoverlooked. Therefore, to avoid any ambiguity, we use theadjective “true” (as opposed to “apparent”) to denote the(in)activation rate constants ki and ka. By fitting the anaerobicparts of the data (Figure 7A) to eq 1, we found that as theelectrode potential increases from 15 to 140 mV the value ofk inact
app decreases from 0.02 s-1 to about 0.004 s-1.At t ) 1000 s (second part of the chronoamperograms),
aliquots of O2-saturated buffer were injected into the electro-chemical cell solution to reach a final concentration of 78 µM.Anaerobicity was recovered with a characteristic time τO2 ≈15 s by flushing H2 in the electrochemical cell.39 Figure 7A
shows that after exposure to O2, recovery of the activity iscomplete within 100-1000 s depending on potential. Thus, therelaxation rate of the current is not limited by O2 release fromthe buffer. Moreover, as the electrode potential decreases thereactivation rate increases (as observed with the MBH enzymefrom R. eutropha69), suggesting that the latter is conditionedby a redox process.
The apparent reactivation rate constants k reactapp were measured
by fitting the data to exponential functions (see e.g. the dashedline over second half of the red chronoamperogram in Figure7A), and in Figure 7B 1/k react
app was plotted as a function of 1/k inactapp .
The key observation here is that all the data points fall on theline y ) x. This shows that, at every potential, the rate at whichactivity is recovered after exposure to oxygen is the same asthe apparent rate at which the enzyme is anaerobically inacti-vated. The fact that the relaxation after exposure to O2 iscomplete and follows first order kinetics strongly suggests thata single inactive species has been formed upon exposure to O2.When anaerobic conditions are restored, the equilibrium betweenactive and inactive states relaxes at the same rate (ki + ka) as itdoes under oxidizing conditions in the absence of oxygen.Therefore, these two relaxation rates reveal the same equilibra-tion process. We conclude that the mere effect of adding oxygenis to force the formation of the “anaerobic” inactive state (i.e.,Ni-B), consistent with the finding of Armstrong and co-workersin ref 65. This contrasts with the observation that standardhydrogenases are oxidized to the Ni-B state under anaerobicconditions,40 and to a mixture of Ni-A and Ni-B states underaerobic conditions.39,21
3.2.3. Kinetics of Reaction with O2. The complete chrono-amperograms in Figure 7A could be fitted by assuming that:(i) the active state is formed from the inactive state with a firstorder rate ka, (ii) the potential-dependent pseudo first order ratefor the formation of the inactive state equates ki before theinjection of O2 and (iii) ki + kO2[O2] after the injection of O2,
where kO2[O2] ) kO2[O2]0 · exp(-t/τO2); kO2 denotes the bimo-lecular rate constant for the formation of the inactive form uponreaction with O2 and τO2 is the relaxation time constant of theO2-concentration in the electrochemical cell. Therefore, eq 2applies at t < 1000 s, while at t > 1000 s it is replaced with
The term “kO2[O2]” is responsible for the fast inhibition that
follows the injection, and this rate of anaerobic inhibition decaysexponentially as O2 is flushed away by the stream of H2. Theprotein films being very stable, there was no need to correctthe data for film desorption.
The best fits of the chronoamperograms, shown with dottedlines in the inset of Figure 7A, were obtained by adjusting foreach experiment the values of ki, ka, the current at time zero,kO2
and τO2. The first part of the experiment (before oxygen is
added) leads to an unambiguous determination of ki, ka and theinitial current. The second part of the data defines τO2 (we foundthat it ranges from 13 to 15 s), and kO2 (the values of which areplotted in Figure 7C as a function of electrode potential). Thevery good agreement between the data and the model supportsthe hypothesis of bimolecular inhibition kinetics. This is inagreement with previous studies on standard hydrogenases forwhich the irreversible reaction with O2 is also first order in[O2].
39 We note that A. aeolicus Hase I reacts about ten times
Figure 7. Anaerobic/aerobic inactivation and reactivation of A. aeolicusHase I. (A) Chronoamperograms for the enzyme adsorbed on a graphiteelectrode and poised at various potentials. From t ) 0 to t ) 1000 s, thecurrent decreases as a consequence of anaerobic inactivation. At t ) 1000 s,an aliquot of O2-saturated buffer is injected in the cell (final concentration78 µM), and the recovery of activity is monitored. The dashed linesoverlaying the red data are fits to exponential functions. In the inset, thedotted lines are the best fits of the data using eqs 2 and 4 (see text). (B)Time constant of the reactivation after exposure to O2 plotted against thetime constant of anaerobic inactivation; both were measured from fittingthe relaxations to exponential functions (i.e., dashed lines overlaying thered chronoamperogram in A). (C) Bimolecular rate constant of aerobicinactivation as a function of electrode potential. Experimental conditions:pH 7, T ) 40 °C, 1 bar H2.
active y\zki
ka
inactive(anaerobic) (2)
kinactapp ) ki + ka (3)
active y\zki + kO2[O2]0exp (-t/τO2)
ka
inactive(anaerobic) (4)
J. AM. CHEM. SOC. 9 VOL. 132, NO. 20, 2010 6999
Hase I of the Hyperthermophilic Bacterium Aquifex aeolicus A R T I C L E S

more slowly with O2 than the standard hydrogenase from D.fructosoVorans.70
Figure 7C shows that the rate of reaction of aerobic inhibitionof A. aeolicus Hase exhibits a weak dependence on electrodepotential, as noted previously for the enzyme from R. eutropha.69
This is unlike the case of the D. fructosoVorans enzyme, whoserate of reaction with O2 is potential-independent in the range50-500 mV (Figure 9 in ref 39).
3.2.4. Anaerobic (In)Activation of Hase I. Figure 8 shows theapparent rates of (in)activation for the A. aeolicus Hase I (filledsquares). These were determined by fitting the exponentialrelaxations of the current recorded after stepping up or downthe electrode potential (to force an oxidative inactivation orreactivation, respectively). This relation between rates anddriving force can yield valuable information on the (in)activationmechanism, as shown for the oxygen-sensitive hydrogenasefrom A. Vinosum.40
For comparison, Figure 8 shows also the dependence on thepotential of the apparent rates of (in)activation obtained withA. Vinosum hydrogenase, plotted as blue, empty symbols,replotted from the data in ref 40, and fitted to straight lines.These apparent rates were measured by fitting current transientsto exponential functions, and interpreted as the true constantski and ka, respectively (see eqs 2 and 3). In this case, this wasa good approximation because these rates were determined underconditions where the relaxation is essentially irreversible (eitherat high potential, where ki . ka and therefore kapp ≈ ki, or atlow potential where ka . ki and kapp ≈ ka). The rate of reductiveactivation for the A. Vinosum enzyme is potential dependent;whereas the rate of inactivation is not.
For the A. aeolicus Hase I, the apparent rate of interconversionbetween active and inactive states also increases exponentiallyas the potential is lowered (because ka increases and ki isconstant). At high potentials, the apparent rate of oxidativeinactivation becomes constant as ka becomes lower than ki.Clearly, the dependence of the (in)activation rate constants onpotential is the same for A. aeolicus and A. Vinosum, whichstrongly suggests that in both enzymes the mechanism offormation of Ni-B is similar.73
In the same figure the effect of the H2 concentration on therates of (in)activation is also illustrated. A comparison between
data obtained with A. aeolicus Hase I at pH 7 under 1 bar H2
(black) and 0.1 bar H2 (red), respectively, demonstrates that thetrue rate of inactivation (ki) decreases when the concentrationof H2 increases. Therefore, H2 protects the A. aeolicus Hase Iagainst anaerobic oxidation, like it does in the case of thestandard hydrogenases from A. Vinosum40 and D. gigas.37
4. Discussion
The Hase I from A. aeolicus is an exceptional enzyme thatexhibits thermostability and high oxygen-resistance. It is thuscompelling to elucidate the mechanism associated with thefunction of this enzyme and to identify what determines itsintriguing properties.
4.1. Active Site Coordination. In this study we have presentedthe first comprehensive FTIR investigation of a [NiFe] hydro-genase from a hyperthermophilic, oxygen-tolerant bacterium,namely A. aeolicus. The active site of this enzyme is found toretain the iron coordination of one carbonyl and two cyanideligands typical for standard hydrogenases. This agrees withrecent observations on the oxygen-tolerant MBH from R.eutropha,45 but not with those on the soluble NAD+-reducinghydrogenase (SH) from the same organism, in which additionalCN- ligands were proposed to coordinate both nickel andiron.44,71 Clearly, the oxygen tolerance of A. aeolicus Hase I isnot related to the presence of additional diatomic ligands in itsactive site.
4.2. Spectroscopic Signatures of the Inactive OxidizedEnzyme; the “Ready” Ni-B State. The FTIR spectrum of the as-isolated Hase I showed absorption bands of an oxidized state, whichon the basis of concomitant EPR studies (Figure 3) can be assignedto Ni-B (see also ref 13). The Ni-A state observed in all oxygen-sensitive hydrogenases is absent in A. aeolicus. The g-valuescorresponding to the Ni-B state are slightly different from thoseof standard hydrogenases23 with the largest deviation beingobserved for the gx component (Table S1). The IR stretchingvibrations of the CN- ligands are very similar while those of COshow small but more pronounced deviations from those of Ni-Bpresent in oxygen-sensitive hydrogenases (Table 1 and S2, Sup-porting Information). This is as anticipated, since CO is moresensitive to electronic changes than the cyanide ligands, which arein addition hydrogen-bonded to neighboring amino acid residues.60
Furthermore, a sequence comparison showed a difference in theamino acid residues in the vicinity of the CO ligand (e.g., Ser67,Ile68 in A. aeolicus that correspond to Tyr70 and Val71 in thestandard hydrogenase from D. fructosoVorans) that is also expectedto contribute to these small deviations in the CO stretchingvibrations. These data indicate that the structure of the active sitesis rather similar in both types of hydrogenases. X-ray crystal-lographic and EPR/ENDOR22 studies on the D. Vulgaris MiyazakiF hydrogenase have detected a hydroxide ligand bridging the twometal ions in this state, rendering it inactive. It is proposed thatsuch an oxygenic species coordinates also the [NiFe] site in A.aeolicus Hase I, suggesting that the latter has the affinity of bindingan oxygen-based ligand. Ni-B represents an inhibited form that is,however, quickly activated.
4.3. Inactive Oxidized Enzyme; Aerobic and AnaerobicInactivation. The protein film electrochemistry (PFE) experi-ments in Figure 7 demonstrate that the same inactive product
(70) Two to 4 s-1(atm(O2))-1 at 40 °C, pH 7, versus 40 s-1(atm(O2))-1 inref 39.
(71) van der Linden, E.; Burgdorf, T.; Bernhard, M.; Bleijlevens, B.;Friedrich, B.; Albracht, S. P. J. J. Biol. Inorg. Chem. 2004, 9, 616–626.
Figure 8. Dependence of the apparent rates of anaerobic inactivation andreactivation on electrode potential, determined by chronoamperometryexperiments with A. aeolicus Hase I (filled symbols, this work) and A.Vinosum hydrogenases (open symbols).40 For A. Vinosum, the rates ofanaerobic (in)activation (open triangles) were obtained from data availablein the literature40 and the experimental conditions were pH 8.8, 45 °C. Thedashed lines indicate the dependence on potential of the true rate constantski and ka; only their sum can be determined by fitting the relaxation of thecurrent after a potential step (see text). For A. aeolicus Hase I, the blackand red squares represent experiments carried out under 1 and 0.1 bar H2,respectively, at pH 7, 40 °C. Note the logarithmic y scale.
7000 J. AM. CHEM. SOC. 9 VOL. 132, NO. 20, 2010
A R T I C L E S Pandelia et al.
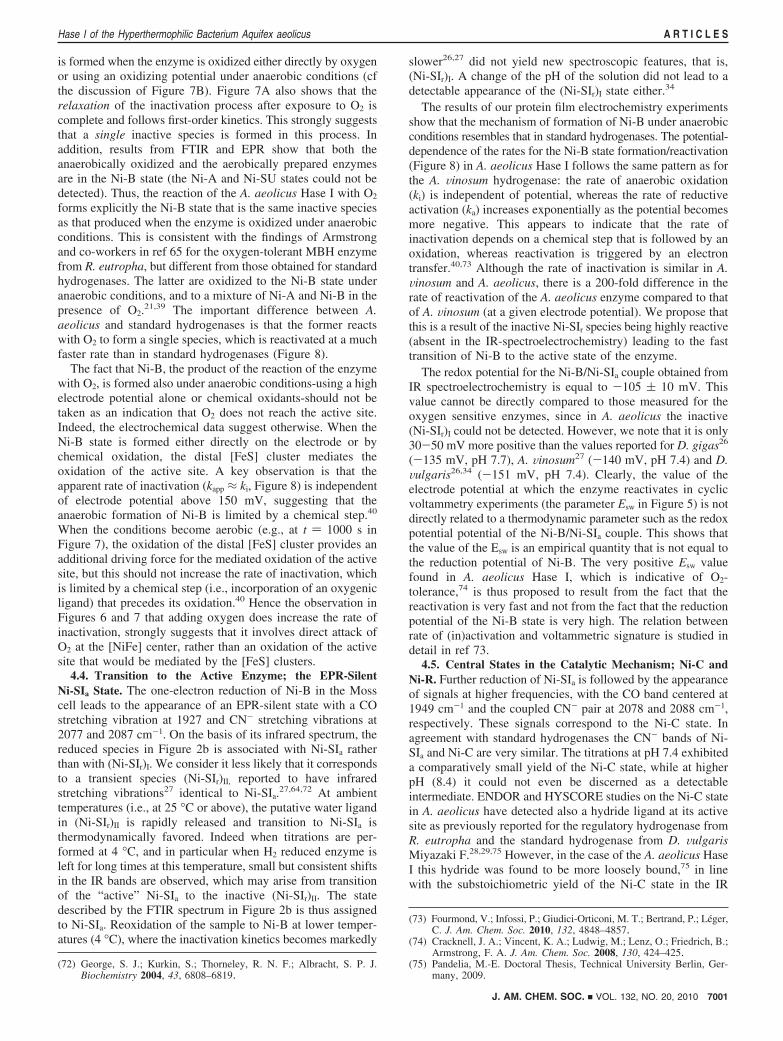
is formed when the enzyme is oxidized either directly by oxygenor using an oxidizing potential under anaerobic conditions (cfthe discussion of Figure 7B). Figure 7A also shows that therelaxation of the inactivation process after exposure to O2 iscomplete and follows first-order kinetics. This strongly suggeststhat a single inactive species is formed in this process. Inaddition, results from FTIR and EPR show that both theanaerobically oxidized and the aerobically prepared enzymesare in the Ni-B state (the Ni-A and Ni-SU states could not bedetected). Thus, the reaction of the A. aeolicus Hase I with O2
forms explicitly the Ni-B state that is the same inactive speciesas that produced when the enzyme is oxidized under anaerobicconditions. This is consistent with the findings of Armstrongand co-workers in ref 65 for the oxygen-tolerant MBH enzymefrom R. eutropha, but different from those obtained for standardhydrogenases. The latter are oxidized to the Ni-B state underanaerobic conditions, and to a mixture of Ni-A and Ni-B in thepresence of O2.
21,39 The important difference between A.aeolicus and standard hydrogenases is that the former reactswith O2 to form a single species, which is reactivated at a muchfaster rate than in standard hydrogenases (Figure 8).
The fact that Ni-B, the product of the reaction of the enzymewith O2, is formed also under anaerobic conditions-using a highelectrode potential alone or chemical oxidants-should not betaken as an indication that O2 does not reach the active site.Indeed, the electrochemical data suggest otherwise. When theNi-B state is formed either directly on the electrode or bychemical oxidation, the distal [FeS] cluster mediates theoxidation of the active site. A key observation is that theapparent rate of inactivation (kapp ≈ ki, Figure 8) is independentof electrode potential above 150 mV, suggesting that theanaerobic formation of Ni-B is limited by a chemical step.40
When the conditions become aerobic (e.g., at t ) 1000 s inFigure 7), the oxidation of the distal [FeS] cluster provides anadditional driving force for the mediated oxidation of the activesite, but this should not increase the rate of inactivation, whichis limited by a chemical step (i.e., incorporation of an oxygenicligand) that precedes its oxidation.40 Hence the observation inFigures 6 and 7 that adding oxygen does increase the rate ofinactivation, strongly suggests that it involves direct attack ofO2 at the [NiFe] center, rather than an oxidation of the activesite that would be mediated by the [FeS] clusters.
4.4. Transition to the Active Enzyme; the EPR-SilentNi-SIa State. The one-electron reduction of Ni-B in the Mosscell leads to the appearance of an EPR-silent state with a COstretching vibration at 1927 and CN- stretching vibrations at2077 and 2087 cm-1. On the basis of its infrared spectrum, thereduced species in Figure 2b is associated with Ni-SIa ratherthan with (Ni-SIr)I. We consider it less likely that it correspondsto a transient species (Ni-SIr)II, reported to have infraredstretching vibrations27 identical to Ni-SIa.
27,64,72 At ambienttemperatures (i.e., at 25 °C or above), the putative water ligandin (Ni-SIr)II is rapidly released and transition to Ni-SIa isthermodynamically favored. Indeed when titrations are per-formed at 4 °C, and in particular when H2 reduced enzyme isleft for long times at this temperature, small but consistent shiftsin the IR bands are observed, which may arise from transitionof the “active” Ni-SIa to the inactive (Ni-SIr)II. The statedescribed by the FTIR spectrum in Figure 2b is thus assignedto Ni-SIa. Reoxidation of the sample to Ni-B at lower temper-atures (4 °C), where the inactivation kinetics becomes markedly
slower26,27 did not yield new spectroscopic features, that is,(Ni-SIr)I. A change of the pH of the solution did not lead to adetectable appearance of the (Ni-SIr)I state either.34
The results of our protein film electrochemistry experimentsshow that the mechanism of formation of Ni-B under anaerobicconditions resembles that in standard hydrogenases. The potential-dependence of the rates for the Ni-B state formation/reactivation(Figure 8) in A. aeolicus Hase I follows the same pattern as forthe A. Vinosum hydrogenase: the rate of anaerobic oxidation(ki) is independent of potential, whereas the rate of reductiveactivation (ka) increases exponentially as the potential becomesmore negative. This appears to indicate that the rate ofinactivation depends on a chemical step that is followed by anoxidation, whereas reactivation is triggered by an electrontransfer.40,73 Although the rate of inactivation is similar in A.Vinosum and A. aeolicus, there is a 200-fold difference in therate of reactivation of the A. aeolicus enzyme compared to thatof A. Vinosum (at a given electrode potential). We propose thatthis is a result of the inactive Ni-SIr species being highly reactive(absent in the IR-spectroelectrochemistry) leading to the fasttransition of Ni-B to the active state of the enzyme.
The redox potential for the Ni-B/Ni-SIa couple obtained fromIR spectroelectrochemistry is equal to -105 ( 10 mV. Thisvalue cannot be directly compared to those measured for theoxygen sensitive enzymes, since in A. aeolicus the inactive(Ni-SIr)I could not be detected. However, we note that it is only30-50 mV more positive than the values reported for D. gigas26
(-135 mV, pH 7.7), A. Vinosum27 (-140 mV, pH 7.4) and D.Vulgaris26,34 (-151 mV, pH 7.4). Clearly, the value of theelectrode potential at which the enzyme reactivates in cyclicvoltammetry experiments (the parameter Esw in Figure 5) is notdirectly related to a thermodynamic parameter such as the redoxpotential potential of the Ni-B/Ni-SIa couple. This shows thatthe value of the Esw is an empirical quantity that is not equal tothe reduction potential of Ni-B. The very positive Esw valuefound in A. aeolicus Hase I, which is indicative of O2-tolerance,74 is thus proposed to result from the fact that thereactivation is very fast and not from the fact that the reductionpotential of the Ni-B state is very high. The relation betweenrate of (in)activation and voltammetric signature is studied indetail in ref 73.
4.5. Central States in the Catalytic Mechanism; Ni-C andNi-R. Further reduction of Ni-SIa is followed by the appearanceof signals at higher frequencies, with the CO band centered at1949 cm-1 and the coupled CN- pair at 2078 and 2088 cm-1,respectively. These signals correspond to the Ni-C state. Inagreement with standard hydrogenases the CN- bands of Ni-SIa and Ni-C are very similar. The titrations at pH 7.4 exhibiteda comparatively small yield of the Ni-C state, while at higherpH (8.4) it could not even be discerned as a detectableintermediate. ENDOR and HYSCORE studies on the Ni-C statein A. aeolicus have detected also a hydride ligand at its activesite as previously reported for the regulatory hydrogenase fromR. eutropha and the standard hydrogenase from D. VulgarisMiyazaki F.28,29,75 However, in the case of the A. aeolicus HaseI this hydride was found to be more loosely bound,75 in linewith the substoichiometric yield of the Ni-C state in the IR
(72) George, S. J.; Kurkin, S.; Thorneley, R. N. F.; Albracht, S. P. J.Biochemistry 2004, 43, 6808–6819.
(73) Fourmond, V.; Infossi, P.; Giudici-Orticoni, M. T.; Bertrand, P.; Léger,C. J. Am. Chem. Soc. 2010, 132, 4848–4857.
(74) Cracknell, J. A.; Vincent, K. A.; Ludwig, M.; Lenz, O.; Friedrich, B.;Armstrong, F. A. J. Am. Chem. Soc. 2008, 130, 424–425.
(75) Pandelia, M.-E. Doctoral Thesis, Technical University Berlin, Ger-many, 2009.
J. AM. CHEM. SOC. 9 VOL. 132, NO. 20, 2010 7001
Hase I of the Hyperthermophilic Bacterium Aquifex aeolicus A R T I C L E S
titrations and its complete absence at pH 8.4, which indicatesan increased instability of the hydride complex under morealkaline conditions.
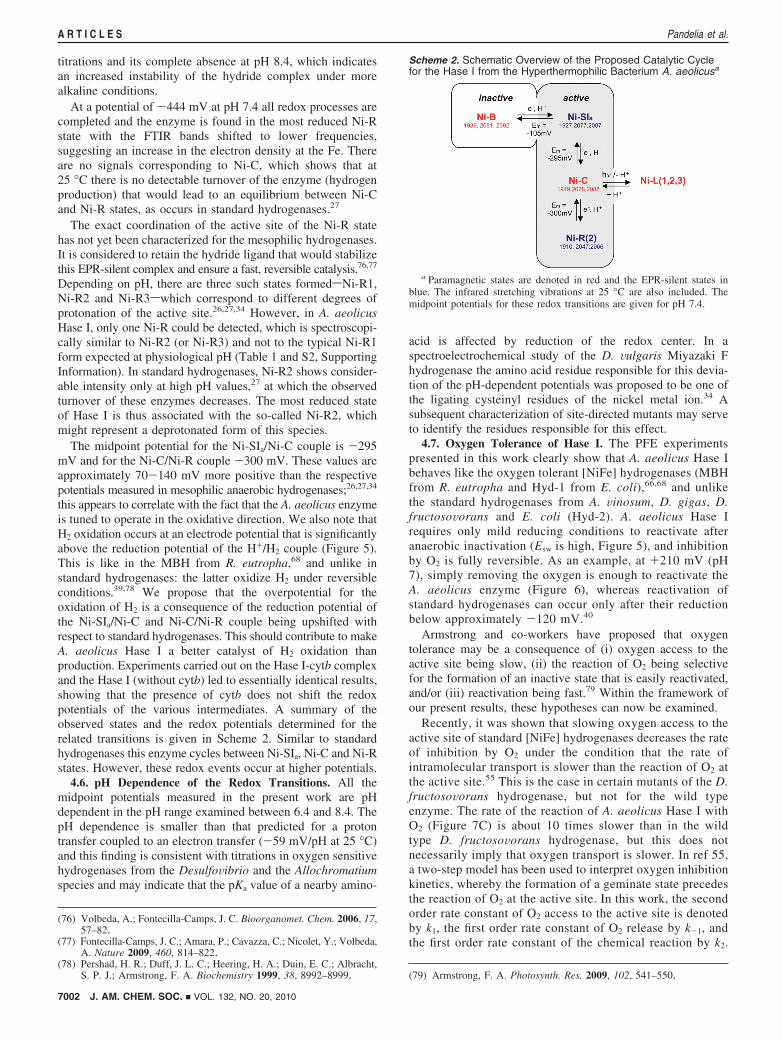
At a potential of -444 mV at pH 7.4 all redox processes arecompleted and the enzyme is found in the most reduced Ni-Rstate with the FTIR bands shifted to lower frequencies,suggesting an increase in the electron density at the Fe. Thereare no signals corresponding to Ni-C, which shows that at25 °C there is no detectable turnover of the enzyme (hydrogenproduction) that would lead to an equilibrium between Ni-Cand Ni-R states, as occurs in standard hydrogenases.27
The exact coordination of the active site of the Ni-R statehas not yet been characterized for the mesophilic hydrogenases.It is considered to retain the hydride ligand that would stabilizethis EPR-silent complex and ensure a fast, reversible catalysis.76,77
Depending on pH, there are three such states formedsNi-R1,Ni-R2 and Ni-R3swhich correspond to different degrees ofprotonation of the active site.26,27,34 However, in A. aeolicusHase I, only one Ni-R could be detected, which is spectroscopi-cally similar to Ni-R2 (or Ni-R3) and not to the typical Ni-R1form expected at physiological pH (Table 1 and S2, SupportingInformation). In standard hydrogenases, Ni-R2 shows consider-able intensity only at high pH values,27 at which the observedturnover of these enzymes decreases. The most reduced stateof Hase I is thus associated with the so-called Ni-R2, whichmight represent a deprotonated form of this species.
The midpoint potential for the Ni-SIa/Ni-C couple is -295mV and for the Ni-C/Ni-R couple -300 mV. These values areapproximately 70-140 mV more positive than the respectivepotentials measured in mesophilic anaerobic hydrogenases;26,27,34
this appears to correlate with the fact that the A. aeolicus enzymeis tuned to operate in the oxidative direction. We also note thatH2 oxidation occurs at an electrode potential that is significantlyabove the reduction potential of the H+/H2 couple (Figure 5).This is like in the MBH from R. eutropha,68 and unlike instandard hydrogenases: the latter oxidize H2 under reversibleconditions.39,78 We propose that the overpotential for theoxidation of H2 is a consequence of the reduction potential ofthe Ni-SIa/Ni-C and Ni-C/Ni-R couple being upshifted withrespect to standard hydrogenases. This should contribute to makeA. aeolicus Hase I a better catalyst of H2 oxidation thanproduction. Experiments carried out on the Hase I-cytb complexand the Hase I (without cytb) led to essentially identical results,showing that the presence of cytb does not shift the redoxpotentials of the various intermediates. A summary of theobserved states and the redox potentials determined for therelated transitions is given in Scheme 2. Similar to standardhydrogenases this enzyme cycles between Ni-SIa, Ni-C and Ni-Rstates. However, these redox events occur at higher potentials.
4.6. pH Dependence of the Redox Transitions. All themidpoint potentials measured in the present work are pHdependent in the pH range examined between 6.4 and 8.4. ThepH dependence is smaller than that predicted for a protontransfer coupled to an electron transfer (-59 mV/pH at 25 °C)and this finding is consistent with titrations in oxygen sensitivehydrogenases from the DesulfoVibrio and the Allochromatiumspecies and may indicate that the pKa value of a nearby amino-
acid is affected by reduction of the redox center. In aspectroelectrochemical study of the D. Vulgaris Miyazaki Fhydrogenase the amino acid residue responsible for this devia-tion of the pH-dependent potentials was proposed to be one ofthe ligating cysteinyl residues of the nickel metal ion.34 Asubsequent characterization of site-directed mutants may serveto identify the residues responsible for this effect.
4.7. Oxygen Tolerance of Hase I. The PFE experimentspresented in this work clearly show that A. aeolicus Hase Ibehaves like the oxygen tolerant [NiFe] hydrogenases (MBHfrom R. eutropha and Hyd-1 from E. coli),66,68 and unlikethe standard hydrogenases from A. Vinosum, D. gigas, D.fructosoVorans and E. coli (Hyd-2). A. aeolicus Hase Irequires only mild reducing conditions to reactivate afteranaerobic inactivation (Esw is high, Figure 5), and inhibitionby O2 is fully reversible. As an example, at +210 mV (pH7), simply removing the oxygen is enough to reactivate theA. aeolicus enzyme (Figure 6), whereas reactivation ofstandard hydrogenases can occur only after their reductionbelow approximately -120 mV.40
Armstrong and co-workers have proposed that oxygentolerance may be a consequence of (i) oxygen access to theactive site being slow, (ii) the reaction of O2 being selectivefor the formation of an inactive state that is easily reactivated,and/or (iii) reactivation being fast.79 Within the framework ofour present results, these hypotheses can now be examined.
Recently, it was shown that slowing oxygen access to theactive site of standard [NiFe] hydrogenases decreases the rateof inhibition by O2 under the condition that the rate ofintramolecular transport is slower than the reaction of O2 atthe active site.55 This is the case in certain mutants of the D.fructosoVorans hydrogenase, but not for the wild typeenzyme. The rate of the reaction of A. aeolicus Hase I withO2 (Figure 7C) is about 10 times slower than in the wildtype D. fructosoVorans hydrogenase, but this does notnecessarily imply that oxygen transport is slower. In ref 55,a two-step model has been used to interpret oxygen inhibitionkinetics, whereby the formation of a geminate state precedesthe reaction of O2 at the active site. In this work, the secondorder rate constant of O2 access to the active site is denotedby k1, the first order rate constant of O2 release by k-1, andthe first order rate constant of the chemical reaction by k2.
(76) Volbeda, A.; Fontecilla-Camps, J. C. Bioorganomet. Chem. 2006, 17,57–82.
(77) Fontecilla-Camps, J. C.; Amara, P.; Cavazza, C.; Nicolet, Y.; Volbeda,A. Nature 2009, 460, 814–822.
(78) Pershad, H. R.; Duff, J. L. C.; Heering, H. A.; Duin, E. C.; Albracht,S. P. J.; Armstrong, F. A. Biochemistry 1999, 38, 8992–8999. (79) Armstrong, F. A. Photosynth. Res. 2009, 102, 541–550.
Scheme 2. Schematic Overview of the Proposed Catalytic Cyclefor the Hase I from the Hyperthermophilic Bacterium A. aeolicusa
a Paramagnetic states are denoted in red and the EPR-silent states inblue. The infrared stretching vibrations at 25 °C are also included. Themidpoint potentials for these redox transitions are given for pH 7.4.
7002 J. AM. CHEM. SOC. 9 VOL. 132, NO. 20, 2010
A R T I C L E S Pandelia et al.

Within this framework, the bimolecular rate constant ofinhibition that we determined by fitting chronoamperometryexperiments (Figure 7C) is equal to k2k1/k-1 and its depen-dence on potential (Figure 7C) most likely reveals that ofk2. The difference between the bimolecular rates of inhibitionin A. aeolicus and D. fructosoVorans is not conclusivebecause it may result from any of these three rate constantsbeing different.
However, in support of hypothesis (ii), reaction of O2 at theactive site of A. aeolicus Hase yields only the Ni-B state, whichreactivates more quickly than Ni-A. Under similar conditions,the standard hydrogenases are oxidized into a mixture of Ni-Band Ni-A states.21,39 The molecular determinant for the selectiv-ity of A. aeolicus Hase I cannot yet be ascertained. By aligningthe amino acid sequences of standard and oxygen tolerant [NiFe]hydrogenases, Ludwig et al. found that the residues at ap-proximately 10 Å around the [NiFe] active site are highlyconserved.9 The formation of the oxidized inactive states uponpartial reduction of oxygen at the active site requires bothelectrons and protons. The rates of proton transfer are so stronglydependent on distance80 that the exact position (not only thenature) of the lateral chains of the amino acids surrounding theactive site must strongly affect the inactivation kinetics. Thismay also affect selectivity (formation of Ni-A versus Ni-B) ifthe protons used to make Ni-A and Ni-B do not take the samepaths.
Hypothesis (iii) also explains in part the oxygen toleranceof A. aeolicus: Figure 8 demonstrates that at a given electrodepotential, the reactivation of the Ni-B state is more than 2orders of magnitude faster in A. aeolicus than in A. Vinosum.We can exclude that reactivation of Ni-B is fast because thestructure of the substrate channels favors the diffusion ofthe hydroxo ligand to the solvent: if this diffusion stepdetermined the rate of reactivation, the latter would notdepend on potential; in contrast, Figure 8 clearly shows thatthe rate of reactivation is determined by an electron transferstep. We could also rule out the hypothesis according towhich the reactivation is fast because the reduction potentialof Ni-B is high. We speculate that the fast reactivation resultsfrom the fact that the interaction of the oxygenic ligand withthe [NiFe] site in A. aeolicus is weak. This is supported bythe changes in the EPR spectrum of Ni-B13 indicating aslightly different electronic structure of the spin carrying[NiFe] center. We also note that since the reduction of Ni-Brequires one proton,40 its rate is likely to be stronglydependent on the exact position of the amino acids thatsurround the nickel.
5. Conclusions
The present study is the first combined spectroscopic andelectrochemical investigation of an oxygen tolerant, hyperther-mophilic hydrogenase. Our aim was to characterize its redoxchemistry, gain insight into activation/inactivation mechanismsand study the mechanism of oxygen inhibition.
Not all redox states known from other hydrogenases wereobserved in A. aeolicus. Only four redox intermediates ofthis enzyme could be detected and characterized; one inactivestate that corresponds to the “ready” Ni-B state and threecatalytically active states assigned to Ni-SIa, Ni-C and Ni-R, respectively. The “unready” inactive Ni-A and Ni-SU
states were not observed, a finding that agrees with resultsobtained on the oxygen-tolerant MBH from R. eutropha.45
Furthermore, (Ni-SIr)I could not be resolved as an intermedi-ate in the transition from Ni-B to the active enzyme. Thismay indicate that the pKa of the amino acids that areresponsible for the acid base transitions are different. Theseare yet to be identified, e.g. by mutagenesis experiments. Itis interesting that only one Ni-R state is observed in A.aeolicus, which contrasts the results found for standardhydrogenases. The reduction potentials of the Ni-SIa/Ni-Cand Ni-C/Ni-R transitions lie approximately 100 mV higherthan those of standard hydrogenases. This is consistent withthe observation in PFE that the catalytic wave is shifted up.This also explains that the enzyme is much better at oxidizingH2 than at producing it. Hase I from A. aeolicus is oxygentolerant. It fully recovers activity after O2 is flushed away;this is the same phenotype as that of the membrane boundhydrogenase from R. eutropha.
Based on protein film electrochemical and spectroscopic datait is clearly shown that the transient species that is formed uponexposure to O2 is Ni-B; the same state is formed uponelectrochemical or chemical oxidation under anaerobic condi-tions. The reduction potential of Ni-B is not much larger thanthat in standard hydrogenases. Therefore the shift in thevoltammetric “switch potential” Esw is not due to the reductionpotential of Ni-B being greater. From a kinetic point of view,the mechanism of anaerobic formation and reactivation of Ni-Bas appears to be similar to that in standard hydrogenases, forexample, A. Vinosum. This is further discussed in ref 73. Therate of inactivation is the same, but the rate of reactivation ismore than 2 orders of magnitude larger, despite the fact thatthe reduction of Ni-B is not more favorable than in standardhydrogenases. This contrasts with the hypothesis in refs 65 and66 that the reduction of the Ni-B state is thermodynamicallyfavored in oxygen tolerant hydrogenases. The fast reactivationof Ni-B is the main difference between the oxygen tolerant andthe oxygen sensitive enzymes. The electrochemistry data supportthe hypothesis that O2 inhibits the enzyme by reacting at the[NiFe] center (rather than at a surface exposed center); a definiteconclusion is expected from results of EPR measurements using17O labeled water or dioxygen.
Further questions to be solved in future experiments, inaddition to the mechanism of O2 attack at the active site andthe interaction with other potential inhibitors like carbonmonoxide, are (i) the reason for the Ni-A state not beingformed, (ii) the detailed geometry associated with the lowyield of Ni-C; (iii) the structure of the Ni-R state and (iv)the electron and proton transfer events to the active site,which play a role in the generation of the various intermedi-ates and determine the activity of the enzyme. Although manydetails of these intermediates are now known, a final picturehas not been evolved.
The hydrogenase from the hyperthermophilic bacterium A.aeolicus is shown to be an ideally designed system and is thushighly interesting for biotechnological applications.8,67 It isstable at very high temperatures, it can be tightly attached toelectrode surfaces and it is oxygen tolerant. The optimumfunction and enhanced oxygen tolerance of the Hase I from A.aeolicus is most likely related to a weaker bonding interactionwith exogenous nonprotein ligands and to details of both protonand electron transfer processes. In this context the reductionpotentials of the iron sulfur clusters need to be determined; thisis currently under way in our laboratories.(80) Bertrand, P. J. Biol. Inorg. Chem. 2004, 9, 2–11.
J. AM. CHEM. SOC. 9 VOL. 132, NO. 20, 2010 7003
Hase I of the Hyperthermophilic Bacterium Aquifex aeolicus A R T I C L E S

Acknowledgment. Leslie J. Currell is acknowledged for histechnical support in the FTIR experiments. Birgit Deckers isparticularly thanked for her help with the graphical artwork. Thiswork was financially supported by the EU/Energy Networkproject SOLAR-H2 (FP7 contract 212508), BMBF (03SF0318B,03SF0355C), the Max Planck Society, the CNRS, ANR, the cityof Marseilles, Region Provence-Alpes-Cote d’Azur, and sup-ported by the “Pole de competitivite CapEnergies”.
Supporting Information Available: Supplementary Figures,control experiments for the protein film (PFE) electrochemistrymeasurements, comparative tables of FTIR and EPR spectraldata, as well as a detailed description of the procedure foranalyzing the infrared electrochemical titrations. This materialis available free of charge via the Internet at http://pubs.acs.org.
JA910838D
7004 J. AM. CHEM. SOC. 9 VOL. 132, NO. 20, 2010
A R T I C L E S Pandelia et al.

S1
The Membrane-Bound Hydrogenase I from the
Hyperthermophilic Bacterium Aquifex aeolicus:
Enzyme Activation, Redox Intermediates and Oxygen
Tolerance
Supporting Information
Maria-Eirini Pandelia†§, Vincent Fourmond‡ §, Pascale Tron-Infossi‡, Elisabeth
Lojou‡, Patrick Bertrand‡, Christophe Léger‡, Marie-Thérèse Giudici-Orticoni‡, and
Wolfgang Lubitz†*
†Max-Planck-Institut für Bioanorganische Chemie, Stiftstrasse 34-36, D45470,
Mülheim a.d. Ruhr, Germany ‡Laboratoire de Bioénergétique et Ingénierie des Protéines, IMM-CNRS, 13402
Marseille, France
E-mail: [email protected]
Table S1. Comparison between the principal g-values corresponding to the EPR-
detectable intermediates in Hase I from Aquifex aeolicus, MBH from Ralstonia
eutropha, membrane attached [NiFe] enzyme from Desulfovibrio vulgaris Miyazaki
F.
A. aeolicus (Hase I) R. eutropha (MBH) D. vulgaris MF
State gx gy gz gx gy gz gx gy gz
Ni-A nd nd nd nd nd nd 2.32 2.24 2.01
Ni-B 2.30 2.17 2.01 2.30 2.17 2.01 2.33 2.16 2.01
Ni-C 2.21 2.15 2.01 2.20 2.14 2.01 2.20 2.14 2.01
Ni-L 2.28 2.12 2.05 2.27 2.11 2.05 2.30 2.12 2.05
Ni-X 2.24 2.19 2.01 nd nd nd nd nd nd
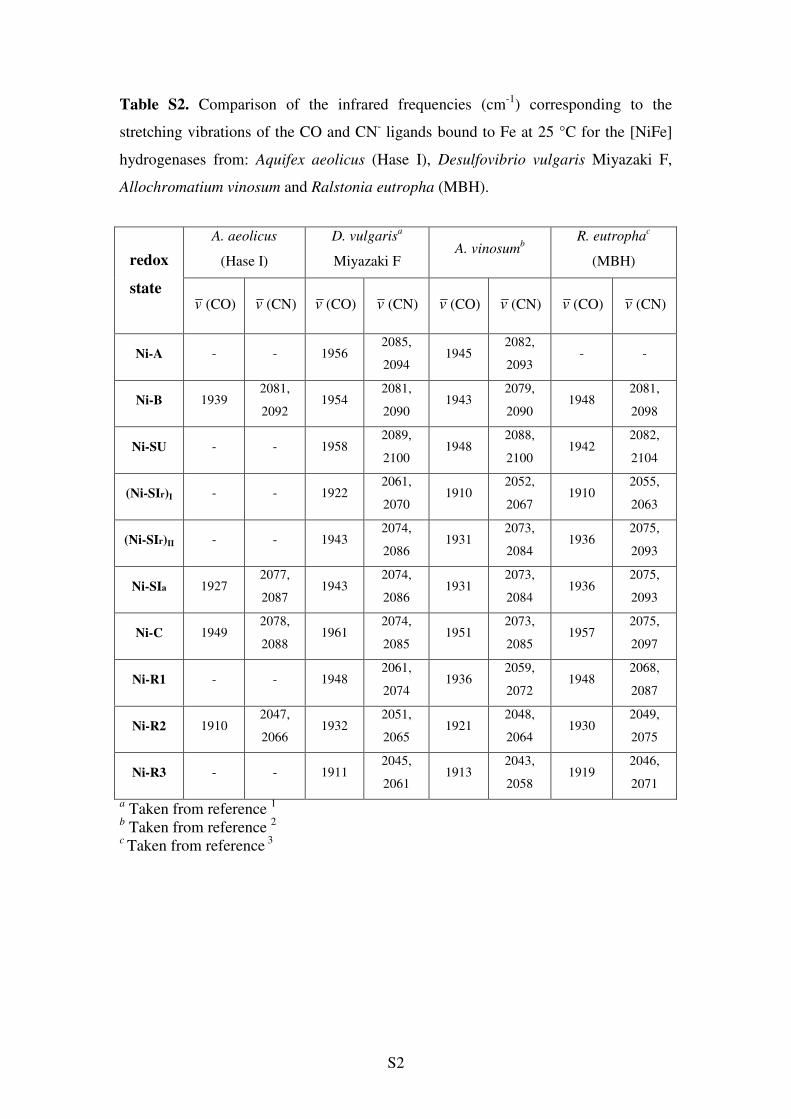
S2
Table S2. Comparison of the infrared frequencies (cm-1
) corresponding to the
stretching vibrations of the CO and CN- ligands bound to Fe at 25 °C for the [NiFe]
hydrogenases from: Aquifex aeolicus (Hase I), Desulfovibrio vulgaris Miyazaki F,
Allochromatium vinosum and Ralstonia eutropha (MBH).
a Taken from reference
1
b Taken from reference
2
c Taken from reference
3
redox
A. aeolicus
(Hase I)
D. vulgarisa
Miyazaki F A. vinosum
b R. eutropha
c
(MBH)
state
v (CO)
v (CN)
v (CO)
v (CN)
v (CO)
v (CN)
v (CO)
v (CN)
Ni-A - - 1956 2085,
2094 1945
2082,
2093 - -
Ni-B 1939 2081,
2092 1954
2081,
2090 1943
2079,
2090 1948
2081,
2098
Ni-SU - - 1958 2089,
2100 1948
2088,
2100 1942
2082,
2104
(Ni-SIr)I - - 1922 2061,
2070 1910
2052,
2067 1910
2055,
2063
(Ni-SIr)II - - 1943 2074,
2086 1931
2073,
2084 1936
2075,
2093
Ni-SIa 1927 2077,
2087 1943
2074,
2086 1931
2073,
2084 1936
2075,
2093
Ni-C 1949 2078,
2088 1961
2074,
2085 1951
2073,
2085 1957
2075,
2097
Ni-R1 - - 1948 2061,
2074 1936
2059,
2072 1948
2068,
2087
Ni-R2 1910 2047,
2066 1932
2051,
2065 1921
2048,
2064 1930
2049,
2075
Ni-R3 - - 1911 2045,
2061 1913
2043,
2058 1919
2046,
2071

S3
Figure S1. Control experiment showing that the decrease of H2-oxidation current that
results from the dilution in H2 concentration when 500µL of buffer saturated with N2
(instead of 200 µL of buffer saturated with O2 for the experiment in Figure 8 in the
main text) is injected, at t = 100s, in the 3 mL cell solution, at pH 7, 40°C, under 1
atm H2. Electrode rotation rate 3 krpm.

S4
Figure S2. FTIR spectra of the Hase I - cytb complex reduced for 40 min with H2 and
transferred into the IR cell under anaerobic conditions at 25°C (blue trace) and after 4
hours at 4°C (red trace). At 4 °C the FTIR bands corresponding to the Ni-SIa state of
the enzyme start to shift towards higher wavenumbers and the changes are complete
after a waiting time of 4 hours. This behavior is reversible (upon heating up the
sample to 25 °C), it is observed only for this state and has been related to the
formation of the inactive EPR-silent (Ni-SIr)II intermediate that has been proposed to
carry a loosely bound water ligand. Experimental conditions: resolution 1cm-1
, 15.000
averages.

S5
Figure S3. X-band cw EPR spectra of the as isolated Hase I-cytb at 10 K (red) and
40 K (blue). Experimental conditions: mw frequency 9.45567 GHz, modulation
amplitude 1 mT, mw power 2 mW, sample concentration 120µM.
From Figure S3 the principal values of the g-tensor of the Ni-B state are determined to
be gx = 2.30, gy = 2.17 and gz = 2.01. Additional signals in the nickel region are
present at g = 2.24, g = 2.19. These can be better discerned by increasing the
temperature from 10 to 40 K. Interestingly, these additional signals disappear from
the spectrum if the enzyme is preheated to 70°C (343 K) under aerobic conditions.
The residual spectrum is a ‘pure’ Ni-B state (see Figure 3 and subsection 3.1.3. of the
present manuscript).

S6
The additional signal present in the as isolated enzyme could be better separated and
further characterized by measurements at Q-band microwave frequencies (at ~34
GHz). It should be noted that the exact composition and type of the [FeS] clusters in
A. aeolicus Hase I have not been identified so far. However, in the as-isolated enzyme
the [FeS] cluster proximal to the [NiFe] centre is paramagnetic, resulting in a
magnetic coupling of these two EPR-detectable species. Therefore the nickel signals
in the Ni-B state, depending on the microwave frequency the experiment is carried
out, appear broadened or ‘split’4 due to the spin-spin interaction with the so far not
characterized EPR-active proximal [FeS] cluster.
Figure S4. 2 pulse-echo detected EPR spectra were recorded in the range of
temperatures between 10 and 30 K. Experimental conditions: π/2 = 36 ns, tau = 330
ns, mw frequency 33.97635 GHz, shot rep. time 0.6 ms, sample concentration 120
µM.
In Figure S4 at 30 K contributions from signals corresponding to Ni-B and the [FeS]
centers disappear due to the different relaxation of this magnetically coupled system.
The remaining signals correspond to the additional state present in the measurements
at X-band frequencies (see Figure S2 or Figure 3 in the manuscript) that can now be
completely characterized. The principal values of the g-tensor of this state are gx =
2.24, gy = 2.19 and gz = 2.01 and are consistent with the signals in the X-band
measurements. This state is denoted as Ni-X (see subsection 3.1.3. of the manuscript).
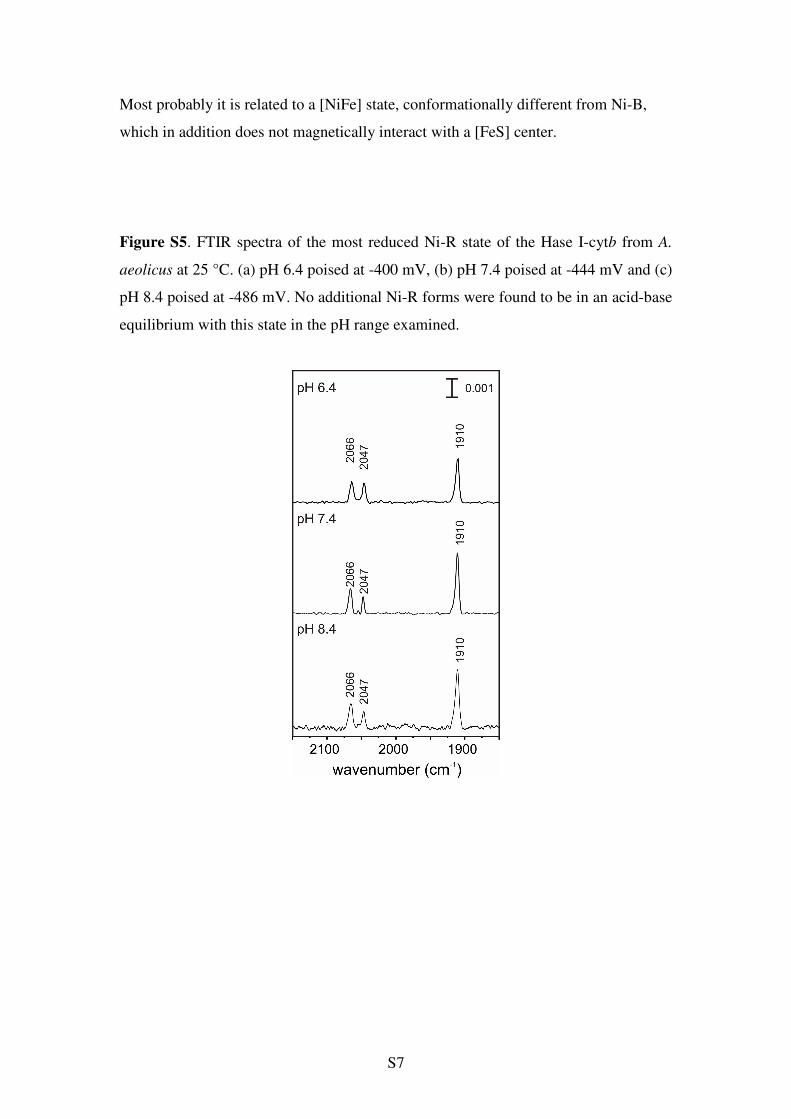
S7
Most probably it is related to a [NiFe] state, conformationally different from Ni-B,
which in addition does not magnetically interact with a [FeS] center.
Figure S5. FTIR spectra of the most reduced Ni-R state of the Hase I-cytb from A.
aeolicus at 25 °C. (a) pH 6.4 poised at -400 mV, (b) pH 7.4 poised at -444 mV and (c)
pH 8.4 poised at -486 mV. No additional Ni-R forms were found to be in an acid-base
equilibrium with this state in the pH range examined.

S8
Potentiometric titrations.
The INiB , I
NiSI , INiC , I
NiR are the CO peak absorption intensities of the Ni-B, Ni-SI,
Ni-C and Ni-R states, respectively.
The sum of these intensities at each applied potential equals:
INiB + I
NiSI + INiC + INiR = sumi (eq. 1),
where i=1,…n the number of the respective potential step in the potentiometric
titration. The individual normalized absorption peaks are given by:
1sum
I
sum
I
sum
I
sum
I NiRNiCNiSINiB=+++
iiii
1IIII norm
NiR
norm
NiC
norm
NiSI
norm
NiB =+++ (eq. 2)
NiSINiBE is the reduction potential of the Ni-B/Ni-SI redox couple, Eap is the applied
electrode potential and RTFnf = , where F is the Faraday constant (96485 C mol-1
),
R is the universal gas constant (8.31447 J K-1
mol-1
) and T is the temperature (K) and
n is the number of electrons that is taken equal to 1.
For the description of the ratios these relationships were used:
))Eexp(f(Eap
NiSINiBnorm
NiSI
norm
NiB
II
−= (eq. 3)
))Eexp(f(Eap
NiCNiSInorm
NiC
norm
NiSI
II
−= (eq. 4)
))Eexp(f(Eap
NiRNiCnorm
NiR
norm
NiC
II
−= (eq. 5)
Considering that 1IIII norm
NiR
norm
NiC
norm
NiSI
norm
NiB =+++ (eq. 1) and solving with respect
to the normalized peak absorption intensity of each redox state, we end up to the
following equations that describe the behavior of each redox state as a function of the
applied electrode potential that were used to fit the data in Figure 4 of the present
manuscript:

S9
))))((1())((1())(1
1I
NiRNiCNiCNiSINiSINiB
norm
NiBEEfexpEEfexpEf(Eexp apapap −−+⋅−−+⋅−−+
=
))))((1())((1())(1
))(I
NiRNiCNiCNiSINiSINiB
NiSINiB
norm
NiSIEEfexpEEfexpEf(Eexp
Ef(Eexp
apapap
ap
−−+⋅−−+⋅−−+
−−=
))))((1())((1())(1
))())(I
NiRNiCNiCNiSINiSINiB
NiCNiSINiSINiB
norm
NiCEEfexpEEfexpEf(Eexp
Ef(EexpEf(Eexp
apapap
apap
−−+⋅−−+⋅−−+
−−⋅−−
=
))))((1())((1())(1
))())())(I
NiRNiCNiCNiSINiSINiB
NiRNiCNiCNiSINiSINiB
norm
NiREEfexpEEfexpEf(Eexp
Ef(EexpEf(EexpEf(Eexp
apapap
apapap
−−+⋅−−+⋅−−+
−−⋅−−⋅−−
=
S10
References
1. Fichtner, C.; Laurich, C.; Bothe, E.; Lubitz, W. Biochemistry 2006, 45, 9706
2. Bleijlevens, B.; van Broekhuizen, F. A.; De Lacey, A. L.; Roseboom, W.;
Fernandez, V. M.; Albracht, S. P. J. J. Biolog. Inorg. Chem. 2004, 9 ,
743.
3. Saggu, M.; Zebger, I.; Ludwig, M.; Lenz, O.; Friedrich, B.; Hildebrandt, P.;
Lendzian, F. J. Biolog. Chem. 2009, 284 , 16264
4. Pandelia, Maria-Eirini. Doctoral Thesis, Technical University Berlin, Germany,
2009