methodology for estimating purchased prices of energy ... · purchased prices of energy-efficient...
TRANSCRIPT
LBNL-182927
ERNEST ORLANDO LAWRENCE BERKELEY NATIONAL LABORATORY
Methodology for Estimating Purchased Prices of Energy-efficient Motors Internationally and Results for Selected Countries Ali Hasanbeigi and Virginie Letschert
Energy Analysis and Environmental Impacts Division Energy Technologies Area Lawrence Berkeley National Laboratory May 2015 This work was funded by the Bureau of Oceans and International Environmental and Scientific Affairs, U.S. Department of State, and administered by the U.S. Department of Energy in support of the Super-efficient Equipment and Appliance Deployment (SEAD) initiative through the U.S. Department of Energy under Contract No. DE-AC02-05CH11231.

Disclaimer This document was prepared as an account of work sponsored by the United States Government in support of the Super-efficient Equipment and Appliance Deployment (SEAD) initiative. While this document is believed to contain correct information, neither the United States Government nor any agencies thereof, SEAD participating Governments nor any agencies thereof, the SEAD Operating Agent, The Regents of the University of California, nor any of their employees, makes any warranty, express or implied, or assumes any legal responsibility for the accuracy, completeness, or usefulness of any information, apparatus, product, or process disclosed, or represents that its use would not infringe privately owned rights. Reference herein to any specific commercial product, process, or service by its trade name, trademark, manufacturer, or otherwise, does not necessarily constitute or imply its endorsement, recommendation, or favoring by the United States Government or any agency thereof, SEAD participating Governments or any agencies thereof, the SEAD Operating Agent, or The Regents of the University of California. The views and opinions of authors expressed herein do not necessarily state or reflect those of the United States Government or any agency thereof, SEAD participating Governments or any agencies thereof, the SEAD Operating Agent or The Regents of the University of California.
Ernest Orlando Lawrence Berkeley National Laboratory is an equal opportunity employer.
Acknowledgements The authors want to thank Sanaee Iyama and Michael McNeil of Lawrence Berkeley National Laboratory for providing technical support in developing the methodology for the analysis. We also thank Gabrielle Dreyfus at the US Department of Energy, our program manager for the SEAD initiative.

3
Methodology for Estimating Purchased Prices of Energy-efficient Motors Internationally and Results for Selected Countries
Ali Hasanbeigi and Virginie Letschert
Energy Analysis and Environmental Impacts Department, Environmental Energy Technologies Division, Lawrence Berkeley National Laboratory
ABSTRACT
Motor-driven systems accounts for approximately 60% of manufacturing final electricity use worldwide. Setting standards and designing policies to increase the energy efficiency of the electric motor stocks in a country is a complex process that requires substantial amount of data and analysis. One of the key data needed for this purpose is the purchase price of electric motors in local market conditions. This study was conducted to develop a bottom-up approach to estimate the purchase price of electric motors in different countries/regions for different sizes, number of poles, enclosures, and efficiency levels by adjusting a recent analysis from the U.S to local parameters. The methodology allows for estimates of manufacturer selling prices, along with other costs associated with the distribution channel to calculate purchase prices for different efficiency levels, in different economies. In this report, we provide preliminary results for selected countries/regions in order to illustrate the possible applications of our analysis. Despite the uncertainties due to specific market conditions, this approach can be used by analysts, industry experts, policy makers, and other interested parties to have a more systematic way to estimate the purchase price of electric motors at the country level and use such prices in cost-benefit analyses and cost-effectiveness of higher energy efficiency standards for electric motors.

4
Table of Contents Abstract ........................................................................................................................................... 3 1. Introduction ................................................................................................................................. 6 2. Methodology ............................................................................................................................... 8
2.1. Equipment classes included in this analysis ..................................................................... 8 2.2. Baseline and candidate standard levels of efficiency in the U.S. ..................................... 9 2.3. Break down of the manufacturer selling prices calculated for the U.S. ......................... 10
2.3.1. Direct labor cost ....................................................................................................... 10 2.3.2. Manufacturer markups ............................................................................................. 13 2.3.3. Direct material production cost ................................................................................ 14
2.4. Calculation of final purchase prices ................................................................................ 15 2.4.1. Distribution markups ............................................................................................... 15 2.4.2. Shipment cost ........................................................................................................... 17
3. Model results for selected countries ......................................................................................... 20 3.1. Purchase price vs. efficiency results ............................................................................... 20 3.2. Insights on Purchase Price Structure ............................................................................... 22
4. Conclusion ................................................................................................................................ 23 References ..................................................................................................................................... 24 Appendix A. Description of Baseline and candidate standard levels of electric motor efficiency in the U.S. .................................................................................................................................... 25 Appendix B. Nominal efficiency values for electric motors under each CSL. ............................. 26 Appendix C. Manufacturer selling prices (MSPs) of electric motors in the U.S. ......................... 31

5
List of Tables
Table 1. Countries included in this study. ....................................................................................... 7 Table 2. Candidate Standard Levels (U.S. DOE 2014). ................................................................. 9
Table 3. Labor markups for electric motor manufacturers (U.S. DOE 2014). ............................. 10 Table 4. Hourly compensation costs in manufacturing in different countries in 2011 (U.S. BLS 2012) and estimated weighted average labor cost used for MSP calculation. .............................. 12 Table 5. Labor Hour Assumptions by CSL (U.S. DOE 2014). .................................................... 13
Table 6. Manufacturer markups and their estimates (U.S. DOE 2014). ....................................... 14 Table 7. Summary markups for four primary distribution channels for electric motors in the U.S. (U.S. DOE 2014). .......................................................................................................................... 16 Table 8. Value added tax (TMF Group 2013) and calculated overall markup for each country. . 17
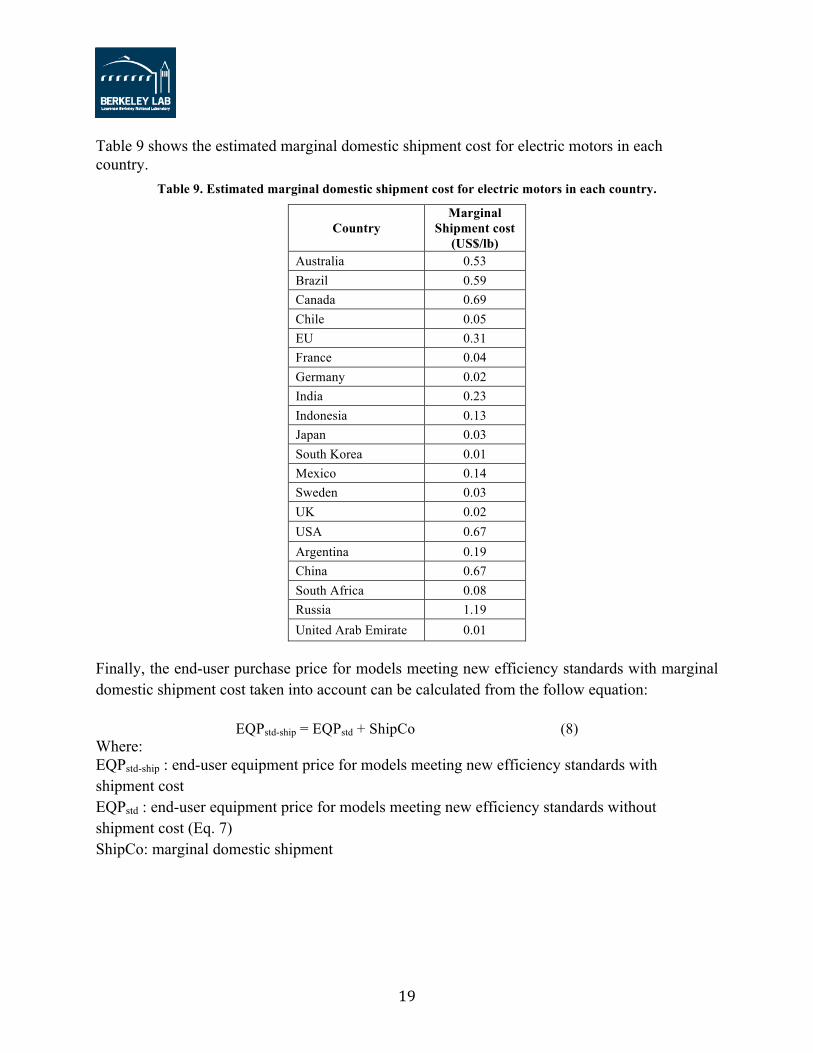
Table 9. Estimated marginal domestic shipment cost for electric motors in each country. ......... 19
List of Figures Figure 1. Electric Motor Shipments by Pole Configuration in the U.S. in 2012 (U.S. DOE 2014).......................................................................................................................................................... 9 Figure 2. Motor weight vs. efficiency level (based on data from U.S. DOE (2014). ................... 18
Figure 3. Estimated motor purchase prices for 4-pole enclosed electric motors in the U.S. ........ 20 Figure 4. Estimated motor purchase prices for 4-pole enclosed electric motors in China. .......... 21
Figure 5. Estimated motor purchase prices for 4-pole enclosed electric motors in Brazil. .......... 21 Figure 6. Share of each component cost from the total cost of 4-pole enclosed 5HP electric motor with efficiency level CSL2 in the U.S. ......................................................................................... 22 Figure 7. Share of each component cost from the total cost of 4-pole enclosed 5HP electric motor with efficiency level CSL2 in China. ............................................................................................ 22
6
1. INTRODUCTION
The U.S. Department of Energy (DOE) commissioned the International Energy Studies group at Lawrence Berkeley National Laboratory (LBNL) to undertake this technical analysis on efficient motors in support of the Super-efficient Equipment and Appliance Deployment (SEAD) initiative. The subsections below describe SEAD, the objective, scope and data sources for this project, and the organization of the remainder of this report. The SEAD initiative aims to transform the global market by increasing the penetration of highly efficient equipment and appliances. SEAD is a government initiative whose activities and projects engage the private sector to realize the large global energy savings potential from improved appliance and equipment efficiency. SEAD seeks to enable high-level global action by informing the Clean Energy Ministerial dialogue as one of the initiatives in the Global Energy Efficiency Challenge. In keeping with its goal of achieving global energy savings through efficiency, SEAD was approved as a task within the International Partnership for Energy Efficiency Cooperation (IPEEC) in January 2010. SEAD partners work together in voluntary activities to: (1) “raise the efficiency ceiling” by pulling super-efficient appliances and equipment into the market through cooperation on measures like incentives, procurement, awards, and research and development (R&D) investments; (2) “raise the efficiency floor” by working together to bolster national or regional policies like minimum efficiency standards; and (3) “strengthen the efficiency foundations” of programs by coordinating technical work to support these activities. SEAD has commissioned various technical analyses, generating relationships between cost and efficiency for a wide range of engineering options, revealing a large cost-effective potential for energy efficiency for white goods and electronics such as televisions, air conditioners and ceiling fans (Park et al., 2011; Sathaye et al., 2012; Shah et al., 2012). Since motor-driven systems accounts for approximately 60% of manufacturing final electricity use worldwide (IEA 2007), there is a large potential for energy savings, achievable by replacing low efficiency motors with more efficient motors. However, the cost of efficient motors is higher than that for standard or low efficiency motors. Therefore, having a better understanding of the cost of motors with different efficiency levels, sizes, and types is an integral part of any regulation or policy design that aims to increase the efficiency of the electric motor stock in a country. With this study, SEAD is for the first time aiming at analysis of opportunities within industrial equipment, i.e. electric motors. The objective of this analysis is to provide initial country-specific estimates of retail prices for energy-efficient motors as a first step to determine savings opportunities for electric motors. In our analysis, we derived a methodology developed by LBNL in support of DOE’s rulemaking to estimate the purchase price (PP) of electric motors from manufacturer selling price (MSP) and distribution channel considerations, for different motor sizes, number of poles, and efficiency levels. By decomposing the different costs into components that can be adjusted to local market

7
conditions, we extrapolate the methodology to determine purchase price of motors in different countries/regions around the world that are participating in the SEAD initiative. As of January 2015, the governments participating in SEAD are: Australia, Brazil, Canada, Chile, the European Commission, France, Germany, India, Indonesia, Japan, Korea, Mexico, Russia, South Africa, Sweden, the United Arab Emirates, the United Kingdom, and the United States1. The countries/regions for which the electric motor purchase prices are estimated in this study are comprised of the SEAD countries and China, observer of the SEAD initiative. The countries are listed in Table 1.
Table 1. Countries included in this study.
No. Country 1 Australia 2 Brazil 3 Canada 4 Chile 5 EU 6 France 7 Germany 8 India 9 Indonesia
10 Japan 11 South Korea 12 Mexico 13 Sweden 14 UK 15 USA 16 China 17 South Africa 18 Russia 19 United Arab Emirate
The methodology described in this paper will help analysts, industry experts, policy makers, and other interested parties to have a more systematic way to estimate the purchase price of electric motors in different country markets, and allow them to use such prices to estimate the incremental cost of energy efficient motors that can feed into cost-benefit analyses of higher energy efficiency standards for electric motors. We are aware that the estimated purchase prices may deviate from the actual retail prices in each country since the retail prices in each country depend on many local market and economic factors. It is recommended that analysts in countries seeking to use our study to implement a 1 More information on SEAD is available from its website at http://www.superefficient.org/.

8
standard or other policy perform a retail price survey in order to calibrate our models to local conditions.
The remainder of this report is organized as follows:
• Section 2, Methodology - details the steps in determining motor purchase prices for different efficiency levels.
• Section 3, Country-specific Results - presents selected results of the model for selected economies.
• Section 4, Summary and Conclusions - summarizes the previous sections and offers conclusions and suggestions relevant for analysts, industry experts, and policy makers.
2. METHODOLOGY
The method used for the estimation of electric motor purchase prices is primarily based on DOE’s final technical support document (TSD), Energy Efficiency Program for Commercial Equipment: Energy Conservation Standards for Electric Motors (DOE 2014). Specifically, content from chapters 5, 6, and 10, on analysis of engineering, markup, and national impacts, respectively, proved very helpful to our study. Following the methodology explained in DOE 2014, we disaggregated the MSP and PP for electric motors calculated by DOE for the U.S. into the major components such as labor cost, material cost, various overheads, and markups. Having the MSP and PP broken down into individual components will help us adjust each component for a different country, based on information available for that country, in order to make a reasonable estimation of MSP and purchase prices of electric motor in the country being studied. This is explained in more details in the following sub-sections. 2.1. Equipment classes included in this analysis
In this study, we focused on the National Electrical Manufacturers Association’s (NEMA) Design A and B electric motors. 98.7% of the electric motor shipment in the U.S. in 2011 was design B, 1% was design A. Design C and fire pump electric motors were not included because they only made up .03% of the electric motor shipment in the U.S. The MSP and purchase prices of electric motors between 1 and 500 Horsepower (HP) are calculated in this study. All 2-pole, 4-pole, 6-pole and 8-pole electric motors are also included in our study. The electric motor shipments by pole configuration for the U.S. in 2011 are shown in Figure 1. Also, both open and enclosed electric motors are considered in this analysis. In 2011, 77% of electric motors shipped in the U.S. were with open enclosure, while 23% were with enclosed enclosure (DOE 2014).

9
Figure 1. Electric Motor Shipments by Pole Configuration in the U.S. in 2012 (U.S. DOE 2014). 2.2. Baseline and candidate standard levels of efficiency in the U.S.
DOE identified a specific baseline electric motor as a fundamental design against which it would apply design changes to improve the electric motor’s efficiency. The baseline efficiency level is used to determine energy savings and changes in price associated with moving to higher efficiency levels. Energy efficiency levels are termed “candidate standard levels” (CSLs) (DOE 2014). Table 2 shows the CSLs for electric motors used in DOE’s study and their definitions, along with our study. More detailed information about CSLs can be found in Appendix A as well as in DOE 2014. Appendix B shows the nominal efficiency values for each electric motor size with different pole numbers and enclosure type under each CSL. Because of the international context of this study, we also show the comparison of efficiency levels under the international efficiency (IE) classification, which is defined in IEC 60034-30 for reference (IEC, 2014). IEC 60034-30 specifies energy-efficiency classes for single-speed, three-phase, cage-induction motors with 2, 4 or 6 poles. It defines four classes: IE1 (standard), IE2 (high), IE3 (premium) and IE4 (super-premium).
Table 2. Candidate Standard Levels (U.S. DOE 2014).
CSL Number
CSL Name IE Comparison* Note **
0 Baseline Below IE1 Lowest observed efficiency under expanded scope
1 Standard IE2 EPACT 1992 requirement, with additional
efficiency levels added in NEMA MG1-2011
2 Premium IE3 EISA 2007 requirement for general purpose
electric motors (subtype I), with additional efficiency values added in NEMA MG1-2011
3 Best-in-Market None One NEMA nominal efficiency level improvement
relative to the Premium level
4 Incremental None One NEMA nominal efficiency level improvement
relative to the Best-in-Market *Efficiency levels are comparable at the same frequency of operation (60Hz in the DOE study). A complete set of conversion tables from 60 Hz to 50Hz is available for motors covered in the scope of this study in the IEC 60034-30 and in Benhaddadi et al. (2011).
2"pole'18%'
4"pole'69%'
6"pole'10%'
8"pole'3%'
10
** More detailed information about CSLs can be found in Appendix A of this report. 2.3. Break down of the manufacturer selling prices calculated for the U.S.
Based on the methodology described in DOE 2014, the MSP was calculated for electric motors with sizes between 1HP and 500HP, different pole numbers and enclosure types for different CSLs. These MSPs for the U.S. are presented in Appendix C. Below we describe how we followed this methodology to disaggregate the MSPs into their major components such as labor cost, material cost, various overheads, and markups.
2.3.1. Direct labor cost
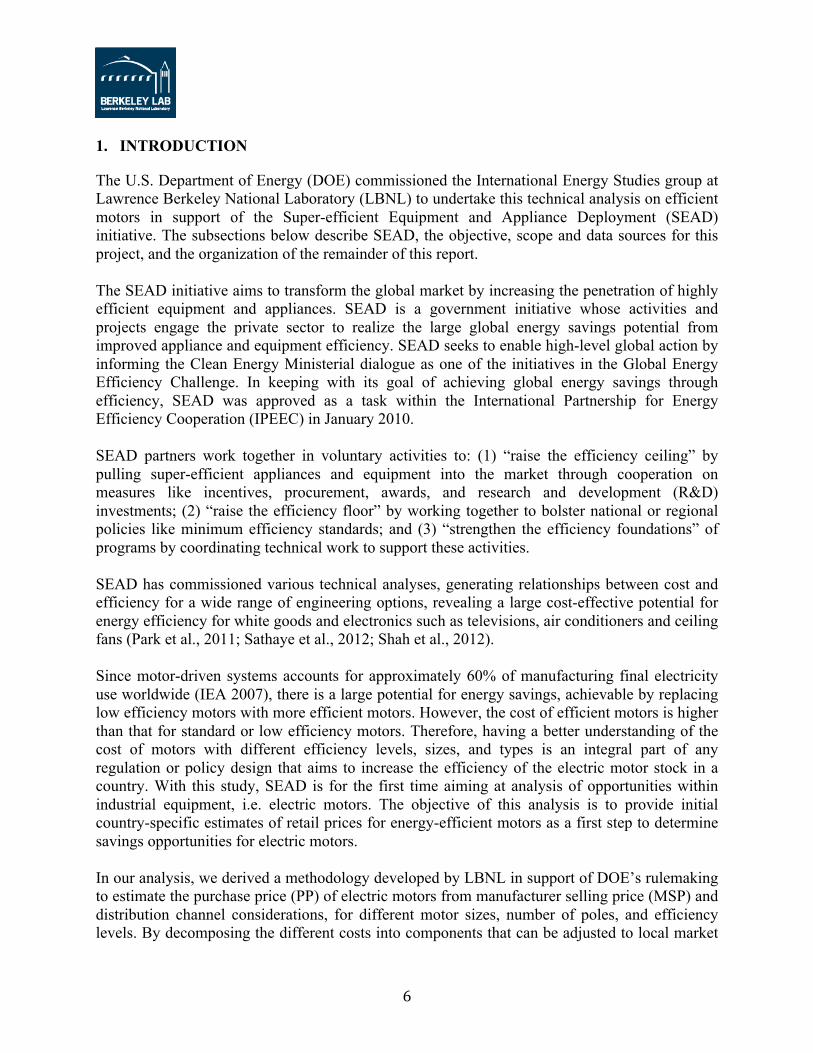
To calculate the direct labor cost we need the base hourly labor rate as well as the number of labor hours. For the base labor rate in the U.S., DOE used the weighted average labor rate of domestic and foreign labor rates to equal US$ 10.9. DOE weighed the foreign labor rate more than the domestic labor rate based on feedback from manufacturers indicating that off-shore production accounts for a majority of electric motor production by US-based companies. In addition, several markups were applied to this hourly rate to obtain a fully burdened rate (DOE 2014). Table 3 shows these labor markups for electric motor manufacturers.
Table 3. Labor markups for electric motor manufacturers (U.S. DOE 2014).
Item description Markup percentage Rate per hour Labor cost per hour $10.9 Indirect Production a 33 % $14.5 Overhead b 30 % $18.8 Fringe c 24 % $23.4 Assembly Labor Up-time d 43 % $33.5 Final Cost of Labor Used in MSP Calculation $33.5
a Indirect Production Labor (Production managers, quality control, etc.) as a percent of direct labor on a cost basis. b Overhead includes commissions, dismissal pay, bonuses vacation, sick leave, and social security contributions. c Fringe includes pension contributions, group insurance premiums, workers compensation. d Assembly labor up-time is a factor applied to account for the time that workers are not assembling product and/or reworking unsatisfactory units. To calculate the weighted average labor rate of domestic and foreign labor rates for electric motor manufacturer companies in other countries studied, we first obtained the hourly compensation costs in manufacturing in different countries in 2011 (Table 4) from the U.S. Bureau of Labor Statistics (U.S. BLS 2012). Unlike the case in the DOE analysis, we did not have access to motor manufacturer companies in different countries. Hence, we did not have information on how many of the electric motors from companies based in different countries that were manufactured in other countries and the name of those countries. Because of time and resource constraints, we did not have the data on the share of domestically produced motors vs. imported motors in each of the countries studied. Therefore, we could not estimate the weighted

11
average labor cost used in the MSP calculation the same way as it is calculated for the U.S. as explained above. Instead we used a simplified method as follows. We assumed that for motor manufacturer companies in developed countries to be competitive with U.S. motor manufacturers, their weighted average labor cost used to calculate their MSP should not be significantly higher than that in the U.S. For developing countries, we mostly used local manufacturing labor cost as the weighted average labor cost for their MSP calculation, assuming that most of the motor manufacturers in these developing countries produce almost all their motors domestically and do not outsource their production as is the case for developed countries. Based on this assumption and having the U.S. manufacturing labor cost and weighted average labor cost used for MSP calculation in the U.S., we can calculate the weighted average labor cost for the developed countries using the following equation. The results are presented in Table 4.
WALi = HCMi * WALU.S. / HCMU.S. (1) Where: WALi : weighted average labor cost for MSP calculation in country i HCMi : hourly compensation costs in manufacturing- all employees in country i WALU.S.: weighted average labor cost for MSP calculation in the U.S. HCMU.S.: hourly compensation costs in manufacturing- all employees in the U.S.

12
Table 4. Hourly compensation costs in manufacturing in different countries in 2011 (U.S. BLS 2012) and estimated weighted average labor cost used for MSP calculation.
Country
Hourly compensation costs in manufacturing-
all employees (US$/h)
Estimated weighted average labor cost
used for MSP calculation (US$/h)
Australia 46.3 14.2 Brazil 11.6 11.6* Canada 36.6 11.2 Chile 9.1 13.9 EU 35.8 11.0 France 42.1 12.9 Germany 47.4 14.5 India 1.4 1.4* Indonesia 0.9 0.9* Japan 35.7 10.9 Korea 18.9 9.5** Mexico 6.5 6.5* Sweden 49.1 15.0 UK 30.8 9.4 USA 35.5 10.9 China 2.8 2.8*
South Africa 2.3.2. 11.5 2.3.3. 11.5*
Russia 4.3 4.3* United Arab Emirate 4.8 4.8*
Note: Countries in italics are not covered by the BLS dataset. We used alternative sources to determine manufacturing cost. * For these countries, we assumed most of the motors by domestic motor companies are produced within the country itself. ** For this country, we assumed the weighted average labor cost equal to half of the manufacturing labor cost, considering that a substantial share of the motors production is outsourced in China and South-East Asia. Next, for the number of labor hours for the production of motors with different sizes for each CSLs, we used the estimates by DOE for the representative units, i.e. 5HP, 30HP, and 75HP design B motors, for different CSLs (Table 5). By multiplying the weighted average labor cost from Table 4 and labor hours from Table 5, we can calculate the labor cost component of the MSP.
LC = WAL ᵡ LH (2) Where: LC: Labor cost WAL : weighted average labor cost per hour LH: Labor hour

13
However, Table 5 only gives the labor hours for 5HP, 30HP, and 75HP motors. Having calculated the labor cost of 5HP, 30HP, and 75HP motors as explained above, we used an interpolation to calculate the labor cost for motor with sizes between 5HP and 75HP. We calculated the labor cost increase by one unit increase in HP for motors between 5HP and 75HP (US$ per 1 HP increase in size). We applied that rate to extrapolate the labor cost for motors smaller than 5HP and larger than 75HP.
Table 5. Labor Hour Assumptions by CSL (U.S. DOE 2014).
Labor Hours
HP Rating CSL 0 CSL 1 CSL 2 CSL 3 CSL 4 CSL 5 5, Design B 1.3 1.3 1.4 1.5 3.5* 3.7* 30, Design B 2.0 2.1 2.2 2.3 6.0* 6.3* 75, Design B 3.5 3.7 3.9 4.1 9.0* 9.5*
* Based on slot fill measurements, DOE assumed a hand-wound labor hour amount for these motors (U.S. DOE 2014).
2.3.4. Manufacturer markups
DOE estimated three manufacturer markups to account for non-production costs that are part of each electric motor leaving a manufacturer’s facility. Table 6 explains these markups and shows their estimates for the U.S.

14
Table 6. Manufacturer markups and their estimates (U.S. DOE 2014).
Manufacturer markup Description Value
Handling and scrap factor
This markup was applied to the direct material production costs of each electric motor. It accounts for the handling of material (loading into assembly or winding equipment) and the scrap material that cannot be used in the production of a finished electric motor (e.g., lengths of wire too short to wind).
2.5 %
Factory overhead
Factory overhead includes all the indirect costs associated with production, indirect materials and energy use, taxes, and insurance. It is applied to the direct material production costs (including the handling and scrap factor).
17.5 %
Non-production
This markup reflects costs including sales and general administrative, research and development, interest payments, and profit factor. It is applied to the sum of the direct material production, the direct labor, and the factory overhead.
37 % (<=30HP) 45 % (>30HP)
Next step was to adjust the manufacturer markups for different countries studied (see Table 1). Since there are many components included in markups, it was not possible to adjust the markups for every single component. We assumed that labor cost is a significant part of the manufacturer markups; hence, we used the weighted average labor cost (from Table 4) as a proxy to adjust the U.S. markups for manufacturers in other countries. The following equation is used for this adjustment:
MUi,j = MUi,U.S. ᵡ WALj / WALU.S. (3) Where: MUi,j: manufacturer markup j for country i MUi,U.S: manufacturer markup j for the U.S. (Table 6) WALj: weighted average labor cost for country i (Table 4) WALU.S.: weighted average labor cost for the U.S. (Table 4)
2.3.5. Direct material production cost
The MSP is calculated using the following equation:
MSP = LC + MC + MU (4) Where: MSP: Manufacturer selling price WAL: labor cost for MSP calculation
15
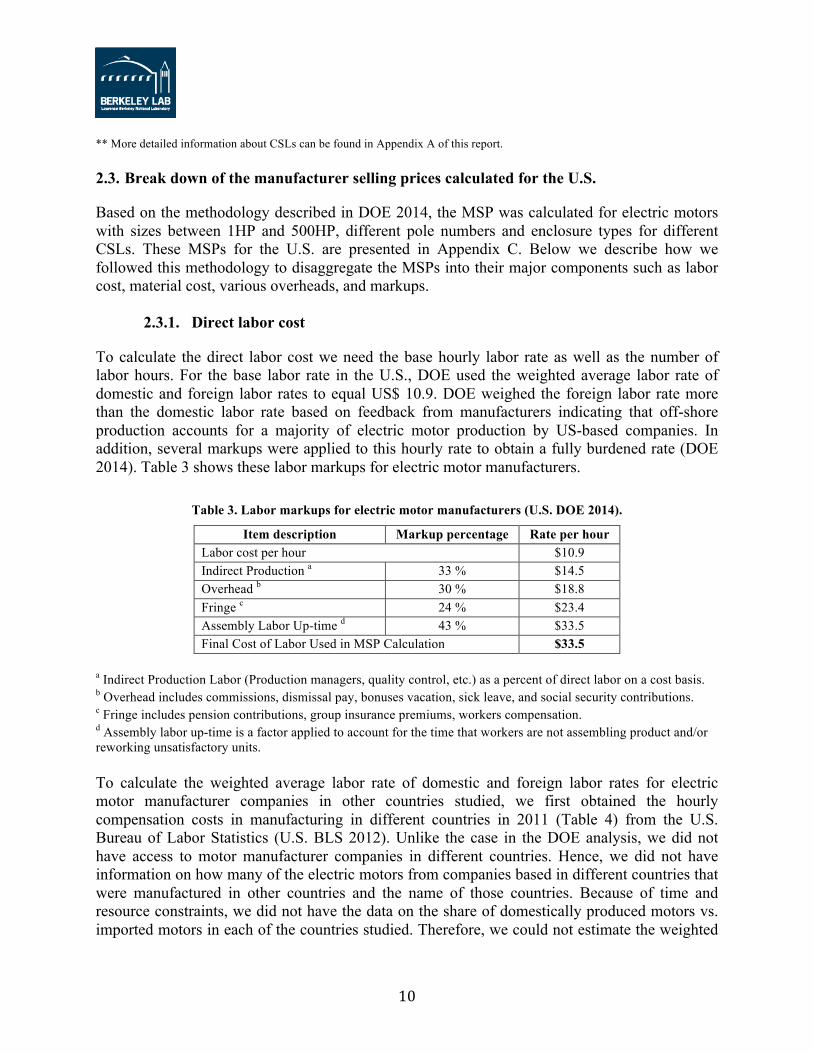
MC: Direct material production cost MU: Markups Following the description in Table 6, for motors smaller than 30HP we have:
MSP = LC + MC + 0.025 ᵡ MC + 0.175 ᵡ (0.025 ᵡ MC) + 0.37 ᵡ (LC+MC+ 0.175 ᵡ (0.025 ᵡ MC)) (5) All variables in Eq. 5 are known except the material cost. The MSP for electric motors with different sizes, pole number, and enclosure type are given in Appendix C. The labor cost is calculated as explained above. The markups are given in Table 6. If we solve Eq. 5 for MC, we have:
MC = (MSP – LC – 0.37 ᵡ LC) / 1.64 (6) For motors larger than 30HP, the same method can be applied with the difference that in Eq. 5 the non-production markup of 0.45 should be used instead of 0.37. 2.4. Calculation of final purchase prices
To calculate the final purchase prices of electric motors from MSPs, we need to apply the distribution markups as well as shipment costs. Subsections below explain how these two components are estimated for other countries based on their values given for the U.S.
2.4.1. Distribution markups
Electric motors are often sold as part of a project with unlisted prices and the actual purchase prices for electric motors are not generally known. DOE calculated the purchase prices by applying a markup to the MSP. The markup depends on the type of distribution channels through which equipment moves from manufacturers to purchasers. It was calculated using data from distributors company financial statements, assuming distributors mark up the price of the equipment to cover their business costs and profit margin. DOE identified seven main distribution channels for electric motors as follows (DOE 2014): (1) Original equipment manufacturers (OEMs) and then to end-users (25 percent of sales); (2) OEMs to distributors and then to end-users (25 percent of sales); (3) Distributors to end-users (24 percent of sales); (4) Distributors to OEM and then to end-users (23 percent of sales); (5) Contractors and then to end-users (less than one percent of sales); (6) Distributors to end-users through contractors (less than one percent of sales); and (7) End-users (less than two percent of sales). DOE gives the summary markups for four primary distribution channels (1, 2, 3, and 4) as shown in Table 7.

16
Then, the markup values are weighted by the respective shares of each major channel to calculate an average overall baseline markup and an overall incremental markup. Equation 7 shows how DOE used the overall incremental markup to determine the end-user equipment price for higher-efficiency models:
EQPstd = MSPmfg ᵡ MUoverall-Base + Δ MSPmfg ᵡ MUoverall-Increment (7) Where: EQPstd : end-user equipment price for models meeting new efficiency standards (without shipment cost) MSPmfg : manufacturer selling price for baseline models MUoverall-Base : baseline overall markup Δ MSPmfg : change in manufacturer selling price for higher-efficiency models MUoverall-Increment : incremental overall markup
Table 7. Summary markups for four primary distribution channels for electric motors in the U.S.
(U.S. DOE 2014).
Markup OEM to end-user
(25%) OEM to Distributor to end-user (25%)
Distributor to end-user (24%)
Distributor to OEM to end-user (23%)
Overall distribution markup (Weighted average across all
distribution channels)
Base- line
Incremental Base- line
Incremental Base- line
Incremental Base- line
Incremental Base- line
Incremental
Distributor - - 1.35 1.2 1.35 1.2 1.35 1.2
OEM 1.44 1.39 1.44 1.39 - - 1.44 1.39
Sales tax 1.0712 1.0712 1.0712 1.0712 1.0712 1.0712 1.0712 1.0712
Overall 1.54 1.49 2.08 1.79 1.45 1.29 2.08 1.79 1.77 1.57
For other countries, we assumed similar distributor and OEM markups as shown in Table 7 for the U.S. For the sales tax however, we found the value added tax (VAT) for each of the countries that were studied (TMF Group 2013) and used it instead of the U.S. sales tax in Table 7. Table 8 shows the VAT for each country. Then, the overall distribution markups are recalculated based on each country’s VAT (Table 8).

17
Table 8. Value added tax (TMF Group 2013) and calculated overall markup for each country.
Country Value Added Tax (VAT)
Overall markup Baseline Incremental
Australia 10.0% 1.81 1.62
Brazil 21.0% 1.99 1.77
Canada 10.0% 1.81 1.62
Chile 19.0% 1.96 1.75
EU 20.0% 1.98 1.76
France 19.6% 1.97 1.75
Germany 19.0% 1.96 1.75
India 12.4% 1.85 1.65
Indonesia 10% 1.81 1.62
Japan 5.0% 1.73 1.54
South Korea 10.0% 1.81 1.62
Mexico 16.0% 1.91 1.70
Sweden 25.0% 2.06 1.83
UK 20.0% 1.98 1.76
USA 7.11% 1.77 1.57
Argentina 21.0% 1.99 1.77
China 17.0% 1.93 1.72
South Africa 14.0% 1.88 1.67
Russia 18.0% 1.94 1.73
United Arab Emirate 0.0% 1.65 1.47
2.4.2. Shipment cost
Figure 2 shows how the motor weight increases as the efficiency level increases. Also, based on weight data for electric motors given in DOE 2014 and final purchase prices for motors in the U.S., we found that the shipment cost for electric motors accounts for 1% - 9% of final purchase price in the U.S. depending on the size and efficiency level of the motors. Hence, it is important to take into account the impact of the increase in motor weight on the shipment cost and final purchase price. Based on the quoted shipping costs from various freight shipment companies, DOE estimated that marginal shipment costs per pound of weight increased for the domestic shipment in the U.S. (i.e. international shipment is not included in the shipment cost) in the range of 7.1 cents to $1.44, depending on the total weight, distance shipped, and guaranteed delivery times. DOE used a median marginal shipment cost of 67 cents per pound.

18
Figure 2. Motor weight vs. efficiency level (based on data from U.S. DOE (2014).
Since we do not have enough information on electric motor shipments in different countries, we adjusted the U.S. marginal domestic shipment cost for different countries using the ratio of area for each country to area of the U.S. Since the U.S. marginal shipment cost is only for domestic shipment and is based on a range of shipping distances between 350 and 3,000 miles, we assumed in this particular case that the area of the country could be a good proxy to adjust the U.S. marginal shipment cost for other countries.
0.0
1000.0
2000.0
3000.0
4000.0
5000.0
6000.0
7000.0
1 1.5 2 3 5 7.5 10 15 20 25 30 40 50 60 75 100 125 150 200 250 300 350 400 450 500
Motor W
eight (lb)
Motor size (hp)
CSL 0
CSL 1
CSL 2
CSL 3
CSL 4
CSL 5
19
Table 9 shows the estimated marginal domestic shipment cost for electric motors in each country.
Table 9. Estimated marginal domestic shipment cost for electric motors in each country.
Country Marginal
Shipment cost (US$/lb)
Australia 0.53 Brazil 0.59 Canada 0.69 Chile 0.05 EU 0.31 France 0.04 Germany 0.02 India 0.23 Indonesia 0.13 Japan 0.03 South Korea 0.01 Mexico 0.14 Sweden 0.03 UK 0.02 USA 0.67 Argentina 0.19 China 0.67 South Africa 0.08 Russia 1.19 United Arab Emirate 0.01
Finally, the end-user purchase price for models meeting new efficiency standards with marginal domestic shipment cost taken into account can be calculated from the follow equation:
EQPstd-ship = EQPstd + ShipCo (8) Where: EQPstd-ship : end-user equipment price for models meeting new efficiency standards with shipment cost EQPstd : end-user equipment price for models meeting new efficiency standards without shipment cost (Eq. 7) ShipCo: marginal domestic shipment

20
3. MODEL RESULTS FOR SELECTED COUNTRIES
3.1. Purchase price vs. efficiency results
As described in the methodology section, the model can generate country-specific retail price estimates for a wide range of motor configurations, sizes, and efficiency levels. We selected a few countries in which we present their detailed results, in order to illustrate the outputs of our model. Figure 3 to Figure 5 show the example of estimated motor purchase prices for 4-pole enclosed electric motors in the U.S., China, and Brazil for different motor sizes and efficiency levels.
Figure 3. Estimated motor purchase prices for 4-pole enclosed electric motors in the U.S.
0"
5000"
10000"
15000"
20000"
25000"
1" 1.5" 2" 3" 5" 7.5" 10" 15" 20" 25" 30" 40" 50" 60" 75" 100" 125" 150" 200" 250" 300" 350" 400" 450" 500"
2011$US$$
Size$(hp)$
CSL"0"
CSL"1"
CSL"2"
CSL"3"
CSL"4"

21
Figure 4. Estimated motor purchase prices for 4-pole enclosed electric motors in China.
Figure 5. Estimated motor purchase prices for 4-pole enclosed electric motors in Brazil. The results presented in Figure 4 and 5 are modeled purchase prices that need to be validated with local market data in order to be calibrated to reflect local market conditions that are not captured by our methodology and the US DOE engineering analysis.
0"
2000"
4000"
6000"
8000"
10000"
12000"
14000"
16000"
1" 1.5" 2" 3" 5" 7.5" 10" 15" 20" 25" 30" 40" 50" 60" 75" 100" 125" 150" 200" 250" 300" 350" 400" 450" 500"
2011$US$$
Size$(hp)$
CSL"0"
CSL"1"
CSL"2"
CSL"3"
CSL"4"
0"
5000"
10000"
15000"
20000"
25000"
30000"
1" 1.5" 2" 3" 5" 7.5" 10" 15" 20" 25" 30" 40" 50" 60" 75" 100" 125" 150" 200" 250" 300" 350" 400" 450" 500"
2011$US$$
Size$(hp)$
CSL"0"
CSL"1"
CSL"2"
CSL"3"
CSL"4"
22
3.2. Insights on Purchase Price Structure
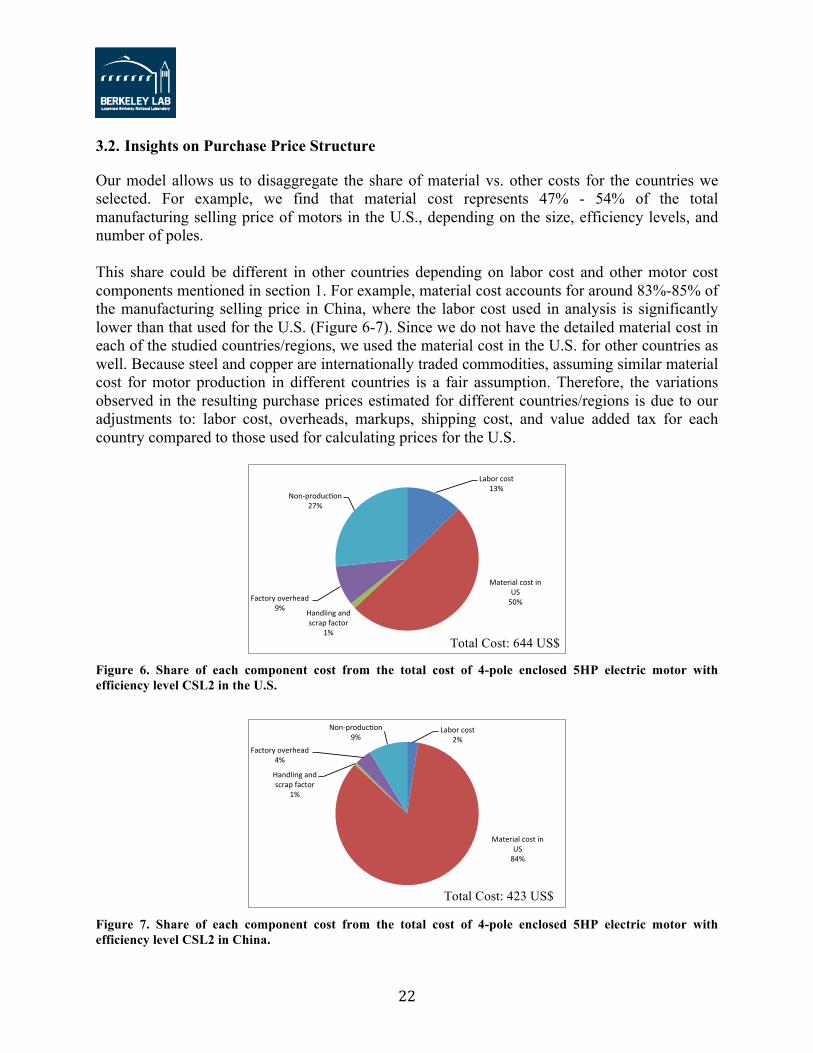
Our model allows us to disaggregate the share of material vs. other costs for the countries we selected. For example, we find that material cost represents 47% - 54% of the total manufacturing selling price of motors in the U.S., depending on the size, efficiency levels, and number of poles. This share could be different in other countries depending on labor cost and other motor cost components mentioned in section 1. For example, material cost accounts for around 83%-85% of the manufacturing selling price in China, where the labor cost used in analysis is significantly lower than that used for the U.S. (Figure 6-7). Since we do not have the detailed material cost in each of the studied countries/regions, we used the material cost in the U.S. for other countries as well. Because steel and copper are internationally traded commodities, assuming similar material cost for motor production in different countries is a fair assumption. Therefore, the variations observed in the resulting purchase prices estimated for different countries/regions is due to our adjustments to: labor cost, overheads, markups, shipping cost, and value added tax for each country compared to those used for calculating prices for the U.S.
Figure 6. Share of each component cost from the total cost of 4-pole enclosed 5HP electric motor with efficiency level CSL2 in the U.S.
Figure 7. Share of each component cost from the total cost of 4-pole enclosed 5HP electric motor with efficiency level CSL2 in China.
Labor&cost&13%&
Material&cost&in&US&50%&
Handling&and&scrap&factor&
1%&
Factory&overhead&9%&
NonAproducCon&27%&
Labor&cost&2%&
Material&cost&in&US&84%&
Handling&and&scrap&factor&
1%&
Factory&overhead&4%&
Non@producBon&9%&
Total Cost: 644 US$
Total Cost: 423 US$

23
4. CONCLUSION
This report presents a methodology that leverages the deep expertise and motor prices dataset that was created as part of the recent rulemaking on motors from the DOE appliance standards program. By detailing each step of our analysis, we hope to provide a clear and transparent methodology to extrapolate costs of efficient motors outside of the U.S. that can be used to determine international purchase prices of motors. In this study, the manufacturer selling price (MSP) and purchase price (PP) for electric motors calculated by DOE for the U.S. were disaggregated into the major components such as labor cost, material cost, various overheads, and markups. This enabled us to adjust each component (except the material cost which was kept constant across countries) for a different country in order to make a reasonable estimation of MSPs and purchase prices of electric motor in each country included in this analysis. The results of the analyses were estimated electric motor purchase prices by type, size, and efficiency level in 18 countries studied. This is an initial effort to estimate the retail price of electric motors for different motor type, size, and efficiency level. Such values are often sought by policy makers, analysts, and other interested parties, but are not readily available. Also, because of the lack of data in many countries, it is difficult to calculate average purchase prices of electric motors in the extent analyzed by DOE. This study aimed at making the methodology more accessible to an international audience and to address the data availability issue. We believe that our methodology will be helpful to analysts and policy makers who want to analyze the energy saving potential by increasing the efficiency of electric motors and the cost associated with that. When policy makers are seeking to implement a standard or any other policy for a specific country, a manufacturer and distributor survey may be designed in order to assess the market, characterize the distribution channel and collect country-specific prices for different motors configurations and efficiency levels. The data collected can be used to calibrate the model of international purchase prices presented in this report and allow for impact analysis of prospective energy efficiency policies.

24
REFERENCES
Benhaddadi, M., G. Olivier, R. Ibtiouen, J. Yelle, and J-F Tremblay, 2011. Premium Efficiency Motors, Electric Machines and Drives, Dr. Miroslav Chomat (Ed.), ISBN: 978-953-307-548-8, InTech, Available from:http://www.intechopen.com/books/electric-machines-and-drives/premium-efficiency-motors IEC, 2014, Rotating electrical machines – Part 30-1: Efficiency classes of line operated AC motors (IE code).
International Energy Agency (IEA), 2007. Tracking Industrial Energy Efficiency and CO2 Emissions. Paris.
Park, W.Y., Phadke, A., Shah, N., Letschert, V., 2011. TV Energy Consumption Trends and Energy-Efficiency Improvement Options. LBNL-5024E.
River Consulting, Evaluación Del Impacto Técnico Económico Para La Implementación de Estándares Mínimos De Eficiencia Energética En Motores Eléctricos, forthcoming, 2014
Sathaye, N., Phadke, A., Shah, N., Letschert, V., 2012. Potential Global Benefits of Improved Ceiling Fan Energy Efficiency. LBNL-5980E.
Shah, N., Waide, P., Phadke, A., 2012. Cooling the Planet: Opportunities for Deployment of Superefficient Air Conditioners Lawrence Berkeley National Laboratory and Navigant Consulting Inc. TMF Group. 2013. International VAT rates. Available at http://www.tmf-vat.com/international-vat-rates.html U.S. Bureau of Labor Statistics (U.S. BLS). 2012. International Comparisons of Hourly Compensation Costs in Manufacturing Industries, by Country, 2008-2011. Available at http://www.bls.gov/ilc/ichcccountry.htm U.S. Department of Energy (DOE). 2014. Technical Support Document: Energy Efficiency Program for Commercial Equipment: Energy Conservation Standards for Electric Motors. Available at http://www1.eere.energy.gov/buildings/appliance_standards/rulemaking.aspx/ruleid/42

25
APPENDIX A. DESCRIPTION OF BASELINE AND CANDIDATE STANDARD LEVELS OF ELECTRIC MOTOR EFFICIENCY IN THE U.S. 2
DOE selected a baseline efficiency level for each representative unit as a reference point against which to measure changes that may result from increasing an electric motor’s efficiency. Each increase in efficiency over the baseline level that DOE analyzed was assigned a CSL number. For the analysis, DOE based its baseline efficiency level, or CSL 0, on the lowest efficiency levels observed in the motor catalog data for the motors DOE plans on including in the expanded scope of conservation standards. DOE selected five additional incremental CSLs. DOE based its first incremental CSL (CSL 1) on NEMA MG1-2011, Table 12-11 and Table 20-A,
which specify the nominal efficiency levels for motors that NEMA classifies as “energy efficient.” Table 12-11 is equivalent to the EPACT 1992 levels for 1 to 200 horsepower NEMA Design B electric motors and the EISA 2007 levels for NEMA Design B electric motors with a horsepower rating greater than 200. DOE based its second incremental CSL (CSL 2) on the NEMA Premium efficiency levels, found in NEMA MG1-2011 Tables 12-12 and 20-B. These tables typically represent a two or three NEMA band improvement above the previously mandated EPACT 1992 levels displayed in NEMA MG1-2011 Table 12-11. The third incremental CSL (CSL 3) is based on motors with the highest efficiencies observed in DOE’s motor database and up-to-date motor catalogs (2011 catalogs). Therefore CSL 3 motors have the “best-in-market” efficiencies. This level was generally one NEMA band above the NEMA Premium level, or CSL 2. This level represents the best or near best efficiency level at which current manufacturers are producing electric motors. CSL 4 represents an incremental level between the maximum available efficiency and the maximum technology (“max-tech”) CSL. CSL 4 is based on a theoretical efficiency achievable using technologically feasible design options that were not screened out. CSL 5 represents the maximum technologically available or “max-tech” efficiency level. DOE based its value of efficiencies for CSL 4 on a physical electric motor, computer-modeled designs and subject matter expert (SME) feedback (DOE 2014).
2 This section is excerpted from U.S. DOE (2014).

26
APPENDIX B. NOMINAL EFFICIENCY VALUES FOR ELECTRIC MOTORS UNDER EACH CSL.
Table A.1. NEMA Design A & B Electric Motors at CSL 0 (U.S. DOE 2014).
5-A-15
Table 5.1 Equipment Class Group 1 at Efficiency Level 0
Horsepower
Nominal Full Load Efficiency (%) 2 Pole 4 Pole 6 Pole 8 Pole
Enclosed Open Enclosed Open Enclosed Open Enclosed Open 1 75.5 75.5 75.5 77.0 75.5 80.0 66.0 72.0 1.5 74.0 80.0 77.0 80.0 75.5 75.5 72.0 75.5 2 77.0 82.5 80.0 78.5 78.5 80.0 78.5 80.0 3 80.0 84.0 78.5 80.0 81.5 82.5 80.0 78.5 5 80.0 81.5 82.5 82.5 84.0 85.5 84.0 82.5 7.5 81.5 84.0 84.0 84.0 82.5 81.5 85.5 84.0 10 82.5 85.5 86.5 87.5 84.0 87.5 84.0 85.5 15 85.5 86.5 86.5 87.5 88.5 85.5 88.5 86.5 20 88.5 88.5 87.5 88.5 87.5 87.5 89.5 86.5 25 91.0 89.5 89.5 85.5 91.7 87.5 88.5 87.5 30 89.5 88.5 89.5 87.5 89.5 87.5 91.0 89.5 40 91.0 88.5 91.0 89.5 89.5 88.5 91.0 89.5 50 92.4 88.5 91.0 89.5 90.2 90.2 91.0 91.0 60 92.4 89.5 91.7 90.2 92.4 89.5 91.0 92.4 75 93.0 89.5 93.0 91.0 92.4 89.5 91.7 93.6 100 93.6 91.0 92.4 92.4 93.0 93.0 91.7 93.6 125 94.5 93.6 92.4 93.0 93.6 93.6 92.4 93.6 150 93.6 92.4 93.6 92.4 95.0 93.0 93.6 93.6 200 95.0 93.6 94.5 93.0 94.5 94.1 93.6 93.6 250 94.5 93.6 94.5 93.6 94.1 94.5 94.1 94.5 300 95.4 95.0 94.1 94.5 94.5 95.4 350 95.4 95.0 95.0 94.5 94.5 95.0 400 95.4 95.4 95.4 95.4 450 95.4 95.8 95.4 95.4 500 95.4 95.8 95.4 95.8

27
Table A.2. NEMA Design A & B Electric Motors at CSL 1 (U.S. DOE 2014).
5-A-16
Table 5.2 Equipment Class Group 1 at Efficiency Level 1
Horsepower
Nominal Full Load Efficiency (%) 2 Pole 4 Pole 6 Pole 8 Pole
Enclosed Open Enclosed Open Enclosed Open Enclosed Open 1 75.5 75.5 82.5 82.5 80.0 80.0 74.0 74.0 1.5 82.5 82.5 84.0 84.0 85.5 84.0 77.0 75.5 2 84.0 84.0 84.0 84.0 86.5 85.5 82.5 85.5 3 85.5 84.0 87.5 86.5 87.5 86.5 84.0 86.5 5 87.5 85.5 87.5 87.5 87.5 87.5 85.5 87.5 7.5 88.5 87.5 89.5 88.5 89.5 88.5 85.5 88.5 10 89.5 88.5 89.5 89.5 89.5 90.2 88.5 89.5 15 90.2 89.5 91.0 91.0 90.2 90.2 88.5 89.5 20 90.2 90.2 91.0 91.0 90.2 91.0 89.5 90.2 25 91.0 91.0 92.4 91.7 91.7 91.7 89.5 90.2 30 91.0 91.0 92.4 92.4 91.7 92.4 91.0 91.0 40 91.7 91.7 93.0 93.0 93.0 93.0 91.0 91.0 50 92.4 92.4 93.0 93.0 93.0 93.0 91.7 91.7 60 93.0 93.0 93.6 93.6 93.6 93.6 91.7 92.4 75 93.0 93.0 94.1 94.1 93.6 93.6 93.0 93.6 100 93.6 93.0 94.5 94.1 94.1 94.1 93.0 93.6 125 94.5 93.6 94.5 94.5 94.1 94.1 93.6 93.6 150 94.5 93.6 95.0 95.0 95.0 94.5 93.6 93.6 200 95.0 94.5 95.0 95.0 95.0 94.5 94.1 93.6 250 95.4 94.5 95.0 95.4 95.0 95.4 94.5 94.5 300 95.4 95.0 95.4 95.4 95.0 95.4 350 95.4 95.0 95.4 95.4 95.0 95.4 400 95.4 95.4 95.4 95.4 450 95.4 95.8 95.4 95.8 500 95.4 95.8 95.8 95.8
28
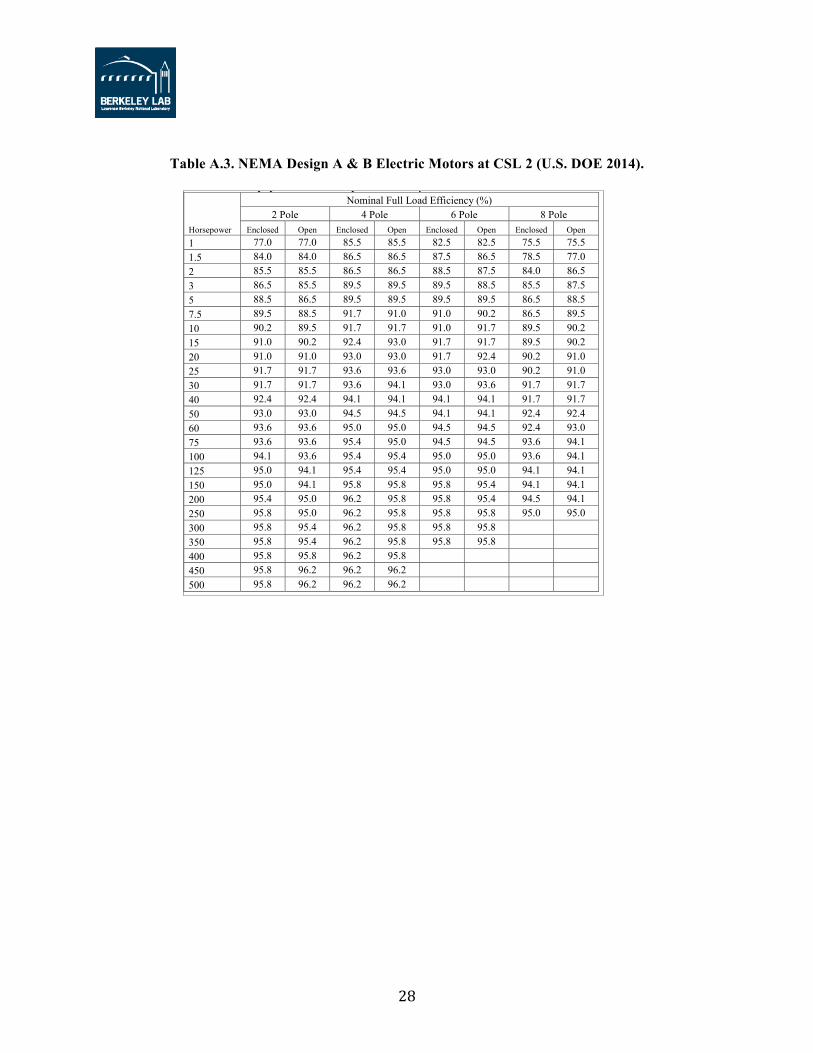
Table A.3. NEMA Design A & B Electric Motors at CSL 2 (U.S. DOE 2014).
5-A-17
Table 5.3 Equipment Class Group 1 at Efficiency Level 2
Horsepower
Nominal Full Load Efficiency (%) 2 Pole 4 Pole 6 Pole 8 Pole
Enclosed Open Enclosed Open Enclosed Open Enclosed Open 1 77.0 77.0 85.5 85.5 82.5 82.5 75.5 75.5 1.5 84.0 84.0 86.5 86.5 87.5 86.5 78.5 77.0 2 85.5 85.5 86.5 86.5 88.5 87.5 84.0 86.5 3 86.5 85.5 89.5 89.5 89.5 88.5 85.5 87.5 5 88.5 86.5 89.5 89.5 89.5 89.5 86.5 88.5 7.5 89.5 88.5 91.7 91.0 91.0 90.2 86.5 89.5 10 90.2 89.5 91.7 91.7 91.0 91.7 89.5 90.2 15 91.0 90.2 92.4 93.0 91.7 91.7 89.5 90.2 20 91.0 91.0 93.0 93.0 91.7 92.4 90.2 91.0 25 91.7 91.7 93.6 93.6 93.0 93.0 90.2 91.0 30 91.7 91.7 93.6 94.1 93.0 93.6 91.7 91.7 40 92.4 92.4 94.1 94.1 94.1 94.1 91.7 91.7 50 93.0 93.0 94.5 94.5 94.1 94.1 92.4 92.4 60 93.6 93.6 95.0 95.0 94.5 94.5 92.4 93.0 75 93.6 93.6 95.4 95.0 94.5 94.5 93.6 94.1 100 94.1 93.6 95.4 95.4 95.0 95.0 93.6 94.1 125 95.0 94.1 95.4 95.4 95.0 95.0 94.1 94.1 150 95.0 94.1 95.8 95.8 95.8 95.4 94.1 94.1 200 95.4 95.0 96.2 95.8 95.8 95.4 94.5 94.1 250 95.8 95.0 96.2 95.8 95.8 95.8 95.0 95.0 300 95.8 95.4 96.2 95.8 95.8 95.8 350 95.8 95.4 96.2 95.8 95.8 95.8 400 95.8 95.8 96.2 95.8 450 95.8 96.2 96.2 96.2 500 95.8 96.2 96.2 96.2

29
Table A.4. NEMA Design A & B Electric Motors at CSL 3 (U.S. DOE 2014).
5-A-18
Table 5.4 Equipment Class Group 1 at Efficiency Level 3
Horsepower
Nominal Full Load Efficiency (%) 2 Pole 4 Pole 6 Pole 8 Pole
Enclosed Open Enclosed Open Enclosed Open Enclosed Open 1 78.5 78.5 86.5 86.5 84.0 84.0 77.0 77.0 1.5 85.5 85.5 87.5 87.5 88.5 87.5 80.0 78.5 2 86.5 86.5 87.5 87.5 89.5 88.5 85.5 87.5 3 87.5 86.5 90.2 90.2 90.2 89.5 86.5 88.5 5 89.5 87.5 90.2 90.2 90.2 90.2 87.5 89.5 7.5 90.2 89.5 92.4 91.7 91.7 91.0 87.5 90.2 10 91.0 90.2 92.4 92.4 91.7 92.4 90.2 91.0 15 91.7 91.0 93.0 93.6 92.4 92.4 90.2 91.0 20 91.7 91.7 93.6 93.6 92.4 93.0 91.0 91.7 25 92.4 92.4 94.1 94.1 93.6 93.6 91.0 91.7 30 92.4 92.4 94.1 94.5 93.6 94.1 92.4 92.4 40 93.0 93.0 94.5 94.5 94.5 94.5 92.4 92.4 50 93.6 93.6 95.0 95.0 94.5 94.5 93.0 93.0 60 94.1 94.1 95.4 95.4 95.0 95.0 93.0 93.6 75 94.1 94.1 95.8 95.4 95.0 95.0 94.1 94.5 100 94.5 94.1 95.8 95.8 95.4 95.4 94.1 94.5 125 95.4 94.5 95.8 95.8 95.4 95.4 94.5 94.5 150 95.4 94.5 96.2 96.2 96.2 95.8 94.5 94.5 200 95.8 95.4 96.5 96.2 96.2 95.8 95.0 94.5 250 96.2 95.4 96.5 96.2 96.2 96.2 95.4 95.4 300 96.2 95.8 96.5 96.2 96.2 96.2 350 96.2 95.8 96.5 96.2 96.2 96.2 400 96.2 96.2 96.5 96.2 450 96.2 96.5 96.5 96.5 500 96.2 96.5 96.5 96.5

30
Table A.5. NEMA Design A & B Electric Motors at CSL 4 (U.S. DOE 2014).
5-A-19
Table 5.5 Equipment Class Group 1 at Efficiency Level 4
Horsepower
Nominal Full Load Efficiency (%) 2 Pole 4 Pole 6 Pole 8 Pole
Enclosed Open Enclosed Open Enclosed Open Enclosed Open 1 80.0 80.0 87.5 87.5 85.5 85.5 78.5 78.5 1.5 86.5 86.5 88.5 88.5 89.5 88.5 81.5 80.0 2 87.5 87.5 88.5 88.5 90.2 89.5 86.5 88.5 3 88.5 87.5 91.0 91.0 91.0 90.2 87.5 89.5 5 90.2 88.5 91.0 91.0 91.0 91.0 88.5 90.2 7.5 91.0 90.2 93.0 92.4 92.4 91.7 88.5 91.0 10 91.7 91.0 93.0 93.0 92.4 93.0 91.0 91.7 15 92.4 91.7 94.1 94.1 93.0 93.0 91.0 91.7 20 92.4 92.4 94.1 94.1 93.0 93.6 91.7 92.4 25 93.0 93.0 94.5 94.5 94.1 94.1 91.7 92.4 30 93.0 93.0 94.5 95.0 94.1 94.5 93.0 93.0 40 93.6 93.6 95.0 95.0 95.0 95.0 93.0 93.0 50 94.1 94.1 95.4 95.4 95.0 95.0 93.6 93.6 60 94.5 94.5 95.8 95.8 95.4 95.4 93.6 94.1 75 94.5 94.5 96.2 95.8 95.4 95.4 94.5 95.0 100 95.0 94.5 96.2 96.2 95.8 95.8 94.5 95.0 125 95.8 95.0 96.2 96.2 95.8 95.8 95.0 95.0 150 95.8 95.0 96.5 96.5 96.5 96.2 95.0 95.0 200 96.2 95.8 96.8 96.5 96.5 96.2 95.4 95.0 250 96.5 95.8 96.8 96.5 96.5 96.5 95.8 95.8 300 96.5 96.2 96.8 96.5 96.5 96.5 350 96.5 96.2 96.8 96.5 96.5 96.5 400 96.5 96.5 96.8 96.5 450 96.5 96.8 96.8 96.8 500 96.5 96.8 96.8 96.8

31
APPENDIX C. MANUFACTURER SELLING PRICES (MSPS) OF ELECTRIC MOTORS IN THE U.S.
Table A.7. MSPs of electric motors (design A & B) for CSL 0 (in 2011 US$) (U.S. DOE 2014).
Enclosed Open
2 4 6 8 2 4 6 8
1 116.42 114.95 117.70 123.40 110.56 111.96 114.12 117.90
1.5 150.67 147.96 153.04 163.55 139.86 142.45 146.43 153.40
2 181.13 176.98 184.74 200.79 164.63 168.57 174.66 185.30
3 235.19 227.80 241.61 270.17 205.83 212.84 223.67 242.60
5 327.72 313.10 340.42 396.95 269.61 283.49 304.93 342.39
7.5 427.14 403.02 448.10 541.38 331.25 354.15 389.53 451.35
10 515.66 482.08 544.86 674.75 382.13 414.03 463.28 549.38
15 672.24 620.52 717.20 917.23 466.60 515.72 591.58 724.17
20 810.85 742.24 870.48 1,135.81 538.08 603.23 703.85 879.72
25 937.21 852.87 1,010.53 1,336.72 601.88 681.98 805.68 1,021.89
30 1,054.50 955.39 1,140.64 1,523.90 660.49 754.60 899.95 1,153.99
40 1,269.06 1,142.80 1,378.81 1,867.10 767.09 886.99 1,072.16 1,395.82
50 1,464.11 1,313.13 1,595.34 2,179.20 863.88 1,007.25 1,228.67 1,615.68
60 1,644.83 1,470.99 1,795.93 2,468.19 953.71 1,118.79 1,373.73 1,819.34
75 1,895.71 1,690.23 2,074.30 2,868.89 1,078.84 1,273.95 1,575.28 2,101.97
100 2,274.82 2,021.79 2,494.75 3,473.23 1,268.89 1,509.16 1,880.24 2,528.82
125 2,619.11 2,323.13 2,876.37 4,020.95 1,442.44 1,723.49 2,157.55 2,916.23
150 2,937.99 2,602.40 3,229.68 4,527.42 1,603.84 1,922.51 2,414.66 3,274.87
200 3,520.50 3,112.89 3,874.79 5,451.05 1,900.03 2,287.09 2,884.86 3,929.68
250 4,049.60 3,576.86 4,460.50 6,288.62 2,170.20 2,619.11 3,312.40 4,524.15
300 4,539.72 4,006.84 5,002.90 7,063.62 2,421.21 2,927.23 3,708.73 5,074.66
350 4,999.67 4,410.47 5,511.80 7,790.30 2,657.26 3,216.76 4,080.85 5,591.14
400 5,435.27 4,792.83 5,993.69 8,478.10 2,881.18 3,491.24 4,433.42 6,080.19
450 5,850.67 5,157.51 6,453.16 9,133.67 3,094.98 3,753.19 4,769.74 6,546.49
500 6,248.90 5,507.19 6,893.60 9,761.91 3,300.16 4,004.48 5,092.24 6,993.48

32
Table A. 8. MSPs of electric motors (design A & B) for CSL 1 (in 2011 US$) (U.S. DOE 2014).
Enclosed Open
2 4 6 8 2 4 6 8
1 116.42 117.08 119.88 125.69 110.56 114.03 114.12 120.08
1.5 155.81 152.99 158.25 169.12 144.63 147.30 151.42 153.40
2 189.32 184.98 193.09 209.87 172.07 176.19 182.55 193.67
3 249.56 241.73 256.37 286.68 205.83 225.85 237.34 257.43
5 354.44 338.63 368.18 429.31 291.59 306.60 329.79 370.31
7.5 469.00 442.52 492.02 541.38 363.71 388.86 427.70 495.59
10 572.31 535.03 604.71 748.87 424.11 459.51 514.18 609.73
15 757.45 699.17 808.11 917.23 525.75 581.09 666.56 815.96
20 923.48 845.34 991.40 1,135.81 612.82 687.02 801.62 1,001.92
25 937.21 979.45 1,010.53 1,535.12 691.21 783.20 925.26 1,173.56
30 1,219.27 1,104.68 1,318.87 1,523.90 763.69 872.51 1,040.57 1,334.30
40 1,483.19 1,335.62 1,611.46 1,867.10 896.52 1,036.65 1,253.06 1,631.33
50 1,464.11 1,547.51 1,880.10 2,568.17 1,018.07 1,187.03 1,447.97 1,904.06
60 1,951.63 1,745.37 2,130.92 2,928.58 1,131.61 1,327.48 1,629.98 1,819.34
75 1,895.71 2,022.27 2,481.79 3,432.46 1,290.77 1,524.21 1,884.74 2,101.97
100 2,274.82 2,445.05 3,017.01 4,200.34 1,534.53 1,825.10 2,273.86 2,528.82
125 2,619.11 2,832.95 3,507.60 4,903.35 1,442.44 2,101.72 2,631.03 2,916.23
150 3,607.17 3,195.15 3,229.68 4,527.42 1,969.15 2,360.40 2,964.65 3,274.87
200 3,520.50 3,863.13 4,808.66 6,764.82 2,357.96 2,838.30 3,580.15 3,929.68
250 5,067.59 4,476.02 5,581.78 7,869.46 2,715.75 3,277.50 4,145.07 4,524.15
300 4,539.72 5,048.29 6,303.25 7,063.62 2,421.21 3,688.07 3,708.73 5,074.66
350 4,999.67 5,588.86 6,984.44 7,790.30 2,657.26 4,076.21 5,171.17 5,591.14
400 5,435.27 4,792.83 7,632.99 8,478.10 2,881.18 3,491.24 4,433.42 6,080.19
450 5,850.67 5,157.51 6,453.16 9,133.67 3,094.98 4,800.75 4,769.74 6,546.49
500 6,248.90 7,072.03 6,893.60 9,761.91 3,300.16 4,004.48 5,092.24 6,993.48

33
Table A. 9. MSPs of electric motors (design A & B) for CSL 2 (in 2011 US$) (U.S. DOE 2014).
Enclosed Open
2 4 6 8 2 4 6 8
1 123.40 121.84 124.76 130.80 117.19 118.67 120.96 124.97
1.5 163.15 160.21 165.71 177.10 151.45 154.24 158.56 166.11
2 199.12 194.56 203.09 220.74 180.98 185.31 192.00 203.70
3 264.12 255.83 271.33 303.40 231.15 239.03 251.19 272.45
5 378.06 361.20 392.72 457.92 311.03 327.04 351.77 394.99
7.5 503.37 474.95 528.08 638.00 390.37 417.36 459.05 531.91
10 616.96 576.78 651.89 807.30 457.20 495.36 554.30 657.30
15 821.64 758.42 876.59 1121.08 570.30 630.33 723.05 885.10
20 1006.16 921.02 1080.16 1409.40 667.69 748.54 873.39 1091.63
25 1176.70 1070.79 1268.75 1678.28 755.67 856.24 1011.55 1283.01
30 1336.71 1211.07 1445.90 1931.74 837.25 956.55 1140.79 1462.82
40 1633.22 1470.73 1774.47 2402.86 987.21 1141.51 1379.82 1796.35
50 1906.49 1709.89 2077.37 2837.64 1124.90 1311.58 1599.90 2103.84
60 2162.44 1933.89 2361.09 3244.91 1253.84 1470.86 1806.04 2391.87
75 2521.70 2248.37 2759.27 3816.24 1435.08 1694.63 2095.47 2796.07
100 3072.13 2730.42 3369.15 4690.58 1713.64 2038.12 2539.26 3415.16
125 3578.86 3174.43 3930.39 5494.39 1971.01 2355.05 2948.17 3984.85
150 4053.27 3590.30 4455.69 6246.08 2212.68 2652.31 3331.29 4518.03
200 4930.96 4360.05 5427.20 7634.98 2661.26 3203.39 4040.66 5504.08
250 5739.01 5069.06 6321.33 8912.11 3075.57 3711.75 4694.26 6411.55
300 6495.60 5733.14 7158.34 10106.90 3464.36 4188.39 5306.58 7261.01
350 7211.95 6362.04 7950.69 11237.41 3833.06 4640.13 5886.56 8065.14
400 7895.56 6962.31 8706.75 12315.74 4185.36 5071.56 6440.22 8832.42
450 8551.81 7538.64 9432.46 13350.51 4523.88 5485.97 6971.83 9568.89
500 9184.66 8094.49 10132.25 14348.09 4850.59 5885.80 7484.60 10279.04

34
Table A. 10. MSPs of electric motors (design A & B) for CSL 3 (in 2011 US$) (U.S. DOE 2014).
Enclosed Open
2 4 6 8 2 4 6 8
1 127.99 126.36 129.39 135.66 121.54 123.08 125.46 129.61
1.5 171.17 168.08 173.85 185.80 158.89 161.82 166.35 174.27
2 210.62 205.79 214.81 233.48 191.42 196.01 203.09 215.46
3 282.60 273.72 290.31 324.63 247.32 255.75 268.76 291.51
5 410.41 392.10 426.32 497.10 337.64 355.02 381.86 428.78
7.5 552.76 521.54 579.89 700.59 428.67 458.31 504.08 584.09
10 683.04 638.55 721.71 893.76 506.16 548.41 613.66 727.70
15 920.15 849.35 981.69 1255.48 638.67 705.91 809.74 991.22
20 1136.02 1039.89 1219.57 1591.30 753.86 845.14 986.12 1232.51
25 1336.99 1216.66 1441.58 1906.91 858.62 972.88 1149.35 1457.79
30 1526.67 1383.18 1651.39 2206.26 956.23 1092.49 1302.91 1670.71
40 1880.60 1693.49 2043.24 2766.81 1136.73 1314.41 1588.82 2068.43
50 2209.18 1981.37 2407.20 3288.18 1303.50 1519.82 1853.92 2437.87
60 2518.76 2252.55 2750.14 3779.59 1460.44 1713.23 2103.63 2785.99
75 2955.85 2635.47 3234.32 4473.26 1682.16 1986.38 2456.24 3277.46
100 3630.53 3226.71 3981.54 5543.16 2025.12 2408.58 3000.80 4035.91
125 4256.20 3775.23 4674.27 6534.27 2344.05 2800.77 3506.15 4739.04
150 4845.38 4291.93 5326.44 7466.71 2645.09 3170.64 3982.31 5400.97
200 5942.86 5254.79 6540.93 9201.78 3207.39 3860.77 4869.86 6633.58
250 6960.61 6148.06 7666.89 10809.15 3730.24 4501.83 5693.48 7776.31
300 7919.08 6989.52 8727.05 12321.76 4223.55 5106.25 6469.49 8852.22
350 8830.91 7790.21 9735.49 13760.01 4693.52 5681.76 7208.00 9875.62
400 9704.65 8557.56 10701.69 15137.61 5144.33 6233.59 7915.84 10856.16
450 10546.40 9296.93 11632.45 16464.34 5579.01 6765.50 8597.92 11800.70
500 11360.74 10012.28 12532.83 17747.52 5999.82 7280.30 9257.89 12714.41

35
Table A. 11. MSPs of electric motors (design A & B) for CSL 4 (in 2011 US$) (U.S. DOE 2014).
Enclosed Open
2 4 6 8 2 4 6 8
1 249.24 246.08 251.98 264.19 236.69 239.69 244.32 252.41
1.5 322.65 316.83 327.71 350.23 299.50 305.03 313.57 328.49
2 387.93 379.04 395.66 430.04 352.58 361.02 374.06 396.86
3 503.82 488.00 517.57 578.75 440.93 455.95 479.15 519.70
5 702.25 670.93 729.47 850.59 577.73 607.48 653.41 733.69
7.5 915.50 863.81 960.44 1160.36 709.98 759.07 834.88 967.40
10 1105.42 1033.42 1168.01 1446.45 819.17 887.55 993.14 1177.70
15 1441.41 1330.50 1537.82 1966.72 1000.48 1105.80 1268.46 1552.75
20 1738.90 1591.76 1866.79 2435.79 1153.94 1293.66 1509.44 1886.60
25 2010.15 1829.24 2167.40 2867.02 1290.92 1462.71 1728.03 2191.77
30 2261.94 2049.35 2446.73 3268.84 1416.77 1618.65 1930.42 2475.35
40 2722.65 2451.76 2958.10 4005.66 1645.71 1902.94 2300.21 2994.58
50 3141.50 2817.55 3423.08 4675.85 1853.60 2161.22 2636.32 3466.71
60 3529.62 3156.58 3853.87 5296.47 2046.57 2400.80 2947.89 3904.10
75 4068.50 3627.53 4451.80 6157.12 2315.36 2734.11 3380.83 4511.18
100 4882.94 4339.82 5355.03 7455.36 2723.71 3239.45 4035.97 5428.16
125 5622.70 4987.30 6174.99 8632.16 3096.62 3699.99 4631.83 6260.55
150 6307.92 5587.41 6934.19 9720.48 3443.49 4127.67 5184.33 7031.21
200 7559.83 6684.55 8320.63 11705.45 4080.08 4911.23 6194.88 8438.49
250 8697.12 7681.85 9579.59 13505.76 4660.84 5624.93 7113.87 9716.30
300 9750.75 8606.19 10745.61 15171.78 5200.46 6287.32 7965.88 10899.73
350 10739.60 9473.97 11839.70 16734.08 5707.97 6909.80 8765.92 12010.13
400 11676.21 10296.09 12875.81 18212.90 6189.44 7499.98 9523.99 13061.65
450 12569.42 11080.26 13863.79 19622.53 6649.18 8063.26 10247.18 14064.32
500 13425.79 11832.21 14810.93 20973.49 7090.40 8603.64 10940.70 15025.51