methodology to determine housing characteristics in …
TRANSCRIPT
European Network for Housing Research (ENHR) Annual Conference 2017, Tirana, Albania
1
METHODOLOGY TO DETERMINE HOUSING
CHARACTERISTICS IN LESS DEVELOPED AREAS IN
DEVELOPING COUNTRIES: A CASE STUDY OF QUETTA,
PAKISTAN
Mahar, Waqas Ahmed; Knapen, Elke; Verbeeck, Griet Faculty of Architecture & Arts, Hasselt University, Campus Diepenbeek, Agoralaan, Gebouw E,
3590 Diepenbeek, Belgium
e-mail: [email protected], [email protected], [email protected]
Abstract The province of Balochistan is one of the least developed areas of Pakistan, facing problems of energy shortage
and rapid urbanization. On the other side the region has great potential for renewable energy sources and the
development of sustainable housing concepts. However, a first barrier is the lack of data on the existing housing
stock. This paper will discuss the methodology and results of collecting housing data in this context for Quetta
city. Considering unsatisfactory law and order situation, a survey was conducted to identify safe areas for
housing survey. More areas were included to make the survey more representative. In total 215 houses in 32
residential areas were then surveyed. It is found that housing in Quetta can be divided in 3 main types; i.e. R.C.C
frame, brick masonry and sundried bricks and that the energy consumption is mainly determined by area of the
house and household size.
Keywords: housing data, household characteristics, material use, energy consumption, developing
countries
Introduction
Pakistan is 6th most populous country in the world with an estimated population of 197 million (PWD,
2017). There is a wide diversity of climatic zones, cultural identities and housing types. Moreover,
there is large population growth in the country and a trend of rural-urban migration which increases
the urban population and problems at the same time. According to Kugelman (2013), the urban
population is increasing at an annual rate of 3% which is the fastest pace in South Asia. As per an
estimation of United Nations Population Division, nearly half of the country’s population will live in
cities by 2025. The country is facing a serious energy crisis since the last decade which greatly
affected the lives of common man. On the other hand, due to its climate the country has great potential
for alternative and renewable energy (Shaikh, Ji, & Fan, 2015). The government of Pakistan is
focusing on renewable energy sources and new projects have been installed to generate energy from
wind and solar sources in various parts of Pakistan.
In Pakistan, the province of Balochistan is one of the most deprived and less developed areas and
Quetta is the provincial capital and 9th largest city of the country (PBS, 1998). The total area of Quetta
district is 2, 653 sq.km. The major ethnic groups living in Quetta are Pashtoon, Baloch, Hazara and
Punjabi. Quetta is located in North-West of Balochistan near the Pakistan-Afghanistan border (figure
1) and it is trade and communication centre between the two countries. The terrain of Quetta district
varies from 1390 m to 3455 m above the sea level. The city is located in an earthquake zone and
approx. 60,000 people died during the earthquake of 1935. The climate of Quetta is dry, arid: mild to
extreme cold in winter and hot in summer. Quetta lies out of monsoon range, but it receives snowfall

European Network for Housing Research (ENHR) Annual Conference 2017, Tirana, Albania
2
mostly in the months of December, January and February (P&D, 2011). The climate of Quetta has
significant variations during winter and summer. The average recorded temperatures in summer were
31 ºC and in winter 7 ºC during 2009-2016 (Online, 2017). In recent years, law and order situation in
Quetta is unsatisfactory (P&D, 2011; BBC, 2016; DAWN, 2016). (BBC, 2016) (DAWN, 2016)
Figure 1. Location of Quetta
(Source: https://thepeopleofpakistan.files.wordpress.com/2010/02/clear_pakistan_map21.gif?w=630)
The energy crisis in Pakistan also affected the residents of Quetta. People living in urban areas face 4-
6h per day load shedding (outage) of electricity in winter and 6-8h per day in summer (QESCO, 2016).
One of the reasons for the energy crisis is enormous population growth from 260,000 in 1975 to 1.2
million in 2010, mostly due to migration from Afghanistan (Abdul S., Shuhab D., & Din M., 2013).
However, the city and its surrounding areas have great potential for renewable energy sources (NREL,
2007a) (NREL, 2007b). (Kugelman, 2013)
As in many other developing cities around the world, the development of sustainable housing and the
maintenance of existing housing stock in liveable conditions remains an acute and intractable problem
in Quetta. Housing is an important part of the human life and the urban environment and housing
conditions reflect many issues including socio-economic status, health and well-being of the residents
and their identity (Gibson, et al., 2011) (Alnsour, 2011). The study focuses on the improvement of
energy efficiency of the most common housing type in Quetta. Therefore, the aim of this research is to
develop a methodology for the development of sustainable houses in Quetta.
However, the available data on the existing housing stock of Quetta is very limited or out-dated since
the Quetta Master Plan was developed in 1985 and the available census data is from 1998. The city has
seen several changes and growth in the last 17 years due to the War on Terror and internal migration
from various parts of Balochistan. Therefore, as a starting point for this research, the conditions, and
characteristics of the existing housing stock in Quetta are analysed. The paper provide introduction to
study area, methods followed to complete this research and present the results and conclusion.
(MPQ, 1980s) (NESPAK, 1985)
The study area
Quetta city is the part of Quetta district which covers Metropolitan Area and cantonment. The
available knowledge about housing and demographics of Quetta is very limited or outdated, since the
last master plan report (1980s), and a complete master plan was developed in 1985 and the available
census data is from 1998 (MPQ, 1980s; NESPAK, 1985; PBS, 1998). However, a recent census was

European Network for Housing Research (ENHR) Annual Conference 2017, Tirana, Albania
3
conducted during March- May 2017 and the collected information is under process. Historically, the
city of Quetta went through several changes. The present city of Quetta was developed during the
British period. It remained under British control during 1839-1842 and again during 1876-1947.
British government developed Quetta as a garrison town (Quetta-Pishin district) due to its
geographical importance and connected it via road and rail network to Afghanistan and Iran (P&D,
2011). A major earthquake in 1935 completely destroyed the city area. However, the cantonment area
survived to a great extent (PESA, 2015). It remained an administrative unit of West Pakistan and later
became capital of Balochistan province. The city has grown a lot especially in the last 2 decades due to
internal, international migration and being the only urbanized city of the province. Quetta
Development Authority (QDA) was established in 1978 by the Government of Balochistan to cater the
needs of housing, planning, development and improvement of Quetta Tehsil including Quetta
Municipal Corporation limits and all other units which the government may notify from time to time
(QDA, 2016). Many development schemes were planned under Quetta Master Plan and nearly half of
them are completed so far. Since, the city has witnessed major expansion and increase in the
population there is a need of new master and development plans. Unavailability of qualified and
trained staff also remained a major problem and so far, there are only 7 architects and there is no
qualified town planner working in Quetta Development Authority (QDA, 2017).
Methodology
In order to find out the characteristics of the existing housing stock of Quetta, a housing survey was
conducted. However, since the law and order situation in Quetta is unsatisfactory (P&D, 2011), it was
essential to know more about the safety level of housing areas in order for the students and staff to be
able to visit and conduct a housing survey. So, the research methodology included two steps, 1)
identification of safe areas and 2) inventory of the housing stock to determine housing characteristics.
Several areas of Quetta have been affected due to terrorist attacks and activities. The opinion of local
authorities and local population vary on the safety of areas and localities. It was decided to seek the
opinion of local population on the safety of residential areas rather than local authorities to get opinion
of diverse and large group of people. For the inventory of housing stock, both primary and secondary
data sources were used to complete this study. Primary data were obtained using a structured
household questionnaire which was filled during housing survey. Secondary data was collected and
reviewed from literature, and information provided by Quetta Development Authority (QDA), Water
& Power Development Authority (WAPDA), Quetta Electric Supply Company (QESCO), and Water
& Sewerage Authority (WASA).
Safety questionnaire
The city of Quetta was divided in 11 areas with reference to the familiarity of the local population with
the major roads and links (Figure 2). It was then confirmed with the map provided by Quetta
Development Authority (QDA) which shows the distribution of areas with the connection of road
networks. Areas with less and scattered population were not included in this survey. Quetta
Cantonment areas were also not included since it is difficult to get permission for visit and cantonment
authority does not follow the bylaws and regulations of Quetta city. The selected 11 areas were further
divided into several sub-areas based on the major neighbourhood and housing located in each area. A
safety questionnaire was developed and distributed online via email and social apps, i.e. Facebook,
WhatsApp. It was possible to fill the questionnaire using computer, mobile phone or tablet. The survey
period was 2 weeks from 19/9/2016 to 4/10/2016. In total 497 emails were sent to people from various
walks of life including academicians, medical professionals, lawyers, media persons, civil servants,
students, social workers, traders and businessman etc. In total, 242 people started the survey and 221
completed it. The 21 partly filled questionnaires were not included in the results. The questionnaire
includes questions on demographic information of the respondent, and his/her familiarity with specific
areas and sub-areas of Quetta city. Once the respondents consider any area familiar, then a question

European Network for Housing Research (ENHR) Annual Conference 2017, Tirana, Albania
4
about sub-areas appears to select familiar sub-areas. After the selection of sub-area(s), the respondent
had to mark sub-area(s) “safe”, “unsafe” or “I don’t know”.
Figure 2. Map of Quetta city with the classification of areas for safety questionnaire
Housing stock survey
The residential areas which were more familiar and marked safe by most the respondents who live and
visited those areas were considered safe. For housing stock survey, initially, 12 out of 14 (safely
marked) areas were selected. However, in order to get a more representative sample of Quetta, 18
additional housing areas were also included to represent various housing typologies (public, slum, real
estate etc.), old and new housing developments, and various ethnic, religious and income groups.
The classification of residential areas in some studies was done based on rent and amenity value
(Kanton, 2007) (TAMA, 2003). In the case of Quetta it was not possible to classify housing based on
rent, amenity value or income level due to lack of available information. Two Master Plans prepared
for Quetta identified slums, informal settlements, old neighbourhood and proposed future
developments in the city (MPQ, 1980s) (NESPAK, 1985). The details of new and planned
developments are also discussed in a report by AlHasan systems private limited (PESA, 2015). Based
on that information additional areas were selected and classified in order to focus on variety of housing
types including slums, informal settlements, planned schemes, real-estate developments, old
neighbourhoods, and public and private housing areas. The classification of all 32 residential areas
selected for housing survey is given in Table 1.
European Network for Housing Research (ENHR) Annual Conference 2017, Tirana, Albania
5
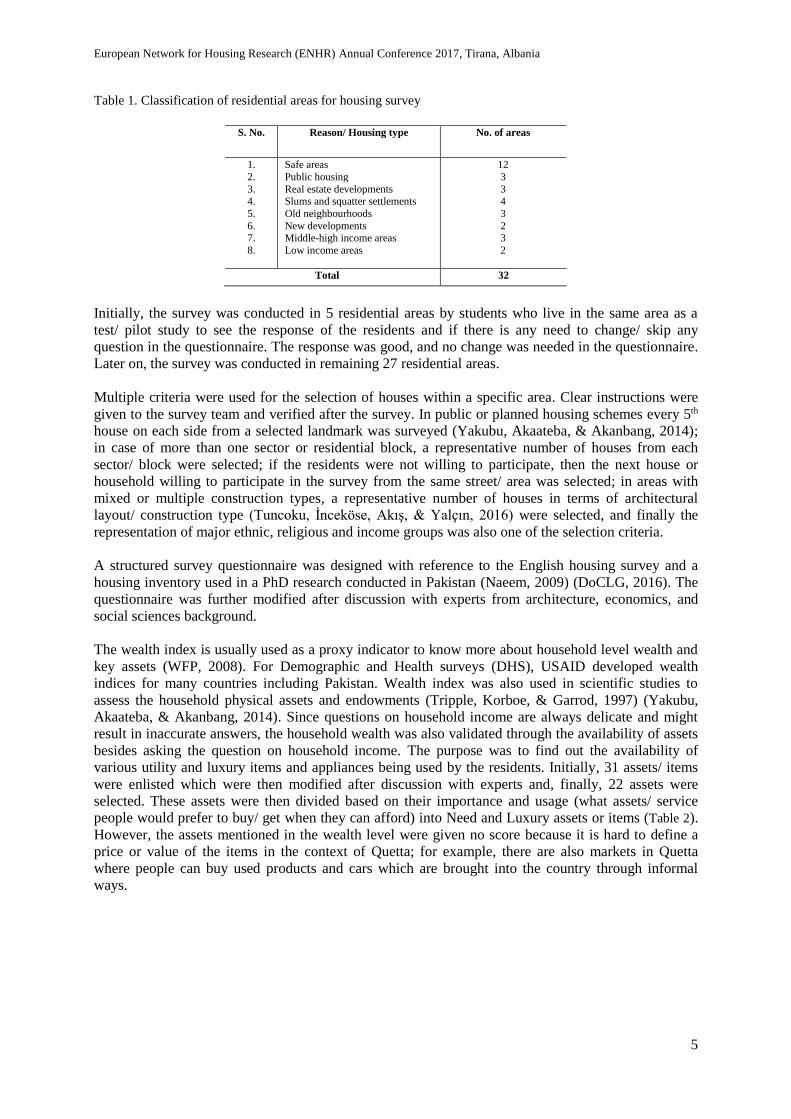
Table 1. Classification of residential areas for housing survey
S. No.
Reason/ Housing type
No. of areas
1.
2.
3. 4.
5.
6. 7.
8.
Safe areas
Public housing
Real estate developments Slums and squatter settlements
Old neighbourhoods
New developments Middle-high income areas
Low income areas
12
3
3 4
3
2 3
2
Total 32
Initially, the survey was conducted in 5 residential areas by students who live in the same area as a
test/ pilot study to see the response of the residents and if there is any need to change/ skip any
question in the questionnaire. The response was good, and no change was needed in the questionnaire.
Later on, the survey was conducted in remaining 27 residential areas.
Multiple criteria were used for the selection of houses within a specific area. Clear instructions were
given to the survey team and verified after the survey. In public or planned housing schemes every 5th
house on each side from a selected landmark was surveyed (Yakubu, Akaateba, & Akanbang, 2014);
in case of more than one sector or residential block, a representative number of houses from each
sector/ block were selected; if the residents were not willing to participate, then the next house or
household willing to participate in the survey from the same street/ area was selected; in areas with
mixed or multiple construction types, a representative number of houses in terms of architectural
layout/ construction type (Tuncoku, İnceköse, Akış, & Yalçın, 2016) were selected, and finally the
representation of major ethnic, religious and income groups was also one of the selection criteria.
A structured survey questionnaire was designed with reference to the English housing survey and a
housing inventory used in a PhD research conducted in Pakistan (Naeem, 2009) (DoCLG, 2016). The
questionnaire was further modified after discussion with experts from architecture, economics, and
social sciences background.
The wealth index is usually used as a proxy indicator to know more about household level wealth and
key assets (WFP, 2008). For Demographic and Health surveys (DHS), USAID developed wealth
indices for many countries including Pakistan. Wealth index was also used in scientific studies to
assess the household physical assets and endowments (Tripple, Korboe, & Garrod, 1997) (Yakubu,
Akaateba, & Akanbang, 2014). Since questions on household income are always delicate and might
result in inaccurate answers, the household wealth was also validated through the availability of assets
besides asking the question on household income. The purpose was to find out the availability of
various utility and luxury items and appliances being used by the residents. Initially, 31 assets/ items
were enlisted which were then modified after discussion with experts and, finally, 22 assets were
selected. These assets were then divided based on their importance and usage (what assets/ service
people would prefer to buy/ get when they can afford) into Need and Luxury assets or items (Table 2).
However, the assets mentioned in the wealth level were given no score because it is hard to define a
price or value of the items in the context of Quetta; for example, there are also markets in Quetta
where people can buy used products and cars which are brought into the country through informal
ways.

European Network for Housing Research (ENHR) Annual Conference 2017, Tirana, Albania
6
Table 2. Wealth level assets for Quetta
S. No. Assets
NEED LUXURY
1
2 3
4
5 6
7
8 9
10
11
Electricity
Natural gas Fan/ Air Cooler
Press Iron
Room heater Mobile phone
Television
Washing machine Water geyser/ boiler
Refrigerator
Motorcycle or scooter
Charpai (local bed)
Bed Dining table
Sofa
Microwave oven Vacuum cleaner
Air-conditioner
Computer Internet connection
Car
Domestic servant in household
As mentioned by Barry & Rüther (2005), employing literate members of the community for
socioeconomic data collection is effective to register more people. Therefore, the survey was
conducted with the help of local contact persons who also possess specific knowledge about housing
and construction and who can speak local language(s) for easy communication with the residents. This
includes 3rd year onward students of architecture department, staff member(s) of civil engineering and
architecture of Balochistan University of Information Technology, Engineering & Management
Sciences (BUITEMS) Quetta, practicing architects and non-government organizations (NGOs). The
number of houses surveyed per survey team can be seen in Table 3. (Barry & Rüther, 2005)
Table 3. Details of the survey team
S. No. Survey done by No. of houses
1.
2.
3. 4.
Students
Architects
University staff NGOs
125
33
27 30
Total 215
In total, 224 questionnaires returned and after sorting 215 questionnaires were included for the result
of this survey. The excluded 9 questionnaires were either partly filled or several questions were
skipped or left blank which provided incomplete information.
Results and discussion
Safety questionnaire
The majority of the respondents of safety questionnaire were male (82%) and their ages were between
21 to 30y (76%). During a survey conducted in Pakistan, it was observed that internet is more popular
among the people between the ages of 18-35y and male internet users are higher (87%) than female
(13%) (The Express Tribune, 2013). 61% respondents possess a bachelor degree and 52% of them
were employed. The familiarity of areas varies from higher in the North of Quetta and the city centre
to lower in the South, East and West of Quetta city. In total, 14 residential areas were found safe.
Housing survey
The results of housing survey are categorised as 1) characteristics of households (socio-demographic
information, household size etc.), 2) general housing characteristics (plot size, construction year), 3)
construction type and main construction materials, 4) housing characteristics of the most common
housing types and 5) socio-demographic profile and energy consumption of R.C.C houses.
European Network for Housing Research (ENHR) Annual Conference 2017, Tirana, Albania
7
0%
20%
40%
60%
80%
100%
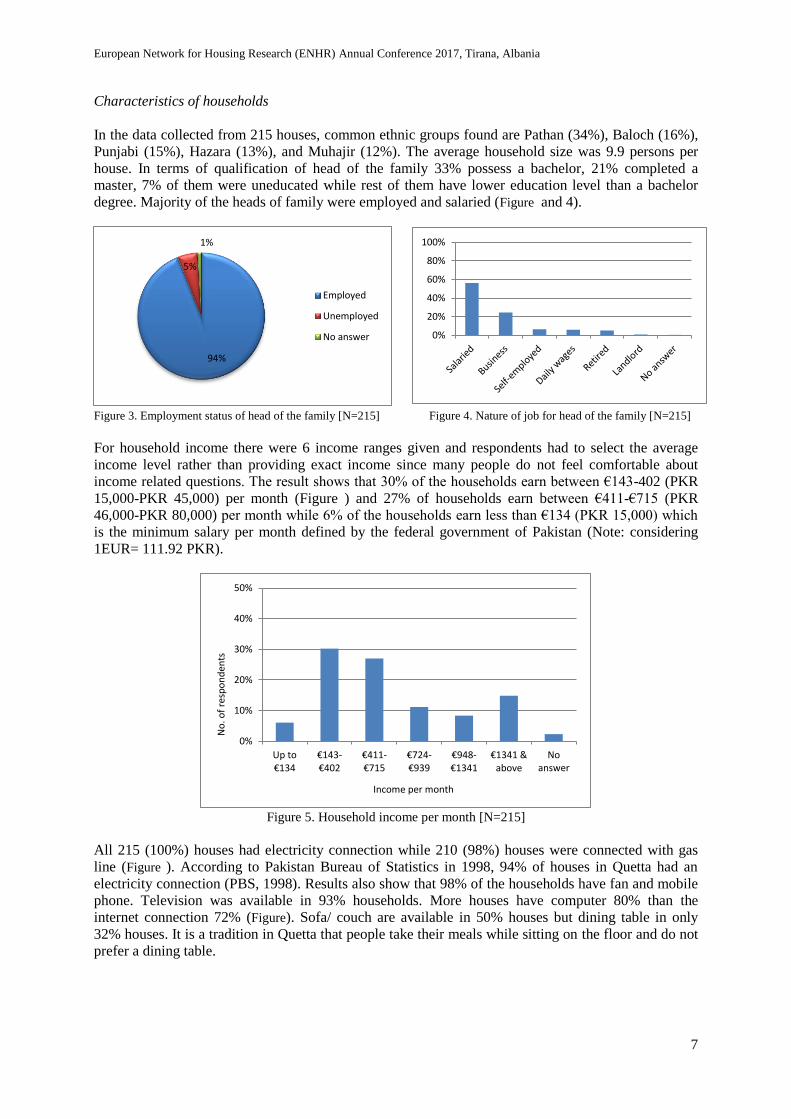
Characteristics of households
In the data collected from 215 houses, common ethnic groups found are Pathan (34%), Baloch (16%),
Punjabi (15%), Hazara (13%), and Muhajir (12%). The average household size was 9.9 persons per
house. In terms of qualification of head of the family 33% possess a bachelor, 21% completed a
master, 7% of them were uneducated while rest of them have lower education level than a bachelor
degree. Majority of the heads of family were employed and salaried (Figure and 4).
Figure 3. Employment status of head of the family [N=215] Figure 4. Nature of job for head of the family [N=215]
For household income there were 6 income ranges given and respondents had to select the average
income level rather than providing exact income since many people do not feel comfortable about
income related questions. The result shows that 30% of the households earn between €143-402 (PKR
15,000-PKR 45,000) per month (Figure ) and 27% of households earn between €411-€715 (PKR
46,000-PKR 80,000) per month while 6% of the households earn less than €134 (PKR 15,000) which
is the minimum salary per month defined by the federal government of Pakistan (Note: considering
1EUR= 111.92 PKR).
Figure 5. Household income per month [N=215]
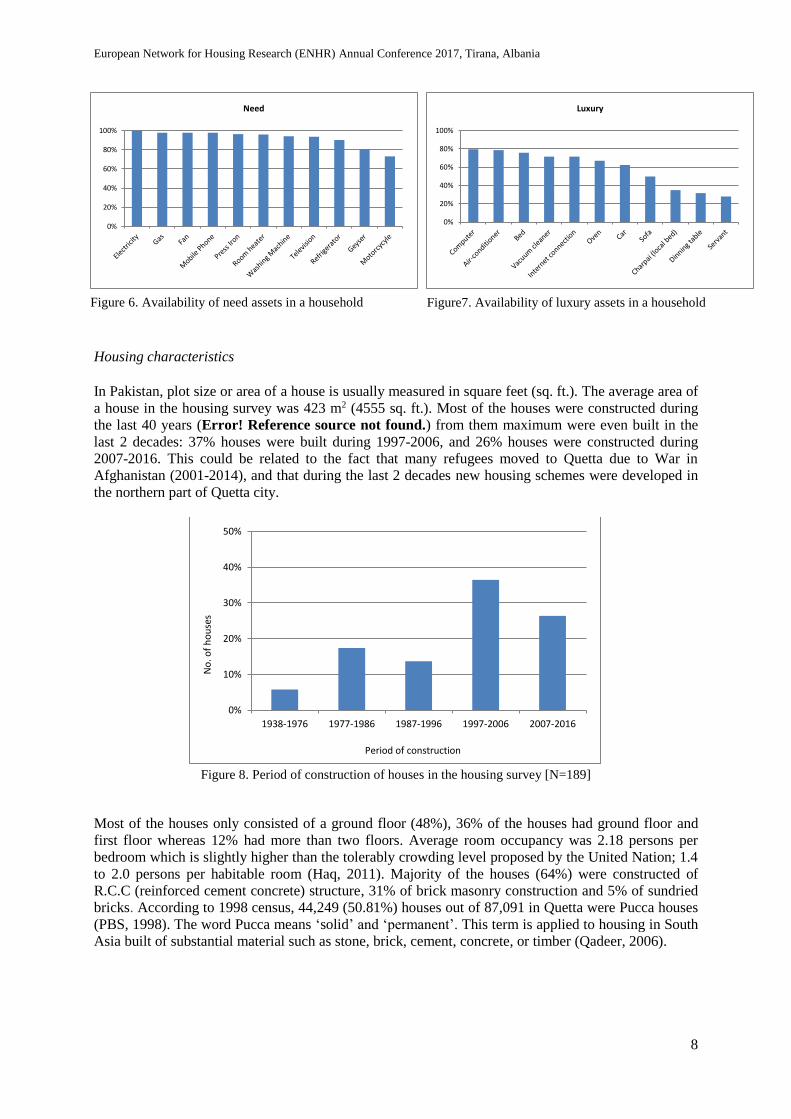
All 215 (100%) houses had electricity connection while 210 (98%) houses were connected with gas
line (Figure ). According to Pakistan Bureau of Statistics in 1998, 94% of houses in Quetta had an
electricity connection (PBS, 1998). Results also show that 98% of the households have fan and mobile
phone. Television was available in 93% households. More houses have computer 80% than the
internet connection 72% (Figure). Sofa/ couch are available in 50% houses but dining table in only
32% houses. It is a tradition in Quetta that people take their meals while sitting on the floor and do not
prefer a dining table.
94%
5%
1%
Employed
Unemployed
No answer
0%
10%
20%
30%
40%
50%
Up to €134
€143-€402
€411-€715
€724-€939
€948-€1341
€1341 & above
Noanswer
No
. of
resp
on
den
ts
Income per month
European Network for Housing Research (ENHR) Annual Conference 2017, Tirana, Albania
8
0%
20%
40%
60%
80%
100%
Luxury
0%
20%
40%
60%
80%
100%
Need
Housing characteristics
In Pakistan, plot size or area of a house is usually measured in square feet (sq. ft.). The average area of
a house in the housing survey was 423 m2 (4555 sq. ft.). Most of the houses were constructed during
the last 40 years (Error! Reference source not found.) from them maximum were even built in the
last 2 decades: 37% houses were built during 1997-2006, and 26% houses were constructed during
2007-2016. This could be related to the fact that many refugees moved to Quetta due to War in
Afghanistan (2001-2014), and that during the last 2 decades new housing schemes were developed in
the northern part of Quetta city.
Figure 8. Period of construction of houses in the housing survey [N=189]
Most of the houses only consisted of a ground floor (48%), 36% of the houses had ground floor and
first floor whereas 12% had more than two floors. Average room occupancy was 2.18 persons per
bedroom which is slightly higher than the tolerably crowding level proposed by the United Nation; 1.4
to 2.0 persons per habitable room (Haq, 2011). Majority of the houses (64%) were constructed of
R.C.C (reinforced cement concrete) structure, 31% of brick masonry construction and 5% of sundried
bricks. According to 1998 census, 44,249 (50.81%) houses out of 87,091 in Quetta were Pucca houses
(PBS, 1998). The word Pucca means ‘solid’ and ‘permanent’. This term is applied to housing in South
Asia built of substantial material such as stone, brick, cement, concrete, or timber (Qadeer, 2006).
0%
10%
20%
30%
40%
50%
1938-1976 1977-1986 1987-1996 1997-2006 2007-2016
No
. of
ho
use
s
Period of construction
Figure 6. Availability of need assets in a household Figure7. Availability of luxury assets in a household

European Network for Housing Research (ENHR) Annual Conference 2017, Tirana, Albania
9
Construction type and main construction materials
The housing in Quetta can be divided in three main construction types; i.e. R.C.C frame houses, brick
masonry houses and sundried brick houses. The materials composition for all these three structural
types is stated in
Table 4. In R.C.C houses walls were constructed of baked bricks (98%) and concrete blocks (2%),
with cemented floor (96%) and R.C.C roof (100%). Many houses (68%) used single glazed windows
and 32% houses had double glazed windows. In brick masonry houses, the walls were filled with
baked bricks (97%) and concrete blocks (3%), floor was mainly cemented (85%), roofs found in 4
different compositions and 81% of the houses had single glazed windows. In sundried brick houses
walls were built of sundried bricks (73%) and rammed earth (27%), floors were earthen (45%), bricks
(36%) and cemented (19%) as well. Roofs were girder/t-iron (46%), wooden beams with bamboos
(45%) and wooden beams with girders (9%).
Table 4. Material composition of housing units in housing survey
Building part/ material R.C.C
frame (%)
Brick
masonry (%)
Sundried
brick (%)
Construction of walls
Baked brick
Concrete blocks
Sundried brick Rammed earth
Flooring material
Cement
Baked brick
Earth/ sand/ mud Wood
Roofing material
RCC roof
Girder/ T-iron
Wooden beams with bamboos
Wooden beams with girder Insulation
Walls
Floor Roof
Windows glazing
Single glazed Double glazed
98
2
96
1
2 1
100
4
2 3
68 32
97
3
85
5
10
52
31
9
8
7
3 4
81 19
73 27
19
36
45
46
45
9
82 18
Housing characteristics of the most common housing types
R.C.C and brick masonry houses were mainly built during last 4 decades with more units have been
constructed during 1997-2006. Plot size (average) of houses varies from larger in R.C.C houses (434
m2) to smaller (205 m2) in houses constructed with sundried bricks. R.C.C houses also had more
number of bedrooms where 21 houses with 6 bedrooms; in brick masonry houses 13 houses had 4
bedrooms while 3 houses had 2-3 bedroom in sundried brick houses. Direct heating system was most
common in all types of housing and less houses use central heating system (Table 5).
European Network for Housing Research (ENHR) Annual Conference 2017, Tirana, Albania
10
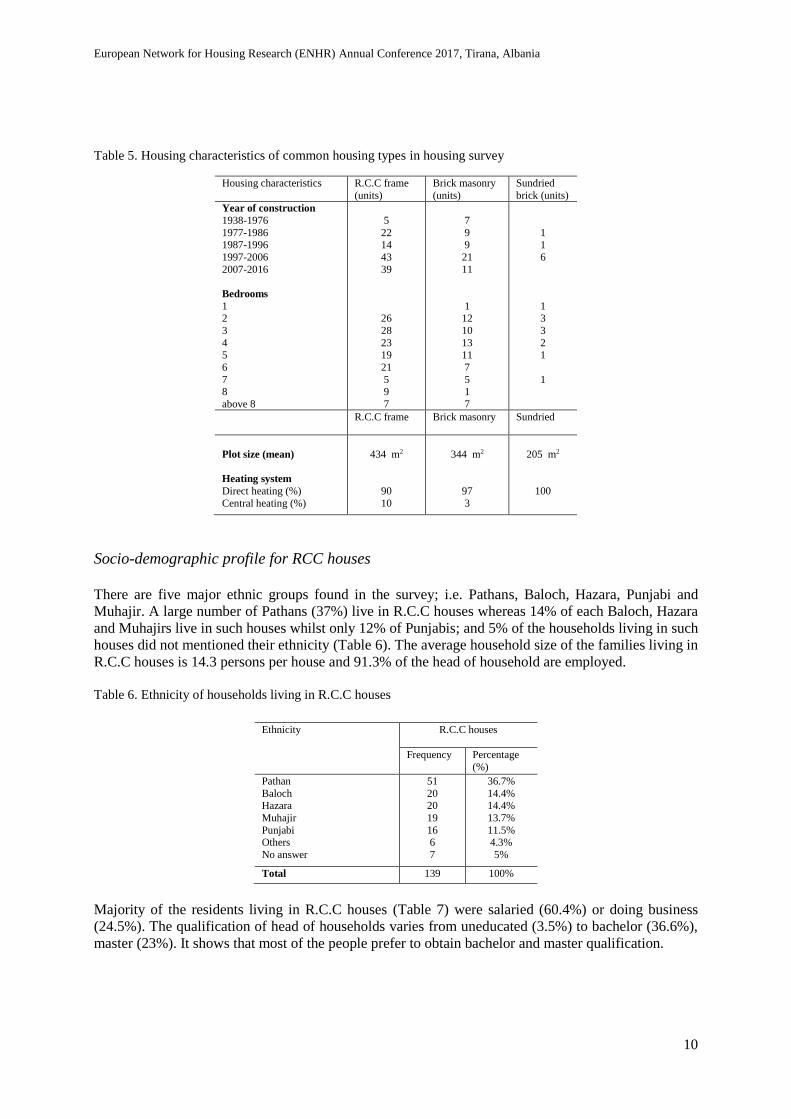
Table 5. Housing characteristics of common housing types in housing survey
Housing characteristics R.C.C frame
(units)
Brick masonry
(units)
Sundried
brick (units)
Year of construction
1938-1976
1977-1986 1987-1996
1997-2006
2007-2016
Bedrooms
1 2
3
4
5
6
7 8
above 8
5
22 14
43
39
26
28
23
19
21
5 9
7
7
9 9
21
11
1 12
10
13
11
7
5 1
7
1 1
6
1 3
3
2
1
1
R.C.C frame Brick masonry Sundried
Plot size (mean)
Heating system
Direct heating (%)
Central heating (%)
434 m2
90
10
344 m2
97
3
205 m2
100
Socio-demographic profile for RCC houses
There are five major ethnic groups found in the survey; i.e. Pathans, Baloch, Hazara, Punjabi and
Muhajir. A large number of Pathans (37%) live in R.C.C houses whereas 14% of each Baloch, Hazara
and Muhajirs live in such houses whilst only 12% of Punjabis; and 5% of the households living in such
houses did not mentioned their ethnicity (Table 6). The average household size of the families living in
R.C.C houses is 14.3 persons per house and 91.3% of the head of household are employed.
Table 6. Ethnicity of households living in R.C.C houses
Ethnicity R.C.C houses
Frequency Percentage
(%)
Pathan
Baloch Hazara
Muhajir
Punjabi Others
No answer
51
20 20
19
16 6
7
36.7%
14.4% 14.4%
13.7%
11.5% 4.3%
5%
Total 139 100%
Majority of the residents living in R.C.C houses (Table 7) were salaried (60.4%) or doing business
(24.5%). The qualification of head of households varies from uneducated (3.5%) to bachelor (36.6%),
master (23%). It shows that most of the people prefer to obtain bachelor and master qualification.
European Network for Housing Research (ENHR) Annual Conference 2017, Tirana, Albania
11
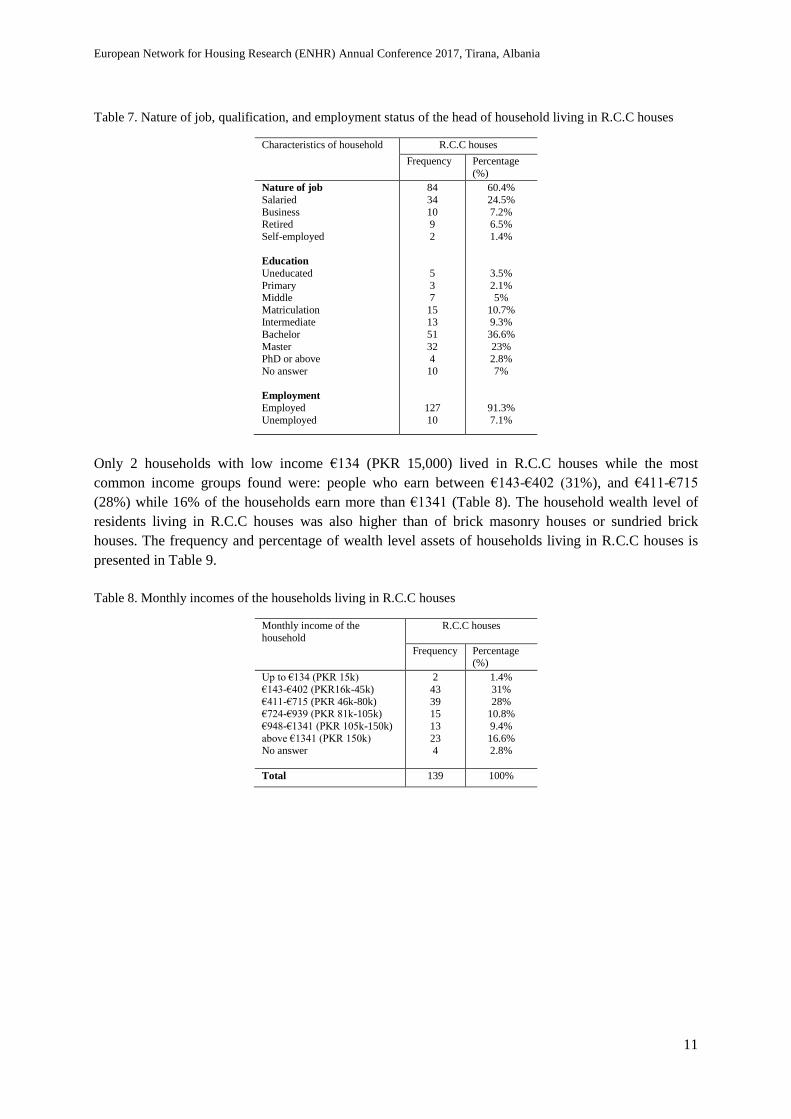
Table 7. Nature of job, qualification, and employment status of the head of household living in R.C.C houses
Characteristics of household R.C.C houses
Frequency Percentage
(%)
Nature of job
Salaried
Business Retired
Self-employed
Education
Uneducated
Primary Middle
Matriculation Intermediate
Bachelor
Master
PhD or above
No answer
Employment
Employed
Unemployed
84
34
10 9
2
5
3 7
15 13
51
32
4
10
127
10
60.4%
24.5%
7.2% 6.5%
1.4%
3.5%
2.1% 5%
10.7% 9.3%
36.6%
23%
2.8%
7%
91.3%
7.1%
Only 2 households with low income €134 (PKR 15,000) lived in R.C.C houses while the most
common income groups found were: people who earn between €143-€402 (31%), and €411-€715
(28%) while 16% of the households earn more than €1341 (Table 8). The household wealth level of
residents living in R.C.C houses was also higher than of brick masonry houses or sundried brick
houses. The frequency and percentage of wealth level assets of households living in R.C.C houses is
presented in Table 9.
Table 8. Monthly incomes of the households living in R.C.C houses
Monthly income of the
household
R.C.C houses
Frequency Percentage (%)
Up to €134 (PKR 15k)
€143-€402 (PKR16k-45k)
€411-€715 (PKR 46k-80k) €724-€939 (PKR 81k-105k)
€948-€1341 (PKR 105k-150k)
above €1341 (PKR 150k) No answer
2
43
39 15
13
23 4
1.4%
31%
28% 10.8%
9.4%
16.6% 2.8%
Total 139 100%
European Network for Housing Research (ENHR) Annual Conference 2017, Tirana, Albania
12
0%
10%
20%
30%
less than €9
€9-€18 €18-€27 €27-€45 €45 and above
Bill/ cost
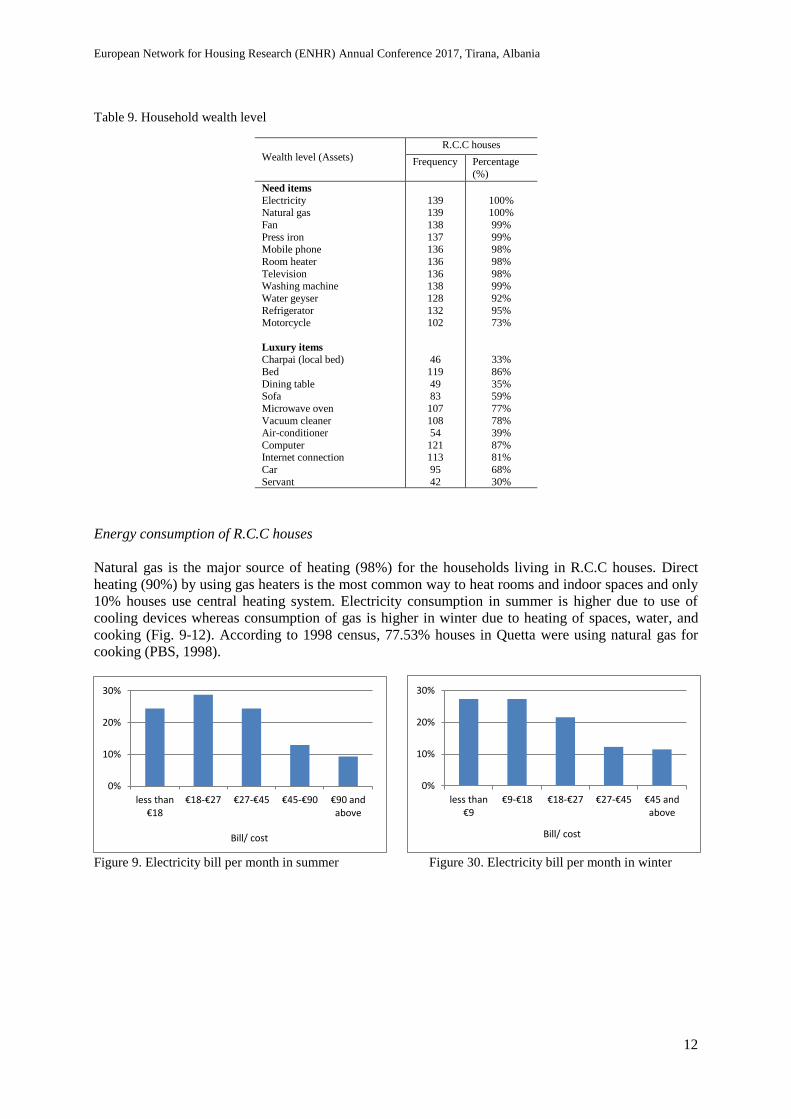
Table 9. Household wealth level
Wealth level (Assets)
R.C.C houses
Frequency Percentage
(%)
Need items
Electricity Natural gas
Fan
Press iron Mobile phone
Room heater
Television Washing machine
Water geyser
Refrigerator Motorcycle
Luxury items
Charpai (local bed)
Bed
Dining table Sofa
Microwave oven
Vacuum cleaner Air-conditioner
Computer Internet connection
Car
Servant
139 139
138
137 136
136
136 138
128
132 102
46
119
49 83
107
108 54
121 113
95
42
100% 100%
99%
99% 98%
98%
98% 99%
92%
95% 73%
33%
86%
35% 59%
77%
78% 39%
87% 81%
68%
30%
Energy consumption of R.C.C houses
Natural gas is the major source of heating (98%) for the households living in R.C.C houses. Direct
heating (90%) by using gas heaters is the most common way to heat rooms and indoor spaces and only
10% houses use central heating system. Electricity consumption in summer is higher due to use of
cooling devices whereas consumption of gas is higher in winter due to heating of spaces, water, and
cooking (Fig. 9-12). According to 1998 census, 77.53% houses in Quetta were using natural gas for
cooking (PBS, 1998).
Figure 9. Electricity bill per month in summer Figure 30. Electricity bill per month in winter
0%
10%
20%
30%
less than €18
€18-€27 €27-€45 €45-€90 €90 and above
Bill/ cost
European Network for Housing Research (ENHR) Annual Conference 2017, Tirana, Albania
13
0%
10%
20%
30%
less than €18
€18-€27 €27-€45 €45-€90 €90 and above
Bill/ cost
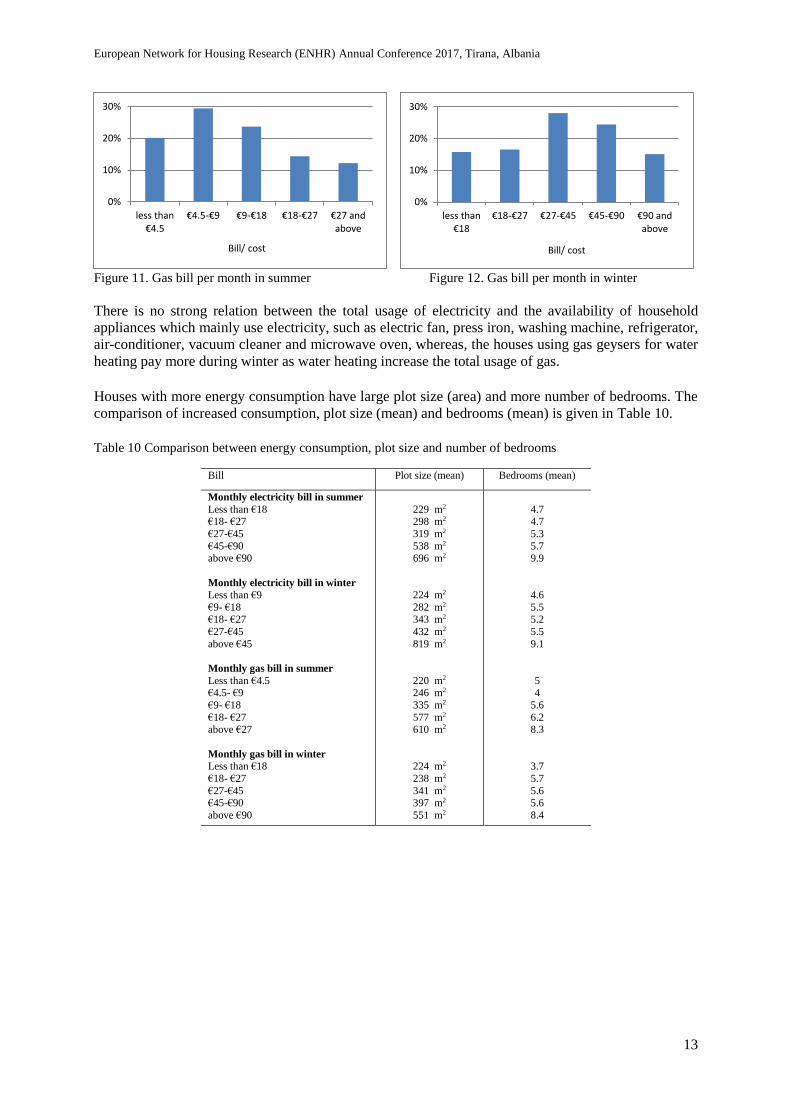
Figure 11. Gas bill per month in summer Figure 12. Gas bill per month in winter
There is no strong relation between the total usage of electricity and the availability of household
appliances which mainly use electricity, such as electric fan, press iron, washing machine, refrigerator,
air-conditioner, vacuum cleaner and microwave oven, whereas, the houses using gas geysers for water
heating pay more during winter as water heating increase the total usage of gas.
Houses with more energy consumption have large plot size (area) and more number of bedrooms. The
comparison of increased consumption, plot size (mean) and bedrooms (mean) is given in Table 10.
Table 10 Comparison between energy consumption, plot size and number of bedrooms
Bill Plot size (mean) Bedrooms (mean)
Monthly electricity bill in summer
Less than €18 €18- €27
€27-€45
€45-€90 above €90
Monthly electricity bill in winter
Less than €9
€9- €18 €18- €27
€27-€45
above €45
Monthly gas bill in summer
Less than €4.5 €4.5- €9
€9- €18
€18- €27 above €27
Monthly gas bill in winter
Less than €18
€18- €27
€27-€45 €45-€90
above €90
229 m2
298 m2
319 m2
538 m2
696 m2
224 m2
282 m2
343 m2
432 m2
819 m2
220 m2
246 m2
335 m2
577 m2
610 m2
224 m2
238 m2
341 m2
397 m2
551 m2
4.7 4.7
5.3
5.7 9.9
4.6
5.5 5.2
5.5
9.1
5 4
5.6
6.2 8.3
3.7
5.7
5.6 5.6
8.4
0%
10%
20%
30%
less than €4.5
€4.5-€9 €9-€18 €18-€27 €27 and above
Bill/ cost
European Network for Housing Research (ENHR) Annual Conference 2017, Tirana, Albania
14
Conclusion
The study has provided valuable insights of the existing housing stock in Quetta. The housing can be
divided into 3 types, R.C.C frame structure houses, brick masonry houses and sundried brick houses
whereas R.C.C houses is the most common housing type. The use of reinforced cement concrete is
maybe more common considering the fact, that Quetta is located in earthquake zone. The majority of
the head of the households are employed; salaried or doing business and mainly hold a bachelor or a
master degree. There are two common income groups, households earn between €143-€402 and €411-
€715 per month.
The houses in Quetta city are mainly constructed during last 4 decades and most of them were built
during 1997-2006. The households with more wealth level assets live in R.C.C houses while the
households living in brick masonry and sundried brick houses possess less household assets. The
construction materials also differ for each housing type where R.C.C houses use more durable
materials for the construction of walls, roofs, and floors. Insulation is rarely used, and single glazed
windows are commonly used in the houses. Natural gas is commonly used for heating and rooms are
directly heated by using gas heaters. The consumption of electricity was noticeably higher in summer
while the consumption of gas was higher in winter. The houses with larger area and more number of
bedrooms consume more energy.
The results provide an overview of the housing stock and characteristics of housing in Quetta,
Pakistan. Since, R.C.C houses is the most common housing typology in Quetta and these houses are
wide spreading in the city, it is important to study this type of houses in detail to improve their energy
performance and provide optimal indoor thermal comfort for the residents.
Acknowledgement
The authors are grateful to the Higher Education Commission (HEC), Pakistan for providing necessary
funds and resources and Balochistan University of Information Technology, Engineering &
Management Sciences (BUITEMS) Quetta for providing assistance through their staff, students and
use of infrastructure for the completion of this study.
European Network for Housing Research (ENHR) Annual Conference 2017, Tirana, Albania
15
Bibliography
Abdul S., K., Shuhab D., K., & Din M., K. (2013). Land subsidence and declining water sources in
Quetta Valley, Pakistan. Environmental Earth Sciences, Vol. 70(Issue. 6), 2719-2727.
Alnsour, J. A. (2011). Illegal housing in Jordan. Jordan Journal of Social Sciences, Vol. 4(Issue. 3),
339-354.
Barry, M., & Rüther, H. (2005). Data collection techniques for informal settlement upgrades in Cape
Town, South Africa. Journal of the Urban and Regional Information Systems Association
(URISA), Vol. 17(Issue. 1), 43-52.
BBC. (2016, August 8th). Retrieved May 13th, 2017, from http://www.bbc.com/news/world-asia-
37007661
DAWN. (2016, October 25th). Retrieved June 13th, 2017, from https://www.dawn.com/news/1291999
DHS. (2015). Demographic and Health Surveys by USAID. Retrieved from
http://dhsprogram.com/topics/wealth-index/Wealth-Index-Construction.cfm
DoCLG. (2016, February 18th). (Department of Communities & Local Government) Retrieved from
English Housing Survey: https://www.gov.uk/government/publications/english-housing-
survey-2014-to-2015-questionnaire-and-physical-survey-form
Gibson, M., Petticrew, M., Bambra, C., Sowden, A., Wright, K., & Whitehead, M. (2011). Housing
and health ineaulities: a sysnthesis of systematic reviews of interventions aimed at different
pathwayslinking housing and health. Health & Place, Vol. 17(Issue. 1), 175-84.
Haq, R. (2011). Quality and Quantity of Housing Conditions. Population of Pakistan: An analysis of
National Socio-Eeconomic Registry. Pakistan Institute of Development Economics (PIDE)
Islamabad together with Benazir Income Support Program (BISP) and UNICEF.
Kanton, O. (2007). Household environment and health in the Tamale metropolitan area. Unpublished
PhD thesis. Department of Geography & Resource Studies, University of Ghana.
Kugelman, M. (2013). Urbanisation in Pakistan: causes and consequences. Norwegian Peacebuilding
Resource Centre. Retrieved May 13th, 2017, from
https://www.files.ethz.ch/isn/159296/4c5b5fa0ebc5684da2b9f244090593bc.pdf
MET, P. (2015). Pakistan Meteorological Department, Govt. of Pakistan. Retrieved June 15th, 2017,
from Regional Meteorological Center, Quetta, Balochistan:
http://rmcbalochistan.pmd.gov.pk/historical-events.html
MPQ. (1980s). Master Plan for Quetta. Design Directorate, City & Regional Planning Group,
University of Engineering & Technology, Lahore, Pakistan.
Naeem, A. (2009). Recognizing historic significance using inventories: A case of historic town in
Sindh Pakistan (PhD Thesis). Oxford Brookes University, Oxford, UK.
NESPAK. (1985). Quetta Master Plan. Quetta: Quetta Development Authority together with National
Engineering Services, Pakistan.
European Network for Housing Research (ENHR) Annual Conference 2017, Tirana, Albania
16
NREL. (2007a, February). Retrieved April 19th, 2017, from National Renewable Energy Laboratory:
http://www.nrel.gov/international/images/pak_10km_dni_ann.jpg
NREL. (2007b, May). Retrieved April 19th, 2017, from National Renewable Energy Laboratory:
http://www.nrel.gov/international/pdfs/pak_wind.pdf
Online, W. (2017, July 19th). Retrieved from World Weather online:
https://www.worldweatheronline.com/quetta-weather-averages/balochistan/pk.aspx
P&D. (2011). Quetta: District Development Profile. Planning & Development Department. Planning
& Development (P&D) Department, Government of Balochistan. Retrieved April 7th, 2017,
from http://balochistan.gov.pk/DistrictProfile/DDP%20Final%202012/Quetta/Quetta.pdf
PBS. (1998). Retrieved April 19th, 2017, from Pakistan Bureau of Statistics:
http://www.pbs.gov.pk/sites/default/files//tables/District%20at%20a%20glance%20Quetta.pdf
PBS. (1998). Population & Housing Census 1998. Pakistan Bureau of Statistics (PBS), Government of
Pakistan.
PESA. (2015). Pakistan Emergency Situation Analysis: District Quetta. AlHasan Systems Private
Limited, Islamabad, Pakistan.
PWD. (2017, May 13). Retrieved from Population Welfare Department, Govt. of Punjab:
http://www.pwd.punjab.gov.pk/
Qadeer, M. A. (2006). Pakistan: Social and Cultural Transformations in a Muslim Nation. Routledge,
Taylor & Francis Group.
QDA. (2016). Retrieved June 20th, 2017, from Quetta Development Authority, Government of
Balochistan:
http://www.balochistan.gov.pk/index.php?option=com_content&view=category&layout=blog
&id=47&Itemid=552
QDA. (2017). Quetta Development Authority, Government of Balochistan.
QESCO. (2016). Management Information System (MIS) department, Quetta Electric Supply
Company, Quetta, Pakistan.
Shaikh, F., Ji, Q., & Fan, Y. (2015). The diagnosis of an electricity crisis and alternative energy
development in Pakistan. Renewable & Sustainable Energy Reviews, Vol. 52, 1172-1185.
TAMA. (2003). Medium term development plan 2003-06. prepared under the medium term
development policy framework. Accra: Ministry of Local Government & Rural Development.
The Express Tribune. (2013). Pakistan Internet Use Survey. Retrieved April 5, 2017, from
https://www.scribd.com/document/161598355/Pakistan-Internet-Use-Survey-2013
Tripple, A. G., Korboe, D., & Garrod, G. (1997). Income and wealth in house ownership studies in
urban Ghana. Housing studies, 12(1), 111-126.
Tuncoku, S. S., İnceköse, Ü., Akış, T., & Yalçın, M. A. (2016). Assessment of construction techniques
and material usage in Izmir rural houses. International Journal of Architectural Heritage, Vol.
9(Issue. 8), 1005-1022.
European Network for Housing Research (ENHR) Annual Conference 2017, Tirana, Albania
17
WFP. (2008). Wealth Index:Food Security Analysis. World Food Program. Retrieved from
https://resources.vam.wfp.org/
Yakubu, I., Akaateba, M. A., & Akanbang, B. A. (2014). A study of housing conditions and
characteristics in the Tamale Metropolitan Area, Ghana. Habitat International, Vol. 44, 394-
402.