methods and models used to parameterize the infrared .../67531/metadc626623/m2/1/high... ·...
TRANSCRIPT
Lawre
nce
Liverm
ore
National
Labora
tory
UCRL-ID-129290
Methods and Models Used to Parameterize the Infrared Absorption of Methane and Nitrous Oxide for Calculations
Within the LLNL/UCLA Climate Model
K.E. GrantA.S. Grossman
R.L. Tarp
November 1997
This is an informal report intended primarily for internal or limited external distribution. The opinions and conclusions stated are those of the author and may or may not be those of the Laboratory.Work performed under the auspices of the U.S. Department of Energy by the Lawrence Livermore National Laboratory under Contract W-7405-ENG-48.

DISCLAIMER
This document was prepared as an account of work sponsored by an agency of the United States Government. Neitherthe United States Government nor the University of California nor any of their employees, makes any warranty, expressor implied, or assumes any legal liability or responsibility for the accuracy, completeness, or usefulness of anyinformation, apparatus, product, or process disclosed, or represents that its use would not infringe privately ownedrights. Reference herein to any specific commercial product, process, or service by trade name, trademark,manufacturer, or otherwise, does not necessarily constitute or imply its endorsement, recommendation, or favoring bythe United States Government or the University of California. The views and opinions of authors expressed herein donot necessarily state or reflect those of the United States Government or the University of California, and shall not beused for advertising or product endorsement purposes.
This report has been reproduceddirectly from the best available copy.
Available to DOE and DOE contractors from theOffice of Scientific and Technical Information
P.O. Box 62, Oak Ridge, TN 37831Prices available from (615) 576-8401, FTS 626-8401
Available to the public from theNational Technical Information Service
U.S. Department of Commerce5285 Port Royal Rd.,
Springfield, VA 22161

1
Methods and Models Used to Parameterize the InfraredAbsorption of Methane and Nitrous Oxide for Calculations within
the LLNL/UCLA Climate Model
Keith E. Grant, Allen S. Grossman, and Raymond L. Tarp([email protected])
Atmospheric Science Division, L-103Lawrence Livermore National Laboratory
Livermore, CA 94551
14 November 1997
ABSTRACT
This report summarizes the tools and methods used to parameterize the radiative absorption by CH and N O4 2
within the context of the infrared radiative transfer model of Chou and Suarez (1994), currently being usedwithin the LLNL/UCLA climate model. We discuss in detail the physical formulation, computationalimplementation, and application of codes for line-by-line opacity calculations and generation of wide-bandopacity probability distributions. In treating the wide-band opacity probability distributions, we derive theequations for weighting the opacity probabilities of individual wavenumber bins by the Planck function.Finally, we verify our implementation of CH and N O absorption with the the Chou and Suarez model by4 2
comparision of radiative fluxes and tropospheric forcings with benchmark cases from ICRCCM and IPCCstudies. Our parameterizations of the tropospheric forcing of ambient CH and N O individually, in the absence4 2
of other trace gases, were within 13% of the ICRCCM medians. The combined forcing for the two gases waswithin 10% of the ICRCCM median. Our tropospheric radiative forcings for anthropogenic perturbationscenarios from IPCC and other sources compared within 2–11% with the benchmark values.
1. INTRODUCTION
Mitigation of anthropogenic global change requires developing an understanding of the scientific andeconomic issues involved in reducing greenhouse emissions. In the past, all greenhouse emissions havegenerally been treated as if they were emissions of a radiatively equivalent amount of carbon dioxide (CO ).2
Radiative equivalence, in this sense, means that the same change in net radiative forcing at the tropopauseis produced prior to any feedback responses. The research documented in this report is part of a project toinvestigate the extent to which methane (CH ) and nitrous oxide (N O) have forcing and climate response4 2
patterns distinguishable from those of radiatively equivalent CO . The physical bases for such differences2
include differing spectral characteristics and spatial and seasonal distributions.
Specifically, this report summarizes the tools and methods used to parameterize the radiative absorption byCH and N O within the context of the infrared radiative transfer model of Chou and Suarez (1994) currently4 2
being used within the LLNL/UCLA climate model. The Chou and Suarez model defines the bands andabsorber contributions shown in Table 1. In adding new absorbers to the model, we have stayed within themethodology and band structure of the original model. Thus, we have added absorption by CH and N O as4 2
also shown in Table 1. Absorption by CH in band 5 and by N O in band 7 were evaluated but not included.4 2

2
Table 1: Spectral bands and absorbers in the Chou and Suarez infrared model
Band Spectral Range (cm )-1 Absorbers in the original model New absorbers
1 0–340 H O line2
2 340–540 H O line2
3 540–800 H O line, H O continuum, CO2 2 2 N O2
4 800–980 H O line, H O continuum2 2
5 980–1100 H O line, H O continuum, O2 2 3
6 1100–1380 H O line, H O continuum2 2 CH , N O4 2
7 1380–1900 H O line2 CH4
8 1900–3000 H O line2
Together, they were found to contribute less than 0.005 W m out of approximately 12 W m to tropospheric-2 -2
forcing for ambient concentrations without other trace gases (see Table 3; Case 37G). In adding CH4
absorption to band 6, it was necessary to include a semi-empirical treatment of the correlation in theoverlapping with H O. This is also considered below.2
As discussed in Chou and Suarez (1994), depending on the band and the accuracy option chosen, one of twodifferent methods may be used to compute the transmission between two pressure levels. In cases whereaccurate cooling rates in the middle atmosphere (pressures less than 10 hPa) are not required, computationalefficiency is increased by use of a pressure scaled k-distribution algorithm. For applications in which greateraccuracy is required, the slower use of pre-computed transmittance tables combined with two-parameter (p,T) scaling is done. Our implementation of CH and N O absorption has used the latter approach. We discuss4 2
this in more detail below.
In brief, the development of the new absorption parameterizations for the bands and gases shown in Table 1contained the following steps. First, line-by-line opacity calculations were done at 21 pressures between 0.01and 1000 hPa at temperatures of 170 K, 250 K, and 330 K. Depending on the pressure, gas, and band thespectral resolution for these calculations varied between 0.0005–0.01 cm . Next, the line-by-line opacities-1
were binned into Planck-weighted opacity probability densities. The probability densities were thenintegrated and thinned to provide cumulative probability distributions of the opacities. These distributionswere then used to calculate transmissions for 21 different absorber amounts for each combination oftemperature and pressure. In calculating these transmissions, a 16 stream integration over propagation anglewas done, assuming isotropic radiation intensities. Finally, a quadratic expansion for the temperature wasdone, reducing the transmissivities for each band and gas combination to a two-dimensional table dependingon pressure and absorber amount for three temperature coefficients. We discuss the tools and concepts usedto implement these steps in detail below. Tests done to validate the new parameterizations against publishedbenchmark calculations are also presented.
2. CORKI — A Correlated-k Implementation
CORKI is both a specific model and an underlying conceptual framework for a set of modules that in unisoncreate a significant infrared atmospheric radiative transfer capability. The intent of the CORKI frameworkhas been to create a set of radiative tools to progress from line-by-line spectral properties to either detailedstand-alone radiative transfer calculations or radiative parameterizations to be included in climate and

3
Figure 1: Structural overview of the Correlated-k Implementation (CORKI) code suite for radiative transfercalculations and parameterizations.
chemistry models. CORKI is a replacement for an earlier set of models used in our previous studies such asGrossman and Grant (1994a). The development of CORKI was motivated by the need for a set of radiativetransfer tools that met needs for efficiency, maintainability, and platform independence. Basic elements ofthe CORKI structure (Figure 1) include:
! HITRAN-96: a state of the art library of the spectrascopic properties of radiatively importantatmospheric molecules. With the 1996 release, HITRAN includes HAWKS (HITRAN AdvancedWork-Station). HAWKS facilitates selection and previewing of specific lines from within the entiredatabase.
! KGEN: a moderately parallelized model for calculation of line-by-line opacities
! WC: an opacity post-processor to add the relatively smoothly varying water vapor continuum toline-by-line opacities from KGEN. The continuum opacities depends on layer temperature, pressure,and water vapor mixing ratio, as well as the wavelength. Because the Chou and Suarez infraredmodel already contained a treatment of continuum absorption, WC was not used in the currentapplication.
! ABSORT: a program to calculate Planck weighted k-distributions from opacities generated byKGEN, and WC.
! TRANSMISS: a program to calculate tables of transmissivities for specific absorber amounts,pressures, and temperatures using k-distributions generated by ABSORT. Such transmissivities arethen usable within the less detailed infrared radiative transfer models typical of a climate oratmospheric chemistry model.
! CORKI: a model to do accurate radiative transfer calculations for a vertically inhomogeneous at-mosphere, directly using the correlated k-distribution technique. The term correlation in this applica-tion refers to the assumption that the mapping between wavenumber bins and opacity bins is approx-imately independent of altitude. If the opacity was factorable into a wavelength dependent absorption

k ' S(T) f ( & 0 ) ,
S ' m4
&4
k d .
4
(1)
at a specified pressure and temperature and a function of pressure and temperature alone, then thecorrelation would be exact. In an actual vertically inhomogeneous atmosphere, the correlationassumption in an approximation. It works well in practice, partially because the radiation field in anylayer depends strongly on near-neighbor layers with which the vertical correlation is high. Thisradiative transfer approach was not used for the current project, and will not be further pursued inthis report. We have previously discussed it in Grant et al. (1992) and Grossman and Grant (1994a).
3. KGEN
3.1 Introduction
KGEN is a moderately parallelized opacity model developed to provide a core capacity for line-by-lineatmospheric radiative transfer calculations at LLNL. As opposed to most existing line-by-line codes, KGENhas been designed specifically to run on symmetric multi-processors or workstation clusters.
Calculation of line-by-line opacities from spectroscopic data is the basic foundation of all atmosphericradiative transfer problems that include gaseous absorption and emission. The applications of such opacitycalculations include: development of efficient radiative parameterizations for modeling the climatic andchemical effects of potential changes in trace gases, aerosols, and cloudiness, remote sensing, and visibilitycalculations. Remote sensing applications include both scientific and national security aspects pertaining tothe effects of atmospheric constituents on specific sensor wavelengths.
By their very nature, line-by-line opacity calculations are computationally intensive. At atmosphericpressures below about 10 hPa, integration over spectral line-shapes requires a full Voigt treatment.Simultaneously, the half-width of the line becomes significantly narrower than at larger pressures. For the50 wavenumber interval over which the far wings of a line are assumed to have influence, there may be over250,000 spectral bins. More over, each bin may include a quadrature of the Voigt function (Lether andWenston, 1990), resulting in over a million Voigt function evaluations per spectral line. The magnitude ofthis problem is multiplied by the number of lines in a desired band, often 2,000 to 12,000. Additionally, alibrary of spectral calculations for a particular wavenumber band and gas may require calculations at 3separate temperatures and 26 separate pressure levels. These computational requirements have here-to-forelimited such codes to vector supercomputers.
We have used the KGEN opacity model to generate correlated-k (opacity probability) distributions forcomputationally efficient solar and terrestrial infrared radiative transfer calculations. Such k-distributionscan be used directly for detailed radiative transfer calculations or be used to tabulate wide-band spectralatmospheric transmission as a function of path absorber amount, effective path pressure, and effective pathtemperature. Such wide-band transmission data are the basis for efficient interactive radiative transfercalculations within climate models. We calculated a library set of opacities for CH and N O executing4 2
KGEN on a cluster of DEC Alpha workstations.
3.2 Description of Computational Methods
The absorption coefficient of a molecule at a particular wavenumber (cm ) and temperature is given by-1
the product of the temperature dependent line strength S(T) and the line shape factor f( - ), where is the0 0
position of the line center. Including the normalization of the line, we have

S (T) ' S (Tr )Q (Tr )
Q (T )1 & e
&hc 0 / KT
1 & e&hc 0 / KTr
exp &hcEi
K1T
&1Tr
,
fv ( & 0 ) '1
D
K (x,y ) ,
K (x,y ) 'y
4
&4
1
y 2 % (x & t )2e &t 2
dt .
Q(Tr ) / Q(T )
D y ' / Dx ' ( & 0 ) / D
5
(2)
(3)
(4)
The variation of the line strength, S, with temperature is given by
where T is a reference temperature, E is the energy of the lower state of transition, and Q(T) is the internalr i
partition function for the molecule in question (Liou, 1992). The evaluation of Eqn. 2 is facilitated by S(T )rand E being part of the spectral data provided for each line in the HITRAN database. A function for thei
evaluation of based on quadratic fits has also been included in the HITRAN release (Gamacheet al., 1990).
The line shape factor is given by
where is the Doppler width (Liou, 1992). Further defining to be the Lorentz half-width; , and , the Voigt function is defined by
In the lower atmosphere where the Lorentz half-width is much greater than the Doppler width, the line shapesimplifies to the Lorentz profile. In the upper atmosphere, where the Lorentz width is negligible, the lineshape simplifies to the Doppler profile. In between these extremes, the more complex Voigt profile must beused.
We perform the many Voigt function evaluations required using the method of Lether and Wenston (1990).This method is based on a corrected trapezoidal integration in which the number of terms can be varied totrade-off computational speed and accuracy. Lynas-Gray (1993) had subsequently implemented thisalgorithm for vector processors. Continued KGEN development efforts will include additional optimizationof our application of this algorithm as well as further development of post-processing, testing, and analysistools. Output from the KGEN model is to NetCDF files, facilitating platform portability of the data,self-documentation, and ease of further analysis.
The KGEN model has been parallelized and tested on a DECAlpha cluster using the Message PassingInterface (MPI) described by Gropp et al. (1994). The accuracy of the code was verified against a previousmodel (Grossman and Grant, 1994). The trapezoidal scheduling algorithm of Tzen and Ni (1993) wasimplemented to load balance the calculation of opacities in the different spectral bins affected by eachspectral line. We have verified linear increases in through-put for one to five slave processors on ten CPU(central processing unit) machines. For a larger number of processors, competition with other tasks resultingin thrashing delays, resulting in a noticeable decrease in computational efficiency. Avoidance of such taskingconflicts requires gang scheduling of CPUs.
4. ABSORT
4.1 Background
In a paper by Lacis and Oinas (1991), a method was described for treating transmission calculations ininfrared radiative transfer problems for a vertically inhomogeneous atmosphere in which there is non-graygaseous absorption. The technique, known as the correlated k-distribution method, utilizes a mapping of the

G(k) ' mk
&4
f (k )) d log k ) ,
T(u) ' ( )&1 m e &k( ) u d ,
' m4
&4
f (k) e &k u d log k ,
' m1
0e &k(G) u dG ,
T(u) ' jJ
j'1
Bj (T)
B (T) j m4
0e &ku fj (k) d log(k) ,
T(u) ' jN
n'1e&kn u
log(kn ) jJ
j'1
Bj (T)
B (T) j fj (kn) ,
' jN
n'1e&kn u
G̃ n ,
G̃n ' log(kn ) jJ
j'1
Bj (T)
B (T) j (kj&kn) G &14
,
B(T) 'jjBj (T) j
G̃ n
fj (kn)G̃n
6
(5)
(6)
(7)
(8)
(9)
opacity-frequency relation into an opacity-probability relation within a particular frequency interval. We havepreviously summarized the basic theory and some results of applying the method in Grossman and Grant(1994a). The cumulative probability distribution, used in defining the “c-k” method is given by
where f(k’) d log k’ is the fraction of the fraction of the frequency interval occupied by absorption coefficientsbetween log k’ and log k’ + d log k’, i.e. the probability density function. Using these definitions, thetransmission through a single, homogeneous layer can be expressed in three equivalent forms:
where u is the path absorber amount. The advantage of making these transformations is in going from anintegral in which k is rapidly varying over orders of magnitude to one in which k is monotonically andsmoothly increasing. The properties of smoothness and monotonicity yield themselves to efficient numericalevaluation of the integral. The term “correlated” refers to the assumption that, for a vertically inhomogeneousatmosphere, the mapping or ordering relating wavelength bins to opacity bins will remain constant. For anyreal atmosphere this is an approximation. It holds exactly under the assumption the wavelength variation andpressure-temperature variation of the opacities can be separated into independent factors.
Now consider an infrared band of sufficient width that not only the variation in the opacity but also thevariation in the Planck function must be considered. We can sub-divide such a band, as has been done byChou and Suareez (1994), so that within each sub-band the Planck function could be taken as constant. Wecan then write the Planck-weighted total band transmission as the sum over the sub-bands given by
where is the band-integrated Planck flux, B (T) is the Planck flux in the jth sub-band,j
and f (k) is the probability density function of the absorption coefficient in the jth sub-band. Discretizing thej
integral over k in Eqn. 7 into a sum over N terms and rearranging, we obtain
with interpreted as being a Planck-weighted probability increment or density. If we now go to thelimiting case of the sub-bands being single wavelength bins, the unweighted probability density terms
become delta functions, since the opacity for a particular wavelength bin will lie in one and only oneopacity bin. In this case, we can express by

Q ' jJ
j'1Bj (T) j e
&kj u,
G &14'n G̃n ' 1
Bj (T) jlog(kn ) , n'1,2,3, ...,N
7
(10)
Figure 2: Planck-weighted probability densityfunctions for CH opacities in band 6 at a4
pressure of 0.01 hPa and at temperatures of170 K, 250 K, and 330 K.
Figure 3: Planck-weighted cumulativeprobability distributions for CH opacities in4
band 6 at a pressure of 0.01 hPa and attemperatures of 170 K, 250 K, and 330 K.
saving the necessity of an intermediate step of calculating separate k-distributions for each sub-band intransforming from line-by-line opacities to a total band k-distribution. The normalization factor, , isdefined such that . Examples of the resulting opacity Planck-weighted probability densityfunction and cumulative probability distribution are show in Figures 2 and 3.
The practical effect of adding the Planck weighting is to give unequal weighting to the different wavelengthbins in calculating the probability density function. Specifically, as discussed by Chou and Suarez (1994)and Liou (1992), the terms defining the interaction of the radiation field with a discrete atmospheric layerare differences of individual terms of the form
where the sum is taken over the individual wavenumber bins. In this form, it is readily apparent that theweight given to each exponential transmission involving k is given by . By mapping the weightsj
of individual wavenumber bins into the N discrete opacity bins , and subsequentlyrenormalizing, we arrive again at the result of Eqn. 9.
Rather than assuming B (T) to be constant over some sub-band or evaluating it in full for each of manywavelength bins, we can evaluate it at some subset of wavelengths and interpolate in-between. In practice,the variation in the shape of the Planck function over the range of atmospheric temperatures is of far lessimportance than its original inclusion. Chou and Suarez (1994) have noted that, for the weighting purposesdescribed above, the evaluation of the Planck weighting at a temperature of 250 K is accurate for allatmospheric use.
4.2 Implementation Issues
At low pressures, the centers of strong absorption lines are not appreciably broadened from their dopplerlimits. The effect of this on the opacity probability distributions is to create a small but optically significantprobability for opacities relatively large compared to the remainder of the distribution. This results in a sharppeak in the opacities for cumulative probabilities between 0.99 and 1. In choosing the values of cumulativeprobability, G, for the find k-distribution k(G), accuracy requires care in resolving this peak.
G(k̂) ' 1 % e &ak̂ b
& k̂ e &a ,
k̂ 'log(k) & log(kmin)
log(kmax) & log(kmin).
(u, pe ,Te) ' a(u, pe) % b(u, pe ) (Te & 250K ) % c(u, pe ) (Te & 250K )2
k̂
8
(11)
(12)
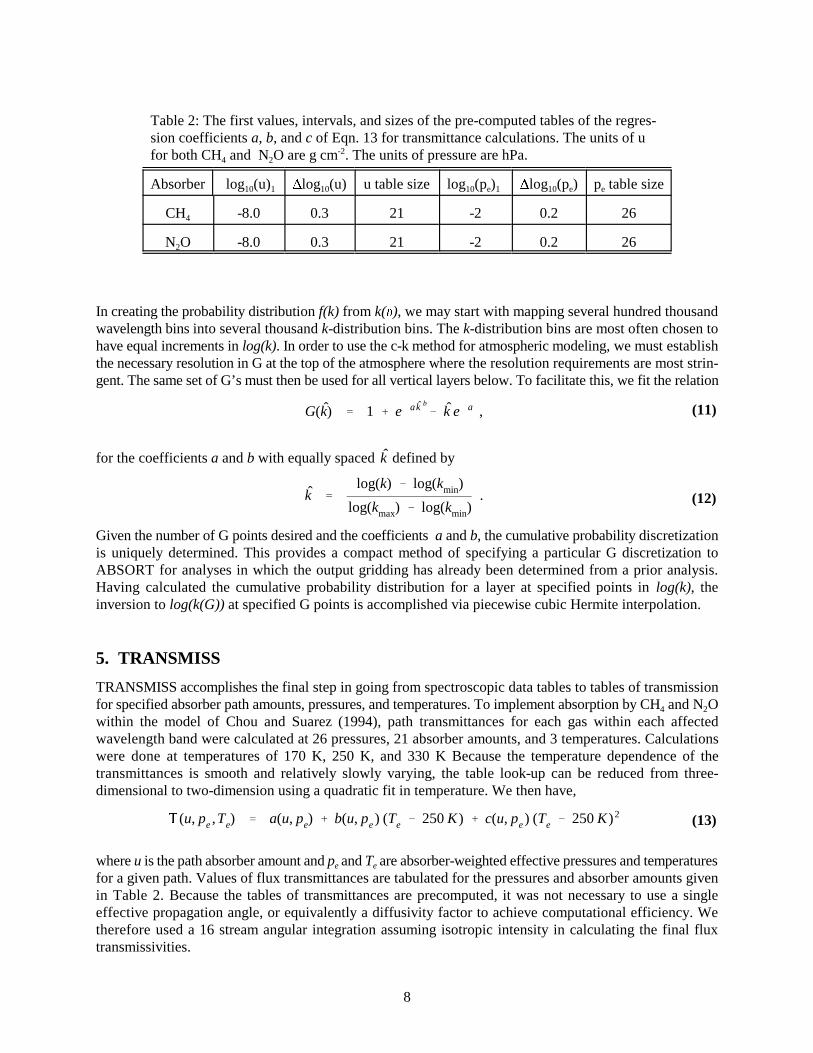
Table 2: The first values, intervals, and sizes of the pre-computed tables of the regres-sion coefficients a, b, and c of Eqn. 13 for transmittance calculations. The units of ufor both CH and N O are g cm . The units of pressure are hPa.4 2
-2
Absorber log (u)10 1 log (u)10 u table size log (p ) 10 e 1 log (p )10 e p table sizee
CH4 -8.0 0.3 21 -2 0.2 26
N O2 -8.0 0.3 21 -2 0.2 26
(13)
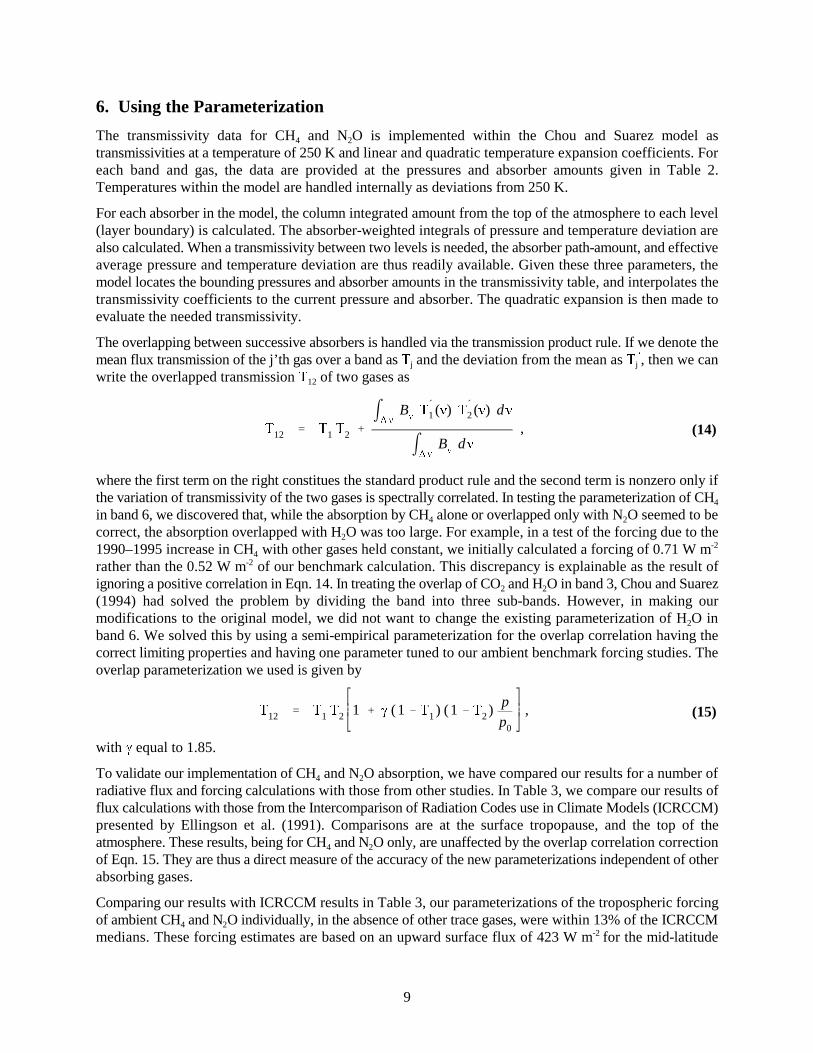
In creating the probability distribution f(k) from k( ), we may start with mapping several hundred thousandwavelength bins into several thousand k-distribution bins. The k-distribution bins are most often chosen tohave equal increments in log(k). In order to use the c-k method for atmospheric modeling, we must establishthe necessary resolution in G at the top of the atmosphere where the resolution requirements are most strin-gent. The same set of G’s must then be used for all vertical layers below. To facilitate this, we fit the relation
for the coefficients a and b with equally spaced defined by
Given the number of G points desired and the coefficients a and b, the cumulative probability discretizationis uniquely determined. This provides a compact method of specifying a particular G discretization toABSORT for analyses in which the output gridding has already been determined from a prior analysis.Having calculated the cumulative probability distribution for a layer at specified points in log(k), theinversion to log(k(G)) at specified G points is accomplished via piecewise cubic Hermite interpolation.
5. TRANSMISS
TRANSMISS accomplishes the final step in going from spectroscopic data tables to tables of transmissionfor specified absorber path amounts, pressures, and temperatures. To implement absorption by CH and N O4 2
within the model of Chou and Suarez (1994), path transmittances for each gas within each affectedwavelength band were calculated at 26 pressures, 21 absorber amounts, and 3 temperatures. Calculationswere done at temperatures of 170 K, 250 K, and 330 K Because the temperature dependence of thetransmittances is smooth and relatively slowly varying, the table look-up can be reduced from three-dimensional to two-dimension using a quadratic fit in temperature. We then have,
where u is the path absorber amount and p and T are absorber-weighted effective pressures and temperaturese e
for a given path. Values of flux transmittances are tabulated for the pressures and absorber amounts givenin Table 2. Because the tables of transmittances are precomputed, it was not necessary to use a singleeffective propagation angle, or equivalently a diffusivity factor to achieve computational efficiency. Wetherefore used a 16 stream angular integration assuming isotropic intensity in calculating the final fluxtransmissivities.
12 ' 1 2 %m B ´
1 ( ) ´2 ( ) d
m B d,
12 ' 1 2 1 % (1 & 1 ) (1 & 2 ) pp0
,
9
(14)
(15)
6. Using the Parameterization
The transmissivity data for CH and N O is implemented within the Chou and Suarez model as4 2
transmissivities at a temperature of 250 K and linear and quadratic temperature expansion coefficients. Foreach band and gas, the data are provided at the pressures and absorber amounts given in Table 2.Temperatures within the model are handled internally as deviations from 250 K.
For each absorber in the model, the column integrated amount from the top of the atmosphere to each level(layer boundary) is calculated. The absorber-weighted integrals of pressure and temperature deviation arealso calculated. When a transmissivity between two levels is needed, the absorber path-amount, and effectiveaverage pressure and temperature deviation are thus readily available. Given these three parameters, themodel locates the bounding pressures and absorber amounts in the transmissivity table, and interpolates thetransmissivity coefficients to the current pressure and absorber. The quadratic expansion is then made toevaluate the needed transmissivity.
The overlapping between successive absorbers is handled via the transmission product rule. If we denote themean flux transmission of the j’th gas over a band as and the deviation from the mean as , then we canj j
N
write the overlapped transmission of two gases as12
where the first term on the right constitues the standard product rule and the second term is nonzero only ifthe variation of transmissivity of the two gases is spectrally correlated. In testing the parameterization of CH4
in band 6, we discovered that, while the absorption by CH alone or overlapped only with N O seemed to be4 2
correct, the absorption overlapped with H O was too large. For example, in a test of the forcing due to the2
1990–1995 increase in CH with other gases held constant, we initially calculated a forcing of 0.71 W m4-2
rather than the 0.52 W m of our benchmark calculation. This discrepancy is explainable as the result of-2
ignoring a positive correlation in Eqn. 14. In treating the overlap of CO and H O in band 3, Chou and Suarez2 2
(1994) had solved the problem by dividing the band into three sub-bands. However, in making ourmodifications to the original model, we did not want to change the existing parameterization of H O in2
band 6. We solved this by using a semi-empirical parameterization for the overlap correlation having thecorrect limiting properties and having one parameter tuned to our ambient benchmark forcing studies. Theoverlap parameterization we used is given by
with equal to 1.85.
To validate our implementation of CH and N O absorption, we have compared our results for a number of4 2
radiative flux and forcing calculations with those from other studies. In Table 3, we compare our results offlux calculations with those from the Intercomparison of Radiation Codes use in Climate Models (ICRCCM)presented by Ellingson et al. (1991). Comparisons are at the surface tropopause, and the top of theatmosphere. These results, being for CH and N O only, are unaffected by the overlap correlation correction4 2
of Eqn. 15. They are thus a direct measure of the accuracy of the new parameterizations independent of otherabsorbing gases.
Comparing our results with ICRCCM results in Table 3, our parameterizations of the tropospheric forcingof ambient CH and N O individually, in the absence of other trace gases, were within 13% of the ICRCCM4 2
medians. These forcing estimates are based on an upward surface flux of 423 W m for the mid-latitude-2

10
Table 3: Comparison with ICRCCM infrared fluxes for CH and N O cases4 2
ICRCCM CaseNew Param-eterization
(W m )-2
ICRCCM
Median(W m )-2
Range(W m )-2
Mean(W m )-2
Std. Dev.(W m )-2
37A (11) — 1.75 ppmv CH4
Surface 417.19 417.06 7.73 415.77 2.20
Tropopause 419.37 418.76 3.86 418.23 1.13
TOA 419.25 418.55 3.84 417.96 1.14
37B (9) — 0.28 ppmv N O2
Surface 417.13 417.22 8.24 415.70 2.69
Tropopause 419.68 419.13 5.15 418.57 1.44
TOA 419.33 418.58 5.38 418.06 1.58
37G (10) — CH & N O4 2
Surface 411.26 411.64 14.71 409.18 4.58
Tropopause 415.71 414.91 11.05 413.63 3.11
TOA 415.28 414.29 15.05 412.66 4.14
summer surface temperature of 294 K. We would expect the medians results to be less influenced by outlyersthan the means. The combined forcing for the two gases was within 10% of the ICRCCM median.
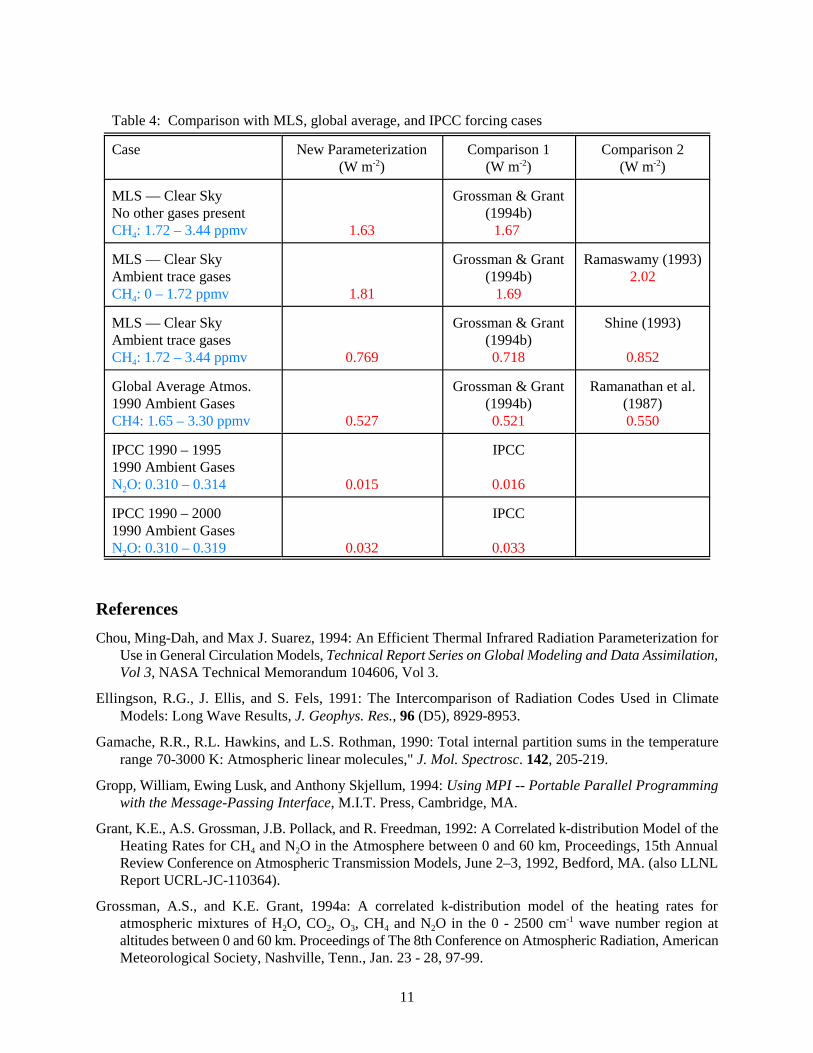
In Table 4, we compare radiative forcing calculated at the tropopause for a clear-sky mid-latitude summeratmosphere and a global average atmosphere, including clouds. Radiative forcing cases were selected fromseveral sources, including the International Panel on Climate Change Second Assessment Report (IPCC,1995). In all test cases, the results of our parameterizations for CH and N O absorption are within acceptable4 2
ranges of variability (2–11%) as compared with other studies. While the band 6 transmission overlap of CH4
with H O was corrected using Eqn. 15, the same correlation strength parameter was used for all calculations.2
The consistent agreement over all cases, without further tuning, is an indication that the use of Eqn. 15 isrobust.
Acknowledgements
Computational resources for this research were partially provided by the Livermore Computing Center underACISE (Advanced Computing Initiative for Science and Engineering) and the Multiprogrammatic andInstitutional Computing (M&IC) Initiative. Work was performed under the auspices of the U.S. Dept. ofEnergy by the Lawrence Livermore National Laboratory under contract No. W-7405-Eng-48.
11
Table 4: Comparison with MLS, global average, and IPCC forcing cases
Case New Parameterization(W m )-2
Comparison 1(W m )-2
Comparison 2(W m )-2
MLS — Clear SkyNo other gases presentCH : 1.72 – 3.44 ppmv4 1.63
Grossman & Grant(1994b)
1.67
MLS — Clear SkyAmbient trace gasesCH : 0 – 1.72 ppmv4 1.81
Grossman & Grant(1994b)
1.69
Ramaswamy (1993)2.02
MLS — Clear SkyAmbient trace gasesCH : 1.72 – 3.44 ppmv4 0.769
Grossman & Grant(1994b)0.718
Shine (1993)
0.852
Global Average Atmos.1990 Ambient GasesCH4: 1.65 – 3.30 ppmv 0.527
Grossman & Grant(1994b)0.521
Ramanathan et al.(1987)0.550
IPCC 1990 – 19951990 Ambient GasesN O: 0.310 – 0.3142 0.015
IPCC
0.016
IPCC 1990 – 20001990 Ambient GasesN O: 0.310 – 0.3192 0.032
IPCC
0.033
References
Chou, Ming-Dah, and Max J. Suarez, 1994: An Efficient Thermal Infrared Radiation Parameterization forUse in General Circulation Models, Technical Report Series on Global Modeling and Data Assimilation,Vol 3, NASA Technical Memorandum 104606, Vol 3.
Ellingson, R.G., J. Ellis, and S. Fels, 1991: The Intercomparison of Radiation Codes Used in ClimateModels: Long Wave Results, J. Geophys. Res., 96 (D5), 8929-8953.
Gamache, R.R., R.L. Hawkins, and L.S. Rothman, 1990: Total internal partition sums in the temperaturerange 70-3000 K: Atmospheric linear molecules," J. Mol. Spectrosc. 142, 205-219.
Gropp, William, Ewing Lusk, and Anthony Skjellum, 1994: Using MPI -- Portable Parallel Programmingwith the Message-Passing Interface, M.I.T. Press, Cambridge, MA.
Grant, K.E., A.S. Grossman, J.B. Pollack, and R. Freedman, 1992: A Correlated k-distribution Model of theHeating Rates for CH and N O in the Atmosphere between 0 and 60 km, Proceedings, 15th Annual4 2
Review Conference on Atmospheric Transmission Models, June 2–3, 1992, Bedford, MA. (also LLNLReport UCRL-JC-110364).
Grossman, A.S., and K.E. Grant, 1994a: A correlated k-distribution model of the heating rates foratmospheric mixtures of H O, CO , O , CH and N O in the 0 - 2500 cm wave number region at2 2 3 4 2
-1
altitudes between 0 and 60 km. Proceedings of The 8th Conference on Atmospheric Radiation, AmericanMeteorological Society, Nashville, Tenn., Jan. 23 - 28, 97-99.

12
Grossman, A.S., and K.E. Grant, 1994b: Tropospheric Radiative Forcing of CH , LLNL Report UCRL-ID-4
116533, Lawrence Livermore National Laboratory.
IPCC, 1995: Second Assessment Report on Climate Change, International Panel on Climate Change.
Lacis A., And V. Oinas, 1991: A description on the corelated k distribution for modeling nongray gaseousabsorpiton, emission, and multiple scattering in vertically inhomogeneous atmospheres, J. Geophys. Res.,96, D5, 9027-9063.
Liou, K.N., 1992: Radiation and Cloud Processes in the Atmosphere, Oxford Monographs on Geology andGeophysics No. 20, Oxford University Press, New York.
Lether, F.G. & Wenston, P.R., 1990: An Algorithm for the Numerical Computation of the Voigt Function,Applied Mathematics and Computation, 35, 277-289.
Lynas-Gray, A.E., 1993: A Fast Subroutine For Voigt Function Evaluation OnVector Processors, Comp.Phys. Commun., 75 135-142.
Ramanathan, V., L. Callis, R. Cess, J. Hansen, I. Isaksen, W. Kuhn, A. Lacis, F. Luther, J. Maldman, R.Reck, and M. Schlesinger, 1987: Climate-chemical interactions and effects of changing atmospheric tracegases, Reviews of Geophysics, 25 (7), 1441-1482.
Ramaswamy, V., 1993: Private Communication.
Rothman, L.S., R.R. Gamache, R.H. Tipping, C.P. Rinsland, M.A.H. Smith, D.C. Benner, V. Malathy Devi,J.M. Flaud, C. Camy-Peyret, A. Perrin, A. Goldman, S.T. Massie, L.R. Brown, and R.A. Toth, 1992: TheHITRAN Molecular Database — Editions of 1991 and 1992, Journal of Quantitative Spectroscopy &Radiative Transfer, 48, 469-507.
Shine, K.S., 1993: Private Communication.
Tzen, Ten H. and Lionel M. Ni, 1993: Trapezoid Self-Scheduling: A Practical Scheduling Scheme forParallel Computers, IEEE Transactions on Parallel and Distributed Systems, 4(1), 87-98.