methods - journal of lipid research · inserm u539,* centre de recherche en nutrition humaine, chu...
TRANSCRIPT
Copyright © 2002 by Lipid Research, Inc.
1986 Journal of Lipid Research
Volume 43, 2002
This article is available online at http://www.jlr.org
The differential apoA-I enrichment of pre
�
1
and
�
HDL is detectable by gel filtration separation
Maud Chétiveaux,* Hassan Nazih,*
,†
Veronique Ferchaud-Roucher,* Gilles Lambert,*Yassine Zaïr,*
,§
Martial Masson,* Khadija Ouguerram,* Daniele Bouhours,* and Michel Krempf
1,
*
,§
Inserm U539,* Centre de Recherche en Nutrition Humaine, CHU Hôtel Dieu, Nantes, France; Laboratoire de Biochimie Fondamentale et Appliquée,
†
UFR de Pharmacie, Nantes, France; and Clinique d’Endocrinologie,
§
Maladies Métaboliques. Nutrition, CHU Hôtel-Dieu, Nantes, France
Abstract The aim of the study was to assess the isolationof HDL by fast protein liquid chromatography (FPLC) toperform kinetics studies of apolipoprotein (apo)A-I-HDLlabelled with a stable isotope. Comparison between FPLCand ultracentrifugation has been made. ApoA-I-HDL kinet-ics were studied by infusion of [5.5.5-
2
H
3
]leucine for 14 h infive subjects. Using FPLC, pre
�
1
HDL and
�
HDL (HDL
2
and HDL
3
) were separated from 200
�
l of plasma samples.Total HDL was isolated by sequential ultracentrifugation(HDL-UC). The tracer-to-tracee ratio was higher in pre
�
1
HDL than in total HDL-UC. The higher leucine enrichmentfound in total HDL-UC compared to
�
HDL suggested theexistence of a mixture of apoA-I-HDL sub-classes. Fromthis difference in enrichments, the turnover rate of totalHDL-UC, usually assumed to be
�
HDL, was probably over-estimated in previous studies. To our knowledge, this studyis the first report which provides a convenient tool to distin-guish enrichments of apoA-I in pre
�
1
HDL and
�
HDL fromtotal HDL previously used for kinetic measurements.This original and new method should help to understandthe kinetics of HDL in humans and the reverse cholesteroltransport dynamics.
—Chétiveaux, M., H. Nazih, V. Fer-chaud-Roucher, G. Lambert, Y. Zaïr, M. Masson, K. Ouguer-ram, D. Bouhours, and M. Krempf.
The differential apoA-Ienrichment of pre
�
1
and
�
HDL is detectable by gel filtra-tion separation.
J. Lipid Res.
2002.
43:
1986–1993.
Supplementary key words
fast protein liquid chromatography
•
apoli-poprotein A-I
•
kinetic analysis
Plasma HDL and apolipoprotein A-I (apoA-I) concen-trations are inversely correlated with the risk of coronaryheart disease (1, 2). Kinetics studies are a good tool for abetter understanding of the role that HDL play in the re-verse cholesterol transport. Pre
�
1
HDL are considered asthe initial acceptor of cellular cholesterol and are trans-formed into spherical HDL
3
as a result of the LCAT activ-ity. Nascent discoidal pre
�
1
HDL are either directly syn-
thesized by the liver and the intestine or generated whenother classes of lipoproteins including
�
HDL are remod-eled by hepatic lipase (3). In plasma, pre
�
1
HDL repre-sented 5.5
�
3.3% and 7.2
�
4% of total apoA-I in womenand men, respectively (4).
ApoA-I, a major protein component of HDL, could beendogenously labeled using stable isotopes to study HDLmetabolism in humans (5). Plasma lipoprotein and HDLare usually separated by ultracentrifugation based on dif-ferential flotation using either sequential (6) or one-stepgradient methods (7). It appears that the combination ofhigh salt concentrations and high centrifugal forces maycause structural damages to the lipoproteins (8) thatcould change results of kinetics studies (9). Alternatively,plasma lipoproteins may also be separated by size-exclu-sion chromatography on agarose. Fast Protein Liquid Chro-matography (FPLC), based on the gel filtration property,is a rapid, quantitative, and non-destructive method usedto separate lipoproteins. Nascent pre
�
1
HDL can also beseparated from
�
HDL by FPLC (10). The aim of thepresent study is to validate the separation of HDL sub-classes by FPLC in metabolic study after an endogenouslabeling with stable isotopes. In this study, we have com-pared the leucine enrichment of apoA-I-HDL separatedby FPLC to that of HDL separated by the traditional ultra-centrifugation of plasma samples.
EXPERIMENTAL PROCEDURES
Experimental protocol
The experimental protocol was approved by the ethics com-mittee of the Nantes University Hospital and written consentswere obtained from each volunteer before inclusion in the study.
The kinetic protocol was already described in a previous study(11). Endogenous labelling of apoA-I was performed by ad-ministration of
l-
[5.5.5-
2
H
3
]leucine (99.8 atom %; Mass Trace,
1
To whom correspondence should be addressed.e-mail : [email protected]
Manuscript received 28 June 2002.Published, JLR Papers in Press, September 1, 2002.DOI 10.1194/jlr.D200024-JLR200
methods
by guest, on Septem
ber 10, 2018w
ww
.jlr.orgD
ownloaded from
Chétiveaux et al.
ApoA-I detection by gel filtration separation 1987
Woburn, MA), dissolved in a 0.9% NaCl solution, and tested forsterility and pyrogenicity before the study. All subjects fastedovernight for 12 h prior to the study, and remained fasting forthe entire procedure. They received intravenously 10
�
mol.kg
-1
of tracer, immediately followed by a constant tracer infusion (10
�
mol.kg
�
1
.h
�
1
) for 14 h. Venous blood was drawn into EDTAtubes (Venoject, Paris, France) at baseline every 15 min duringthe first hour, every 30 min during the next 2 h, and then hourlyuntil the end of the study. Plasma was immediately separated bycentrifugation for 30 min at 4
�
C; sodium azide, an inhibitorof bacterial growth, and Pefabloc SC (Interchim, Montluçon,France), a protease inhibitor, were added to blood samples at fi-nal concentrations of 1.5 and 0.5 mmol/l, respectively.
Isolation of lipoproteins by ultracentrifugation
Plasma lipoproteins were isolated by ultracentrifugation (6) us-ing a LKB ultracentrifuge with a RP55T rotor at 40,000 rpm for24 h at 4
�
C. The density of the plasma was adjusted to the densityof each lipoprotein (1.006, 1.063, and 1.025 g/ml for VLDL,LDL, HDL respectively) with NaCl solutions. Then, the lipopro-tein fractions were dialysed against NaCl 0.15M for 24 h at 4
�
C.
Isolation of lipoproteins by FPLC
FPLC analysis was performed at room temperature using twoP-500 pumps (1 MPa), a MV-7 place multi-injection with a 200
�
lloop, an ultraviolet (UV) monitor UV-1, a FRAC-100 fraction col-lector, and a LCC-501 Plus controller. All operations were moni-tored by absorbance at 280 nm. The system was controlled byFPLC DIRECTOR software (Amersham Pharmacia Biotech Inc.,Orsay, France) (12–16).
Elution was performed in a 1 mM EDTA, 154 mM NaCl, and0.02% NaN
3
(pH 8.2) buffer. The buffer was filtered through a0.22
�
m filter (Membrane filters type GV, Duropore
®
, Milli-pore). The column was washed with an aqueous ethanol solution(20%).
Isolation of whole HDL.
Total HDL separations (total-HDL-FPLC) by FPLC were performed on two Superose 6 HR 10/30columns in series (Amersham Pharmacia Biotech Inc., Orsay,France). Two hundred microliters of plasma was injected andelution was performed at a flow of 0.35 ml/min. Approximately0.35 ml fraction were collected. An entire profile was completedwithin 105 min. The columns were washed for 50 min at the endof each run.
Isolation of apoA-I containing sub-classes.
ApoA-I-containing HDLsub-classes separations by FPLC were performed on a Superdex200 HR 10/30 column (Amersham Pharmacia Biotech Inc., Or-say, France) (10). Samples of 200
�
l of plasma were injected andelution was performed at a flow of 0.35 ml/min. Approximately0.2 ml was collected for each fraction. An entire profile was com-pleted within 50 min. The columns were washed for 50 min atthe end of each run.
Determination of the FPLC peaks.
First, human VLDL, LDL,HDL
2
, and HDL
3
isolated by ultracentrifugation were used to de-termine the elution volumes of the various lipoproteins isolatedby FPLC.
In another way, lipids and apolipoproteins levels were mea-sured in each FPLC fractions. Total cholesterol and triglyceridescontents of lipoproteins and choline containing phospholipidsin HDL subpopulations were measured using enzymatic kits(Biomerieux, Marcy-L’Etoile, France). ApoA-I and apoB-100 con-centrations were measured by immunoturbidimetry (Biomerieux,Marcy-L’Etoile, France).
Isolation and preparation of apoA-I
ApoA-I of HDL isolated by FPLC and ultracentrifugation wasthen separated from other proteins by sodium dodecylsulfate
polyacrylamide gel electrophoresis (SDS-PAGE) using a 4% to20% discontinuous gradient and 4% stacking gel. Electrophore-sis was run overnight at 70 V and 4
�
C in Tris-Glycine buffer.ApoA-I was identified by comparing with molecular weight stan-dards (Biorad, Ivry-Sur-Seine, France). ApoA-I bands were ex-cised from the polyacrylamide gels and hydrolysed for 24 h in 4N HCl at 110
�
C.
Determination of tracer-to-tracee ratios
Hydrolysates were evaporated to dryness and amino acidswere purified by cation exchange chromatography using aDowex 50WX8-200 resin (Aldrich, Saint-Quentin Fallavier,France). Amino acids were esterified with propanol/acetyl chlo-ride and derivatized using heptafluorobutyric anhydride (HFBA,Fluka, Saint-Quentin Fallavier, France).
Electron-impact ionization gas chromatography-mass spec-trometry (GC-MS) was performed on a 5890 A gas chroma-tograph connected with a 5971 A quadrupole mass spectro-meter (Hewlett-Packard, Palo Alto, CA, USA). The isotopicratio was determined by selected ion monitoring at
m/z
of282 and 285.
Determination of apoA-I containing subpopulations
Non-denaturing two-dimensional PAGE.
Non-denaturing two-dimensional PAGE was realized on HDL isolated either by FPLCor by ultracentrifugation, as well as on
�
HDL and pre
�
1
HDL tovalidate their separations. Elution volume of albumin (67 KDa)was used as exclusion limit between these two populations.
The one-dimensional electrophoresis was performed on a lowendosmosity agarose gel, 0.7% (Agarose, Type I: Low EEO,Sigma, Saint-Quentin Fallavier, France) in tris-tricine buffer (25mM, pH 8.6) containing 3 mM calcium lactate at constant voltage(250 V) at 10
�
C until bromophenol blue run 3.5 cm. After elec-trophoresis was completed in the one-dimensional, the agarosestrip was cut and placed on polyacrylamide gel as well as molecu-lar weight standards (High molecular weight electrophoresis,Amersham Pharmacia Biotech Inc., Orsay, France). These aga-rose strips were sealed with the same agarose. The two-dimen-sional electrophoresis was performed in a 2% to 36% non-dena-turing, concave gradient polyacrylamide gel at 220 V for 24 h at4
�
C in a buffer containing 90 mM tris, 80 mM boric acid, and 2.5mM EDTA (pH 8.3).
After electrophoresis, lipoproteins were transferred to a0.45
�
m pore size nitrocellulose membrane (Membrane Pro-tran BA85, Schleicher and Schuell, Dassel, Germany) at 30 Vfor 24 h at 10
�
C in a Tris-Glycine buffer containing 25% meth-anol.
Immunoblotting.
After transfer, the bands with molecularweight standards were cut and stained with red Ponceau and themembrane was completely wetted and blocked in phosphate-buffer saline (PBS) containing 3% BSA for 2 h. Then, the mem-brane was incubated for 2 h with the rabbit anti-human apoA-I(apoA-I, Lpu 1 mg, Institut Pasteur Lille, France) at a dilution of1:1,000 in PBS with 1% BSA. After primary antibody incubation,the membrane was washed three times (10 min each) in PBSand then incubated with a secondary goat-anti-rabbit IgG perox-idase conjugate at a dilution of 1:1,000 for 2 h in a PBS-BSA(1%) solution. The membrane was then washed in PBS and per-oxidase reaction was performed with 4 Chloro-1 Naphtolmethod (Sigma, Saint-Quentin Fallavier, France).
Determination of the purity of apoA-I
The purity of apoA-I contained in HDL subpopulations wasdetermined with a denaturing two-dimensional gel electrophore-sis: isoelectric focusing (IEF)/SDS-PAGE; process which allowedthe separation of proteins according to their Isoelectric point (p
I
)
by guest, on Septem
ber 10, 2018w
ww
.jlr.orgD
ownloaded from
1988 Journal of Lipid Research
Volume 43, 2002
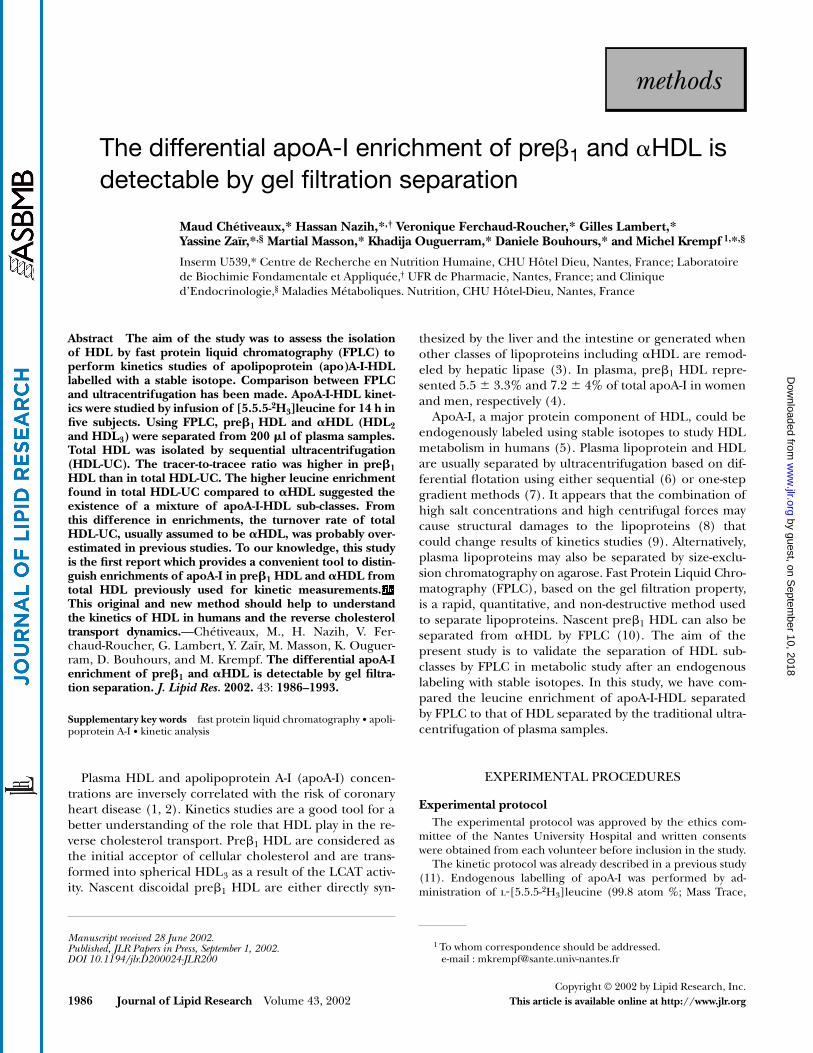
Fig. 1. FPLC elution profiles on two Superose 6 HR for a representative plasma (A) and VLDL (B), LDL(C), HDL2 (D), and HDL3 (E) obtained by ultracentrifugation.
by guest, on Septem
ber 10, 2018w
ww
.jlr.orgD
ownloaded from

Chétiveaux et al.
ApoA-I detection by gel filtration separation 1989
and their molecular mass. All instrumentation, gels and protocolswere from Amersham Biosciences. 50 ng of
�
HDL and 100 ng ofpre
�
1
HDL were diluted to a final volume of 200
�
l in a solutioncontaining 8 M urea, 2% CHAPS, 18 mM DTT, 0.2% Pharmalyte4-7, and a few granules of bromophenol blue. IEF was carried outwith Immobiline DryStrip gels (IPG, pH 4–7, 11 cm; and pH 5–10,18 cm) in the IPFphor isoelectric focusing system, according tothe manufacturer’s protocol. Two-dimensional SDS-PAGE wasperformed using ExcelGel 2-D Homogeneous 12.5% in the Mul-tiphor II electrophoresis unit, according to the manufacturerrecommendations. After completion of the two-dimensional
electrophoresis, the gels were silver stained as described by Heu-keshoven and Dernick (17).
RESULTS
Determination of elution volume of lipoproteins isolated by FPLC
When human plasma samples were analysed on two Su-perose 6HR gel permeation columns, four distinct peaks of
Fig. 2. FPLC elution profiles on two Superose 6 HR for a representative plasma sample as assessed by cho-lesterol and triglycerides (A) or apolipoprotein B (apoB) (B) or apoA-I (C).
by guest, on Septem
ber 10, 2018w
ww
.jlr.orgD
ownloaded from

1990 Journal of Lipid Research
Volume 43, 2002
lipoproteins were identified: VLDL, LDL, HDL
2
, and HDL
3
(
Fig. 1A
). The elution profiles of VLDL (Fig. 1B), LDL (Fig.1C), HDL
2
(Fig. 1D), and HDL
3
(Fig. 1E)
isolated by ultra-centrifugation and applied to FPLC in four different runsare shown in Fig. 1. In
Fig. 2
, the elution profiles of choles-terol, triglycerides (Fig. 2A), apoB (Fig. 2B), and ApoA-I(Fig. 2C) were analysed in order to identify and validate thefractions corresponding to VLDL, LDL, and HDL.
Enrichment data
The tracer-to-tracee ratio curves in total HDL isolatedby FPLC and ultracentrifugation are shown in
Fig. 3
. Thetracer-to-tracee ratio for ApoA-I-HDL after FPLC were less
than 35% compared to HDL isolated by ultracentrifuga-tion for all subjects.
To rule out a possible retention of the tracer in theFPLC columns, we measured the tracer-to-tracee ratioof HDL-UC before and after FPLC as a control experi-ment. The tracer-to-tracee ratio curves were similar inthese two different conditions (data not shown). Thesedata indicated that the difference in the tracer-to-tra-cee ratio observed between ultracentrifugation andFPLC separation methods was related to the composi-tion of HDL. To test this hypothesis, we have per-formed a two-dimensional electrophoresis of our HDLsamples.
Fig. 3. Experimental values of the tracer-to-tracee ratio for total HDL-apoA-I isolated by ultracentrifuga-tion (circles) and HDL-apoA-I isolated by FPLC (triangles). Data are shown as mean � SEM.
Fig. 4. Western blotting with anti-apoA-I of a two-dimensional electrophorese of total HDL isolated by ul-tracentrifugation and FPLC followed by apoA-I immunoblotting.
by guest, on Septem
ber 10, 2018w
ww
.jlr.orgD
ownloaded from

Chétiveaux et al.
ApoA-I detection by gel filtration separation 1991
Determination of apoA-I containing subpopulations in whole HDL
Figure 4
shows the two-dimensional electrophoresis oftotal HDL isolated by ultracentrifugation and FPLC fol-lowed by apoA-I immunoblotting. After ultracentrifu-gation pre
�
HDL was not found and only HDL with
�
electrophoretic mobility and free apoA-I was observed.Conversely, pre
�
as well as
�
HDL were recovered afterFPLC separation of human plasma.
Separation and identification of HDL subclasses obtained by FPLC
When human plasma samples were separated by FPLCon a Superdex 200 HR gel permeation, three apoA-I-HDLsubclasses, as well as three distinct phospholipids contain-ing lipoproteins, were separated (
Fig. 5
).The first peak represented a minor population of the
largest particles
�
500 KDa (fraction 1 to 13). The sec-ond peak included a spherical
�
HDL of 100–500 KDa:
Fig. 5. ApoA-I (A) and phospholipids (B) composition of Superdex 200 HR column fractions of wholeplasma.
Fig. 6. Experimental values of the tracer-to-tracee ratio for total HDL-ApoA-I isolated by ultracentrifuga-tion (circles); and �HDL (triangles) and pre�1 HDL-ApoA-I (square) isolated by FPLC. Data from five indi-viduals � SEM.
by guest, on Septem
ber 10, 2018w
ww
.jlr.orgD
ownloaded from

1992 Journal of Lipid Research Volume 43, 2002
HDL2 and HDL3. The third peak included a minor popu-lation of smaller particles of 40-60 KDa: pre�1 HDL. Thepurity of this fractions was confirmed by a two-dimen-sional non denaturing electrophoresis and a immunoblot-ting methods.
Determination of the purity of apoA-IWith the denaturing two-dimensional gel electrophore-
sis, in both pre�1 HDL and �HDL fractions, we did notobserve another protein having the same molecular massas apoA-I and a different pI. We could conclude that theapoA-I band is not contaminated by another protein. Theonly doubt was in �HDL fraction; Ig light chains were loc-alised above apoA-I spot and could contaminate the isoto-pic ratio. To extract Ig from �HDL, 2.5 �g of �HDL wereincubated for 7h at 4�C with rotation with protein A-Aga-rose, protein that bind to immunoglobulin classes. The Ig-protein A-Agarose complex was precipitated and the su-pernatant was separated on SDS-PAGE. We have obtainedthe same isotopic ratio for �HDL incubated or not withprotein A-Agarose for several time of kinetic. Thus, wecould conclude that apoA-I-�HDL was not contaminatedby Ig light chains (data not shown).
Enrichment of HDL subclasses obtained by FPLCThe tracer-to-tracee ratio of �HDL, pre�1 HDL isolated
by FPLC, and total HDL isolated by ultracentrifugationwere established on five subjects (Fig. 6). Experimentalvalues of tracer-to-tracee ratio of pre�1 HDL and �HDLwere higher and lower, respectively, than those of to-tal HDL.
DISCUSSION
The aim of this study was to compare two methods toseparate HDL for the measurements of isotopic enrich-ment in apoA-I-HDL. HDL was isolated by standard se-quential ultracentrifugation and by FPLC from plasmasamples of five subjects who received a constant infusionof deuterated leucine during 14 h. The FPLC techniqueallowed the isolation of pre�1 HDL from �HDL, and de-tectable isotopic enrichments in both fractions werefound with GC-MS analysis. To our knowledge, this studyis the first to distinguish enrichments data of pre�1 HDLand �HDL kinetic compared to total HDL usually isolatedin previous studies for kinetic measurements.
The linearity, reproducibility, and sensitivity of FPLCtechnique has been demonstrated previously to separatelipoproteins (16, 18, 19). With FPLC, the samples werenot exposed during the separation process to the highg-forces and salt concentrations related to ultracentrifuga-tion (12) that may shed some of the HDL componentsfrom the particle surface (e.g., apoA-I) (9). There was aprogressive loss of apoA-I of about 35% with repeated ul-tracentrifugation of HDL at a density of 1.21 g/ml (8).Moreover, this latter procedure required approximately 1ml to 3 ml of plasma for analysis, whereas only 200 �l werenecessary with FPLC to isolate pre� and �HDL and to de-
termine lipids and apolipoproteins concentrations in theeluted fractions. With the increasing use of the transgenicand knockout mouse models of study atherosclerosis, theability to separate lipoproteins classes from small volumesof whole plasma is interesting. However, separation usinggel filtration method resulted in sample dilutions.
The experimental values of tracer-to-tracee ratio forapoA-I-HDL after FPLC were less than those of HDL iso-lated by ultracentrifugation. This difference could be ex-plained by the difference in the separation process withultracentrifugation and FPLC and thus we did not analysethe same biological materials. Indeed, effects of ultracen-trifugation separation on apoA-I subpopulations were dra-matic. As demonstrated by Asztalos et al. (20), after ultra-centrifugation only free apoA-I and HDL with � mobilitywere found, indicating the loss of pre�1 and pre�2 fromthe bulk of flotating HDL. Free apoA-I could come fromdenaturation of different HDL subpopulations as smallparticles (pre�1 HDL). After FPLC, HDL with pre�1,pre�2, and � mobilities were detected. Therefore, FPLCreflects the biological diversity of lipoproteins better thanultracentrifugation.
Pre�1 and �HDL were isolated by FPLC and the purityof each subpopulation was validated by two-dimensionalPAGE. The purity of apoA-I contained in these lipopro-teins was determined by a denaturing two-dimensional gelelectrophoresis. The tracer-to-tracee ratios in pre�1 HDLwere higher than those of total HDL and �HDL. The fastand higher enrichment of pre�1 HDL could be explainedby the early role of these lipoproteins in the reverse trans-port. Total HDL obtained by ultracentrifugation was prob-ably composed of principally �HDL and of small quantityof pre�1 HDL. Thus, in previous studies, based on ultra-centrifugation, tracer-to-tracee ratios in apoA-I-HDL couldhave been overestimated by the presence of apoA-I-pre�1HDL in �HDL population.
The authors thank Mrs Pascale Maugère for her excellent tech-nical assistance and Dr Jean-François Bouhours for criticalreading of the manuscript.
REFERENCES
1. Gordon, T., W. P. Castelli, M. C. Hjortland, W. B. Kannel, and T. R.Dawber. 1977. High Density Lipoprotein as a protective factoragainst coronary heart disease: the Framingham study. Am. J. Med.62: 707–714.
2. Forte, T. M., and M. R. McCall. 1994. The role of apolipoproteinAI-containing lipoproteins in atherosclerosis. Curr. Opin. Lipidol. 5:354–364.
3. Barrans, A., X. Collet, R. Barbaras, B. Jaspard, J. Manent, C. Vieu,R. Chap, and B. Perret. 1994. Hepatic lipase induces the forma-tion of pre-beta1 high density lipoprotein from triacylglycerol-richHDL2. J. Biol. Chem. 269: 11572–11577.
4. O’Connor, P. M., B. R. Zysow, S. A. Schoenhaus, S. T. Ishida, S. T.Kunitake, J. M. Naya-Vigne, P. N. Duchateau, R. F. Redberg, S. J.Spencer, S. Mark, M. Mazur, D. C. Heilbron, R. B. Jaffe, M. J. Mal-loy, and J. P. Kane. 1998. Prebeta-1 HDL in plasma of normolipi-demic individuals: influences of plasma lipoproteins, age, and gen-der. J. Lipid Res. 39: 670–678.
5. Ikewaki, K., D. J. Rader, E. J. Schaefer, T. Fairwell, L. A. Zech, andH. B. Brewer. 1993. Evaluation of apo A-I kinetics in humans using
by guest, on Septem
ber 10, 2018w
ww
.jlr.orgD
ownloaded from

Chétiveaux et al. ApoA-I detection by gel filtration separation 1993
simultaneous endogenous stable isotope and exogenous radio-tracer methods. J. Lipid Res. 34: 2207–2215.
6. Havel, R. J., H. A. Eder, and J. H. Bragdon. 1955. The distributionand chemical composition of ultracentrifugation separated lipo-proteins in human serum. J. Clin. Invest. 34: 1345–1353.
7. Chapman, M. J., S. Goldstein, D. Lagrange, and P. M. Laplaud.1981. A density gradient ultracentrifugal procedure for the isola-tion of the major lipoprotein classes from human serum. J. LipidRes. 22: 339–358.
8. Kunitake, S. T., and J. P. Kane. 1982. Factors affecting the integrityof high density lipoproteins in the ultracentrifuge. J. Lipid Res. 23:936–940.
9. Cheung, M. C., and A. C. Wolf. 1988. Differential effect of ultra-centrifugation on apolipoprotein A-I-containing lipoprotein sub-populations. J. Lipid Res. 29: 15–25.
10. Nanjee, M. N., and E. A. Brinton. 2000. Very small apolipoproteinA-I-containing particules from human plasma : isolation and quan-tification by high-performance size-exclusion chromatography.Clin. Chem. 46: 207–223.
11. Frenais, R., K. Ouguerram, C. Maugeais, P. Mahot, P. Maugere, M.Krempf, and T. Magot. 1997. High density lipoprotein apolipopro-tein AI kinetics in NIDDM: a stable isotope study. Diabetologia. 40:578–583.
12. Ordovas, J. M., and D. Osgood. 2000. Preparative isolation ofplasma lipoproteins using fast protein liquid chromatography.Methods Mol. Biol. 110: 105–111.
13. März, W., R. Siekmeier, H. Scharnagl, U. B. Seiffert, and W. Gross.
1993. Fast lipoprotein chromatography: new method of analysisfor plasma lipoproteins. Clin. Chem. 39: 2276–2281.
14. Van Gent, T., and A. Van Tol. 1990. Automated gel permeationchromatography of plasma lipoproteins by preparative fast proteinliquid chromatography. J. Chromatogr. 525: 433–441.
15. Innis-Whitehouse, W., X. Li, W. V. Brown, and N-A. Le. 1998. Anefficient chromatographic system for lipoprotein fractionning us-ing whole plasma. J. Lipid Res. 39: 679–690.
16. Le, N-A., W. Innis-Whitehouse, X. Li, R. Bakker-Arkema, D. Black,and W. V. Brown. 2000. Lipid and apolipoprotein levels and distri-bution in patients with hypertriglyceridemia : effect of triglyceridereductions with atorvastatin. Metabolism. 49: 167–177.
17. Heukeshoven, J., and R. Dernick. 1988. Improved silver stain-ing procedure for fast staining in PhastSystem DevelopmentUnit. I. Staining of sodium dodecyl sulfate gels. Electrophoresis.9: 28–32.
18. Kieft, K. A., T. M. A. Bocan, and B. R. Krause. 1991. Rapid on-linedetermination of cholesterol distribution among plasma lipopro-teins after high-performance gel filtration chromatography. J.Lipid Res. 32: 859–866.
19. Ha, Y. C., and P. J. Barter. 1985. Rapid separation of plasma lipo-proteins by gel permeation chromatography on agarose gel super-ose 6B. J. Chromatogr. 341: 154–159.
20. Asztalos, B. F., C. H. Sloop, L. Woog, and P. S. Roheim. 1993. Two-dimensional electrophoresis of plasma lipoproteins: recognitionof new apo A-I containing subpopulations. Biochim. Biophys. Acta.1169: 291–300.
by guest, on Septem
ber 10, 2018w
ww
.jlr.orgD
ownloaded from