metrology and gauging instructed by: dr. sajid zaidi phd in advanced mechanics, utc, france ms in...
TRANSCRIPT

Metrology and Gauging
Instructed by: Dr. Sajid Zaidi
PhD in Advanced Mechanics, UTC, France
MS in Advanced Mechanics, UTC, France
B.Sc. in Mechanical Engineering, UET, Lahore
B.TECH Mechanical TechnologyIQRA COLLEGE OF TECHNOLOGY (ICT)INTERNATIONAL ISLAMIC UNIVERSITY, ISLAMABAD

Definition of MetrologyMetrology
◦ Comes from Greek “metron” (measure) and –logy.
◦ It refers to science of measurement, including all theoretical and practical aspects of measurement.
Measurement
◦ It is the procedure of comparing an unknown quantity to a known standard by means of consistent system of units.
◦ Provides a numerical value of quantity within certain limits of accuracy and precision.
Inspection
◦ It is the procedure in which part characteristics (e.g. dimension) are examined whether they conform to design specification.
◦ Many inspection procedures rely on measurement techniques while others use gauging methods (simply determine whether the part passes or fails inspection).
Met
rolo
gy a
nd G
augi
ngIn
trod
ucti
on

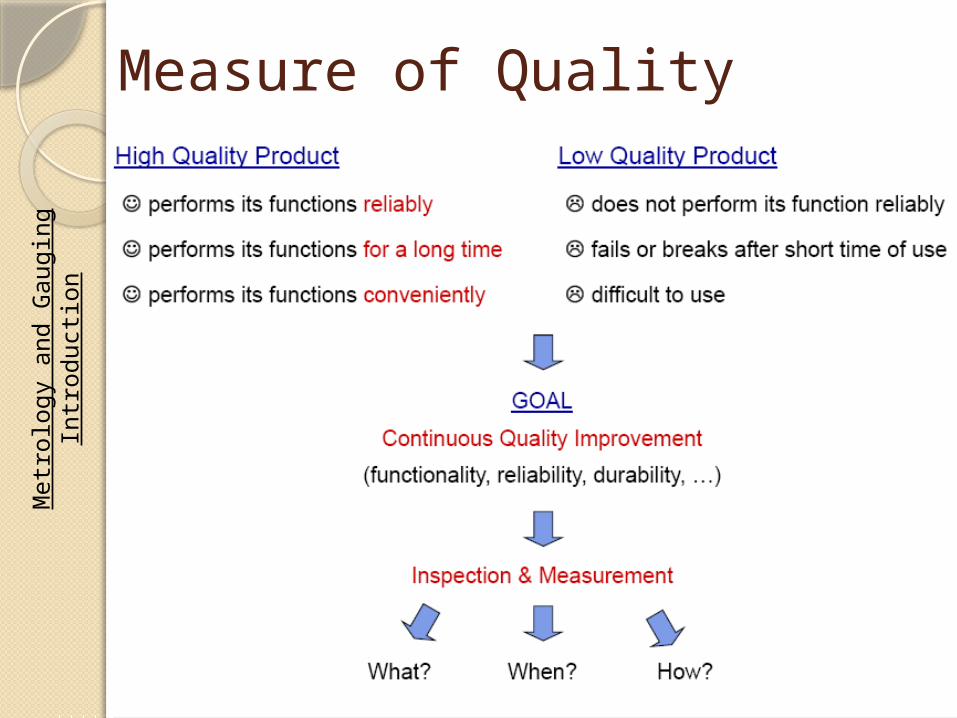
Definition of QualityQuality
◦ It refers to a product’s fitness for use.
◦ It is the totality of features that bear on a product’s ability to satisfy a given need.
Need of Inspection
◦ To ensure that part and components are confirmed to required standards.
◦ To meet the need of Interchangeability of parts.
◦ To maintain good customer relationship by ensuring that No faulty product reaches the customer.
◦ The result of inspection are forwarded to the manufacturing department, thus helps in improving the quality.
◦ It helps to purchase good quality raw material, tool and equipment.
◦ It led to development of precision measuring instruments.
Met
rolo
gy a
nd G
augi
ngIn
trod
ucti
on
Measure of QualityM
etro
logy
and
Gau
ging
Intr
oduc
tion

Measure of Quality – What to Inspect
Met
rolo
gy a
nd G
augi
ngIn
trod
ucti
on

Measure of Quality – When to Inspect
Met
rolo
gy a
nd G
augi
ngIn
trod
ucti
on
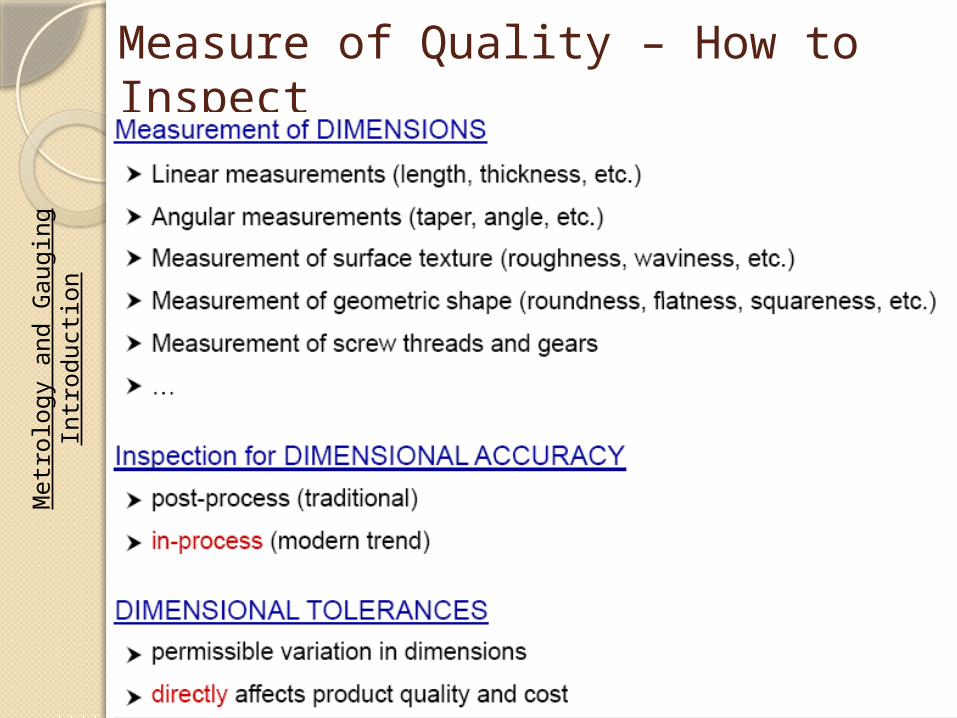
Measure of Quality – How to Inspect
Met
rolo
gy a
nd G
augi
ngIn
trod
ucti
on

Characteristics of Measurement Systems
The performance characteristics of a measuring system may be broadly divided into two groups, namely ‘static’ and ‘dynamic’ characteristics.
Static characteristics are the values given when steady-state conditions occur, i.e. the values given when the system has settled down after having received some input. Static characteristics also refer to the measurement of quantities which are constant or vary slowly with time. For example, the resistance of a resistor etc.
Dynamic characteristics refer to the behavior between the time that the input value changes and the time that the value given by the system settles down to the steady state value.
Met
rolo
gy a
nd G
augi
ngIn
trod
ucti
on
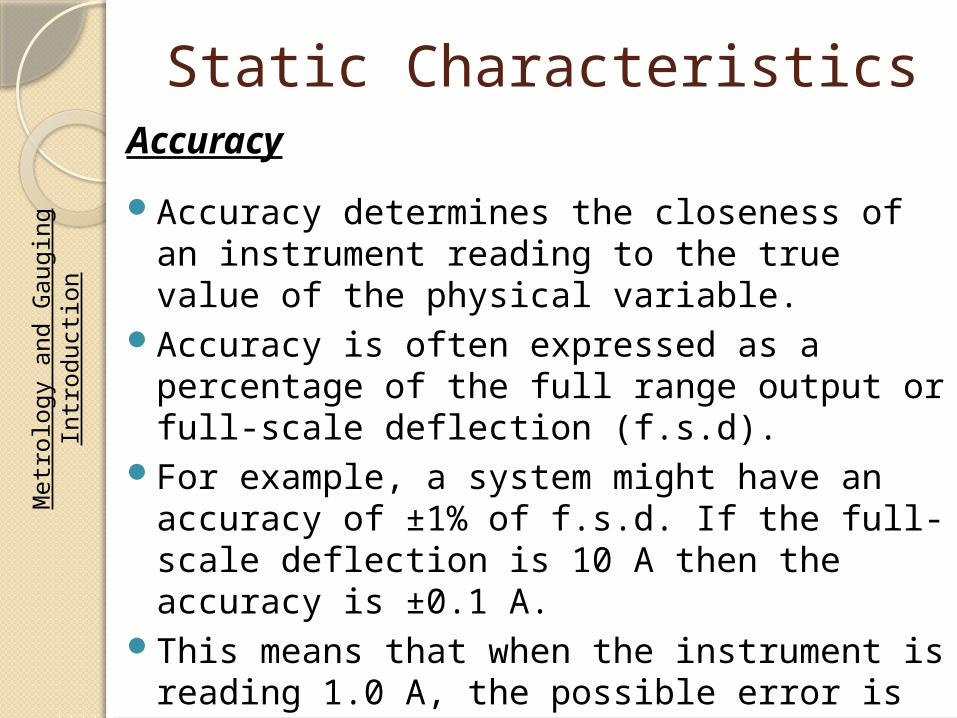
Static CharacteristicsAccuracy
Accuracy determines the closeness of an instrument reading to the true value of the physical variable.
Accuracy is often expressed as a percentage of the full range output or full-scale deflection (f.s.d).
For example, a system might have an accuracy of ±1% of f.s.d. If the full-scale deflection is 10 A then the accuracy is ±0.1 A.
This means that when the instrument is reading 1.0 A, the possible error is 10% of this value.
The accuracy is a summation of all the possible errors that are likely to occur.
Met
rolo
gy a
nd G
augi
ngIn
trod
ucti
on

Static CharacteristicsPrecisionThe term precision is used to describe the degree of
freedom of a measurement system from random errors.Precision is related to the repeatability of the instrument
reading.Thus, a highly precise measuring instrument will give
only a small spread of readings if repeated readings are taken of the same quantity.
A low precision system will give a large spread of readings.
For example, consider the following two sets of readings obtained for repeated measurements of the same quantity by two different instruments:
Met
rolo
gy a
nd G
augi
ngIn
trod
ucti
on

Static CharacteristicsPrecision
◦ 20.1 mm, 20.2 mm, 20.1 mm, 20.0 mm, 20.1 mm, 20.1 mm
◦ 19.9 mm, 20.3 mm, 20.0 mm, 20.5 mm, 20.2 mm, 19.8 mm The results of the measurement give values scattered about some
value. The first set of results shows a smaller spread of readings than the
second and indicates a higher degree of precision for the instrument used for the first set.
Precision is often, though incorrectly, confused with accuracy. High precision does not imply anything about measurement
accuracy. A high precision instrument may have a low accuracy. Low accuracy measurements from a high precision instrument are
normally caused by a bias in the measurements, which is removable by recalibration.
Met
rolo
gy a
nd G
augi
ngIn
trod
ucti
on

12
Static CharacteristicsPrecision Vs Accuracy
Met
rolo
gy a
nd G
augi
ngIn
trod
ucti
on

13
Mea
suri
ng a
fix
ed ta
rget
pos
ition
fro
m a
sat
ellit
e
Static CharacteristicsPrecision Vs Accuracy
Satellite Apollo 13:Low precisionlow accuracy
Satellite PolyU 18:High precisionlow accuracy
Satellite CYT 118:High precision, High accuracy
Met
rolo
gy a
nd G
augi
ngIn
trod
ucti
on
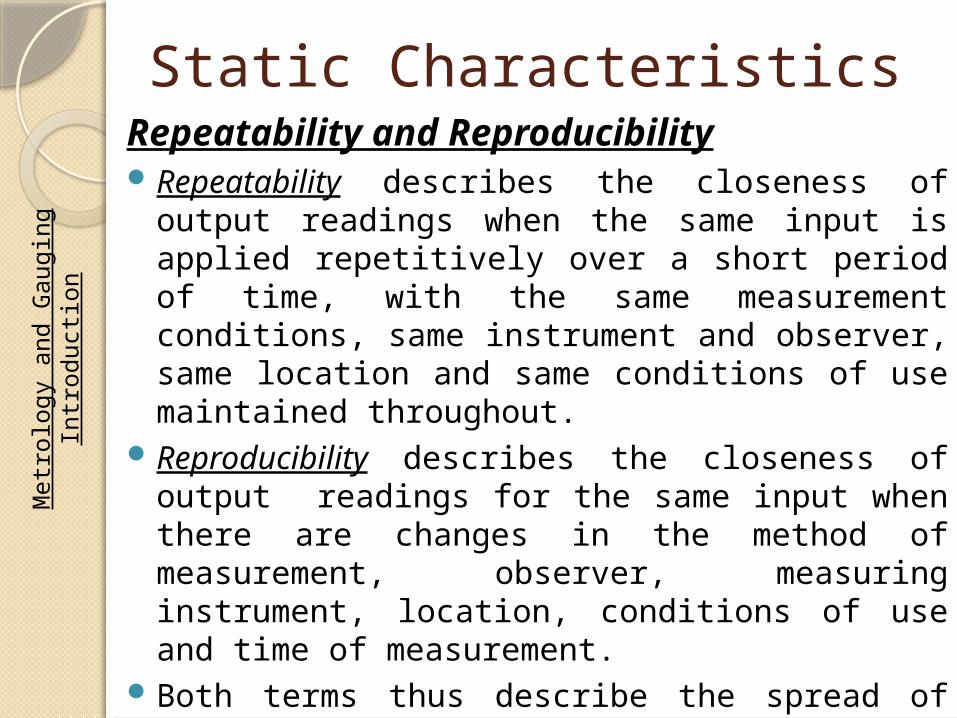
Static CharacteristicsRepeatability and ReproducibilityRepeatability describes the closeness of output readings when
the same input is applied repetitively over a short period of time, with the same measurement conditions, same instrument and observer, same location and same conditions of use maintained throughout.
Reproducibility describes the closeness of output readings for the same input when there are changes in the method of measurement, observer, measuring instrument, location, conditions of use and time of measurement.
Both terms thus describe the spread of output readings for the same input. This spread is referred to as repeatability if the measurement conditions are constant and as reproducibility if the measurement conditions vary.
Met
rolo
gy a
nd G
augi
ngIn
trod
ucti
on

Static CharacteristicsRangeThe range or span of an instrument defines the minimum
and maximum values of a quantity that the instrument is designed to measure. For example, a thermometer might be quoted as having a range of -200 to +800°C.
ThresholdIf the instrument input is very
gradually increased from zero there will be a minimum value required to give a detectable output change. This minimum value defines the threshold of the instrument.
input
Output
Threshold
Met
rolo
gy a
nd G
augi
ngIn
trod
ucti
on

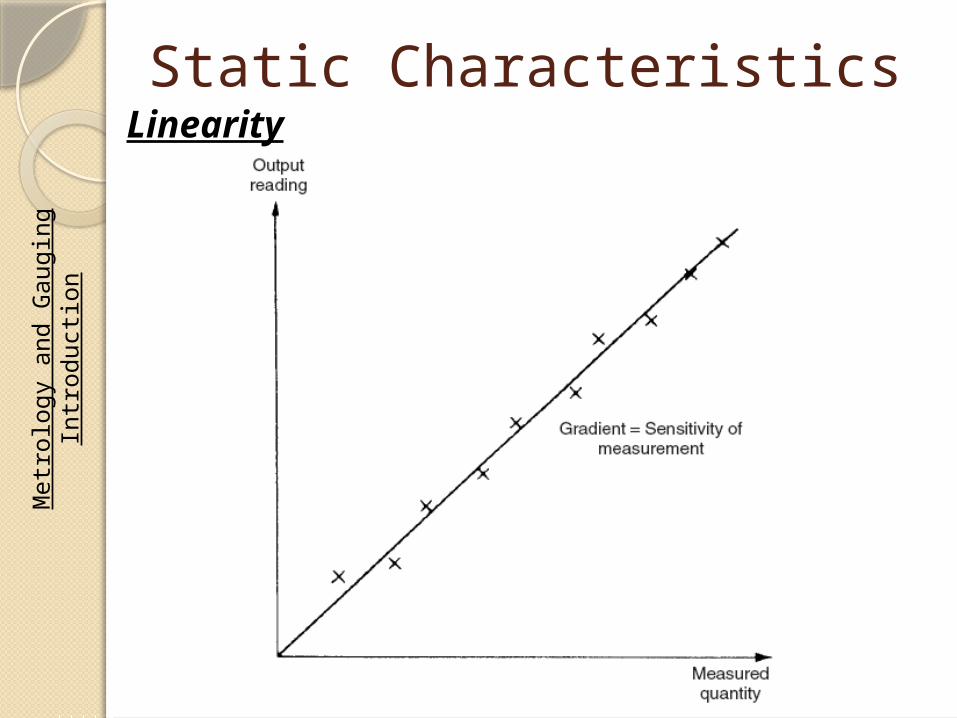
Static CharacteristicsLinearityIt is normally desirable that the output reading of an
instrument is linearly proportional to the quantity being measured.
The X’s marked on the Figure show a plot of the typical output readings of an instrument when a sequence of input quantities are applied to it.
Normal procedure is to draw a good fit straight line through the X’s, as shown in Figure.
The non-linearity is then defined as the maximum deviation of any of the output readings marked X from this straight line. It is usually expressed as a percentage of full-scale reading.
Met
rolo
gy a
nd G
augi
ngIn
trod
ucti
on
Static CharacteristicsLinearity
Met
rolo
gy a
nd G
augi
ngIn
trod
ucti
on

Static CharacteristicsSensitivityThe sensitivity indicates how much the output of an
instrument system changes when the quantity being measured changes by a given amount, i.e. the ratio of ouput to input.
For example, a thermocouple might have a sensitivity of 20 μV/ºC and so give an output of 20 μV for each 1ºC change in temperature.
If we take a series of readings of the output of an instrument for a number of different inputs and plot a graph of output against input, the sensitivity is the slope of the graph.
Met
rolo
gy a
nd G
augi
ngIn
trod
ucti
on

19
Load Cell
Force, F
Output, Vo
Output, Vo (V)
Input, Fi (kN)
Slope = Output / Input
Static CharacteristicsSensitivity
By plotting a graph and finding the best straight line, you can obtain the slope m from the expression y = mx + c
Met
rolo
gy a
nd G
augi
ngIn
trod
ucti
on
Static CharacteristicsErrorThe term error is used for the difference between the
result of the measurement and the true value of the quantity being measured, i.e.
error = measured value - true valueThus if the measured value is 10.1 when the true value is
10.0, the error is +0.10If the measured value is 9.9 when the true value is 10.0,
the error is -0.10Errors can arise in a number of ways and the following
describes some of the errors that are encountered in specifications of instrumentation systems.
Met
rolo
gy a
nd G
augi
ngIn
trod
ucti
on
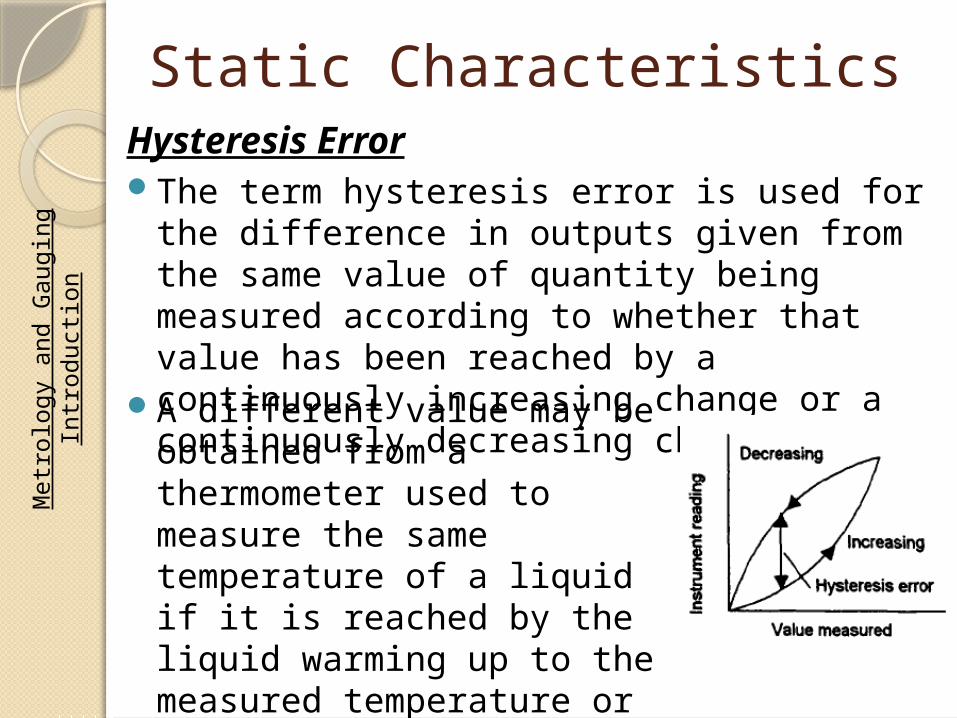
Static CharacteristicsHysteresis ErrorThe term hysteresis error is used for the difference in
outputs given from the same value of quantity being measured according to whether that value has been reached by a continuously increasing change or a continuously decreasing change.
A different value may be obtained from a thermometer used to measure the same temperature of a liquid if it is reached by the liquid warming up to the measured temperature or it is reached by the liquid cooling down to the measured temperature.
Met
rolo
gy a
nd G
augi
ngIn
trod
ucti
on
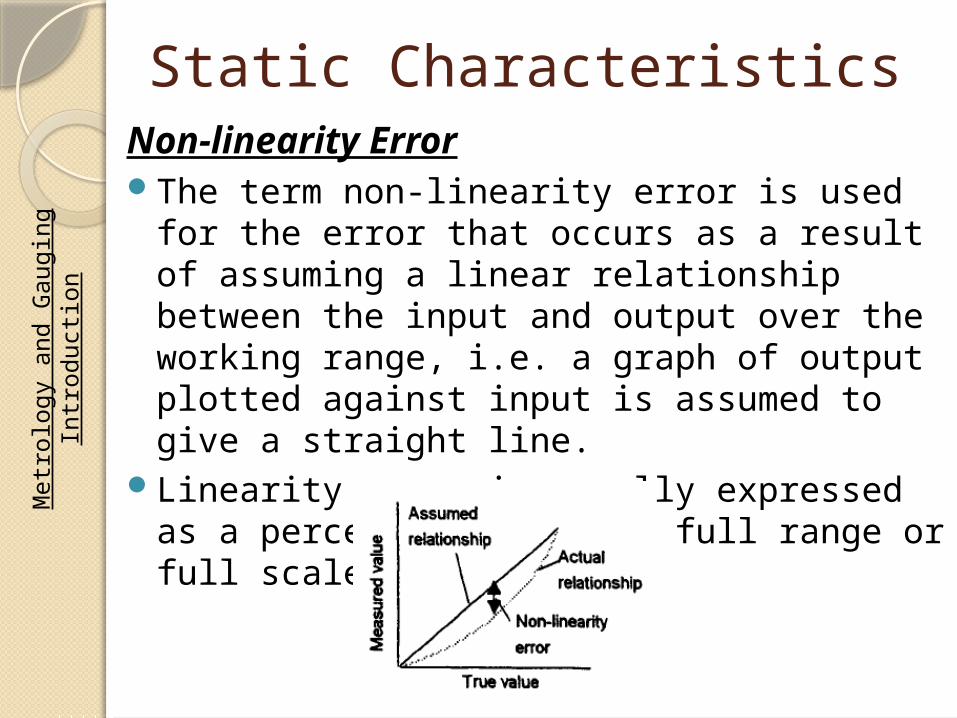
Static CharacteristicsNon-linearity ErrorThe term non-linearity error is used for the error that
occurs as a result of assuming a linear relationship between the input and output over the working range, i.e. a graph of output plotted against input is assumed to give a straight line.
Linearity error is usually expressed as a percentage error of full range or full scale output.
Met
rolo
gy a
nd G
augi
ngIn
trod
ucti
on
Static CharacteristicsInsertion ErrorWhen a cold thermometer is put in to a hot liquid to
measure its temperature, the presence of the cold thermometer in the hot liquid changes the temperature of the liquid. The liquid cools and so the thermometer ends up measuring a lower temperature than that which existed before the thermometer was introduced.
This effect is called loading and the consequence is the insertion error.
Loading is a problem that is often encountered when measurements are being made. For example, when an ammeter is inserted into a circuit to make a measurement of the circuit current, it changes the resistance of the circuit and so changes the current being measured.
Met
rolo
gy a
nd G
augi
ngIn
trod
ucti
on

Static CharacteristicsApplication
◦A commercial pressure measurement system is quoted in the manufacturer's specification as having: Range 0 to 10 kPa Supply Voltage ±15 V dc Linearity error ±0.5% FS Hysteresis error ±0.15% FS Sensitivity 5 V dc for full range Thermal sensitivity ±0.02%/ºC Thermal zero drift 0.02%/ºC FS Temperature range 0 to 50ºC
Met
rolo
gy a
nd G
augi
ngIn
trod
ucti
on
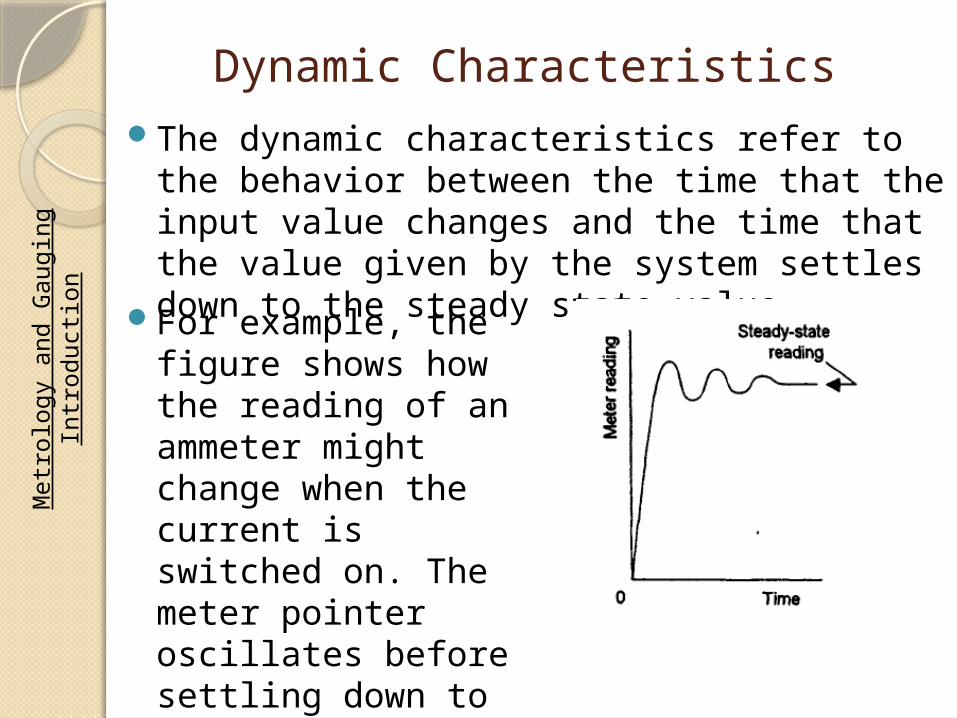
Dynamic CharacteristicsThe dynamic characteristics refer to the behavior
between the time that the input value changes and the time that the value given by the system settles down to the steady state value.
For example, the figure shows how the reading of an ammeter might change when the current is switched on. The meter pointer oscillates before settling down to give the steady-state reading.
Met
rolo
gy a
nd G
augi
ngIn
trod
ucti
on

Dynamic CharacteristicsResponse TimeThis is the time which elapses after the input to a system
is abruptly increased from zero to a constant value up to the point at which the system gives an output corresponding to some specified percentage, e.g. 95%, of the value of the input.
Rise TimeThis is the time taken for the output to rise to some
specified percentage of the steady-state output. Often the rise time refers to the time taken for the output to rise from 10% of the steady-state value to 90 or 95% of the steady-state value.
Met
rolo
gy a
nd G
augi
ngIn
trod
ucti
on