microbial communities mediating algal detritus turnover ... · other freshwater habitats (hoshaw...
TRANSCRIPT

Submitted 15 September 2016Accepted 18 November 2016Published 10 January 2017
Corresponding authorNoha H. Youssef, [email protected]
Academic editorJonathan Eisen
Additional Information andDeclarations can be found onpage 25
DOI 10.7717/peerj.2803
Copyright2017 Morrison et al.
Distributed underCreative Commons CC-BY 4.0
OPEN ACCESS
Microbial communities mediating algaldetritus turnover under anaerobicconditionsJessica M. Morrison1,*, Chelsea L. Murphy1,*, Kristina Baker1,Richard M. Zamor2, Steve J. Nikolai2, Shawn Wilder3, Mostafa S. Elshahed1 andNoha H. Youssef1
1Department of Microbiology and Molecular Genetics, Oklahoma State University, Stillwater, OK, USA2Grand River Dam Authority, Vinita, OK, USA3Department of Integrative Biology, Oklahoma State University, Stillwater, OK, USA*These authors contributed equally to this work.
ABSTRACTBackground. Algae encompass a wide array of photosynthetic organisms that areubiquitously distributed in aquatic and terrestrial habitats. Algal species often bloomin aquatic ecosystems, providing a significant autochthonous carbon input to thedeeper anoxic layers in stratified water bodies. In addition, various algal specieshave been touted as promising candidates for anaerobic biogas production frombiomass. Surprisingly, in spite of its ecological and economic relevance, the microbialcommunity involved in algal detritus turnover under anaerobic conditions remainslargely unexplored.Results. Here, we characterized the microbial communities mediating the degradationof Chlorella vulgaris (Chlorophyta), Chara sp. strain IWP1 (Charophyceae), and kelpAscophyllum nodosum (phylum Phaeophyceae), using sediments from an anaerobicspring (Zodlteone spring, OK; ZDT), sludge from a secondary digester in a localwastewater treatment plant (Stillwater, OK; WWT), and deeper anoxic layers from aseasonally stratified lake (Grand Lake O’ the Cherokees, OK; GL) as inoculum sources.Within all enrichments, the majority of algal biomass was metabolized within 13–16weeks, and the process was accompanied by an increase in cell numbers and a decreasein community diversity. Community surveys based on the V4 region of the 16S rRNAgene identified different lineages belonging to the phyla Bacteroidetes, Proteobacteria(alpha, delta, gamma, and epsilon classes), Spirochaetes, and Firmicutes that wereselectively abundant under various substrate and inoculum conditions. Within all kelpenrichments, themicrobial communities structures at the conclusion of the experimentwere highly similar regardless of the enrichment source, and were dominated by thegenus Clostridium, or family Veillonellaceae within the Firmicutes. In all other enrich-ments the final microbial community was dependent on the inoculum source, ratherthan the type of algae utilized as substrate. Lineages enriched included the unculturedgroups VadinBC27 and WCHB1-69 within the Bacteroidetes, genus Spirochaeta andthe uncultured group SHA-4 within Spirochaetes, Ruminococcaceae, Lachnospiraceae,Yongiibacter, Geosporobacter, and Acidaminobacter within the Firmicutes, and generaKluyvera, Pantoea, Edwardsiella and Aeromonas, and Buttiauxella within the Gamma-Proteobaceteria order Enterobacteriales.
How to cite this article Morrison et al. (2017), Microbial communities mediating algal detritus turnover under anaerobic conditions.PeerJ 5:e2803; DOI 10.7717/peerj.2803

Conclusions. Our results represent the first systematic survey ofmicrobial communitiesmediating turnover of algal biomass under anaerobic conditions, and highlights thediversity of lineages putatively involved in the degradation process.
Subjects MicrobiologyKeywords Algal detritus, Anaerobic degradation, Enrichment
INTRODUCTIONAlgae represent a globally distributed group of organisms that are capable of oxygenicphotosynthesis. While prevalent in aquatic marine and freshwater habitats (Cole,1982), algal taxa are also encountered in terrestrial ecosystems such as soil, rocks, andice/snow (Hoffmann, 1989). Collectively, algal species play an important role in globalcarbon, nitrogen, sulfur, and phosphorus cycling (Vanni, 2002). Taxonomically, algaeare polyphyletic, and are encountered within multiple eukaryotic phyla such as theAlveolata (e.g., dinoflagellates), Stramenopiles (e.g., Bacillariophyceae, Chrysophyceae,Eustigmatophyceae), Viridiplanta (e.g., Chlorophyta), in addition to exclusively algal phylasuch as the Euglenozoa, Cryptomonads, Haptophyta, and Rhodophyta (Amaral-Zettler,2011). In addition to their complex evolutionary origin, these organisms exhibit a widearray of morphological diversity, pigments, ecological distribution, cellular composition,genome size, and cell wall structure.
A major characteristic of many algal taxa is their fast growth rate, enabling them toform conspicuous seasonal blooms under the appropriate environmental conditions. Suchblooms are often associated with elevated nutrient (e.g., nitrogen and/or phosphorus)levels in the ecosystem, often resulting from anthropogenic inputs (e.g., sewage, industrialwaste, and fertilizers) (Hallegraeff, 1993), as well as from destratification and nutrientsresuspension (Wetzel, 2001). Classical examples of freshwater algal blooms involvemembersof the green algae (Chlorophyceae), whose blooms are often encountered in lakes andother freshwater habitats (Hoshaw &Mccourt, 1988), Chara blooms (commonly calledMuskgrass), which seasonally occur in ponds and lakes and cause a strong and unpleasantmusky odor (Durborow, 2014), as well as Diatoms, most commonly encountered in lakes(Sommer et al., 2012; Sommer et al., 1986). Fast growth is also a characteristic of manyannual or perennial macroscopic taxa. The classical example of such taxa is the brownalgae or Kelp (class Phaeophyceae), which is believed to be one of the most productivephotosynthetic organisms and tend to attain long lengths at a very fast elongation rate(∼50–60 cm/day) (Reed, Rassweiler & Arkema, 2008).
Algae provide a large input of organic carbon into aquatic ecosystems such as coastal kelpforests (Mann, 1988), meromictic and seasonally stratified lakes (Gies et al., 2014; Xia et al.,2016; Youssef et al., 2015), and coastal areas within marine environments (e.g., the NorthSea (Boon et al., 1998)). When blooming subsides, the algal detritus sinks and provides asubstantial organic carbon source to microbial communities within the ecosystem (Hecky& Hesslein, 1995). Algal degradation in aquatic habitats commences at or near the water
Morrison et al. (2017), PeerJ, DOI 10.7717/peerj.2803 2/35

surface by the microbial phycosphere: aerobic heterotrophic bacteria that are physicallyattached to algal cells (Buchan et al., 2014). However, a significant fraction of algal detritusreaches the lower strata of these water bodies, providing a considerable autochthonouscontribution to the carbon input in benthic layers within such ecosystems (Ask et al.,2009; Hecky & Hesslein, 1995). Sinking of algal detritus and the subsequent increase incarbon input result in the development of anoxic conditions in the lower strata and, hence,seasonal stratification. The size, intensity, and duration of these bloom-mediated anoxiczones are expected to be accentuated by future global warming trends (Paerl & Otten,2013). Surprisingly, while a large body of research has been conducted on elucidating themicrobial community composition of the algal phycosphere in the aerobic surficial marine(Amin, Parker & Armbrust, 2012; Hasegawa et al., 2007; Sapp, Wichels & Gerdts, 2007), andfreshwater habitats (Bagatini et al., 2014; Cai et al., 2014; Dittami et al., 2016; Eigemannet al., 2013; Jones et al., 2013; Muylaert et al., 2002), a surprising lack of knowledge existsregarding the microbial community and patterns of algal turnover under the anoxicconditions in the lower layers of stratified water bodies.
In addition to the importance of anaerobic degradation of algal biomass to the carboncycle in aquatic environments, the process has recently received additional attention asan integral component in algal biofuels production schemes. Direct conversion of kelpto methane (Cannell, 1990; Prabandono & Amin, 2015; Ramaraj, Unpaprom & Dussadee,2016) has been proposed as a promising approach for biogas production (Samson &Leduy, 1982; Vanegas & Bartlett, 2013; Vergara-Fernandez et al., 2008; Wiley, Campbell &McKuin, 2011; Yen & Brune, 2007; Yuan et al., 2011). The high fat content of multiple algaltaxa, e.g., Chlorella sp. (Guckert & Cooksey, 1990; Hu et al., 2008), and Chara sp. (Omer,2013), has prompted research into their large scale production in artificial ponds, andsubsequent extraction of their oil content as biodiesel (Cannell, 1990;Moazami et al., 2012;Prabandono & Amin, 2015; Ramaraj, Unpaprom & Dussadee, 2016). The economy of theprocess is further enhanced by anaerobic digestion of the algal detritus to produce methaneas an additional source (Cannell, 1990; Prabandono & Amin, 2015; Ramaraj, Unpaprom &Dussadee, 2016) using sludge from anaerobic wastewater treatment plants as the inoculumsource (Bohutskyi et al., 2015). While various aspects of the engineering and performancehave been studied, there is very little documentation of the identity of the microbialcommunity that is mediating algal detritus turnover under these anaerobic conditions.
Here, we sought to characterize patterns of algal turnover under anaerobic conditions,and identify members of the microbial community involved in the degradation ofvarious ecologically and economically relevant algal taxa. The process was investigatedin enrichments derived from three anaerobic habitats that either exhibit seasonalalgal blooming, or highly eutrophic environments that receive a high input oforganic compounds and previously shown to harbor a high level of microbialdiversity. To our knowledge, this is the first study that systematically characterized themicrobial community associated with algal degradation under anaerobic conditions.
Morrison et al. (2017), PeerJ, DOI 10.7717/peerj.2803 3/35

MATERIALS AND METHODSAlgal species (substrates/carbon source)We evaluated the microbial community mediating algal detritus degradation by settingenrichments with various types of algal biomass as the only source of carbon. Threedifferent algal species were examined: (1) Axenic Chlorella vulgaris strain UTEX 2714(phylum Chlorophyta), representing green algae that are known to bloom during summermonths (June–September) in multiple freshwater bodies within the US. Strain UTEX2714 was obtained from the University of Texas at Austin Algal Culture collection, andcultures were maintained on proteose medium plates (composition g l−1: NaNO3, 0.25;CaCl2.2H2O, 0.025, MgSO4.7H2O, 0.075; K2HPO4, 0.075, KH2PO4, 0.175, NaCl, 0.025;proteose peptone, 1, agar, 15) at 22 ± 3 ◦C. Fluorescent light was used (3500 lux) on a16:8 h light to dark cycle. Cultures were harvested by scraping the growth on the surface ofagar plates, and the resulting biomass was used as the carbon source. (2) Chara sp. strainIWP: Mats of Chara (class Charophyceae) were obtained from a local pond (InnovationWay Pond in Stillwater, OK, coordinates N36◦6′37.75′′ W97◦6′44.72′′) in August 2015,and identified using morphological and microscopic analysis as Chara sp. Chara is knownto grow locally in ponds in Oklahoma and peak around June–September (B Henley, pers.comm., 2016). Samples collected were thoroughly washed and soaked in DI water for2 h, to remove other associated biomass, before they were centrifuged and the resultingbiomass was used as the carbon source to represent class Charophyceae. (3) Kelp: Due to thegeographical location of the study and brown algae being common occurrences in marineenvironments, we were not able to obtain a fresh kelp sample to be used as a substrate.Alternatively, Ascophyllum nodosum (phylum Phaeophyceae) representing brown algae wasobtained as a whole dried powder from a local provider (Starwest Botanicals R©, Sacramento,CA, USA) and directly used as the carbon source.
It is worth noting that, with the exception of the axenic Chlorella culture, the Charaand the kelp samples were not guaranteed axenic and a minimal input of bacteria with thecarbon source in these enrichment bottles could not be ruled out.
Enrichment (inoculum) sourcesGrand Lake (GL)Samples were obtained from Grand Lake O’ the Cherokees (hereafter Grand Lake) toinvestigate the microbial community involved in algal turnover. The lake is a large(188 Km2) man-made lake in Northeastern OK operated by the Grand River DamAuthority, which keeps continuous records of the lake water geochemistry. Duringsummer months (starting in June), large areas of the lake become seasonally stratified,with deeper layers (June–September) becoming completely anoxic. Within these sites,surface chlorophyl1-a concentration peaks in May–July, followed by algal biomass sinkingto deeper anaerobic layer in September (Fig. S1). Sampling from the hypolimnion of Treeand Dream sites in GL occurred in September 2015 using a 4.0-L Van Dorn Bottle. Wholewater samples were stored on ice until processed in the laboratory where the lake waterwas centrifuged under anaerobic conditions to collect biomass used as inoculum source.
Morrison et al. (2017), PeerJ, DOI 10.7717/peerj.2803 4/35

Wastewater treatment plant (WWT)While wastewater treatment reactors do not represent an algae rich habitat, the use ofWWT material as an inoculum for biogas production from algal biomass sources hasbeen gaining considerable attention (Ward, Lewis & Green, 2014). The process is justifiedby the high organic content and adaptation to organic matter turnover under anaerobicconditions, coupled to the ready availability of WWT inocula (Sialve, Bernet & Bernard,2009). Various aspects of the engineering, kinetics, and the economy of the process, aswell as optimization of the inoculum load and substrate load, and algae pretreatmentmethods have been investigated (Hlavínek et al., 2016; Mudhoo, 2012; Nabarlatz et al.,2013; Ramaraj, Unpaprom & Dussadee, 2016; Samson & Leduy, 1982; Vergara-Fernandez etal., 2008;Ward, Lewis & Green, 2014), but little research on the identity of microorganismsmediating such process has been conducted. Samples were obtained from secondarytreatment sludge in the city of Stillwater, OK wastewater treatment plant in September2015. The sample was collected anaerobically and transferred to the laboratory (5 milesaway), where they were promptly centrifuged under anaerobic conditions and used asinoculum source.
Zodletone spring (ZDT)Zodletone spring is an anaerobic surficial spring in southwestern OK (35◦0′9′′N98◦41′17′′W). Due to the constant ejection of sulfide laden water from the springsource, the shallow spring is light exposed, yet mostly anoxic (Buhring et al., 2011). Themicrobial community in the spring has been extensively investigated (Coveley, Elshahed &Youssef, 2015; Youssef, Couger & Elshahed, 2010), and the spring harbors a highly diversecommunity of phototrophs, chemolithotrophs, and heterotrophs. Samples were collectedfrom Zodletone spring source in August 2015 in a filled mason jar (to maintain anoxicconditions), transferred to the laboratory at 4 ◦C and used as inoculum source on the sameday of sampling.
Enrichments setupEnrichments were prepared in 120 ml serum bottles under anaerobic conditions. Ninedifferent treatments (three algal substrates × three different inoculum sources) were setup in triplicates. Serum bottles contained 45 ml of an anoxic solution containing (perliter): 150 ml of minerals solution I (K2HPO4 3 g l−1), 150 ml of mineral solution II (g l−1:KH2PO4, 3; (NH4)2SO4, 6; NaCl, 6; MgSO4.7H2O, 0.6, and CaCl2.2H2O, 0.6), 10 ml Balchvitamins solution (mg l−1: biotin, 2; folic acid, 2; pyridoxine-HCl, 10; thiamine-HCl, 5;riboflavin, 5; nicotinic acid, 5; calcium pantothenate, 5; vitamin B12, 0.1; p-aminobenzoicacid, 5; lipoic acid, 5), 1 ml of Wolin’s metal solution (g l−1: EDTA, 0.5; MgSO4.6H2O,3.0; MnSO4.H20, 0.5; NaCl, 1; CaCl2.2H2O, 0.1; FeSO4.7H2O, 0.1; ZnSO4.7H2O, 0.1;CuSO4.7H20, 0.01; AlK(SO4)2, 0.01; Na2MoO4.2H20, 0.01; boric acid, 0.01; Na2SeO4,0.005; NiCl2.6H20, 0.003; CoCl2.6H20, 0.1). The media were amended with L-cysteinehydrochloride (0.05 g/l final concentration) as a reductant, and resazurin (0.0001% finalconcentration) as a redox indicator, boiled under a stream of N2 gas, dispensed in the serumbottles, autoclaved, cooled, then transferred to an anaerobic chamber (Coy Laboratory
Morrison et al. (2017), PeerJ, DOI 10.7717/peerj.2803 5/35

Products Inc., Ann Arbor, MI, USA) where 5 g of sediment (Zodletone, ZDT), 5 g ofsludge (wastewater treatment plant, WWT), or 5 ml of concentrated lake water (thepellet obtained after centrifugation of 1.5 L of Grand Lake water (GL)) were added asthe inoculum sources. Algal biomass was added as a substrate (∼0.25 g per bottle). Inaddition, substrate unamended controls (i.e., ZDT, WWT, and GL enrichments with noalgal substrates) were included. After enrichment preparation in the anaerobic chamber,the bottles were stoppered, sealed, taken out of the chamber and the headspace in thebottles was changed by repeated flushing with 100% N2. Samples were incubated at roomtemperature (22 ◦C) in the dark. Enrichments were periodically sampled (at 4, 7, 8, and10 weeks) for DNA extraction by thoroughly mixing the serum bottle and anoxicallywithdrawing 3 ml of the enrichment. At the end of the enrichment process (13 weeks forGL, 16 weeks for ZDT and WWT), bottles were sacrificed, centrifuged and 3 ml of thepellet was used for DNA extraction. The rest of the pellet was used for chemical analysis ofthe remaining algal detritus.
DNA extraction, amplification, and sequencingDNA was extracted using the PowerSoil R© DNA Isolation Kit (MO BIO Laboratories,West Carlsbad, CA, USA) as per the manufacturer’s instruction. DNA from triplicatetreatments was pooled prior to amplification and sequencing. DNA from substrate-unamended controls was also extracted (hereafter pre-enrichment sample). The extractedand pooled DNA (n= 30; 3 inoculum sources × 3 algal substrates × 3 time points, plus3 pre-enrichment samples) was quantified using Qubit fluorometer (Life technologies R©,Carlsbad, CA, USA). The genes for the V4 hypervariable region of 16S rRNAwere amplifiedusing the prokaryotic-specific primer pair 515F and 806R (Wang & Qian, 2009) to avoidamplification of eukaryotic 18S rRNA. Products were sequenced using paired-end IlluminaMiseq platform, as previously described (Caporaso et al., 2012). Both PCR amplificationand Illumina sequencing were conducted using the services of the Genomic Sequencing andAnalysis Facility (GSAF) at the University of Texas at Austin. The sequences are depositedin the SRA database under accession number SRP083898.
Data analysisSequence processingmothur software (Schloss et al., 2009) was used for most of the sequence processing andoperational taxonomic unit (OTU) assignments. Most of the analyses were conducted onthe cowboy server, a high performance super computer housed at the Oklahoma State HighPerformance Computing Center (https://hpcc.okstate.edu/). For quality control purposesand to eliminate poor quality sequences, an average quality score of 25 was chosen asthe threshold value below which sequences were considered of poor quality and removedfrom the dataset. In addition, sequences that contained an ambiguous base (N), sequenceshaving a homopolymer stretch longer than 8 bases, and sequences longer than 293 bp werealso removed from the datasets.
High-quality reads were aligned in mothur using the Silva alignment database as atemplate. Aligned sequences were then filtered to remove columns that correspondedto ‘.’ or ‘-’ in all sequences. Filtered alignments were then subjected to a pre-clustering
Morrison et al. (2017), PeerJ, DOI 10.7717/peerj.2803 6/35

de-noising step using a pseudo-single linkage algorithmwith the goal of removing sequencesthat are likely due to sequencing errors (Huse et al., 2010). Possible chimeric sequenceswere identified and removed using chimera.slayer in mothur. The taxonomy of theremaining sequences was identified according to the Silva taxonomic outline (Release 123,https://www.arb-silva.de/). The aligned, filtered, de-noised, and chimera-free sequenceswere used to generate an uncorrected pair wise distance matrix. Sequences were clusteredinto operational taxonomic units (OTUs) at 0.03% sequence divergence cutoff using thevsearch clustering method employed through mothur. A shared file was created and wasused for subsequent analyses. Most of the above steps were derived from the MiSeq SOPavailable from the mothur website (http://www.mothur.org/wiki/MiSeq_SOP).
Criteria used to define lineages contributing to the degradation processPhyla considered significant to the degradation process were empirically defined as thosephyla that constituted 5% or more of the community at any time during enrichment.These include phyla that were abundant prior to enrichment and remained abundantduring and after enrichment, phyla that transiently increased in abundance during partof the enrichment but then decreased in abundance by the end of enrichment, and phylathat significantly and progressively increased in abundance with enrichment time. Withinthese abundant phyla, genera considered significant to the degradation process were alsoempirically defined as those whose percentage abundance represented 1% or more of thetotal abundance.
Diversity and community structure comparisonsVarious alpha diversity indices (Shannon, Chao, Ace, Good’s coverage) were performedon individual datasets in mothur. When comparing species richness across datasets(e.g., number of observedOTUs, species richness estimates using Chao andAce estimators),numbers were reported per sample size to normalize for the differences in the number ofsequences obtained between datasets. Beta diversity based on community structure wasassessed by calculating pairwise Bray–Curtis dissimilarity indices and using the output toconstruct non-metric multidimensional scaling (NMDS) plots in mothur.
Statistical analysesTo study the significance of the effect of inoculum source versus algae type on communitystructure, we performed an analysis of variance using the function Adonis in the R statisticalpackage vegan. The effect was visualized using the percentage abundances of significantphyla/classes (≥5% as defined above) in a constrained correspondence analysis (CCA)using the function cca in the R statistical package vegan.
Quantitative PCRWe used qPCR to quantify total Bacteria, total Archaea, as well as methanogens and sulfate-reducing bacteria in the enrichments using a MyiQ thermocycler (Bio-Rad Laboratories,Hercules, CA) and SYBR GreenERTM qPCR SuperMix for iCycler R© Instrument (LifeTechnologies). Primer pair EUB-338F/UNI518R (Fierer et al., 2005) was used to amplifythe 16S rRNA genes from the total bacterial community, primer pair A341F/A519R (Qian
Morrison et al. (2017), PeerJ, DOI 10.7717/peerj.2803 7/35

et al., 2011) was used to amplify 16S rRNA genes from the total archaeal community,primer pair mlas-ModF/mcrA-R (Angel, Claus & Conrad, 2012) was used to amplify themethyl-CoenzymeM reductase (mcrA) gene from the total methanogenic community, andprimer pair Dsr2060F/Dsr4R (Balk, Keuskamp & Laanbroek, 2015) was used to amplifythe dissimilatory sulfite reductase (dsrB) gene from the total sulfate reducing community.The 25-µl PCR reaction mixtures contained 0.3 µM of each forward and reverse primers(final concentration), 2 µl extracted template DNA, and 12.5 µl SYBR GreenERTM qPCRSuperMix. The reactions were heated at 95 ◦C for 8.5 min, followed by 40 cycles, withone cycle consisting of 30 s at 95 ◦C, 45 s at 50 ◦C (for total bacteria, total archaea, andmethanogens) or 55 ◦C (for sulfate reducers), 30 s at 72 ◦C, and 15 s at 85 ◦C for signalreading. To calculate the total number of cells belonging to total bacteria, total archaea,methanogens, and sulfate reducers in the enrichments, a standard curve was generatedusing DNA from Bacillus subtilis strain 168 (ATCC 23857), Haloferax sulfurifontis strainM6 (DSM 16227), Methanosarcina hungatei strain JF1 (ATCC 27890), and Desulfovibriodesulfuricans strain G20 (ATCC BAA-1058), respectively. To account for the multiplecopies of 16S rRNA genes per cell, the number of copies obtained from the standard curvewas divided by an empirical value of 3.5 (average of 1–6 copies of rRNA genes in onecell). However, since the mcrA and dsrB genes are known to be present as single copies inmethanogens, and sulfate reducers, respectively, no such adjustment of the total numberof cells was required when calculating the total number of cells belonging to methanogensand sulfate reducers.
Chemical analysis of algal detritusWe studied the change in chemical composition of algal detritus during enrichment byquantifying the total soluble carbohydrates, total starch, total protein, and total lipid contentof algal biomass pre and post enrichment. Algal detritus was dried overnight at 40 ◦C thenweighed (DWf; final dry weight) and ground to fine material. The ground material wasfirst used for protein extraction using the method described previously (Rausch, 1981).Briefly, algal detritus was extracted 2–3 times with 0.5N NaOH at 80–100 ◦C for 10 minfollowed by cooling and centrifugation to collect the total protein in the supernatant. Totalprotein extracts were frozen at −20 ◦C until assayed using Qubit Protein Assay Kit (Lifetechnologies). The pellet remaining after protein extraction was used for extraction oftotal soluble carbohydrates and starch. The pellets were first washed 2–3 times with 1 mlacetone to remove pigments. Total soluble carbohydrates were then extracted from thepellet using 80% ethanol according to the protocol in Maness (2010) and the total ethanolextract was dried overnight at 40 ◦C followed by dissolving the dried extract in water.Total starch remaining in the pellet was extracted by boiling with 1.1% HCl for 30 minfollowed by centrifugation. Total soluble carbohydrates, as well as total starch extractedwere quantified using the anthrone method (Maness, 2010). The total crude lipids wereextracted from dried algal material with chloroform and quantified with a Nile red assaymodified for microplates using the protocol described previously (Higgins et al., 2014).
Morrison et al. (2017), PeerJ, DOI 10.7717/peerj.2803 8/35

RESULTSSequencing outputA total of 1,007,906 sequences were obtained from all enrichments. After implementationof all quality control criteria described above, 889,230 sequences (88.2%) were retained forfurther analysis. The average number of sequences per dataset was 26,946. The calculatedGood’s coverage for the majority of samples at putative species (OTU0.03, 30 out of 32samples) and family (OTU0.10, 31 out of 32 samples) levels were always above 96 and98.2% (average 98.4, and 99.5%, respectively), strongly indicating that the communitieshave been adequately sampled in all enrichments (Table S1).
Enrichment progress and diversity patternsMultiple lines of evidence strongly indicate that in all nine treatments, algal detritusdegradation occurred and was coupled to an increase in prokaryotic cell numbers and adecrease in alpha diversity both implying enrichment of specific taxa. Visual inspection ofall enrichments revealed significant loss of the dried kelp powder, and the algal biomass(Chlorella and Chara) at the conclusion of the experiment. Final time point analysisdemonstrated that the majority of the starting dry weight of Chara (86.3, 94.5, and98.0%), Chlorella (96.0, 98.0, and 99.0%), and, to a relatively lower extent, kelp (56.7,and 33.6, 83.3%) in ZDT, WWT, and GL enrichments, respectively, was metabolized atthe conclusion of the experiment. Analysis of the chemical composition of the remainingalgal detritus in comparison to the starting material showed that the carbohydrate, lipid,and protein contents of the algal detritus were consumed to varying extents (Table 1).Quantitative PCR (qPCR) demonstrated a progressive increase in bacterial 16S rRNAgene copies/ml enrichment in all samples. An increase of 3.5–88.5 fold in total numberof bacterial cells was observed by week 13–16 in all enrichments and 14.6–2,142 fold inthe total number of archaeal cells was observed by week 13–16 in 6 out of 9 enrichments(Fig. 1). Finally, we followed the change in diversity estimates in the enrichments datasetsas a proxy for enrichment progress. At the end of all enrichments (weeks 13 or 16), thenumber of observed OTUs0.03 and OTUs0.1 as well as the estimated species richness (usingboth Chao and ACE estimators) decreased compared to the pre-enrichment sample, henceindicating the selection for few taxa (Table 2).
Microbial community structure analysisBray–Curtis dissimilarity indices at OTU0.03 coupled to non-metric multidimensionalscaling (NMDS)were used to compare and visualize differences in themicrobial communitystructure between all enrichments at all sampled data points. At first glance, it was apparentthat the enriched microbial communities (week 7-10-16 in cases of WWT and ZDTmicrocosms, or week 4-8-13 in case of GL microcosms) within each algae type-enrichmentsource combination (n= 9, blue, green, and red shapes in Fig. 2) clustered closely together,and were distinct from the pre-enrichment microbial community (black shapes in Fig.2). This observation strongly suggests that the abundant microbial community obtainedduring the first few weeks of enrichment (week 4 or 7) persisted throughout the enrichmentandwas responsible for the algal biomass degradation observed at the end of the enrichment
Morrison et al. (2017), PeerJ, DOI 10.7717/peerj.2803 9/35

Table 1 Percentage of various algal components consumed under different enrichment conditions.a
ZDT enrichment WWT enrichment GL enrichment
Algal detritus components Chara Chlorella Kelp Chara Chlorella Kelp Chara Chlorella Kelp
Carbohydrate 87 96.5 52.9 99.7 98 15.7 98.3 99.2 86.2Protein 72 92.9 60 94 96.9 70 96 97.6 82Lipid 100 NAb 71 62.5 NAb 70 96 NAb 86% Biomass lostc 86.3 96 56.7 94.5 98 33.6 98 99 83.3
Notes.aCarbohydrate, protein, and lipid contents of algal detritus were determined before and after enrichment. Percentages are calculated based on the dry weight at Tf. Original algaldetritus composition was as follows (%Carbohydrate: %Protein: %Lipid): Chara, 88:6.5:5.5; Chlorella, 86.7:13.3:0; Kelp, 67.9:14.1:18.
bLipids in Chlorella biomass were BDL.cBased on dry weight remaining at the end of enrichment (DWf), and the initial dry weight used for enrichment (DW0) using the equation: % biomass loss=(DW0 − DWf)/DW0 × 100. Initial dry weight for kelp was equivalent to the weight added to each enrichment bottle since it was in dry powder form. However, initial dryweight for Chara and Chlorella was determined by incubating an amount equivalent to the wet weight added to each enrichment bottle overnight at 40 ◦C then weighing its dryweight following moisture loss.
(Table 1). Analysis of the effect and relative contribution of algae type (Chlorella, Chara,or kelp) versus inoculum source (ZDT, WWT, and GL) on the enriched microbialcommunities revealed that kelp selects for a distinct and highly similar microbialcommunity, regardless of the inoculum source (ZDT, WWT, and GL) (Fig. 2A). Onthe other hand, within Chlorella and Chara-derived enrichments, the inoculum source,rather than the algae type appears to be the more important factor in shaping the microbialcommunities (Fig. 2A). This is evident by the presence of three distinct clusters in theNMDS plot corresponding to the three sources of inoculum (ZDT, WWT, and GL)(Fig. 2A).
In addition, analysis of variance (using Adonis function) showed that both the algaetype and the source of inoculum were significant in shaping the microbial communityalbeit to varying levels (p-value for algae type = 0.028, p-value for inoculum source =0.001). To decipher the relative contributions of algae type versus inoculum source onthe microbial community composition at the phylum/class level we employed canonicalcorrespondence analysis (CCA) using the enriched phyla/classes relative abundances. Theresults (Fig. 2B) confirmed the above observation, where the algae type appears to haveshaped the microbial community in case of kelp enrichments, while within Chara andChlorella enrichments, the source of inoculum played a more important role in shapingthe community (Fig. 2B).
Phylogenetic affiliation of enriched taxa in algal enrichmentsIn general, a handful of phyla were consistently abundant across all treatments andwere considered significant to the algal degradation process (see the criteria we used fordefining such phyla in ‘Materials and Methods’). These phyla were: Firmicutes (in allnine enrichments), Bacteroidetes (in six enrichments), Spirochaetes (in five enrichments),and the Gamma (5 enrichments), Delta (6 enrichments), Alpha, Beta, and Epsilon (oneenrichment) Proteobacteria (Figs. 3–5). However, within this limited number of phyla,the family/genus level enrichment patterns varied widely, suggesting the involvement of awide range of bacterial lineages in the degradation process. Below, we provide a detailed
Morrison et al. (2017), PeerJ, DOI 10.7717/peerj.2803 10/35

Figure 1 Total number of bacterial, archaeal, sulfate-reducing, andmethanogenic cells in the pre-enrichment sample (�) versus post-enrichment samples at week 4 for GL enrichments or week 7 forZDT andWWT enrichment (�), post-enrichment samples at week 8 for GL enrichments or week 10 forZDT andWWT enrichment ( ), and post-enrichment samples at week 13 for GL enrichments or week16 for ZDT andWWT enrichment ( ) as measured by quantitative PCR. The enrichment inoculumsource is shown on the left, while the algae type used is shown on top. Error bars are averages± standarddeviations from three biological replicates. Linear regression analysis was performed to examine the trendof increase in cell numbers with the weeks of enrichment, and the significance of such trend was tested bycalculating the P-values of the F-statistics obtained, where ‘‘**’’ denotes significant P-value < 0.05, ‘‘*’’denotes p-value > 0.05 but < 0.1, ‘‘NS’’ denotes non-significant P-value > 0.1, and ‘‘ND’’ refers to caseswhere the linear regression analysis was not performed because two or more samples were below the de-tection level of the qPCR. In the few cases, denoted by a superscript letter a, where the total cell numbersincreased initially then decreased by the last week of enrichment, the linear regression was only carried ontotal numbers from the first three weeks of enrichments.
analysis of the enriched families/genera across various enrichments. The detailed microbialcommunity composition across all datasets is shown in Table S2.
Chara microcosmsIn Chara microcosms, Bacteroidetes, Firmicutes, and Delta-Proteobacteria wereconsistently abundant (Table 3) and, collectively, constituted the majority (40.2% to72.7%) of the community at the end of enrichment. Spirochaetes were abundant only inWWT and ZDT enrichments, while Gamma-Proteobacteria were abundant only in GL andZDT enrichments (Figs. 3–5).
Within the Bacteroidetes, the uncultured putative genus VadinBC27 was consistentlyenriched (Table 3) regardless of the inoculum source. This uncultured subgroup withinthe order Bacteroidales has been previously identified as a major lineage in anaerobic
Morrison et al. (2017), PeerJ, DOI 10.7717/peerj.2803 11/35

Table 2 Number of OTUs0.03 and OTUs0.1 normalized to the total number of sequences, and the estimated species richness (using both Chaoand ACE estimators) normalized to the total number of sequences.
Chara Chlorella Kelp
Source_cutoffa Weeks ofenrichment
OTUs Chao ACE OTUs Chao ACE OTUs Chao ACE
;ZDT_0.03 0 0.193 0.373 0.501 0.193 0.373 0.501 0.193 0.373 0.501; 7 0.021 0.040 0.056 0.031 0.054 0.067 0.060 0.130 0.255; 10 0.030 0.051 0.068 0.022 0.043 0.058 0.069 0.148 0.265; 16 0.028 0.059 0.078 0.025 0.051 0.069 0.046 0.118 0.208;ZDT_0.1 0 0.051 0.078 0.088 0.051 0.078 0.088 0.051 0.078 0.088; 7 0.008 0.011 0.010 0.016 0.023 0.028 0.026 0.043 0.058; 10 0.012 0.017 0.016 0.009 0.013 0.015 0.026 0.042 0.053; 16 0.011 0.016 0.019 0.009 0.012 0.014 0.019 0.029 0.040;GL_0.03 0 0.043 0.091 0.140 0.043 0.091 0.140 0.043 0.091 0.140; 4 0.008 0.019 0.033 0.014 0.025 0.035 ND ND ND; 7 0.014 0.032 0.044 0.010 0.020 0.024 0.092 0.116 0.123; 13 0.022 0.055 0.057 0.011 0.018 0.029 0.036 0.063 0.076;GL_0.1 0 0.020 0.032 0.042 0.020 0.032 0.042 0.020 0.032 0.042; 4 0.003 0.007 0.009 0.008 0.015 0.022 ND ND ND; 7 0.006 0.015 0.020 0.005 0.009 0.010 0.051 0.058 0.061; 13 0.010 0.015 0.014 0.005 0.007 0.008 0.017 0.026 0.029;WWT_0.03 0 0.048 0.087 0.108 0.048 0.087 0.108 0.048 0.087 0.108; 7 0.043 0.072 0.092 0.066 0.109 0.140 0.013 0.039 0.055; 10 0.020 0.036 0.046 0.033 0.052 0.061 0.020 0.043 0.064; 16 0.030 0.051 0.068 0.021 0.036 0.043 0.012 0.025 0.035;WWT_0.1 0 0.013 0.022 0.029 0.013 0.022 0.029 0.013 0.022 0.029; 7 0.018 0.025 0.024 0.030 0.043 0.048 0.006 0.009 0.012; 10 0.006 0.009 0.009 0.013 0.019 0.019 0.006 0.010 0.014; 16 0.011 0.015 0.017 0.008 0.010 0.010 0.004 0.007 0.009
Notes.aSource refers to the inoculum source, while cutoff refers to the percentage divergence cutoff used to assign sequences into operational taxonomic units (OTUs). For each inocu-lum source, the numbers are shown for OTUs at the putative species level (0.03) and the putative order level (0.1).ND, Not determined due to the small number of sequences obtained for this dataset.
digestors (Liu et al., 2016; Riviere et al., 2009; Xie et al., 2014; Xu et al., 2012) and wasimplicated as an anaerobic fermenter of sludge or other carbon sources. Other enrichedBacteroidetes members include the genera Mangroviflexus (ZDT microcosms), previouslyidentified as an important in-situ fermenter of organic matter-rich soil (Ding et al., 2016)and anaerobic cellulolytic microcosms (Gao, Xu & Ruan, 2014), Paludibacter (WWT andZDT microcosms), previously enriched from anaerobic freshwater sediment (Sanchez-Andrea et al., 2013) and shown to be an anaerobic propionate-producer (Qiu et al.,2014; Ueki et al., 2006), Bacteroides (WWT and GL microcosms), a well-documentedcomplex carbohydrate degrader in a wide range of environments (Adamberg et al., 2015;Dongowski, Lorenz & Anger, 2000; Jiménez, Chaves-Moreno & Van Elsas, 2015), Barnesiella(GL microcosms), a known fermentative gut microbe (Wang et al., 2015), and WCHB1-69(ZDT microcosms), a yet-uncultured Bacteroidetes family previously encountered in
Morrison et al. (2017), PeerJ, DOI 10.7717/peerj.2803 12/35

Figure 2 Microbial community structure analysis in the enrichment microcosms (n = 26) ascompared to the pre-enrichment inoculum sources (n = 3). The inoculum sources are denoted byshapes; ZDT (©), WWT ( ), and GL (�), and the algae types are denoted by color; Chara (blue),Chlorella (green), Kelp (red), and no algae, i.e., pre-enrichment community, (black). (continued on nextpage. . . )
Morrison et al. (2017), PeerJ, DOI 10.7717/peerj.2803 13/35
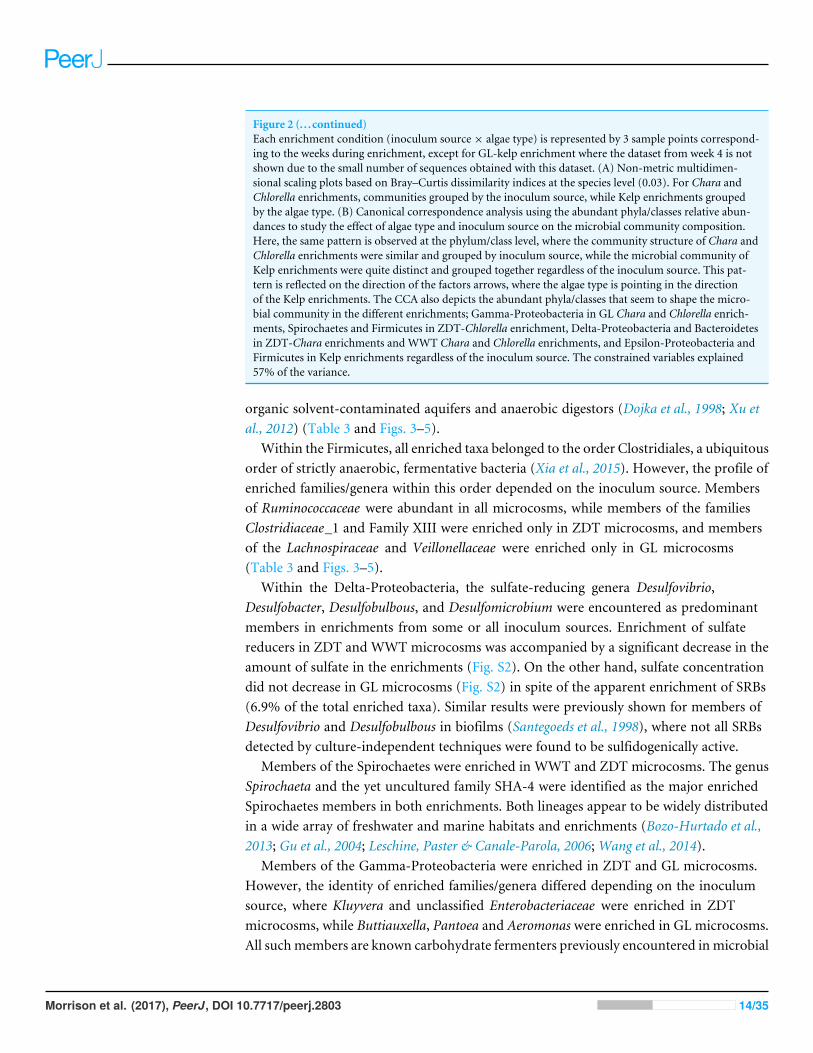
Figure 2 (. . .continued)Each enrichment condition (inoculum source× algae type) is represented by 3 sample points correspond-ing to the weeks during enrichment, except for GL-kelp enrichment where the dataset from week 4 is notshown due to the small number of sequences obtained with this dataset. (A) Non-metric multidimen-sional scaling plots based on Bray–Curtis dissimilarity indices at the species level (0.03). For Chara andChlorella enrichments, communities grouped by the inoculum source, while Kelp enrichments groupedby the algae type. (B) Canonical correspondence analysis using the abundant phyla/classes relative abun-dances to study the effect of algae type and inoculum source on the microbial community composition.Here, the same pattern is observed at the phylum/class level, where the community structure of Chara andChlorella enrichments were similar and grouped by inoculum source, while the microbial community ofKelp enrichments were quite distinct and grouped together regardless of the inoculum source. This pat-tern is reflected on the direction of the factors arrows, where the algae type is pointing in the directionof the Kelp enrichments. The CCA also depicts the abundant phyla/classes that seem to shape the micro-bial community in the different enrichments; Gamma-Proteobacteria in GL Chara and Chlorella enrich-ments, Spirochaetes and Firmicutes in ZDT-Chlorella enrichment, Delta-Proteobacteria and Bacteroidetesin ZDT-Chara enrichments and WWT Chara and Chlorella enrichments, and Epsilon-Proteobacteria andFirmicutes in Kelp enrichments regardless of the inoculum source. The constrained variables explained57% of the variance.
organic solvent-contaminated aquifers and anaerobic digestors (Dojka et al., 1998; Xu etal., 2012) (Table 3 and Figs. 3–5).
Within the Firmicutes, all enriched taxa belonged to the order Clostridiales, a ubiquitousorder of strictly anaerobic, fermentative bacteria (Xia et al., 2015). However, the profile ofenriched families/genera within this order depended on the inoculum source. Membersof Ruminococcaceae were abundant in all microcosms, while members of the familiesClostridiaceae_1 and Family XIII were enriched only in ZDT microcosms, and membersof the Lachnospiraceae and Veillonellaceae were enriched only in GL microcosms(Table 3 and Figs. 3–5).
Within the Delta-Proteobacteria, the sulfate-reducing genera Desulfovibrio,Desulfobacter, Desulfobulbous, and Desulfomicrobium were encountered as predominantmembers in enrichments from some or all inoculum sources. Enrichment of sulfatereducers in ZDT and WWT microcosms was accompanied by a significant decrease in theamount of sulfate in the enrichments (Fig. S2). On the other hand, sulfate concentrationdid not decrease in GL microcosms (Fig. S2) in spite of the apparent enrichment of SRBs(6.9% of the total enriched taxa). Similar results were previously shown for members ofDesulfovibrio and Desulfobulbous in biofilms (Santegoeds et al., 1998), where not all SRBsdetected by culture-independent techniques were found to be sulfidogenically active.
Members of the Spirochaetes were enriched in WWT and ZDT microcosms. The genusSpirochaeta and the yet uncultured family SHA-4 were identified as the major enrichedSpirochaetes members in both enrichments. Both lineages appear to be widely distributedin a wide array of freshwater and marine habitats and enrichments (Bozo-Hurtado et al.,2013; Gu et al., 2004; Leschine, Paster & Canale-Parola, 2006;Wang et al., 2014).
Members of the Gamma-Proteobacteria were enriched in ZDT and GL microcosms.However, the identity of enriched families/genera differed depending on the inoculumsource, where Kluyvera and unclassified Enterobacteriaceae were enriched in ZDTmicrocosms, while Buttiauxella, Pantoea and Aeromonas were enriched in GL microcosms.All suchmembers are known carbohydrate fermenters previously encountered inmicrobial
Morrison et al. (2017), PeerJ, DOI 10.7717/peerj.2803 14/35

Figure 3 Microbial community composition in ZDT enrichments. Abundant phyla/classes are shownas area charts for Chara (i), Chlorella (ii), and Kelp (iii) enrichments for each inoculum source. Phyla thatconstituted 5% or more of the community at any time during enrichment were considered significant tothe degradation process and are shown in the area charts. These include phyla that were abundant priorto enrichment and remained abundant during and after enrichment (e.g., Bacteroidetes in Chara andChlorella enrichments (i, ii)), and phyla that significantly and progressively increased in abundance withenrichment time (e.g., Firmicutes in Kelp enrichments (iii)). Bar charts depict the relative abundance ofabundant genera (>1%) in each of the abundant phyla/classes shown in i-ii-iii. These include Proteobacte-ria (iv), Bacteroidetes (v), Firmicutes (vi), and Spirochaetes (vii). The X-axis denotes the weeks of enrich-ment (i–iii), or the weeks of enrichment and algae type (iv–vii). ‘‘0’’ denotes the community compositionin the pre-enrichment inoculum source.
Morrison et al. (2017), PeerJ, DOI 10.7717/peerj.2803 15/35
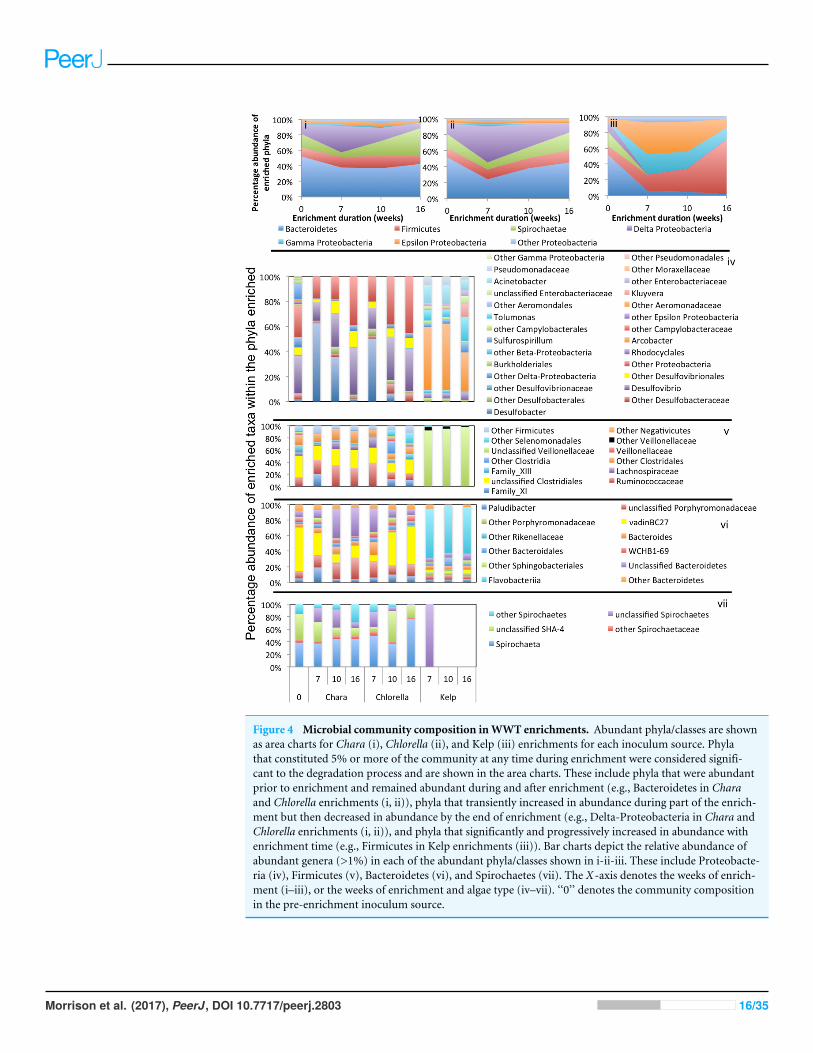
Figure 4 Microbial community composition inWWT enrichments. Abundant phyla/classes are shownas area charts for Chara (i), Chlorella (ii), and Kelp (iii) enrichments for each inoculum source. Phylathat constituted 5% or more of the community at any time during enrichment were considered signifi-cant to the degradation process and are shown in the area charts. These include phyla that were abundantprior to enrichment and remained abundant during and after enrichment (e.g., Bacteroidetes in Charaand Chlorella enrichments (i, ii)), phyla that transiently increased in abundance during part of the enrich-ment but then decreased in abundance by the end of enrichment (e.g., Delta-Proteobacteria in Chara andChlorella enrichments (i, ii)), and phyla that significantly and progressively increased in abundance withenrichment time (e.g., Firmicutes in Kelp enrichments (iii)). Bar charts depict the relative abundance ofabundant genera (>1%) in each of the abundant phyla/classes shown in i-ii-iii. These include Proteobacte-ria (iv), Firmicutes (v), Bacteroidetes (vi), and Spirochaetes (vii). The X-axis denotes the weeks of enrich-ment (i–iii), or the weeks of enrichment and algae type (iv–vii). ‘‘0’’ denotes the community compositionin the pre-enrichment inoculum source.
Morrison et al. (2017), PeerJ, DOI 10.7717/peerj.2803 16/35

Figure 5 Microbial community composition in GL enrichments. Abundant phyla/classes are shown asarea charts for Chara (i), Chlorella (ii), and Kelp (iii) enrichments for each inoculum source. Phyla thatconstituted 5% or more of the community at any time during enrichment were considered significant tothe degradation process and are shown in the area charts. These include phyla that were abundant prior toenrichment and remained abundant during and after enrichment (Gamma-Proteobacteria in Chara andChlorella enrichments (i, ii)), and phyla that significantly and progressively increased in abundance withenrichment time (e.g., Firmicutes in Kelp enrichments (iii)). (continued on next page. . . )
Morrison et al. (2017), PeerJ, DOI 10.7717/peerj.2803 17/35

Figure 5 (. . .continued)Bar charts depict the relative abundance of abundant genera (>1%) in each of the abundant phyla/classesshown in i-ii-iii. These include Bacteroidetes (iv), Firmicutes (v), Delta and Epsilon-Proteobacteria (vi),Gamma-Proteobacteria (vii), Alpha and Beta Proteobacteria (viii), and Planctomycetes (ix). The X-axisdenotes the weeks of enrichment (i–iii), or the weeks of enrichment and algae type (iv–ix). ‘‘0’’ denotes thecommunity composition in the pre-enrichment inoculum source.
consortia degrading plant biomass (Jiménez, Chaves-Moreno & Van Elsas, 2015; Jiménez etal., 2016), in earthworm gut enrichments (Wust, Horn & Drake, 2011), and in microbialmats from bicarbonate- and ferrous-iron-rich spring (Hegler et al., 2012).
Chlorella microcosmsEnrichment patterns in Chlorella microcosms were very similar to Chara enrichments;with the phyla Bacteroidetes, Firmicutes, and Delta-Proteobacteria consistently enriched inmicrocosms derived from all three inoculum sources (ZDT, WWT, and GL), Spirochaetesonly enriched in WWT and ZDT microcosms, and Gamma-Proteobacteria enriched inGL (but not ZDT) enrichments. Similar to Chara enrichments, the taxa VadinBC27,Mangroviflexus, Paludibacter, Barnesiella, and WCHB1-69 within the Bacteroidetes;Desulfovibrio, Desulfobacter, and Desulfomicrobium within the Delta Proteobacteria;Spirochaeta and unclassified SHA-4 within the Spirochaetes were all abundant communitymembers at the end of enrichment. Within the Firmicutes, the family Lachnospiraceae wasabundant in all enrichments, similar to what was observed in Charamicrocosms. However,apart from this notable exception, the enriched community of Firmicutes genera/familiesdiffered in Chlorella microcosms when compared to Chara enrichments. Within the ZDTmicrocosms on Chlorella, a wide range of Clostridiales-affiliated genera and families wereencountered, with members of the genera Geosporobacter (family Clostridiaceae_1), andAcidaminobacter (family Clostridiaceae_4), Youngiibacter (family Clostridiaceae_1), andmembers of Clostridiales Family XIII constituting ∼34% of total sequences encounteredin ZDT microcosms. Further, In contrast to Chara enrichments where Veillonellaceae wasonly restricted to GL microcosms, Chlorella enrichments selected for members of thisfamily in ZDT and WWT microcosms.
Chlorella enrichments selected for members of the Gamma-Proteobacteria only inGL microcosms where they constituted ∼54% of the total taxa in these enrichments.Buttiauxella and Aeromonas were identified as major taxa in GL Chlorella microcosms,similar to what was observed in Chara enrichments. In addition, members of the genusEdwardsiella (family Enterobacteriaceae) were identified as a Chlorella enrichment-specifictaxon (Figs. 3–5 and Table 3). Members of the genus Edwardsiella have been repeatedlyisolated from marine and freshwater animals and some species have been linked topathogenesis in fish (Sakazaki, 1965). This is consistent with its enrichment in microcosmsfrom a freshwater environment such as Grand Lake.
Kelp enrichmentsWhile the microbial communities enriched on Chara and Chlorella exhibited markedsimilarities regardless of the inoculum source, the community enriched on kelp wasquite distinct: In all kelp enrichments, Firmicutes constituted more than 70% of the
Morrison et al. (2017), PeerJ, DOI 10.7717/peerj.2803 18/35

Table 3 Abundant lineages (>1%) within the abundant/enriched phyla shown in Figs. 3–5.
Phylum/Class Class/Order Family–genus WWT ZDT GL
;Chara enrichments;Bacteroidetes Bacteroidales Marinilabiaceaea-Mangroviflexus 0.58 4.16 0; Porphyromonadaceae-Paludibacter 1.47 1 0.1; Porphyromonadaceae-Bacteroides 2.11 0.05 6.91; Porphyromonadaceae-Barnesiella 0 0 1.58; Rikenellacea-VadinBC27 6.1 11.45 2.78; Sphingobacteriales WCHB1-69-unclassified 0.76 3.73 0.84; Unclassified Bacteroidetes 14.34 4.03 0;Firmicutes Clostridiales Clostridiaceae_1-Youngiibacter 0.003 1.36 0; Family XIII 0.41 1.85 0.1; Ruminococcaceae_Incertae_Sedis 0.07 0.09 1.61; Ruminococcaceae-Ruminococcus 0.02 0.03 2.38; Other Ruminococcaceae 3.62 1.47 0; Lachnospiraceae_Incertae_Sedis 0.16 0.45 6.87; Lachnospiraceae-Parasporobacterium-
Sporobacterium0 0.04 2.51
; Veillonellaceae-uncultured 0 0 3.1; Unclassified Clostridiales 3.75 3.4 0.07; Unclassified Firmicutes 0.69 8.02 0;Spirochaetes Spirochaetales Spirochaetaceae-Spirochaeta 10.67 4.69 0; SHA-4-unclassified 2.92 2.48 0; Unclassified 6.91 0.29 0;Delta Proteobacteria Desulfobacterales Desulfobacteriaceae-Desulfobacter 0.36 1.39 0; Desulfobulbaceae-Desulfobulbous 0.28 0.69 1.22; Desulfovibrionales Desulfovibrionacea-Desulfovibrio 5.69 1.42 5.67; Desulfovibrionaceae-Desulfomicrobium 1.89 5.69 0;Gamma Proteobacteria Enterobacteriales Enterobacteriaceae-Kluyvera 0 4.15 0.04; Enterobacteriaceae-unclassified 0 4.2 0; Enterobacteriaceae-Buttiauxella 0 0 44.1; Enterobacteriaceae-Pantoea 0 0 11; Aeromonadales Aeromonadaceae-Aeromonas 0 0.11 1.87;Chlorella enrichments;Bacteroidetes Bacteroidales Marinilabiaceaea-Mangroviflexus 0.16 2.27 0; Porphyromonadaceae-Paludibacter 2.59 0.46 0.81; Porphyromonadaceae-Barnesiella 0.002 0 1.7; Rikenellacea-VadinBC27 16.18 9.11 1.95; Other 1.78 0.2 2.95; Sphingobacteriales WCHB1-69-unclassified 2.14 0.64 5.18; Unclassified Bacteroidetes 2.69 1.18 0;Firmicutes Clostridia/Clostridiales Clostridiaceae_1-Youngiibacter 0.006 8.94 0; Clostridiaceae_4-Geosporobacter 0 11.44 0
(continued on next page)
Morrison et al. (2017), PeerJ, DOI 10.7717/peerj.2803 19/35
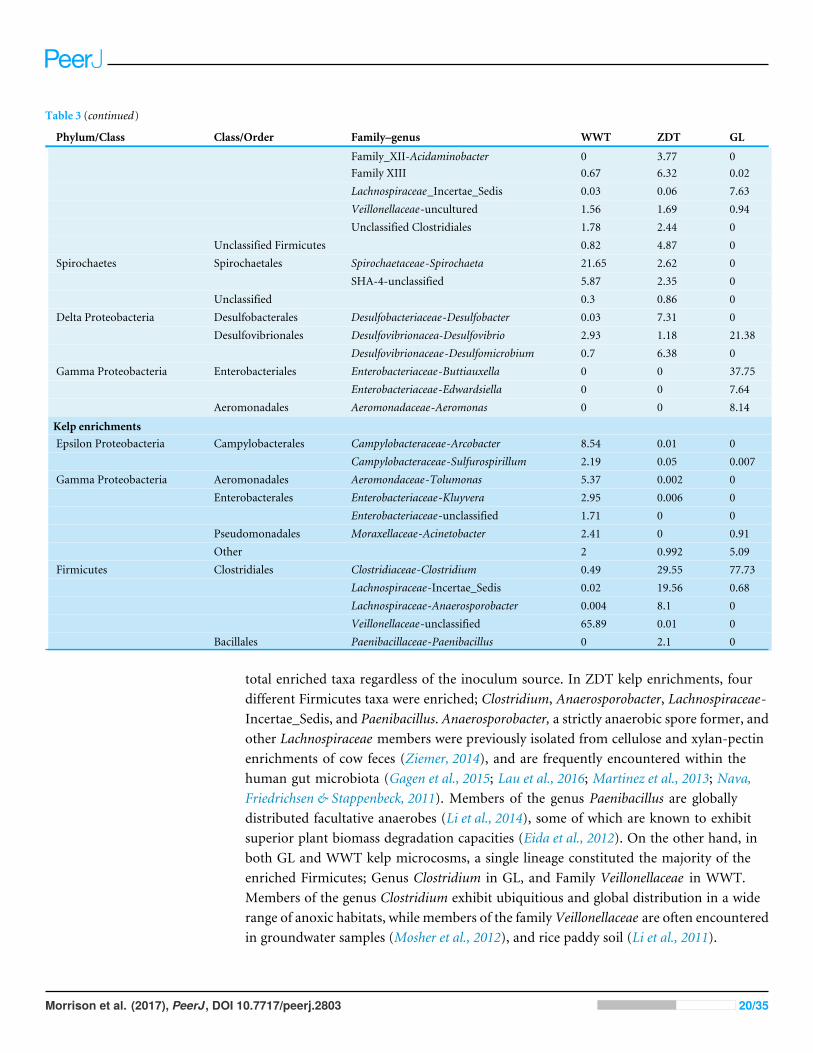
Table 3 (continued)
Phylum/Class Class/Order Family–genus WWT ZDT GL
; Family_XII-Acidaminobacter 0 3.77 0; Family XIII 0.67 6.32 0.02; Lachnospiraceae_Incertae_Sedis 0.03 0.06 7.63; Veillonellaceae-uncultured 1.56 1.69 0.94; Unclassified Clostridiales 1.78 2.44 0; Unclassified Firmicutes 0.82 4.87 0;Spirochaetes Spirochaetales Spirochaetaceae-Spirochaeta 21.65 2.62 0; SHA-4-unclassified 5.87 2.35 0; Unclassified 0.3 0.86 0;Delta Proteobacteria Desulfobacterales Desulfobacteriaceae-Desulfobacter 0.03 7.31 0; Desulfovibrionales Desulfovibrionacea-Desulfovibrio 2.93 1.18 21.38; Desulfovibrionaceae-Desulfomicrobium 0.7 6.38 0;Gamma Proteobacteria Enterobacteriales Enterobacteriaceae-Buttiauxella 0 0 37.75; Enterobacteriaceae-Edwardsiella 0 0 7.64; Aeromonadales Aeromonadaceae-Aeromonas 0 0 8.14;Kelp enrichments;Epsilon Proteobacteria Campylobacterales Campylobacteraceae-Arcobacter 8.54 0.01 0; Campylobacteraceae-Sulfurospirillum 2.19 0.05 0.007;Gamma Proteobacteria Aeromonadales Aeromondaceae-Tolumonas 5.37 0.002 0; Enterobacterales Enterobacteriaceae-Kluyvera 2.95 0.006 0; Enterobacteriaceae-unclassified 1.71 0 0; Pseudomonadales Moraxellaceae-Acinetobacter 2.41 0 0.91; Other 2 0.992 5.09;Firmicutes Clostridiales Clostridiaceae-Clostridium 0.49 29.55 77.73; Lachnospiraceae-Incertae_Sedis 0.02 19.56 0.68; Lachnospiraceae-Anaerosporobacter 0.004 8.1 0; Veillonellaceae-unclassified 65.89 0.01 0; Bacillales Paenibacillaceae-Paenibacillus 0 2.1 0
total enriched taxa regardless of the inoculum source. In ZDT kelp enrichments, fourdifferent Firmicutes taxa were enriched; Clostridium, Anaerosporobacter, Lachnospiraceae-Incertae_Sedis, and Paenibacillus. Anaerosporobacter, a strictly anaerobic spore former, andother Lachnospiraceae members were previously isolated from cellulose and xylan-pectinenrichments of cow feces (Ziemer, 2014), and are frequently encountered within thehuman gut microbiota (Gagen et al., 2015; Lau et al., 2016; Martinez et al., 2013; Nava,Friedrichsen & Stappenbeck, 2011). Members of the genus Paenibacillus are globallydistributed facultative anaerobes (Li et al., 2014), some of which are known to exhibitsuperior plant biomass degradation capacities (Eida et al., 2012). On the other hand, inboth GL and WWT kelp microcosms, a single lineage constituted the majority of theenriched Firmicutes; Genus Clostridium in GL, and Family Veillonellaceae in WWT.Members of the genus Clostridium exhibit ubiquitious and global distribution in a widerange of anoxic habitats, while members of the family Veillonellaceae are often encounteredin groundwater samples (Mosher et al., 2012), and rice paddy soil (Li et al., 2011).
Morrison et al. (2017), PeerJ, DOI 10.7717/peerj.2803 20/35

In addition to Firmicutes, ZDT kelp microcosms showed an abundance of theSpirochaetes genus Treponema (20.2% of the total enriched taxa) previously shown tocontribute to the overall cellulolytic activities in barley straw microcosms (Kudo, Cheng& Costerton, 1987), and WWT kelp microcosms showed an abundance of membersof Epsilon (genera Arcobacter and Sulfurospirilum) and Gamma (genera Tolumonas,Kluyvera, and Acinetobacter) Proteobacteria, collectively comprising ∼25% of the totalenriched taxa. Members of these genera were previously implicated in anaerobic plantbiomass degradation (Billings et al., 2015; Caldwell et al., 2011; Cardoso et al., 2012).
DISCUSSIONIn this study we investigated the microbial community mediating algal detritus turnoverunder anaerobic conditions. We utilized three representative algal species: Chlorellavulgaris strain UTEX2714 representing the Chlorophyta, Chara sp. strain IWP representingthe Charophyceae, and Ascophyllum nodosum (kelp) representing the brown algae(Phaeophyceae). We followed the turnover of these algae in enrichments that were setup using three different sources of inoculum: an anoxic freshwater sulfide- and sulfur-richspring (Zodletone spring, OK), a wastewater treatment plant (Municipal wastewatertreatment plant in Stillwater, OK), and a seasonally stratified lake that experience seasonalalgal blooms (Grand Lake O’ the Cherokees, OK).We identifiedmultiplemicrobial lineagesthat were significantly enriched in these treatments. Some of these lineages appear to besubstrate-specific (i.e., enriched when using a specific algal species as a substrate sourceregardless of the inoculum source utilized, e.g., VadinBC27 that was enriched onChara andChlorella regardless of the inoculum source and Spirochaeta that was enriched onChara andChlorella in ZDT andWWTmicrocosms), habitat-specific (i.e., enriched only when using aspecific source of inoculum regardless of the algal substrate utilized, e.g., Buttiauxella, thatwas enriched in GLmicrocosms regardless of the algal substrate), or treatment-specific (i.e.,encountered only in a specific algal substrate/inoculum source combination, e.g.,Arcobacterin WWT microcosms on kelp, Geosporobacter, Acidaminobacter, Anaerosporobacter, andTreponema in ZDT microcosms on kelp, Youngiibacter in ZDT microcosms on Chlorella,and Pantoea in GL microcosms on Chara).
Within all nine treatments examined, a high level of diversity was invariably retainedat the conclusion of the incubation process. We reason that this is a reflection ofthe complexity of the substrate utilized. Algal detritus harbors multiple complexmacromolecules, e.g., proteins, lipids, nucleic acids, and polysaccharide, that varyconsiderably in structure and hence require multiple enzymes and pathways for theirefficient degradation (e.g., pectin and cellulose in algal cell walls require an arsenalof degradation enzymes (Abbott & Boraston, 2008; Doi & Kosugi, 2004)). Such level ofcomplexity could potentially select for a wide range of organisms, each contributingto the degradation process of a specific substrate within the algal biomass. This is instark contrast to the selection of one/few microbial lineages in anaerobic incubationsconducted using a single, chemically defined substrate (Viggor et al., 2013; Yagi et al., 2010).
Morrison et al. (2017), PeerJ, DOI 10.7717/peerj.2803 21/35
Our results and subsequent community analysis (Figs. 2–5 and Table 3) indicatethat kelp enriched for a highly similar microbial community that is mostly composedof members of the order Clostridiales; genus Clostridium and Anaerosporobacter andfamily Veillonellaceae, regardless of the inoculum source (ZDT, WWT, and GL). Whileonly a handful of environments were examined in this study, the consistent selectionfor members of a specific lineage regardless of the starting inoculum suggests theecological significance of this lineage in kelp detritus turnover in anaerobic habitats.The reason for this observed pattern of Clostridiales genera/families selection on kelpcould only be speculated upon. A possible contributing factor could be the unique cell wallstructure of kelp (or brown algae); multiple cellulose microfibrils layers embedded in largeinterfibrillar matrices that are mostly composed of alginates and fucans (Domozych, 2001;Youssef et al., 2015). Alginate (Preiss & Ashwell, 1962a; Preiss & Ashwell, 1962b) and fucans(Descamps et al., 2006; Kusaykin et al., 2016) degradation requires highly specific enzymesmachineries. Organisms with alginate or fucan/fucoidan-degradation capabilities underaerobic conditions have been previously isolated (Ekborg et al., 2005; Jagtap et al., 2014;Park et al., 2012; Sakai, Kawai & Kato, 2004; Thomas et al., 2012; Yonemoto et al., 1993).On the other hand, with the exception of a few studies that used anaerobic batch-fedmixed inocula to degrade brown algae and produce methane (Moen, Horn & Østgaard,1997a; Moen, Horn & Østgaard, 1997b; Sutherland & Varela, 2014), there is a scarcityof information on the identity of the degrading inocula under anaerobic conditions.In contrast to the number of studies on the anaerobic degradation of other commonpolysaccharides, e.g., cellulose and xylans, a single study by Kita et al. (2016) reportedon the identity of a bacterial consortium (formed mainly of a Clostridiaceae bacteriumand a Porphyromonadaceae bacterium (Dysgonomonas capnocytophagoides)) anaerobicallydegrading alginate. Based on the study by Kita et al. (2016) and the results we report here, itis possible that members of the Clostridiales represent one of very few members possessingalginate and/or fucan-degrading capabilities and that are readily enriched and propagatedunder laboratory incubations.
On the other hand, when using Chara or Chlorella as an algal inoculum, the finalmicrobial community enriched was highly divergent, and the final community structurewas mostly dependent on the inoculum sources (ZDT, WWT, GL), rather than the type ofalgal substrate provided (Figs. 2–5, Table 3). While Chlorella and Chara cell walls are quitedistinct, they are both similar in being rich in fibrous cellulose and/or hemicellulosewith amorphous middle layers composed mainly of pectin (homogalacturonic andrhamnogalacturonic acids polymers) in Charophyta, or sulfated polysaccharides inChlorophyceae (Domozych, 2001; Domozych et al., 2014; Youssef et al., 2015). We reasonthat the relative similarity of the communities enriched on both types of algae, aswell as the enrichment for multiple, rather than a single group of microbial lineages(VadinBC27, Spirochaeta, Lachnospiraceae, Buttauxiella, and Pantoea) is a reflectionof the relative ubiquity of microbial lineages capable of the anaerobic degradation ofcellulose, hemicellulose, and pectin in the algal cell walls, hence allowing ready access tothe intracellular substrates within the algal cells.
Morrison et al. (2017), PeerJ, DOI 10.7717/peerj.2803 22/35

Under anaerobic conditions, multiple groups of organisms and metabolic guildsare often required for the effective and complete degradation of complex organicmolecules (McInerney, Sieber & Gunsalus, 2009; Morris et al., 2013). By examining theknown metabolic capabilities of close relatives of lineages enriched in various treatments,one could propose a model depicting their putative involvement in the complex algaldetritus degradation processes. In kelp enrichments, complex carbohydrate polymerdegradation to monomers could possibly be mediated by various members of the orderClostridiales (Clostridium, Anaerosporobacter, Lachnospiraceae incertae sedis) as shownbefore (Ziemer, 2014), as well as the fermentative bacteria in the Enterobacteriaceae(Kluyvera) (Xin & He, 2013). Produced sugar monomers can be further fermented tovarious fatty acids (acetate and longer chain fatty acids e.g., butyrate, propionate, etc.)by the same members of the Clostridiales and Enterobacteriaceae, as well as the EpsilonProteobacterium Sulfurospirillum (Stolz et al., 1999). Proteins in the initial substrate couldpotentially be degraded by the Epsilon Proteobacterium Arcobacter (Roalkvam et al.,2015). Additionally, while the majority of sequences obtained were bacterial in origin, thefew archaeal sequences obtained suggest the enrichment of members of Bathyarchaeota(Table S2). Previous research using genomic sequences of different members of theBathyarchaeota suggested their involvement in both complex carbohydrates and detritalprotein degradation as well as acetate production (Lazar et al., 2016), which could explaintheir enrichment on kelp. Under anaerobic condition, syntrophic organisms convert thelong chain fatty acids produced from the initial polymer degradation to acetate. Definitiveidentification of syntrophic organisms in culture-independent studies is challenging, giventheir close phylogenetic affiliation with fermentative lineages (Morris et al., 2013). Onthe other hand, saccharolytic clostridia members of the family Lachnospiraceae couldpotentially perform the initial breakdown of polymeric substances and the fermentationof the resulting sugars to acetate, hydrogen, and CO2 (Krumholz & Bryant, 1986). Whileother obligate syntrophic organisms, e.g., members of the families Syntrophobacteraceae,Syntrophaceae, Syntrophomonadaceae, and Syntrophorhabdaceae, were detected invery low percentage (<0.06% of the total community in any enrichment), their rolecould not be ruled out. The produced acetate, hydrogen, and CO2 would eventuallybe converted to methane by methanogens. The role of methanogens as the dominantterminal electron acceptor in kelp enrichment from ZDT and WWT inoculum sources issuggested by the observed increase in mrcA gene copy number in qPCR analysis (Fig. 1)and the identification of several sequences affiliated with known methanogens (generaMethanosarcina, Methanothermococcus, Methanogenium, and Methanomicrobium) in kelpenrichment fromZDT (Table S2). The lack of sulfate utilization in all kelp enrichments (Fig.S2) argues against the involvement of the SRBs identified in the culture-independent dataset(Desulfovibrio,Desulfobacter,Desulfomicrobium, andDesulfobulbous) and detected by qPCR(Fig. 1) in the process. Similar results were previously shown in biofilms (Santegoeds et al.,1998), where not all SRBs detected by culture-independent techniques were found to besulfidogenically active.
Within Chara and Chlorella enrichments, complex carbohydrate (e.g., cellulose, pectin,hemicellulose) degradation to sugar monomers could be mediated by members of the
Morrison et al. (2017), PeerJ, DOI 10.7717/peerj.2803 23/35

Bacteroidetes uncultured groups VadinBC27 (in all enrichments from all sources) andWCHB1-69 (in Chara enrichment from ZDT, and Chlorella enrichment from WWTand GL), as well as the Spirochaetes (Gao, Xu & Ruan, 2014) (genus Spirochaeta and theuncultured group SHA-4 enriched on Chara and Chlorella from ZDT and WWT sources).These lineages have been consistently enriched in anaerobic sludge digestors (Godon etal., 1997; Lee et al., 2013), and microcosms with hydrocarbon or halogenated solvents(Dojka et al., 1998; Gu et al., 2004; Xu et al., 2012). Similarly, members of the Clostridiales(Family Ruminococcaceae (in Chara enrichments from all sources), Family Veillonellaceaea(in Chara enrichments from GL), Family Lachnospiraceae (in Chara and Chlorellaenrichments from GL), and Family Clostridiaceae genera Yongiibacter, Geosporobacter,Acidaminobacter (in Chloreela enrichments from ZDT)), as well as Enterobacteriales(Genera Kluyvera (Chara enrichments from ZDT), Pantoea (Chara enrichments from GL),Edwardsiella and Aeromonas (Chlorella enrichment from GL), and Buttiauxella (Charaand Chlorella enrichments from GL)) could potentially mediate complex carbohydratedegradation (Hegler et al., 2012; Jiménez, Chaves-Moreno & Van Elsas, 2015; Jiménez etal., 2016; Sakazaki, 1965; Wust, Horn & Drake, 2011; Xin & He, 2013; Ziemer, 2014). Themonomers produced could potentially be converted to long chain volatile fatty acids,acetate, and H2 by the Clostridiales and Enterobacteriales members above. Alternatively,long chain volatile fatty acids could be converted to acetate, H2 and CO2 by syntrophs,or oxidized either completely (to H2 and CO2) or incompletely (to acetate, H2 and CO2)by sulfate-reducing bacteria (e.g., the complete oxidizers (Desulfobacter in Chara andChlorella enrichments from ZDT), or the incomplete oxidizers (Desulfovibrio in all Charaand Chlorella enrichments from all sources, Desulfomicrobium in Chara and Chlorellaenrichments from ZDT and Chara enrichments from WWT, and Desulfobulbous in Charaenrichment from GL)) when sulfate is available. The produced acetate, H2 and CO2
could either be metabolized to methane by aceticlastic or hydrogenotrophic methanogeniclineages observed in the enrichments (Table S2) (e.g., the aceticlastic Methanosarcinain Chara and Chlorella enrichments from ZDT and WWT, and the hydrogenotrophicMethanothermococcus in Chlorella early (week 7) enrichments from ZDT), or metabolizedby the aceticlastic autotrophic SRBs in the presence of sulfate. The increase in dsr copynumbers in Chara and Chlorella enrichments as measured by qPCR, the utilization ofthe available substrates in these enrichments (loss of sulfate (Fig. S2)), as well as thepresence of a large and diverse community of SRBs (Table 3 and Table S2) evidenced by theculture-independent analysis, strongly argue for the co-involvement of sulfate reductionand methanogenesis as two competing terminal electron accepting processes in theseenrichments. Recently, the methanogenic potential for members of the Bathyarchaeota wassuggested based on genomicmetabolic reconstruction (Evans et al., 2015). It is worth notingthat the Bathyarchaeota phylum was enriched in ZDT Chara and Chlorella microcosms(Table S2) and could potentially be contributing to methanogenesis in these enrichments.
In conclusion, our work represents the first systematic survey of microbial communitiesmediating turnover of algal biomass under anaerobic conditions, and highlights thediversity of lineages putatively involved in the degradation process. The results presentedhere could certainly open the door for future studies that investigate the interactions
Morrison et al. (2017), PeerJ, DOI 10.7717/peerj.2803 24/35

between the abundant genera identified as significant for the degradation process, as wellas for targeted isolation studies for algal detritus degraders.
ADDITIONAL INFORMATION AND DECLARATIONS
FundingThis work has been supported by the National Science FoundationMicrobial Observatoriesprogram (grant no. MCB_0240683), and the Oklahoma State University Start-up fund(NY). The funders had no role in study design, data collection and analysis, decision topublish, or preparation of the manuscript.
Grant DisclosuresThe following grant information was disclosed by the authors:National Science Foundation Microbial Observatories program: MCB_0240683.Oklahoma State University Start-up fund.
Competing InterestsThe authors declare there are no competing interests.
Richard M. Zamor and Steve Nikolai are employees of Grand River Dam Authority(GRDA).
Author Contributions• Jessica M. Morrison performed the experiments, analyzed the data, wrote the paper,prepared figures and/or tables, reviewed drafts of the paper.• Chelsea L. Murphy performed the experiments, analyzed the data, reviewed drafts of thepaper.• Kristina Baker performed the experiments, reviewed drafts of the paper.• Richard M. Zamor and Steve J. Nikolai contributed reagents/materials/analysis tools,reviewed drafts of the paper.• ShawnWilder performed the experiments, contributed reagents/materials/analysis tools,reviewed drafts of the paper.• Mostafa S. Elshahed conceived and designed the experiments, contributedreagents/materials/analysis tools, wrote the paper, reviewed drafts of the paper.• NohaH. Youssef conceived and designed the experiments, analyzed the data, contributedreagents/materials/analysis tools, wrote the paper, prepared figures and/or tables,reviewed drafts of the paper.
DNA DepositionThe following information was supplied regarding the deposition of DNA sequences:
Genbank accession number SRP083898.
Data AvailabilityThe following information was supplied regarding data availability:
The research in this article did not generate, collect or analyse any raw data or code.
Morrison et al. (2017), PeerJ, DOI 10.7717/peerj.2803 25/35

Supplemental InformationSupplemental information for this article can be found online at http://dx.doi.org/10.7717/peerj.2803#supplemental-information.
REFERENCESAbbott DW, Boraston AB. 2008. Structural biology of pectin degradation by En-
terobacteriaceae.Microbiology and Molecular Biology Reviews 72:301–316DOI 10.1128/MMBR.00038-07.
Adamberg K, Tomson K, Talve T, Pudova K, PuurandM, Visnapuu T, Alamäe T,Adamberg S. 2015. Levan enhances associated growth of Bacteroides, Escherichia,Streptococcus and Faecalibacterium in fecal microbiota. PLOS ONE 10:e0144042DOI 10.1371/journal.pone.0144042.
Amaral-Zettler L. 2011. Algae. In: Gargaud M, Amils R, Quintanilla JC, Cleaves HJ,Irvine WM, Pinti DL, Viso M, eds. Encyclopedia of Astrobiology. Berlin, Heidelberg:Springer, 27–28.
Amin SA, Parker MS, Armbrust EV. 2012. Interactions between Diatoms and Bacteria.Microbiology and Molecular Biology Reviews 76:667–684DOI 10.1128/MMBR.00007-12.
Angel R, Claus P, Conrad R. 2012.Methanogenic archaea are globally ubiquitousin aerated soils and become active under wet anoxic conditions. ISME Journal6:847–862 DOI 10.1038/ismej.2011.141.
Ask J, Karlsson J, Persson L, Ask P, Byström P, JanssonM. 2009.Whole-lake estimatesof carbon flux through algae and bacteria in benthic and pelagic habitats of clear-water lakes. Ecology 90:1923–1932 DOI 10.1890/07-1855.1.
Bagatini IL, Eiler A, Bertilsson S, Klaveness D, Tessarolli LP, Vieira AAH. 2014.Host-specificity and dynamics in bacterial communities associated with bloom-formingfreshwater phytoplankton. PLOS ONE 9:e85950DOI 10.1371/journal.pone.0085950.
BalkM, Keuskamp JA, Laanbroek HJ. 2015. Potential activity, size, and structure ofsulfate-reducing microbial communities in an exposed, grazed and a sheltered, non-grazed mangrove stand at the Red Sea Coast. Frontiers in Microbiology 6: Article1478 DOI 10.3389/fmicb.2015.01478.
Billings AF, Fortney JL, Hazen TC, Simmons B, Davenport KW, Goodwin L,Ivanova N, Kyrpides NC, Mavromatis K,Woyke T, DeAngelis KM. 2015.Genome sequence and description of the anaerobic lignin-degrading bacteriumTolumonas lignolytica sp. nov. Standards in Genomic Sciences 10: Article 106DOI 10.1186/s40793-015-0100-3.
Bohutskyi P, Ketter B, Chow S, Adams KJ, BetenbaughMJ, Allnutt FCT, Bouwer EJ.2015. Anaerobic digestion of lipid-extracted Auxenochlorella protothecoides biomassfor methane generation and nutrient recovery. Bioresource Technology 183:229–239DOI 10.1016/j.biortech.2015.02.012.
Boon AR, Duineveld GCA, Berghuis EM, Van derWeele JA. 1998. Relationshipsbetween benthic activity and the annual phytopigment cycle in near-bottom water
Morrison et al. (2017), PeerJ, DOI 10.7717/peerj.2803 26/35

and sediments in the southern North Sea. Estuarine, Coastal and Shelf Science46:1–13.
Bozo-Hurtado L, García-AmadoMA, Chistoserdov A, Varela R, Narvaez JJ, ColwellR, Suárez P. 2013. Identification of bacteria in enrichment cultures of sulfatereducers in the Cariaco Basin water column employing Denaturing Gradient GelElectrophoresis of 16S ribosomal RNA gene fragments. Aquatic Biosystems 9:1–11DOI 10.1186/2046-9063-9-1.
Buchan A, LeCleir GR, Gulvik CA, Gonzalez JM. 2014.Master recyclers: featuresand functions of bacteria associated with phytoplankton blooms. Nature ReviewsMicrobiology 12:686–698 DOI 10.1038/nrmicro3326.
Buhring SI, Sievert SM, Jonkers HM, Ertefai T, ElshahedMS, Krumholz LR, HinrichsKU. 2011. Insights into chemotaxonomic composition and carbon cycling ofphototrophic communities in an artesian sulfur-rich spring (Zodletone, Oklahoma,USA), a possible analog for ancient microbial mat systems. Geobiology 9:166–179.
Cai H, Jiang H, Krumholz LR, Yang Z. 2014. Bacterial community composition of size-fractioned aggregates within the phycosphere of cyanobacterial blooms in a eu-trophic freshwater lake. PLOS ONE 9:e102879 DOI 10.1371/journal.pone.0102879.
Caldwell ME, Allen TD, Lawson PA, Tanner RS. 2011. Tolumonas osonensis sp. nov.,isolated from anoxic freshwater sediment, and emended description of the genusTolumonas. International Journal of Systematic and Evolutionary Microbiology61:2659–2663 DOI 10.1099/ijs.0.023853-0.
Cannell RJP. 1990. Algal biotechnology. Applied Biochemistry and Biotechnology26:85–105 DOI 10.1007/BF02798395.
Caporaso JG, Lauber CL,WaltersWA, Berg-Lyons D, Huntley J, Fierer N, Owens SM,Betley J, Fraser L, Bauer M, Gormley N, Gilbert JA, Smith G, Knight R. 2012. Ultra-high-throughput microbial community analysis on the Illumina HiSeq and MiSeqplatforms. ISME Journal 6:1621–1624 DOI 10.1038/ismej.2012.8.
Cardoso AM, Cavalcante JJV, CantãoME, Thompson CE, Flatschart RB, Glogauer A,Scapin SMN, Sade YB, Beltrão PJMSI, Gerber AL, Martins OB, Garcia ES, De SouzaW, Vasconcelos ATR. 2012.Metagenomic Analysis of the microbiota from the cropof an invasive snail reveals a rich reservoir of novel genes. PLOS ONE 7:e48505DOI 10.1371/journal.pone.0048505.
Cole JJ. 1982. Interactions between bacteria and algae in aquatic ecosystems. AnnualReview of Ecology and Systematics 13:291–314DOI 10.1146/annurev.es.13.110182.001451.
Coveley S, ElshahedMS, Youssef NH. 2015. Response of the rare biosphere to environ-mental stressors in a highly diverse ecosystem (Zodletone Spring, OK, USA). PeerJ3:e1182 DOI 10.7717/peerj.1182.
Descamps V, Colin S, Lahaye M, JamM, Richard C, Potin P, Barbeyron T, YvinJ-C, Kloareg B. 2006. Isolation and culture of a marine bacterium degradingthe sulfated fucans from marine brown algae.Marine Biotechnology 8:27–39DOI 10.1007/s10126-005-5107-0.
DingW, Stewart DI, Humphreys PN, Rout SP, Burke IT. 2016. Role of an organiccarbon-rich soil and Fe(III) reduction in reducing the toxicity and environmental
Morrison et al. (2017), PeerJ, DOI 10.7717/peerj.2803 27/35

mobility of chromium(VI) at a COPR disposal site. Science of the Total Environment541:1191–1199 DOI 10.1016/j.scitotenv.2015.09.150.
Dittami SM, Duboscq-Bidot L, PerennouM, Gobet A, Corre E, Boyen C, Tonon T.2016.Host-microbe interactions as a driver of acclimation to salinity gradients inbrown algal cultures. ISME Journal 10:51–63 DOI 10.1038/ismej.2015.104.
Doi RH, Kosugi A. 2004. Cellulosomes: plant-cell-wall-degrading enzyme complexes.Nature Reviews Microbiology 2:541–551 DOI 10.1038/nrmicro925.
DojkaMA, Hugenholtz P, Haack SK, Pace NR. 1998.Microbial diversity in ahydrocarbon- and chlorinated-solvent-contaminated aquifer undergoing intrinsicbioremediation. Applied and Environmental Microbiology 64:3869–3877.
Domozych DS. 2001. Algal Cell Walls. In: Encyclopedia of Life sciences. Hoboken: JohnWiley & Sons, Ltd.
Domozych DS, Sorensen I, Popper ZA, Ochs J, Andreas A, Fangel JU, Pielach A, SacksC, Brechka H, Ruisi-Besares P, WillatsWG, Rose JK. 2014. Pectin metabolism andassembly in the cell wall of the charophyte green alga penium margaritaceum. PlantPhysiology 165:105–118 DOI 10.1104/pp.114.236257.
Dongowski G, Lorenz A, Anger H. 2000. Degradation of pectins with differ-ent degrees of esterification by Bacteroides thetaiotaomicron isolated fromhuman gut flora. Applied and Environmental Microbiology 66:1321–1327DOI 10.1128/AEM.66.4.1321-1327.2000.
Durborow RM. 2014. Management of aquatic weeds. In: Chauhan BS, Mahajan G, eds.Recent advances in weed management. New York: Springer Science+Business Media,281–314.
EidaMF, Nagaoka T,Wasaki J, Kouno K. 2012. Isolation and characterization ofcellulose-decomposing bacteria inhabiting sawdust and coffee residue composts.Microbes and Environments 27:226–233 DOI 10.1264/jsme2.ME11299.
Eigemann F, Hilt S, Salka I, Grossart HP. 2013. Bacterial community compositionassociated with freshwater algae: species specificity vs. dependency on environmentalconditions and source community. FEMS Microbiology Ecology 83:650–663DOI 10.1111/1574-6941.12022.
Ekborg NA, Gonzalez JM, HowardMB, Taylor LE, Hutcheson SW,Weiner RM. 2005.Saccharophagus degradans gen. nov., sp. nov., a versatile marine degrader of complexpolysaccharides. International Journal of Systematic and Evolutionary Microbiology55:1545–1549 DOI 10.1099/ijs.0.63627-0.
Evans PN, Parks DH, Chadwick GL, Robbins SJ, Orphan VJ, Golding SD, Tyson GW.2015.Methane metabolism in the archaeal phylum Bathyarchaeota revealed bygenome-centric metagenomics. Science 350:434–438 DOI 10.1126/science.aac7745.
Fierer N, Jackson JA, Vilgalys R, Jackson RB. 2005. Assessment of soil microbialcommunity structure by use of taxon-specific quantitative PCR assays. Applied andEnvironmental Microbiology 71:4117–4120 DOI 10.1128/AEM.71.7.4117-4120.2005.
Gagen EJ, Padmanabha J, Denman SE, McSweeney CS. 2015.Hydrogenotrophic cultureenrichment reveals rumen Lachnospiraceae and Ruminococcaceae acetogens andhydrogen-responsive Bacteroidetes from pasture-fed cattle. FEMS Microbiology Letters362:fnv104 DOI 10.1093/femsle/fnv104.
Morrison et al. (2017), PeerJ, DOI 10.7717/peerj.2803 28/35

Gao ZM, Xu X, Ruan LW. 2014. Enrichment and characterization of an anaerobiccellulolytic microbial consortium SQD-1.1 from mangrove soil. Applied Microbiologyand Biotechnology 98:465–474 DOI 10.1007/s00253-013-4857-2.
Gies EA, Konwar KM, Beatty JT, Hallam SJ. 2014. Illuminating microbial dark matter inmeromictic Sakinaw Lake. Applied and Environmental Microbiology 80:6807–6818DOI 10.1128/AEM.01774-14.
Godon JJ, Zumstein E, Dabert P, Habouzit F, Moletta R. 1997.Molecular microbialdiversity of an anaerobic digestor as determined by small-subunit rDNA sequenceanalysis. Applied and Environmental Microbiology 63:2802–2813.
Gu AZ, Hedlund BP, Staley JT, Strand SE, Stensel HD. 2004. Analysis and comparisonof the microbial community structures of two enrichment cultures capable ofreductively dechlorinating TCE and cis-DCE. Environmental Microbiology 6:45–54.
Guckert JB, Cooksey KE. 1990. Triglyceride accumulation and fatty acid profile changesin Chlorella (Chlorophyta) during high pH-induced cell cycle inhibition. Journal ofPhycology 26:72–79 DOI 10.1111/j.0022-3646.1990.00072.x.
Hallegraeff GM. 1993. A review of harmful algal blooms and their apparent globalincrease. Phycologia 32:79–99 DOI 10.2216/i0031-8884-32-2-79.1.
Hasegawa Y, Martin JL, Giewat MW, Rooney-Varga JN. 2007.Microbial communitydiversity in the phycosphere of natural populations of the toxic alga, Alexandriumfundyense. Environmental Microbiology 9:3108–3121DOI 10.1111/j.1462-2920.2007.01421.x.
Hecky RE, Hesslein RH. 1995. Contributions of benthic algae to lake food webs asrevealed by stable isotope analysis. Journal of the North American BenthologicalSociety 14:631–653 DOI 10.2307/1467546.
Hegler F, Lösekann-Behrens T, Hanselmann K, Behrens S, Kappler A. 2012. Influenceof seasonal and geochemical changes on the geomicrobiology of an iron carbonatemineral water spring. Applied and Environmental Microbiology 78:7185–7196DOI 10.1128/AEM.01440-12.
Higgins BT, Thornton-Dunwoody A, Labavitch JM, VanderGheynst JS. 2014.Microplate assay for quantitation of neutral lipids in extracts from microalgae.Analytical Biochemistry 465:81–89 DOI 10.1016/j.ab.2014.07.020.
Hlavínek P, Stříteský L, Pešoutová R, Houdková L. 2016. Biogas production from algalbiomass from municipal wastewater treatment.Waste Biomass Valor 7:747–752.
Hoffmann L. 1989. Algae of terrestrial habitats. Botanical Review 55:77–105DOI 10.1007/BF02858529.
Hoshaw RW,Mccourt RM. 1988. The Zygnemataceae (Chlorophyta)—a 20-year updateof research. Phycologia 27:511–548 DOI 10.2216/i0031-8884-27-4-511.1.
HuQ, Sommerfeld M, Jarvis E, Ghirardi M, Posewitz M, Seibert M, Darzins A. 2008.Microalgal triacylglycerols as feedstocks for biofuel production: perspectives andadvances. The Plant Journal 54:621–639 DOI 10.1111/j.1365-313X.2008.03492.x.
Huse SM,Welch DM,Morrison HG, SoginML. 2010. Ironing out the wrinkles in therare biosphere through improved OTU clustering. Environmental Microbiology12:1889–1898 DOI 10.1111/j.1462-2920.2010.02193.x.
Morrison et al. (2017), PeerJ, DOI 10.7717/peerj.2803 29/35

Jagtap SS, Hehemann JH, Polz MF, Lee JK, Zhao H. 2014. Comparative biochemicalcharacterization of three exolytic oligoalginate lyases from Vibrio splendidus revealscomplementary substrate scope, temperature, and pH adaptations. Applied andEnvironmental Microbiology 80:4207–4214 DOI 10.1128/AEM.01285-14.
Jiménez DJ, Chaves-Moreno D, Van Elsas JD. 2015. Unveiling the metabolic potentialof two soil-derived microbial consortia selected on wheat straw. Scientific Reports 5:Article 13845 DOI 10.1038/srep13845.
Jiménez DJ, De Lima Brossi MJ, Schückel J, Kračun SK,WillatsWGT, Van Elsas JD.2016. Characterization of three plant biomass-degrading microbial consortia bymetagenomics- and metasecretomics-based approaches. Applied Microbiology andBiotechnology 100:10463–10477.
Jones AC, Liao TSV, Najar FZ, Roe BA, Hambright KD, Caron DA. 2013. Seasonalityand disturbance: annual pattern and response of the bacterial and microbialeukaryotic assemblages in a freshwater ecosystem. Environmental Microbiology15:2557–2572 DOI 10.1111/1462-2920.12151.
Kita A, Miura T, Kawata S, Yamaguchi T, Okamura Y, Aki T, Matsumura Y,Tajima T, Kato J, Nishio N, Nakashimada Y. 2016. Bacterial communitystructure and predicted alginate metabolic pathway in an alginate-degradingbacterial consortium. Journal of Bioscience and Bioengineering 121:286–292DOI 10.1016/j.jbiosc.2015.06.014.
Krumholz LR, Bryant MP. 1986. Syntrophococcus sucromutans sp. nov. gen. nov.uses carbohydrates as electron donors and formate, methoxymonobenzenoidsorMethanobrevibacter as electron acceptor systems. Archives of Microbiology143:313–318 DOI 10.1007/BF00412795.
Kudo H, Cheng KJ, Costerton JW. 1987. Interactions between Treponema bryantii andcellulolytic bacteria in the in vitro degradation of straw cellulose. Canadian Journal ofMicrobiology 33:244–248 DOI 10.1139/m87-041.
KusaykinMI, Silchenko AS, Zakharenko AM, Zvyagintseva TN. 2016. Fucoidanases.Glycobiology 26:3–12 DOI 10.1093/glycob/cww106.
Lau JT,Whelan FJ, Herath I, Lee CH, Collins SM, Bercik P, Surette MG. 2016. Captur-ing the diversity of the human gut microbiota through culture-enriched molecularprofiling. Genome Medicine 8: Article 72 DOI 10.1186/s13073-016-0327-7.
Lazar CS, Baker BJ, Seitz K, Hyde AS, Dick GJ, Hinrichs K-U, Teske AP. 2016. Ge-nomic evidence for distinct carbon substrate preferences and ecological niches ofBathyarchaeota in estuarine sediments. Environmental Microbiology 18:1200–1211DOI 10.1111/1462-2920.13142.
Lee S-H, Park J-H, Kang H-J, Lee YH, Lee TJ, Park H-D. 2013. Distribution andabundance of Spirochaetes in full-scale anaerobic digesters. Bioresource Technology145:25–32 DOI 10.1016/j.biortech.2013.02.070.
Leschine S, Paster BJ, Canale-Parola E. 2006. Free-living saccharolytic Spirochetes:the genus Spirochaeta. In: Dworkin M, Falkow S, Rodsenberg E, Schleifer K-H,Stackebrandt E, eds. The prokaryotes. New York: Springer Science + Business Media,LLC, 195–210.
Morrison et al. (2017), PeerJ, DOI 10.7717/peerj.2803 30/35

Li Y-F, Calley JN, Ebert PJ, Helmes EB. 2014. Paenibacillus lentus sp. nov., a β-mannanolytic bacterium isolated from mixed soil samples in a selective enrichmentusing guar gum as the sole carbon source. International Journal of Systematic andEvolutionary Microbiology 64:1166–1172 DOI 10.1099/ijs.0.054726-0.
Li H, Peng J, Weber KA, Zhu Y. 2011. Phylogenetic diversity of Fe(III)-reducingmicroorganisms in rice paddy soil: enrichment cultures with different short-chain fatty acids as electron donors. Journal of Soils and Sediments 11:1234–1242DOI 10.1007/s11368-011-0371-2.
Liu C, Li H, Zhang Y, Si D, Chen Q. 2016. Evolution of microbial community alongwith increasing solid concentration during high-solids anaerobic digestion of sewagesludge. Bioresource Technology 216:87–94 DOI 10.1016/j.biortech.2016.05.048.
Maness N. 2010. Extraction and analysis of soluble carbohydrates. In: Sunkar R, ed.Plant stress tolerance: methods and protocols. Totowa: Humana Press, 341–370.
Mann KH. 1988. Production and use of detritus in various fresh-water, estuarine, andcoastal marine ecosystems. Limnology and Oceanography 33:910–930.
Martinez I, Lattimer JM, Hubach KL, Case JA, Yang J, Weber CG, Louk JA, RoseDJ, Kyureghian G, Peterson DA, HaubMD,Walter J. 2013. Gut microbiomecomposition is linked to whole grain-induced immunological improvements. ISMEJournal 7:269–280 DOI 10.1038/ismej.2012.104.
McInerneyMJ, Sieber JR, Gunsalus RP. 2009. Syntrophy in anaerobic global carbon cy-cles. Current Opinion in Biotechnology 20:623–632 DOI 10.1016/j.copbio.2009.10.001.
Moazami N, Ashori A, Ranjbar R, Tangestani M, Eghtesadi R, Nejad AS. 2012. Large-scale biodiesel production using microalgae biomass of Nannochloropsis. Biomass &Bioenergy 39:449–453 DOI 10.1016/j.biombioe.2012.01.046.
Moen E, Horn S, Østgaard K. 1997a. Alginate degradation during anaerobic diges-tion of Laminaria hyperborea stipes. Journal of Applied Phycology 9:157–166DOI 10.1023/A:1007966126570.
Moen E, Horn S, Østgaard K. 1997b. Biological degradation of Ascophyllum nodosum.Journal of Applied Phycology 9:347–357 DOI 10.1023/A:1007988712929.
Morris BE, Henneberger R, Huber H, Moissl-Eichinger C. 2013.Microbial syntro-phy: interaction for the common good. FEMS Microbiology Reviews 37:384–406DOI 10.1111/1574-6976.12019.
Mosher JJ, Phelps TJ, Podar M, Hurt RA, Campbell JH, DrakeMM,Moberly JG, SchadtCW, Brown SD, Hazen TC, Arkin AP, Palumbo AV, Faybishenko BA, Elias DA.2012.Microbial community succession during lactate amendment and electronacceptor limitation reveals a predominance of metal-reducing Pelosinus spp. Appliedand Environmental Microbiology 78:2082–2091 DOI 10.1128/AEM.07165-11.
Mudhoo A. 2012.Mudhoo A, ed. Biogas production: pretreatment methods in anaerobicdigestion. Hoboken: Wiley.
Muylaert K, Van der Gucht K, Vloemans N, Meester LD, Gillis M, VyvermanW. 2002.Relationship between bacterial community composition and bottom-up versustop-down variables in four eutrophic shallow lakes. Applied and EnvironmentalMicrobiology 68:4740–4750 DOI 10.1128/AEM.68.10.4740-4750.2002.
Morrison et al. (2017), PeerJ, DOI 10.7717/peerj.2803 31/35

Nabarlatz D-A, Arenas-Beltrán L-P, Herrera-Soracá D-M, Niño-Bonilla D-A. 2013.Biogas production by anaerobic digestion of wastewater from palm oil mill industry.Ciencia Tecnología y Futuro 5:73–83.
Nava GM, Friedrichsen HJ, Stappenbeck TS. 2011. Spatial organization of in-testinal microbiota in the mouse ascending colon. ISME Journal 5:627–638DOI 10.1038/ismej.2010.161.
Omer FKTFAOAT. 2013. Oil and fatty acid composition of spirogyra and Chara speciesfrom Beastan SWR Spring water in Sulaimani-Kurdistan region of Iraq. EgyptianJournal of Experimental Biology (Botany) 9:159–162.
Paerl HW, Otten TG. 2013. Blooms bite the hand that feeds them. Science 342:433–434DOI 10.1126/science.1245276.
Park HH, KamN, Lee EY, KimHS. 2012. Cloning and characterization of a noveloligoalginate lyase from a newly isolated bacterium Sphingomonas sp. MJ-3.MarineBiotechnology 14:189–202 DOI 10.1007/s10126-011-9402-7.
Prabandono K, Amin S. 2015. Production of biomethane from marine microalgae. In:Kim SK, Lee CG, eds.Marine bioenergy: trends and developments. Boca Raton: CRCPress, 303–323.
Preiss J, Ashwell G. 1962a. Alginic acid metabolism in bacteria. I. Enzymatic formationof unsaturated oligosac-charides and 4-deoxy-L-erythro-5-hexoseulose uronic acid.Journal of Biological Chemistry 237:309–316.
Preiss J, Ashwell G. 1962b. Alginic acid metabolism in bacteria. II. The enzymaticreduction of 4-deoxy-L-erythro-5-hexoseulose uronic acid to 2-keto-3-deoxy-D-gluconic acid. Journal of Biological Chemistry 237:317–321.
Qian P-Y,Wang Y, Lee OO, Lau SCK, Yang J, Lafi FF, Al-Suwailem A,Wong TYH.2011. Vertical stratification of microbial communities in the Red Sea revealed by 16SrDNA pyrosequencing. ISME Journal 5:507–518 DOI 10.1038/ismej.2010.112.
Qiu YL, Kuang XZ, Shi XS, Yuan XZ, Guo RB. 2014. Paludibacter jiangxiensis sp. nov.,a strictly anaerobic, propionate-producing bacterium isolated from rice paddy field.Archives of Microbiology 196:149–155 DOI 10.1007/s00203-013-0951-1.
Ramaraj R, Unpaprom Y, Dussadee N. 2016. Potential evaluation of biogas productionand upgrading through algae. International Journal of New Technology and Research2:128–133.
Rausch T. 1981. The estimation of micro-algal protein content and its meaning tothe evaluation of algal biomass I. Comparison of methods for extracting protein.Hydrobiologia 78:237–251 DOI 10.1007/BF00008520.
Reed DC, Rassweiler A, Arkema KK. 2008. Biomass rather than growth rate deter-mines variation in net primary production by giant kelp. Ecology 89:2493–2505DOI 10.1890/07-1106.1.
Riviere D, Desvignes V, Pelletier E, Chaussonnerie S, Guermazi S, Weissenbach J,Li T, Camacho P, Sghir A. 2009. Towards the definition of a core of microor-ganisms involved in anaerobic digestion of sludge. ISME Journal 3:700–714DOI 10.1038/ismej.2009.2.
Morrison et al. (2017), PeerJ, DOI 10.7717/peerj.2803 32/35

Roalkvam I, Drønen K, Stokke R, Daae FL, Dahle H, Steen IH. 2015. Physiological andgenomic characterization of Arcobacter anaerophilus IR-1 reveals new metabolicfeatures in Epsilonproteobacteria. Frontiers in Microbiology 6: Article 987.
Sakai T, Kawai T, Kato I. 2004. Isolation and characterization of a fucoidan-degradingmarine bacterial strain and its fucoidanase.Marine Biotechnology (NY) 6:335–346DOI 10.1007/s10126-003-0033-5.
Sakazaki R. 1965. A proposed group of the family Enterobacteriaceae, the Asakusa group.International Journal of Systematic and Evolutionary Microbiology 15:45–47.
Samson R, Leduy A. 1982. Biogas production from anaerobic-digestion of Spirulina-maxima algal biomass. Biotechnology and Bioengineering 24:1919–1924DOI 10.1002/bit.260240822.
Sanchez-Andrea I, Stams AJ, Amils R, Sanz JL. 2013. Enrichment and isolation ofacidophilic sulfate-reducing bacteria from Tinto River sediments. EnvironmentalMicrobiology Reports 5:672–678.
Santegoeds CM, Ferdelman TG, Muyzer G, De Beer D. 1998. Structural and functionaldynamics of sulfate-reducing populations in bacterial biofilms. Applied and Environ-mental Microbiology 64:3731–3739.
SappM,Wichels A, Gerdts G. 2007. Impacts of cultivation of marine diatoms onthe associated bacterial community. Applied and Environmental Microbiology73:3117–3120 DOI 10.1128/AEM.02274-06.
Schloss PD,Westcott SL, Ryabin T, Hall JR, HartmannM, Hollister EB, LesniewskiRA, Oakley BB, Parks DH, Robinson CJ, Sahl JW, Stres B, Thallinger GG,Van Horn DJ, Weber CF. 2009. Introducing mothur: open-source, platform-independent, community-supported software for describing and comparingmicrobial communities. Applied and Environmental Microbiology 75:7537–7541DOI 10.1128/AEM.01541-09.
Sialve B, Bernet N, Bernard O. 2009. Anaerobic digestion of microalgae as a necessarystep to make microalgal biodiesel sustainable. Biotechnology Advances 27:409–416DOI 10.1016/j.biotechadv.2009.03.001.
Sommer U, Adrian R, De Senerpont Domis L, Elser JJ, Gaedke U, Ibelings B, Jeppe-sen E, LürlingM,Molinero JC, Mooij WM, Van Donk E,Winder M. 2012.Beyond the Plankton Ecology Group (PEG) model: mechanisms driving planktonsuccession. Annual Review of Ecology, Evolution, and Systematics 43:429–448DOI 10.1146/annurev-ecolsys-110411-160251.
Sommer U, Maciej Gliwicz Z, LampertW, Duncan A. 1986. The PEG model of seasonalsuccession of planktonic events in freshwaters. Archiv fur Hydrobiologie 106:433–471.
Stolz JF, Ellis DJ, Blum JS, Ahmann D, Lovley DR, Oremland RS. 1999. Sul-furospirillum barnesii sp. nov. and Sulfurospirillum arsenophilum sp. nov., newmembers of the Sulfurospirillum clade of the epsilon Proteobacteria. Interna-tional Journal of Systematic and Evolutionary Microbiology 49(Pt 3):1177–1180DOI 10.1099/00207713-49-3-1177.
Sutherland AD, Varela JC. 2014. Comparison of various microbial inocula for theefficient anaerobic digestion of Laminaria hyperborea. BMC Biotechnology 14:7–7DOI 10.1186/1472-6750-14-7.
Morrison et al. (2017), PeerJ, DOI 10.7717/peerj.2803 33/35

Thomas F, Barbeyron T, Tonon T, Genicot S, CzjzekM,Michel G. 2012. Characteri-zation of the first alginolytic operons in a marine bacterium: from their emergencein marine Flavobacteriia to their independent transfers to marine Proteobac-teria and human gut Bacteroides. Environmental Microbiology 14:2379–2394DOI 10.1111/j.1462-2920.2012.02751.x.
Ueki A, Akasaka H, Suzuki D, Ueki K. 2006. Paludibacter propionicigenes gen. nov., sp.nov., a novel strictly anaerobic, Gram-negative, propionate-producing bacteriumisolated from plant residue in irrigated rice-field soil in Japan. International Journalof Systematic and Evolutionary Microbiology 56:39–44 DOI 10.1099/ijs.0.63896-0.
Vanegas CH, Bartlett J. 2013. Green energy from marine algae: biogas production andcomposition from the anaerobic digestion of Irish seaweed species. EnvironmentalTechnology 34:2277–2283 DOI 10.1080/09593330.2013.765922.
Vanni MJ. 2002. Nutrient cycling by animals in freshwater ecosystems. Annual Review ofEcology and Systematics 33:341–370 DOI 10.1146/annurev.ecolsys.33.010802.150519.
Vergara-Fernandez A, Vargas G, Alarcon N, Velasco A. 2008. Evaluation of marine algaeas a source of biogas in a two-stage anaerobic reactor system. Biomass & Bioenergy32:338–344 DOI 10.1016/j.biombioe.2007.10.005.
Viggor S, Juhanson J, Jõesaar M, Mitt M, Truu J, Vedler E, Heinaru A. 2013. Dynamicchanges in the structure of microbial communities in Baltic Sea coastal seawatermicrocosms modified by crude oil, shale oil or diesel fuel.Microbiological Research168:415–427 DOI 10.1016/j.micres.2013.02.006.
Wang S, Chng KR,Wilm A, Zhao S, Yang K-L, Nagarajan N, He J. 2014. Genomiccharacterization of three unique Dehalococcoides that respire on persistent polychlo-rinated biphenyls. Proceedings of the National Academy of Sciences of the United Statesof America 111:12103–12108 DOI 10.1073/pnas.1404845111.
Wang Y, Qian P-Y. 2009. Conservative fragments in bacterial 16s rrna genes and primerdesign for 16s ribosomal DNA amplicons in metagenomic studies. PLOS ONE4:e7401 DOI 10.1371/journal.pone.0007401.
Wang J, Tang H, Zhang C, Zhao Y, DerrienM, Rocher E, Van-Hylckama Vlieg JET,Strissel K, Zhao L, ObinM, Shen J. 2015.Modulation of gut microbiota duringprobiotic-mediated attenuation of metabolic syndrome in high fat diet-fed mice.ISME Journal 9:1–15 DOI 10.1038/ismej.2014.99.
Ward AJ, Lewis DM, Green FB. 2014. Anaerobic digestion of algae biomass: a review.Algal Research 5:204–214 DOI 10.1016/j.algal.2014.02.001.
Wetzel R. 2001. Limnology. Lake and river ecosystems. New York: Academic Press.Wiley PE, Campbell JE, McKuin B. 2011. Production of biodiesel and biogas from
algae: a review of process train options.Water Environment Research 83:326–338DOI 10.2175/106143010X12780288628615.
Wust PK, HornMA, Drake HL. 2011. Clostridiaceae and Enterobacteriaceae as activefermenters in earthworm gut content. ISME Journal 5:92–106DOI 10.1038/ismej.2010.99.
Xia Y, Chin FYL, Chao Y, Zhang T. 2015. Phylogeny-structured carbohydratemetabolism across microbiomes collected from different units in wastewater
Morrison et al. (2017), PeerJ, DOI 10.7717/peerj.2803 34/35

treatment process. Biotechnology for Biofuels 8: Article 172DOI 10.1186/s13068-014-0179-6.
Xia R, Zhang Y, Critto A,Wu J, Fan J, Zheng Z, Zhang Y. 2016. The potential im-pacts of climate change factors on freshwater eutrophication: implications forresearch and countermeasures of water management in China. Sustainability 8:229DOI 10.3390/su8030229.
Xie ZF,Wang ZW,Wang QY, Zhu CW,Wu ZC. 2014. An anaerobic dynamicmembrane bioreactor (AnDMBR) for landfill leachate treatment: performanceand microbial community identification. Bioresource Technology 161:29–39DOI 10.1016/j.biortech.2014.03.014.
Xin F, He J. 2013. Characterization of a thermostable xylanase from a newly isolatedKluyvera species and its application for biobutanol production. Bioresource Technol-ogy 135:309–315 DOI 10.1016/j.biortech.2012.10.002.
XuM, Chen X, QiuM, Zeng X, Xu J, Deng D, Sun G, Li X, Guo J. 2012. Bar-Coded Pyrosequencing reveals the responses of PBDE-degrading micro-bial communities to electron donor amendments. PLOS ONE 7:e30439DOI 10.1371/journal.pone.0030439.
Yagi JM, Suflita JM, Gieg LM, DeRito CM, Jeon C-O, Madsen EL. 2010. Subsurfacecycling of nitrogen and anaerobic aromatic hydrocarbon biodegradation revealedby nucleic acid and metabolic biomarkers. Applied and Environmental Microbiology76:3124–3134 DOI 10.1128/AEM.00172-10.
Yen HW, Brune DE. 2007. Anaerobic co-digestion of algal sludge and waste paper toproduce methane. Bioresource Technology 98:130–134DOI 10.1016/j.biortech.2005.11.010.
Yonemoto Y, Tanaka H, Hisano T, Sakaguchi K, Abe S, Yamashita T, KimuraA, Murata K. 1993. Bacterial alginate lyase gene: nucleotide sequence andmolecular route for generation of alginate lyase species. Journal of Fermentationand Bioengineering Journal of Fermentation and Bioengineering 75:336–342DOI 10.1016/0922-338X(93)90130-Z.
Youssef NH, Couger MB, ElshahedMS. 2010. Fine-scale bacterial beta diversity withina complex ecosystem (Zodletone Spring, OK, USA): the role of the rare biosphere.PLOS ONE 5:e12414 DOI 10.1371/journal.pone.0012414.
Youssef NH, Farag IF, Rinke C, Hallam SJ, Woyke T, ElshahedMS. 2015. In silicoanalysis of the metabolic potential and niche specialization of candidate phylum‘‘Latescibacteria’’ (WS3). PLOS ONE 10:e0127499DOI 10.1371/journal.pone.0127499.
Yuan XZ, Shi XS, Zhang DL, Qiu YL, Guo RB,Wang LS. 2011. Biogas productionand microcystin biodegradation in anaerobic digestion of blue algae. Energy &Environmental Science 4:1511–1515 DOI 10.1039/c0ee00452a.
Ziemer CJ. 2014. Newly cultured bacteria with broad diversity isolated from eight-weekcontinuous culture enrichments of cow feces on complex polysaccharides. Appliedand Environmental Microbiology 80:574–585 DOI 10.1128/AEM.03016-13.
Morrison et al. (2017), PeerJ, DOI 10.7717/peerj.2803 35/35