mid-western regional council financial assessment … · mid-western regional council financial...
TRANSCRIPT

Mid-Western Regional Council Page 1
Mid-Western Regional Council
Financial Assessment and Benchmarking Report
8 October 2012
Prepared by NSW Treasury Corporation as part of the Local Infrastructure Renewal Scheme

Mid-Western Regional Council Page 2
Disclaimer
This report has been prepared by New South Wales Treasury Corporation (TCorp) in accordance with
the appointment of TCorp by the Division of Local Government (DLG) as detailed in TCorp’s letters of
22 December 2011 and 28 May 2012. The report has been prepared as part of the Local Infrastructure
Renewal Scheme (LIRS) announced by the NSW Government.
The report has been prepared based on information provided to TCorp as set out in Section 2.2 of this
report. TCorp has relied on this information and has not verified or audited the accuracy, reliability or
currency of the information provided to it for the purpose of preparation of the report. TCorp and its
directors, officers and employees make no representation as to the accuracy, reliability or
completeness of the information contained in the report.
In addition, TCorp does not warrant or guarantee the outcomes or projections contained in this report.
The projections and outcomes contained in the report do not necessarily take into consideration the
commercial risks, various external factors or the possibility of poor performance by the Council all of
which may negatively impact the financial capability and sustainability of the Council. The TCorp report
focuses on whether the Council has reasonable capacity, based on the information provided to TCorp,
to take on additional borrowings within prudent risk parameters and the limits of its financial projections.
The report has been prepared for Mid-Western Regional Council, the LIRS Assessment Panel and the
DLG. TCorp shall not be liable to Mid-Western Regional Council or have any liability to any third party
under the law of contract, tort and the principles of restitution or unjust enrichment or otherwise for any
loss, expense or damage which may arise from or be incurred or suffered as a result of reliance on
anything contained in this report.

Mid-Western Regional Council Page 3
Index
Section 1 Executive Summary ...................................................................................................... 4
Section 2 Introduction ................................................................................................................... 6
2.1: Purpose of Report ............................................................................................................. 6
2.2: Scope and Methodology .................................................................................................... 6
2.3: Overview of the Local Government Area ........................................................................... 8
2.4: LIRS Application ................................................................................................................ 9
Section 3 Review of Financial Performance and Position ........................................................... 10
3.1: Revenue .......................................................................................................................... 10
3.2: Expenses ......................................................................................................................... 11
3.3: Operating Results ............................................................................................................ 12
3.4: Financial Management Indicators .................................................................................... 13
3.5: Statement of Cashflows................................................................................................... 14
3.6: Capital Expenditure ......................................................................................................... 15
3.6(a): Infrastructure Backlog ................................................................................................. 15
3.6(b): Infrastructure Status .................................................................................................... 16
3.6(c): Capital Program .......................................................................................................... 17
3.7: Specific Risks to Council ................................................................................................. 18
Section 4 Review of Financial Forecasts .................................................................................... 19
4.1: Operating Results ............................................................................................................ 19
4.2: Financial Management Indicators .................................................................................... 19
4.3: Capital Expenditure ......................................................................................................... 23
4.4: Financial Model Assumption Review ............................................................................... 23
4.5: Borrowing Capacity ......................................................................................................... 26
Section 5 Benchmarking and Comparisons with Other Councils ...................................................... 27
Section 6 Conclusion and Recommendations .................................................................................. 33
Appendix A Historical Financial Information Tables ................................................................... 34
Appendix B Glossary ................................................................................................................. 37

Mid-Western Regional Council Page 4
Section 1 Executive Summary
This report provides an independent assessment of Mid-Western Regional Council (the Council)
financial capacity and its ability to undertake additional borrowings. The analysis is based on a review
of the historical performance, current financial position, and long term financial forecasts. It also
benchmarks the Council against its peers using key ratios.
The report is primarily focused on the financial capacity of the Council to undertake additional
borrowings as part of the Local Infrastructure Renewal Scheme (LIRS).
Council has made one application for $4.5m relating to their regional swimming pools refurbishment
program.
TCorp’s approach has been to:
Review the most recent three years of Council’s consolidated financial results
Conduct a detailed review of the Council’s 10 year financial forecasts. The review of the
financial forecasts focused on the particular Council fund that was undertaking the proposed
debt commitment. For the Council, the project is being funded from the General Fund so we
focused our review on the General Fund.
The Council has been well managed over the review period based on the following observations:
While the Council has incurred operating deficits (excluding grants and contributions for
capital purposes) in 2010 and 2011, Council’s underlying result (measured using EBITDA)
has posted its strongest result in 2011
With a relatively small population, Council’s own source revenue is below the ratio benchmark
but Council has a track record of successfully applying for grants and contributions to boost
their total revenues and are confident there is a high degree of certainty regarding the majority
of this source of revenue.
Council has had sufficient liquidity as indicated by the Unrestricted Current Ratio and Cash
Expense Ratio remaining above their respective benchmarks over the three year period
Council had total borrowings that remained static over the three year period at $7.3m,
representing 1.4% of Net Assets.
The Council reported $101.3m of Infrastructure Backlog in 2011 with an infrastructure asset value of
$385.1m. Other observations include:
The Infrastructure Backlog has remained within a $5.0m variance over the three year period,
despite an increase in the total value of infrastructure assets of $130.1m over the period
following the Asset Revaluations
The largest asset class within the Infrastructure Backlog is public roads at 41.4% of the total
backlog
While funding is slightly below the benchmark for asset maintenance and asset renewals
investment, Council has adequately invested in capital expenditure over the three years. This
is indicated by the Capital Expenditure Ratio being above the benchmark in all three years.
This indicates the capex focus has been on new assets more than the renewal of assets.

Mid-Western Regional Council Page 5
The key observations from our review of Council’s 10 year forecasts for its General Fund are:
Council is forecasting to generate an operating deficit in all 10 years excluding capital grants
and contributions, although on an upward trend from 2012 to 2019
Council is forecasting sufficient liquidity throughout the 10 year period to service all short term
liabilities
Council’s level of fiscal flexibility is limited as Council’s own source operating revenue is
maintained at levels equal to or below the 60% ratio benchmark
Council is forecasting a capital expenditure shortfall over the 10 years of $13.7m when
compared to the cumulative depreciation
The forecast assumes current service levels are maintained across the 10 year period.
The key assumptions within the forecast appear to be realistic
In our view, the Council has the capacity to undertake the combined additional borrowings of $4.5m for
the LIRS project. This is based on the following analysis:
The DSCR is strongly above the benchmark of 2.0x in the 10 year forecast period
The Interest Cover Ratio is strongly above the benchmark of 4.0x in the 10 year forecast
We also believe that Council will have additional capacity to utilise further borrowings of up to
$13.3m in 2013 based on the current forecast results and TCorp’s calculations and
recommendations
Council may be able to utilise further borrowings above this amount, however all
recommendations for additional borrowings are made on the assumption that Council
continue to receive consistent operating grants and contributions similar to the annual totals
received in the last three years
Council is classified as a small regional town by DLG however the LGA essentially relies upon
rural economic sectors. The Council is dependent on grants, both operating and capital, to
enable them to meet their ongoing operating expenses. In 2011 the operating and capital
grants and contributions equated to 38.9% of total revenue.
In respect of the Benchmarking analysis, TCorp has compared the Council’s key ratios, on a
consolidated basis, with other councils in DLG Group 4. The key observations are:
Council’s financial flexibility was mixed, as indicated by the Operating Ratio which
outperformed the group’s average, and the Own Source Operating Revenue Ratio which
underperformed the group’s average over the review period
Council’s liquidity position was very strong and compared favourably with the group’s average
Council has a lower level of gearing than its peers. Its DSCR and Interest Cover Ratio were
very strong in the past three years
Council’s Infrastructure Backlog was above the group’s average and the benchmark
throughout the review period. Council’s asset maintenance and asset renewal compared
favourably to the group’s average although were generally below benchmark. Capital works
expenditure levels were sufficient and are forecast to remain strong over the medium term

Mid-Western Regional Council Page 6
Section 2 Introduction
2.1: Purpose of Report
This report provides the Council with an independent assessment of their financial capacity and
performance measured against a peer group of councils which will complement their internal due
diligence, and the IP&R system of the Council and the DLG.
The report is to be provided to the LIRS Assessment Panel for its use in considering applications
received under the LIRS.
The key areas focused on are:
The financial capacity of the Council to undertake additional borrowings
The financial performance of the Council in comparison to a range of similar councils and
measured against prudent benchmarks
2.2: Scope and Methodology
TCorp’s approach was to:
Review the most recent three years of the Council’s consolidated audited accounts using
financial ratio analysis. In undertaking the ratio analysis TCorp has utilised ratio’s
substantially consistent with those used by Queensland Treasury Corporation (QTC) initially in
its review of Queensland Local Government (2008), and subsequently updated in 2011
Conduct a detailed review of the Council’s 10 year financial forecasts including a review of the
key assumptions that underpin the financial forecasts. The review of the financial forecasts
focused on the particular Council fund that was undertaking the proposed debt commitment.
For example where a project is being funded from the General fund we focussed our review
on the General fund
Identify significant changes to future financial forecasts from existing financial performance
and highlight risks associated with such forecasts
Conduct a benchmark review of a Council’s performance against its peer group
Prepare a report that provides an overview of the Council’s existing and forecast financial
position and its capacity to meet increased debt commitments
Conduct a high level review of the Council’s IP&R documents for factors which could impact
the Council’s financial capacity and performance
In undertaking its work, TCorp relied on:
Council’s audited financial statements (2008/09 to 2010/11)
Council’s financial forecast model
Council’s IP&R documents
Discussions with Council officers
Council’s submissions to the DLG as part of their LIRS application
Other publicly available information such as information published on the IPART website

Mid-Western Regional Council Page 7
Benchmark Ratios
In conducting our review of the Councils’ financial performance and forecasts we have measured
performance against a set of benchmarks. These benchmarks are listed below. Benchmarks do not
necessarily represent a pass or fail in respect of any particular area. One-off projects or events can
impact a council’s performance against a benchmark for a short period. Other factors such as the
trends in results against the benchmarks are critical as well as the overall performance against all the
benchmarks. As councils can have significant differences in their size and population densities, it is
important to note that one benchmark does not fit all.
For example, the Cash Expense Ratio should be greater for smaller councils than larger councils as a
protection against variation in performance and financial shocks.
Therefore these benchmarks are intended as a guide to performance.
The Glossary attached to this report explains how each ratio is calculated.
Ratio Benchmark
Operating Ratio > (4.0%)
Cash Expense Ratio > 3.0 months
Unrestricted Current Ratio > 1.5x
Own Source Operating Revenue Ratio > 60.0%
Debt Service Cover Ratio (DSCR) > 2.0x
Interest Cover Ratio > 4.0x
Infrastructure Backlog Ratio < 0.02x
Asset Maintenance Ratio > 1.0x
Building and Infrastructure Asset Renewal Ratio > 1.0x
Capital Expenditure Ratio > 1.1x

Mid-Western Regional Council Page 8
2.3: Overview of the Local Government Area
Mid-Western Regional Council LGA
Locality and Size
Locality Central West
Area 8,758 km²
DLG Group No. 4
Demographics
Population (as at 30 June 2011) 22,318
% under 20 27%
% between 18 and 60 48%
% over 60 25%
Expected population in 2021* 22,300
Operations
Number of employees (FTE) 275
Annual revenue $55m
Infrastructure
Roads 2,413km
Swimming Pools 3
Infrastructure backlog value $101m
Total infrastructure value $385m
*this estimated population figure was stated prior to the estimated increase relating to the mining expansion
Mid-Western Regional Council Local Government Area (LGA) is located 250 km North-West of
Sydney.
The LGA’s key economic sectors include:
Agriculture – super fine wool, honey and thoroughbred horses are produced
Viticulture – there are approximately 4,500 hectares under vine and around 40 cellar doors
Mining – this is a rapidly expanding industry with five major coal mines in operation with a
further four proposed
Tourism – the LGA has over 280,000 tourists annually
Retail – there are more than 300 retail establishments in Mudgee, the growing regional
shopping centre
The average annual increase in population between 2006 and 2011 has been 0.8% p.a. Some
sources are projecting virtually zero growth in the population up to 2021 however Council have
highlighted that due to the planned expansion of mining in the LGA, a fact Council has little control of,
there could be an increase of up to 5,000 residents in the next five years related to this expansion. In
2011 Council were awarded the National Award for Excellence (small council) for Local Government,
one of only two awards made each year. This was presented to Council in relation to their

Mid-Western Regional Council Page 9
‘Inspire/Encourage/Enlighten’ project that sent a message to the community promoting the
opportunities available for its female employees.
Council manages infrastructure, property, plant and equipment (IPP&E) of $521.0m in 2011. This
includes:
$212.4m of road, bridge and footpath assets
$63.3m of water supply assets
$32.4m of sewerage assets
$5.5m of stormwater drainage
$31.2m of non specialised buildings
$28.5m of specialised buildings
$12.0m of other structures
2.4: LIRS Application
Council has made one LIRS application.
Project: Regional Swimming Pools Refurbishment
Description: Asset renewal works on three regional swimming pool facilities - Mudgee, Gulgong and
Kandos. This includes replacing the plant rooms, refurbishing the damaged pool environments (e.g.
concreting and tiles), rebuilding the amenities and front entrance at all pools and installing a disabled
access ramp at the Gulgong facility.
Amount of loan facility: $4.5m
Term of loan facility: 20 years

Mid-Western Regional Council Page 10
Section 3 Review of Financial Performance and Position
In reviewing the financial performance of the Council, TCorp has based its review on the annual
audited accounts of the Council unless otherwise stated.
3.1: Revenue
Key Observations
Total operating revenues have increased over the period by $1.8m. This was due to a 4.0%
increase in 2011 to $46.8m after revenues remained static in 2010.
Rates and annual charges are Council’s largest revenue source and have increased steadily
over the period at rates marginally above the IPART approved rate peg, with increases in
ordinary rates being the main contributor.
User fees and charges fluctuated over the period with the reduction in 2011 due to a $0.8m
reduction in the fees received from works on the state roads via the RMS along with a $0.5m
reduction in water supply services user charges. This reduction was due to excessive rainfall
in the year that impacted the demand for water supplies.
Council’s own source operating revenue has remained around 55% of all revenues for the
three years, highlighting Council’s need to attract and rely upon grants and contributions
funding to assist the provision of services to the community.
Operating grants and contributions also fluctuated over the period and increased by $2.4m in
2011. This increase was primarily due to a $2.0m contribution received from the RMS after
the December 2010 storm and flood damage. In total Council estimate $9.5m of damage
occurred, with $4.5m in compensation received. $1.1m of the reduction in 2010 was due to
20,331 19,520 18,717
9,678 10,783 10,357
1,722 1,7522,055
13,470 11,072 12,515
1,6141,884 1,365
0
5,000
10,000
15,000
20,000
25,000
30,000
35,000
40,000
45,000
50,000
2011 2010 2009
Figure 1 - Revenue Sources for 2008/09 to 2010/11 ($'000s)
Rates and annual charges User charges and fees
Interest and investment revenue Grants and contributions for operating purposes
Other revenues

Mid-Western Regional Council Page 11
timing differences in relation to when the general purpose financial assistance grants were
received while there was also a $0.5m reduction in road and bridges contributions. The roads
and bridges contributions reduced as these were one-off items received in 2009.
3.2: Expenses
Key Observations
Total expenses have increased by $5.6m over the period, representing an average increase
of 6.5% p.a.
Employee costs increased marginally over the period by 1.6%. They increased in 2010 due
to increased defined benefit scheme superannuation payments and workers compensation
insurance payments but decreased in 2011 due to a reduction in employee leave entitlements
of $0.6m. The reduction in equivalent full time (EFT) employees from 283 in 2009 to 275 in
2011 contributed to limiting the increase over the period. The annual salary increases were
off-set by the overall reduction in the employee leave entitlements in line with the reduction in
employee numbers.
Materials and contracts reduced in 2011 as contractor costs reduced by $1.6m. One factor
for this is subsequent to the Asset Revaluations, Council now account for road/footpath
reseals as capitalised costs and not maintenance expense.
Depreciation has seen the largest increase of all expenses following the Asset Revaluations
and has increased by 55.9% to $15.1 over the period.
The net losses from disposal of assets have increased over the period. The 2010 and 2011
amounts include the disposal of infrastructure assets when they have been replaced however
$0.7m of the 2011 total related to a write-off of capital works in progress relating to Redbank
17,076 17,921 16,801
528 533530
10,26811,681
11,602
15,075 10,0589,670
4,6445,014
4,155
761406
33
0
10,000
20,000
30,000
40,000
50,000
60,000
2011 2010 2009
Figure 2 - Expenses for 2008/09 to 2010/11 ($'000s)
Employees Borrowing costs
Materials and contract expenses Depreciation and amortisation
Other expenses Net loss from the disposal of assets

Mid-Western Regional Council Page 12
Dam that is a one-off expense and has therefore been excluded from the 2011 net loss from
disposal of assets figure. Please see section 3.7 for further detail in this regard.
3.3: Operating Results
TCorp has made some standard adjustments to focus the analysis on core operating council results.
Grants and contributions for capital purposes, realised and unrealised gains on investments and other
assets are excluded, as well as one-off items which Council has no control over (e.g. impairments).
TCorp believes that the exclusion of these items will assist in normalising the measurement of key
performance indicators, and the measurement of Council’s performance against its peers.
All items excluded from the income statement and further historical financial information is detailed in
Appendix A.
Key Observations
Council’s operating result excluding the capital grants and contributions has been on a
downward trend with deficits posted in 2010 and 2011.
The static revenues against overall increasing expenses in 2010 and the specific increase in
depreciation in 2011 are the reasons for the worsening results, while the increased net losses
on the disposal of assets in those years have exacerbated the position.
Council expenses include a large non-cash depreciation expense, ($15.1m in 2011), which
has increased substantially over the past three years following the Asset Revaluations
process. Whilst the non cash nature of depreciation can favourably impact on ratios such as
EBITDA that focus on cash, depreciation is an important expense as it represents the
allocation of the value of an asset over its useful life.
(1,537)
(602)
2,218
6,198
8,022
10,084
(4,000)
(2,000)
0
2,000
4,000
6,000
8,000
10,000
12,000
2011 2010 2009
Figure 3 - Operating Results for 2008/09 to 2010/11 ($'000s)
Operating result (excluding capital grants and contributions)
Operating result (including capital grants and contributions)

Mid-Western Regional Council Page 13
3.4: Financial Management Indicators
Performance Indicators Year ended 30 June
2011 2010 2009
EBITDA ($’000s) 14,066 9,989 12,418
Operating Ratio (3.3%) (1.3%) 4.9%
Interest Cover Ratio 26.64x 18.74x 23.43x
Debt Service Cover Ratio 13.54x 9.24x 12.26x
Unrestricted Current Ratio 3.45x 3.07x 3.38x
Net assets ($'000s) 541,201 535,142 361,005
Key Observations
Council’s cash position measured using EBITDA, was reasonably consistent with the
strongest underlying performance in 2011 due to the decrease in expenses when depreciation
is excluded.
The Operating Ratio has progressively declined over the review period and was close to the
benchmark in 2011.
The DSCR and Interest Cover Ratio are well above the benchmark demonstrating that
Council can adequately service their current level of borrowings ($7.3m) while also indicating
that there is further capacity to utilise additional borrowings.
The Unrestricted Current Ratio is above the benchmark in all three years indicating Council
can adequately meet their day to day liabilities. Council adopts a conservative approach to
managing cash and keeps the majority of cash and investments (approximately $25.4m or
96% in 2011) in cash and cash equivalents rather than current investments.
The Net Asset position increased over the period as the Asset Revaluations increased the
value of IPP&E in 2010 by $165.9m for roads, bridges and footpaths and $6.5m for bulk
earthworks in 2011. There was also$5.3m IPP&E impairment to infrastructure recognised
against equity in 2011.
When excluding the Asset Revaluations, Council has increased the IPP&E asset base by
$26.8m over the review period, with asset purchases being higher than the combined value of
disposed assets and depreciation.
Council has total borrowings of $7.3m in 2011 equating to 1.4% of Net Assets.

Mid-Western Regional Council Page 14
3.5: Statement of Cash flows
Key Observations
Council’s cash and cash equivalents is showing a downward trend, and when investments are
included this trend remains. The reason for this has been the increased investment in IPP&E
in consecutive years in 2010 and 2011.
Overall cash and cash equivalents, and investments have reduced from $38.4m in 2009 to
$28.7m in 2011. Of the $28.7m, $19.5m is externally restricted, $5.5m is internally restricted
and $3.7m is unrestricted.
Within the investments portfolio of $3.3m, $1.0m is invested in current deposit accounts,
$1.0m is in NCDs/FRNs and $1.3m is in equity linked notes.
The levels of cash reserves along with the Unrestricted Current Ratio above the benchmark
highlights an adequate liquidity position with Council likely to have the capacity to manage
most irregular financial events that may impact the Council’s cash position.
Council may be able to increase the return on their cash and equivalents by apportioning a
larger amount to term deposits.
25,35430,030
33,259
0
5,000
10,000
15,000
20,000
25,000
30,000
35,000
2011 2010 2009
Figure 4 - Cash and Cash Equivalents for 2008/09 to 2010/11 ($'000s)

Mid-Western Regional Council Page 15
3.6: Capital Expenditure
The following section predominantly relies on information obtained from Special Schedules 7 and 8 that
accompany the annual financial statements. These figures are unaudited and are therefore Council’s
estimated figures.
3.6(a): Infrastructure Backlog
The Council’s Infrastructure Backlog stands at $101.3m in 2011, a small increase from $99.1m in 2009.
Council’s Infrastructure Backlog figure has always been based on current cost estimates therefore the
backlog figure was not impacted by the increase in asset values following the Asset Revaluations.
The 2011 backlog is split between all five asset classes with public roads being the largest at $42.0m.
Sewerage reduced by $8.4m over the period, in part due to the sewer augmentation at Mudgee,
Rylstone & Kandos.
4%
41%
22%
31%
2%
Figure 6 - Infrastructure Backlog Composition for 2010/11
Buildings and other structures
Public roads (inc. footpaths and car
parks)
Water
Sewerage
Drainage works
0
5,000
10,000
15,000
20,000
25,000
30,000
35,000
40,000
45,000
Buildings and other
structures
Public roads (inc.
footpaths and car parks)
Water Sewerage Drainage works
Figure 5 - Infrastructure Backlog for 2008/09 to 2010/11 ($'000s)
2011 2010 2009

Mid-Western Regional Council Page 16
3.6(b): Infrastructure Status
Infrastructure Status Year ended 30 June
2011 2010 2009
Bring to satisfactory standard ($’000s) 101,336 96,321 99,109
Required annual maintenance ($’000s) 7,847 6,246 9,335
Actual annual maintenance ($’000s) 6,670 6,582 7,432
Total value of infrastructure assets ($’000s) 385,142 376,734 255,062
Total assets ($’000s) 559,293 554,011 378,559
Infrastructure Backlog Ratio 0.26x 0.26x 0.39x
Asset Maintenance Ratio 0.85x 1.05x 0.80x
Building and Infrastructure Renewals Ratio 0.84x 0.85x 1.06x
Capital Expenditure Ratio 1.38x 2.27x 1.88x
Council’s Infrastructure Backlog Ratio has decreased from 2009 however this is due to a relatively
static backlog figure and an increase in the total value of infrastructure assets following the Asset
Revaluations.
Over the review period, Council has marginally under invested in maintenance as indicated by the
Asset Maintenance Ratio, with the total shortfall for the three years amounting to $2.7m.
The Building and Infrastructure Renewals Ratio was above the benchmark in 2009, however it
reduced below benchmark in both 2010 and 2011. The overall result indicates Council’s ongoing
commitment to their asset renewal capital works program with a marginal increase in funding
required for the benchmark to be attained in future years.
As confirmed by the $26.8m increase in the infrastructure asset base, Council has adequately
invested in capital expenditure, with the Capital Expenditure Ratio above the benchmark in each of
the three years.
Mid-Western Regional Council Page 17
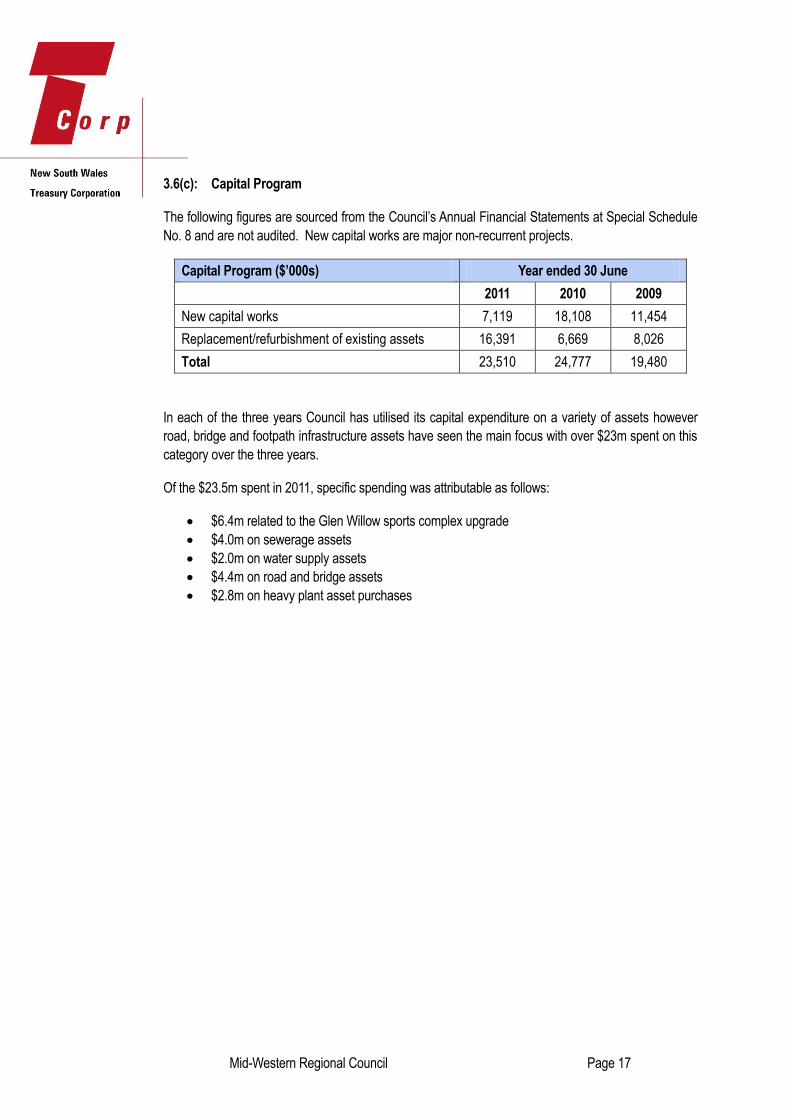
3.6(c): Capital Program
The following figures are sourced from the Council’s Annual Financial Statements at Special Schedule
No. 8 and are not audited. New capital works are major non-recurrent projects.
Capital Program ($’000s) Year ended 30 June
2011 2010 2009
New capital works 7,119 18,108 11,454
Replacement/refurbishment of existing assets 16,391 6,669 8,026
Total 23,510 24,777 19,480
In each of the three years Council has utilised its capital expenditure on a variety of assets however
road, bridge and footpath infrastructure assets have seen the main focus with over $23m spent on this
category over the three years.
Of the $23.5m spent in 2011, specific spending was attributable as follows:
$6.4m related to the Glen Willow sports complex upgrade
$4.0m on sewerage assets
$2.0m on water supply assets
$4.4m on road and bridge assets
$2.8m on heavy plant asset purchases
Mid-Western Regional Council Page 18
3.7: Specific Risks to Council
Population increasing linked to mining expansion in the LGA. The four existing coal mines
within the LGA are expanding and other mines may follow that could add an additional 5,000
residents to the region in the next five years. Council are responsible for providing extra
services and negotiating with other Government departments and developers to make sure
this increased population has sufficient services and housing. Council is working with state
agencies to undertake a development service assessment, particularly focussed on the
Mudgee Township to understand the financial impacts of the anticipated growth and costs
associated with coal mining. This aims to develop strategies to address the impacts.
Low fiscal flexibility. Council relies upon successfully attracting grant funding from both the
State and Federal Government to complement their limited own source operating revenues.
As Council is reliant on this funding they have a higher risk than many Councils if the State or
Federal Government amends their funding practices or policies in future years. Council
believes that they will be able to continue to receive these levels of grants and have therefore
included this within their LTFP.
Ageing workforce. Council has stated that they expect long service leave entitlements to
increase in future years as the average workforce age continues to grow. Within Council’s
Delivery Program and Operational Plan for 2013 they have identified strategies to manage the
changing demographics of their workforce although further funding may be required in this
area as some action plans have not been allocated funding in the 2013 budget .
Environmental and natural disasters. In the last three years Council’s LGA has been declared
a natural disaster area three times due to floods and bushfires. Following the December 2010
floods Council received $4.5m in compensation against $9.5m worth of infrastructure
damage. While these events can cause financial strain, Council’s robust financial position has
ensured that they have remained financially sustainable to date.
Inability to reduce Infrastructure Backlog. Council is continuing to refine their AMP, to assess
replacement points and maintenance expenditure levels and this will provide further insight
into the long term financial sustainability of Council. Given the existing revenue raising
framework that applies, Council has stated that they are unlikely to be able to reduce the
backlog, especially when the community have stated that they would not agree to an SRV.
Council recognises further work is required in the area of asset management and long term
funding to develop strategies for addressing the backlog.
Redbank Dam legal dispute possibility. As stated within section 3.2, Council wrote-off $0.7m
of capital works in progress in relation to Redbank Dam. This was because Council do not
believe that it is their responsibility to contribute to amendment works required by the NSW
Dams Safety Commitee. Council do not accept ownership of the dam and therefore believe
they are not liable to pay for the works that are estimated to cost $2.0m. Council is pursuing
the matter of ownership with the relevant State Government Minister to confirm they do not
own the dam. If this fails Council have indicated that they will consider legal action. If this
action is followed Council will have additional legal costs and may also be liable for part or all
of the $2.0m amendment works. Council has not made any provision in relation to this issue
as they are adamant that the dam is not their responsibility.
Following a discussion with Council, the Redbank Dam dispute appears to have been
resolved with Council in agreement to fund $0.2m of the $0.8m total amendment works and
the NSW Office of Water funding the remaining $0.6m.
Mid-Western Regional Council Page 19
Section 4 Review of Financial Forecasts
The financial forecast model shows the projected financial statements and assumptions for the next 10
years. The model includes the $4.5m loan without any LIRS subsidy. $1.4m is included within the
2012 financial year and has already been expended in relation to the plant room replacements with
$3.1m to draw down in 2013 to complete the project.
The LIRS loan relates to the General Fund, therefore we have focused our financial analysis solely
upon this Fund. Council’s consolidated position includes both a Water and Sewer Fund however these
are operated as independent entities, which unlike the General Fund are more able to adjust the
appropriate fees and charges to meet all future operating and investing expenses.
There is also a separate Other Fund that specifically relates to waste management within the 2011
financial statements however this is incorporated within the General Fund for the forecast and our
analysis.
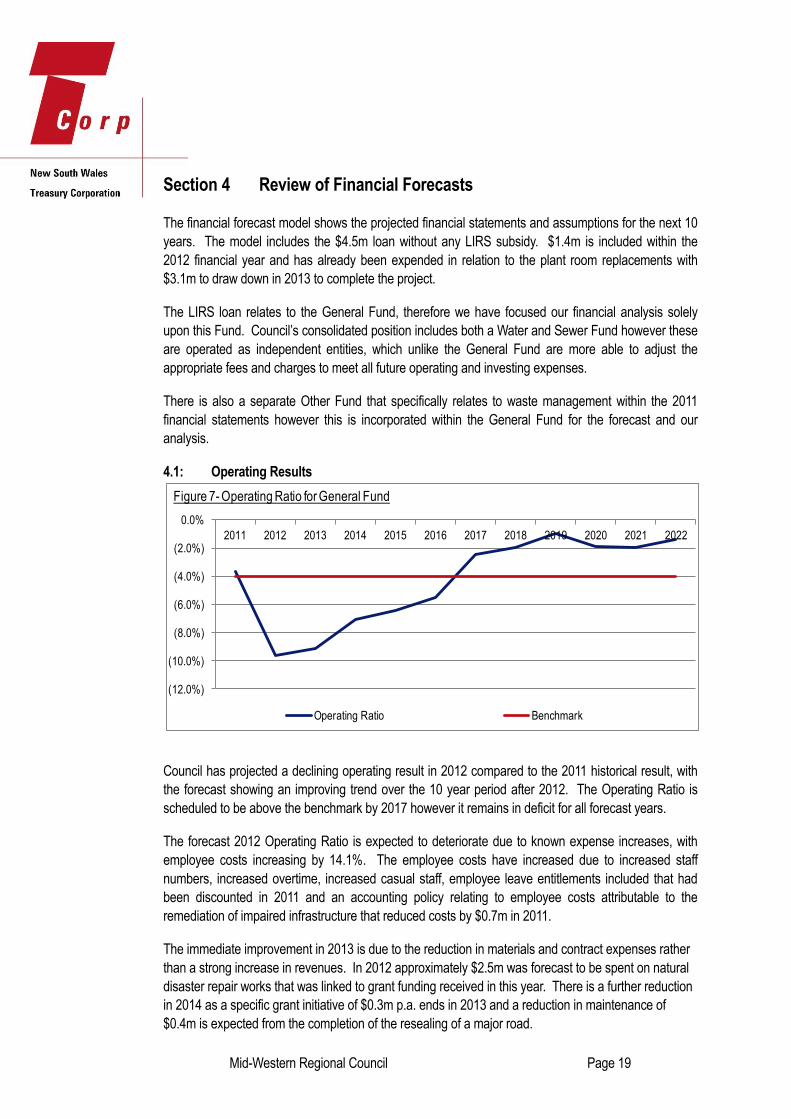
4.1: Operating Results
Council has projected a declining operating result in 2012 compared to the 2011 historical result, with
the forecast showing an improving trend over the 10 year period after 2012. The Operating Ratio is
scheduled to be above the benchmark by 2017 however it remains in deficit for all forecast years.
The forecast 2012 Operating Ratio is expected to deteriorate due to known expense increases, with
employee costs increasing by 14.1%. The employee costs have increased due to increased staff
numbers, increased overtime, increased casual staff, employee leave entitlements included that had
been discounted in 2011 and an accounting policy relating to employee costs attributable to the
remediation of impaired infrastructure that reduced costs by $0.7m in 2011.
The immediate improvement in 2013 is due to the reduction in materials and contract expenses rather
than a strong increase in revenues. In 2012 approximately $2.5m was forecast to be spent on natural
disaster repair works that was linked to grant funding received in this year. There is a further reduction
in 2014 as a specific grant initiative of $0.3m p.a. ends in 2013 and a reduction in maintenance of
$0.4m is expected from the completion of the resealing of a major road.
(12.0%)
(10.0%)
(8.0%)
(6.0%)
(4.0%)
(2.0%)
0.0%
2011 2012 2013 2014 2015 2016 2017 2018 2019 2020 2021 2022
Figure 7- Operating Ratio for General Fund
Operating Ratio Benchmark

Mid-Western Regional Council Page 20
The years 2017 to 2019 benefit from higher forecast gains from the disposal of land assets of between
$0.6m and $0.9m and all years from 2017 benefit from increased interest and investment revenue.
4.2: Financial Management Indicators
The financial management indicators are linked to the utilisation of debt in early years and improve
over time as the amortising debt reduces and operating deficits are forecast to improve.
Liquidity Ratios
Council has forecast cash and cash equivalents to be above the benchmark for the full period with a
decrease in 2012 followed by a continuous increase over the remaining 10 years.
With the historical high levels of cash and cash equivalents it appears reasonable for Council to be
above the benchmark over the forecast period.
While Council has forecast the growth in cash and cash equivalents, current investments are forecast
to remain static. Council may be able to invest some of the unutilised funds into term deposit accounts
to maximise their financial return.
The increase in the cash and cash equivalents is forecast while there is a projected shortfall in capital
expenditure as illustrated in section 4.3.
0.0 months
2.0 months
4.0 months
6.0 months
8.0 months
10.0 months
12.0 months
14.0 months
16.0 months
2011 2012 2013 2014 2015 2016 2017 2018 2019 2020 2021 2022
Figure 8 - Cash Expense Ratio for General Fund
Cash Expense Ratio Benchmark
Mid-Western Regional Council Page 21
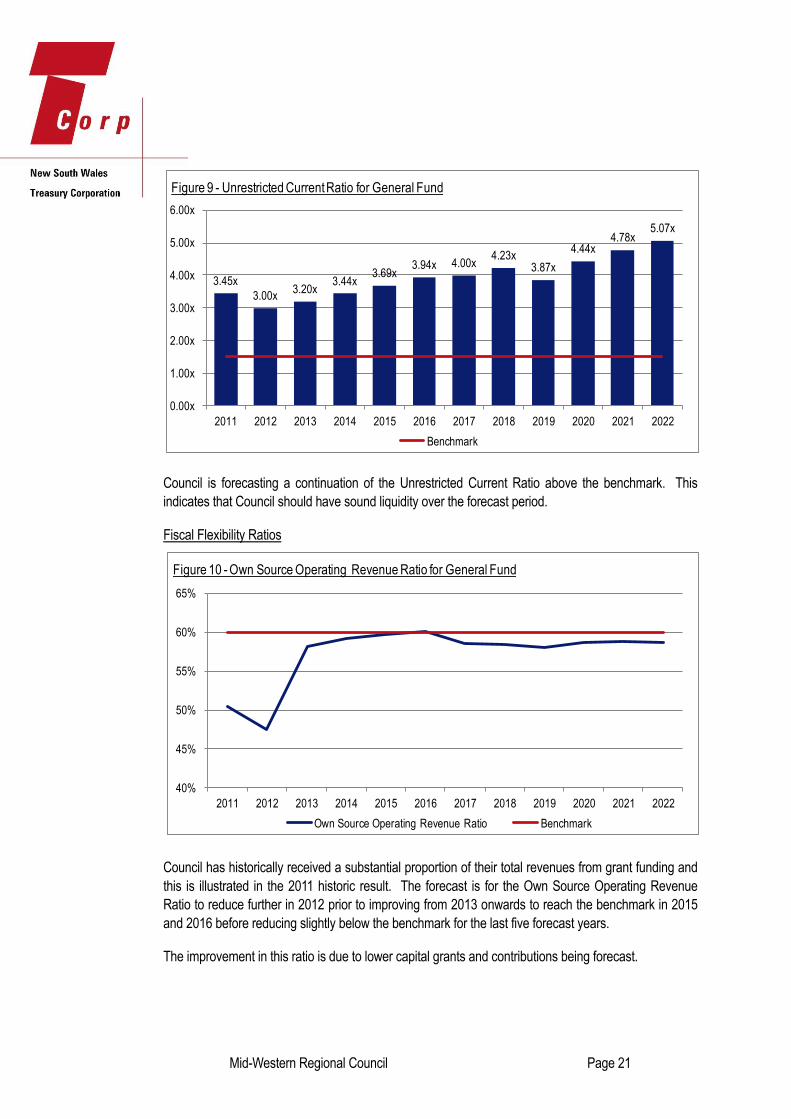
Council is forecasting a continuation of the Unrestricted Current Ratio above the benchmark. This
indicates that Council should have sound liquidity over the forecast period.
Fiscal Flexibility Ratios
Council has historically received a substantial proportion of their total revenues from grant funding and
this is illustrated in the 2011 historic result. The forecast is for the Own Source Operating Revenue
Ratio to reduce further in 2012 prior to improving from 2013 onwards to reach the benchmark in 2015
and 2016 before reducing slightly below the benchmark for the last five forecast years.
The improvement in this ratio is due to lower capital grants and contributions being forecast.
3.45x
3.00x3.20x
3.44x3.69x
3.94x 4.00x4.23x
3.87x
4.44x4.78x
5.07x
0.00x
1.00x
2.00x
3.00x
4.00x
5.00x
6.00x
2011 2012 2013 2014 2015 2016 2017 2018 2019 2020 2021 2022
Figure 9 - Unrestricted Current Ratio for General Fund
Benchmark
40%
45%
50%
55%
60%
65%
2011 2012 2013 2014 2015 2016 2017 2018 2019 2020 2021 2022
Figure 10 - Own Source Operating Revenue Ratio for General Fund
Own Source Operating Revenue Ratio Benchmark

Mid-Western Regional Council Page 22
Council is forecasting a DSCR above the benchmark for each year of the forecast, with the lower
results from 2013 onwards due to the utilisation of $3.3m borrowings in 2012, including $1.4m of the
LIRS borrowings, and the remaining $3.1m in 2013. The DSCR reduces in 2020 due to a one-off
increase in the debt repayment in that year.
The Interest Cover Ratio, similarly to the DSCR, shows the Council has sufficient capacity to service
scheduled debt commitments, including the LIRS loan. There is capacity to service further debt
interest costs before the Council’s ratio decreases to the 4.00x benchmark.
16.46x
19.15x
11.95x10.89x 11.01x 11.36x
12.51x 12.72x 13.12x
8.17x
16.17x
19.86x
0.00x
5.00x
10.00x
15.00x
20.00x
25.00x
2011 2012 2013 2014 2015 2016 2017 2018 2019 2020 2021 2022
Figure 11 - DSCR for General Fund
Benchmark
69.35x
31.49x
19.35x 17.43x 18.41x 19.96x23.27x 25.08x
27.87x 29.16x
36.04x40.37x
0.00x
10.00x
20.00x
30.00x
40.00x
50.00x
60.00x
70.00x
2011 2012 2013 2014 2015 2016 2017 2018 2019 2020 2021 2022
Figure 12 - Interest Cover Ratio for General Fund
Benchmark

Mid-Western Regional Council Page 23
4.3: Capital Expenditure
Council has forecast that the Capital Expenditure Ratio will reduce below the benchmark in 2013 and
remain beneath for the remaining 10 years. The projected shortfall against the benchmark equates to
$26.5m over the 10 year period from 2013 onwards.
Council has forecast the purchase of IPP&E to halve in 2013 to $13.5m when compared to 2012 and
remain below $13.0m for the nine following years.
As stated within the Cash Expense Ratio, Council is expecting cash and cash equivalents to increase
over the forecast period and these funds may be able to be utilised to reduce the shortfall in capital
expenditure.
0.00x
0.50x
1.00x
1.50x
2.00x
2.50x
2011 2012 2013 2014 2015 2016 2017 2018 2019 2020 2021 2022
Figure 13 - Capital Expenditure Ratio for General Fund
Capital Expenditure Ratio Benchmark

Mid-Western Regional Council Page 24
4.4: Financial Model Assumption Review
Councils have used their own assumptions in developing their forecasts.
In order to evaluate the validity of the Council’s forecast model, TCorp has compared the model
assumptions versus TCorp’s benchmarks for annual increases in the various revenue and expenditure
items. Any material differences from these benchmarks should be explained through the LTFP.
TCorp’s benchmarks:
Rates and annual charges: TCorp notes that the LGCI increased by 3.4% in the year to
September 2011, and in December 2011, IPART announced that the rate peg to apply in the
2012/13 financial year will be 3.6%. Beyond 2013 TCorp has assessed a general benchmark
for rates and annual charges to increase by mid-range LGCI annual increases of 3.0%
Interest and investment revenue: annual return of 5.0%
All other revenue items: the estimated annual CPI increase of 2.5%
Employee costs: 3.5% (estimated CPI+1%)
All other expenses: the estimated annual CPI increase of 2.5%
Key Observations and Risks
Council’s forecast assumes current service levels are maintained across the 10 year period.
Rates and annual charges are forecast to increase by 2.8% p.a. Council do not plan to apply
for an SRV after community consultation confirmed that they were opposed to an increase to
improve service delivery.
User fees and charges are forecast to increase at levels below CPI. This equates to annual
increases of between 0.7% and 1.7% between 2014 and 2022. While this is below our 2.5%
benchmark, Council have seen a reduction over the last three years therefore this cautious
assumption is deemed reasonable.
Council believe there is a high degree of certainty in relation to the majority of their operating
grants and contributions. The general purpose financial assistance grants and RMS regional
road funding grants make up approximately two thirds of these totals and these are the two
grants that Council are most certain of.
Employee costs are forecast to increase at 3.2% p.a. for the majority of the 10 year period.
There is however a 14.1% increase in 2012 due to the known items noted in section 4.1.
There is also a 7.3% increase in 2013 as Council plans to add further staff while long service
leave costs are expected to grow as the workforce ages. Council has confirmed that there
were 289 FTE staff at 30 June 2012 with additional drainage staff employed for increased
roadside drainage maintenance and this is expected to continue to increase in future years.
Materials and contracts to increase 3.0% p.a. however to reduce by over 50% in the first four
years due to the known items noted in section 4.1.
Interest and investment revenue increases within 1% of the 5.0% benchmark until 2017 when
it increases 96% to $1.4m and remains for the following five years. This large increase is
because from 2017 onwards the forecast calculates the interest and investment revenue as a
percentage of cash and cash equivalents, and investments whereas the four previous year
figures are adopted from the operational plan/delivery program. The amounts received from
2017 equate to between 4.7% and 5.7% of the total cash and cash equivalents, and

Mid-Western Regional Council Page 25
investments therefore these increased figures are actually within a 1.0% variance from the
TCorp benchmark.
Depreciation is forecast to remain static across the 10 year period at approximately $12.8m
compared to the 2011 historic amount of $12.3m for the General Fund. At present Council
believe this calculation to be accurate but as stated in section 3.7 Council recognise that
further work in asset management is required that may impact the depreciation figure in the
future.
A forecast gain on the disposal of assets is projected in each year of between $0.1m and
$0.9m. These gains relate to specific land sales that are planned over the period. In 2013
Council has three land development projects with forecast sales.
In general the underlying assumptions within the LTFP are consistent with TCorp
assumptions, with no category forecast to increase by over 4.0% p.a. apart from in the years
where the specific amounts are known

Mid-Western Regional Council Page 26
4.5: Borrowing Capacity
When analysing the financial capacity of the Council we believe Council will be able to incorporate
additional loan funding in addition to the LIRS loan facilities. Some comments and observations are:
Based on a benchmark of DSCR>2x, $26.5m could be borrowed in addition to the $4.5m
borrowings proposed under LIRS within the General Fund in 2011/12 and 2012/13
This scenario has been calculated by basing borrowing capacity on a 10 year amortising loan,
at a rate of 8.5%
This amount is calculated on the assumption that Council continues to receive the operating
grants and contributions as historically awarded. As Council cannot completely guarantee this
revenue stream TCorp believes it would be more prudent to recommend a lower amount of
$13.3m, representing half of this $26.5m) that could be utilised to assist funding the gap
between scheduled capital expenditure and depreciation.
16.46x
19.15x
2.01x 2.13x 2.15x 2.22x 2.45x 2.48x 2.55x 2.23x 2.55x 2.67x
0.00x
5.00x
10.00x
15.00x
20.00x
25.00x
2011 2012 2013 2014 2015 2016 2017 2018 2019 2020 2021 2022
Figure 14 - DSCR for General Fund with additional $26.5m
Benchmark
Mid-Western Regional Council Page 27
Section 5 Benchmarking and Comparisons with Other Councils
As discussed in section 2 of this report, each council’s performance has been assessed against ten key
benchmark ratios. The benchmarking assessment has been conducted on a consolidated basis (that is,
for councils that operate more than one fund, the results of all funds are included). This section of the
report compares the Council’s performance with its peers in the same DLG Group. The Council is in
DLG Group 4. There are 32 councils in this group and at the time of preparing this report, we have data
for 19 of these councils.
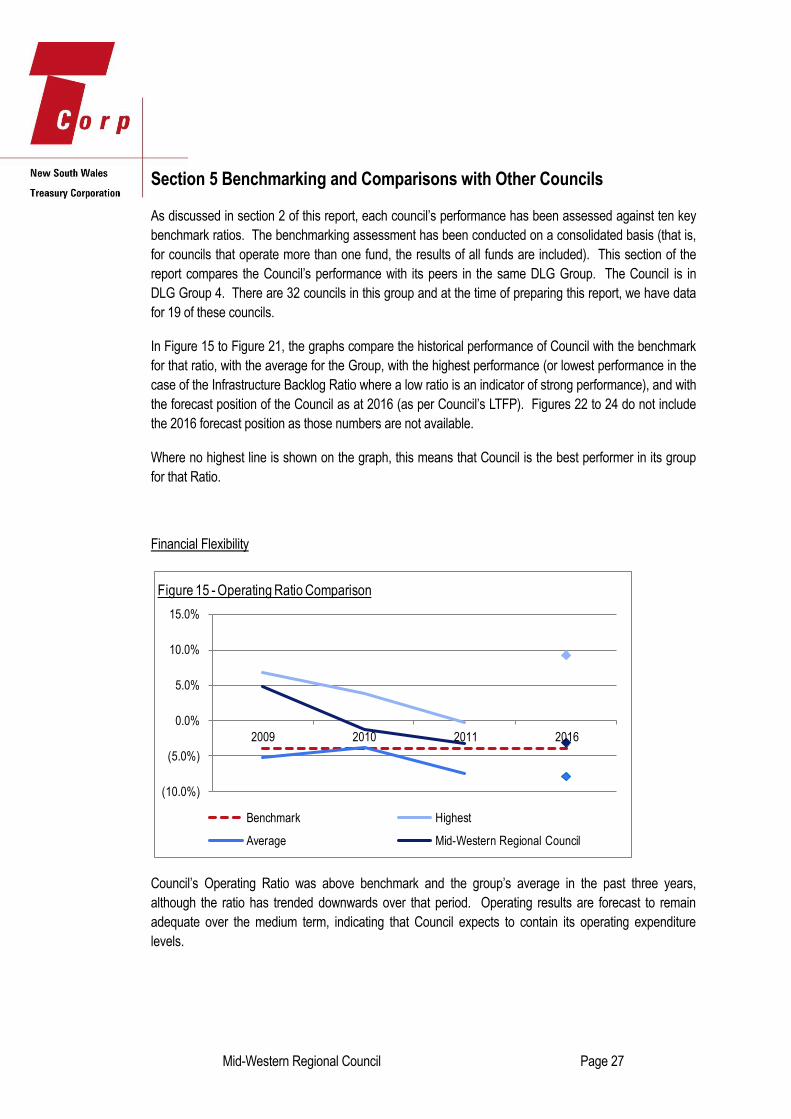
In Figure 15 to Figure 21, the graphs compare the historical performance of Council with the benchmark
for that ratio, with the average for the Group, with the highest performance (or lowest performance in the
case of the Infrastructure Backlog Ratio where a low ratio is an indicator of strong performance), and with
the forecast position of the Council as at 2016 (as per Council’s LTFP). Figures 22 to 24 do not include
the 2016 forecast position as those numbers are not available.
Where no highest line is shown on the graph, this means that Council is the best performer in its group
for that Ratio.
Financial Flexibility
Council’s Operating Ratio was above benchmark and the group’s average in the past three years,
although the ratio has trended downwards over that period. Operating results are forecast to remain
adequate over the medium term, indicating that Council expects to contain its operating expenditure
levels.
(10.0%)
(5.0%)
0.0%
5.0%
10.0%
15.0%
2009 2010 2011 2016
Figure 15 - Operating Ratio Comparison
Benchmark Highest
Average Mid-Western Regional Council

Mid-Western Regional Council Page 28
Council’s Own Source Operating Revenue Ratio was below benchmark and the group’s average in the
past three years, indicating that Council was heavily reliant on external funding sources. The proportion
of own sourced revenue is forecast to improve over the medium term to above benchmark due to lower
forecast capital grants and contributions.
50.0%
55.0%
60.0%
65.0%
70.0%
75.0%
80.0%
85.0%
2009 2010 2011 2016
Figure 16 - Own Source Operating Revenue Ratio Comparison
Benchmark Highest
Average Mid-Western Regional Council
Mid-Western Regional Council Page 29
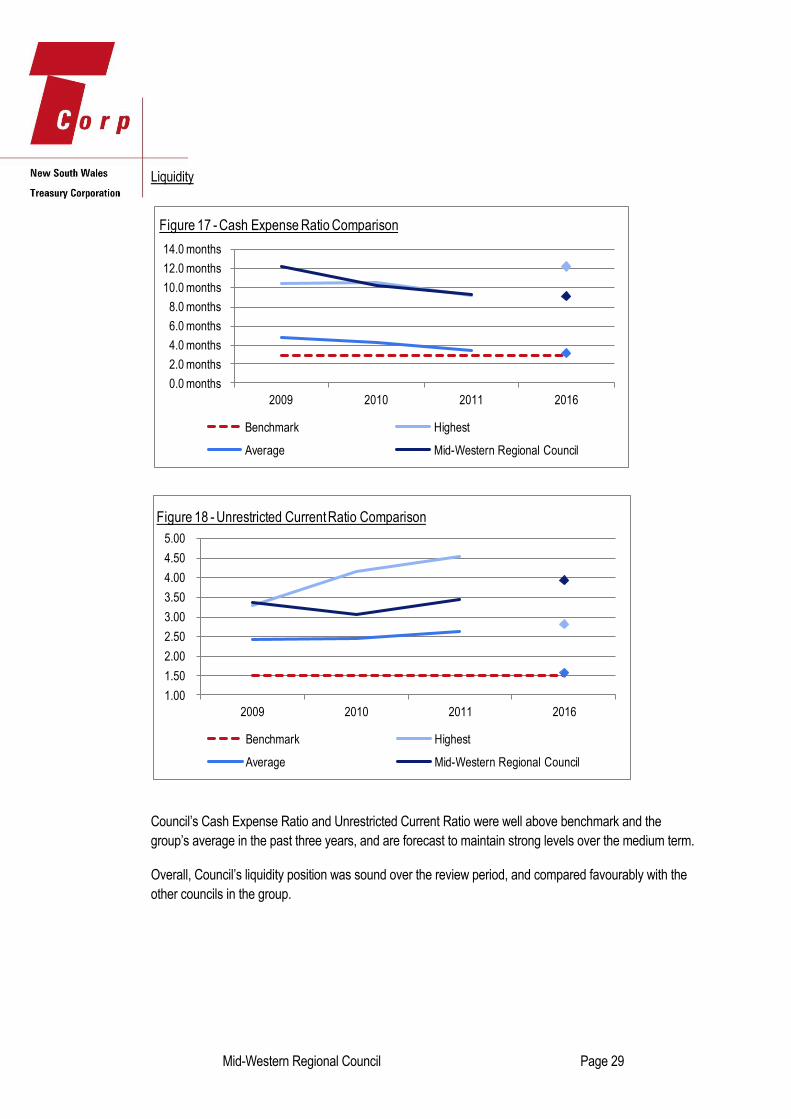
Liquidity
Council’s Cash Expense Ratio and Unrestricted Current Ratio were well above benchmark and the
group’s average in the past three years, and are forecast to maintain strong levels over the medium term.
Overall, Council’s liquidity position was sound over the review period, and compared favourably with the
other councils in the group.
0.0 months
2.0 months
4.0 months
6.0 months
8.0 months
10.0 months
12.0 months
14.0 months
2009 2010 2011 2016
Figure 17 - Cash Expense Ratio Comparison
Benchmark Highest
Average Mid-Western Regional Council
1.00
1.50
2.00
2.50
3.00
3.50
4.00
4.50
5.00
2009 2010 2011 2016
Figure 18 - Unrestricted Current Ratio Comparison
Benchmark Highest
Average Mid-Western Regional Council

Mid-Western Regional Council Page 30
Debt Servicing
Over the review period, Council’s DSCR was well above benchmark and the group’s average. Whilst this
ratio is forecast to fall over the medium term, it will remain at sound levels.
Council’s Interest Cover Ratio was the highest out of its peer group of councils. Like DSCR, this position
is forecast to decline in future years, but remain sound.
Overall, Council’s debt servicing capacity has been very strong and is forecast to remain above
benchmark over the medium term.
-
5.00
10.00
15.00
20.00
2009 2010 2011 2016
Figure 19 - Debt Service Cover Ratio Comparison
Benchmark Highest
Average Mid-Western Regional Council
-
5.00
10.00
15.00
20.00
25.00
30.00
2009 2010 2011 2016
Figure 20 - Interest Cover Ratio Comparison
Benchmark Highest
Average Mid-Western Regional Council

Mid-Western Regional Council Page 31
Asset Renewal and Capital Works
-
0.50
1.00
1.50
2.00
2.50
3.00
2009 2010 2011 2016
Figure 21 - Capital Expenditure Ratio Comparison
Benchmark Highest
Average Mid-Western Regional Council
-
0.20
0.40
0.60
0.80
1.00
1.20
2009 2010 2011
Figure 22 - Asset Maintenance Ratio Comparison
Benchmark Highest
Average Mid-Western Regional Council

Mid-Western Regional Council Page 32
Council’s Infrastructure Backlog Ratio was well above benchmark and the group’s average in the past
three years. While Council’s Asset Maintenance Ratio and Building and Infrastructure Asset Renewal
Ratio generally outperformed the group’s average over the review period, Council remained below
benchmark. This indicates that Council has not been able to invest sufficient funds to address the
infrastructure backlog.
Council’s Capital Expenditure Ratio was above benchmark and the group’s average in the past three
years, and is forecast to remain high in future years.
Overall, Council appears to be prioritising capital works over asset maintenance and renewal, making it
difficult to reduce the backlog.
-
0.05
0.10
0.15
0.20
0.25
0.30
0.35
0.40
0.45
2009 2010 2011
Figure 23- Infrastructure Backlog Ratio Comparison
Benchmark Lowest
Average Mid-Western Regional Council
-
0.50
1.00
1.50
2.00
2.50
3.00
3.50
2009 2010 2011
Figure 24 - Building and Infrastructure Asset Renewal Ratio
Benchmark Highest
Average Mid-Western Regional Council
Mid-Western Regional Council Page 33
Section 6 Conclusion and Recommendations
Based on our review of both the historic financial information and the 10 year financial forecast within
Council’s long term financial plan we consider Council to be in a satisfactory financial position.
Council have a limited ability to increase their own source operating revenues and these have remained
at approximately 55% of Council’s consolidated total revenues over the three year historical period.
Council therefore rely upon successfully receiving grants and contributions to enhance their revenues to
meet their operating expenses and assist the completion of capital programs.
Council’s combined operating and capital grants and contributions have been approximately $20m in
each of the three years, highlighting the ability of Council to consistently apply for and receive these
sources of revenues.
TCorp is therefore recommending that Council are in an adequate financial position to utilise the
additional $4.5m borrowings in relation to the LIRS application.
We base our recommendation on the following key points:
Council’s underlying operating performance in 2011 (measured using EBITDA) has shown its
strongest performance across the past three years
Over the last three years and the 10 forecast years, Council has a strong DSCR and Interest
Cover Ratio that are considerably higher than the benchmarks
Council appears to have sufficient liquidity to manage their short term liabilities during the 10
year forecast period, a continuation of the historic trend
Council has spent sufficient capital expenditure in the last three years to increase the IPP&E
asset base
However we would also recommend that the following points be considered:
We base our recommendation that Council receive the LIRS loan on the assumption that
Council will continue to receive a similar level of grants and contributions over the forecast
period. Council rely upon these revenues, as their own source operating revenues both on a
historic consolidated basis, and a forecast General Fund basis, remain below (or at best equal
to) the 60% benchmark
Council’s Infrastructure Backlog has remained around $100m for the past three years. Council
do not appear to have the capacity to reduce this figure and may need external assistance if this
figure is to decrease over the short or medium term.
Council’s operating expenses have increased at a faster rate than revenues in the last three
years with the increase in depreciation the main contributor
Within Council’s forecast there are projected consecutive gains from the disposal of assets
relating to land and property development, an area that is not a core operating focus for
Councils which has its own set of risks and variables

Mid-Western Regional Council Page 34
Appendix A Historical Financial Information Tables
Table 1- Income Statement
Income Statement ($'000s) Year ended 30 June % annual change
2011 2010 2009 2011 2010
Revenue
Rates and annual charges 20,331 19,520 18,717 4.2% 4.3%
User charges and fees 9,678 10,783 10,357 (10.2%) 4.1%
Interest and investment revenue 1,722 1,752 2,055 (1.7%) (14.7%)
Grants and contributions for operating purposes 13,470 11,072 12,515 21.7% (11.5%)
Other revenues 1,614 1,884 1,365 (14.3%) 38.0%
Total revenue 46,815 45,011 45,009 4.0% 0.0%
Expenses
Employees 17,076 17,921 16,801 (4.7%) 6.7%
Borrowing costs 528 533 530 (0.9%) 0.6%
Materials and contract expenses 10,268 11,681 11,602 (12.1%) 0.7%
Depreciation and amortisation 15,075 10,058 9,670 49.9% 4.0%
Other expenses 4,644 5,014 4,155 (7.4%) 20.7%
Net loss from the disposal of assets 761 406 33 251.0% 1130.3%
Total expenses 48,352 45,613 42,791 9.1% 6.6%
Operating result (excluding capital grants and contributions) (1,537) (602) 2,218 393.4% (127.1%)
Operating result (including capital grants and contributions) 6,198 8,022 10,084 (40.6%) (20.4%)
Table 2 - Items excluded from Income Statement
Excluded items ($’000s)
2011 2010 2009
Grants and contributions for capital purposes 7,735 8,624 7,866
Impairment – flood damaged infrastructure 769 0 0
Net loss from the disposal of asset – Redbank Dam 644 0 0

Mid-Western Regional Council Page 35
Table 3 - Balance Sheet
Balance Sheet ($’000s) Year Ended 30 June % annual change
2011 2010 2009 2011 2010
Current assets
Cash and equivalents 25,354 30,030 33,259 (15.6%) (9.7%)
Investments 1,000 1,000 2,950 0.0% (66.1%)
Receivables 6,073 4,433 3,189 37.0% 39.0%
Inventories 2,866 1,263 615 126.9% 105.4%
Other 13 0 2 N/A (100.0%)
Non-current assets classified as 'held for sale' 0 1,288 50 (100.0%) 2476.0%
Total current assets 35,306 38,014 40,065 (7.1%) (5.1%)
Non-current assets
Investments 2,331 2,268 2,195 2.8% 3.3%
Inventories 254 1,547 869 (83.6%) 78.0%
Infrastructure, property, plant & equipment 520,964 511,861 335,209 1.8% 52.7%
Intangible assets 438 321 221 36.4% 45.2%
Total non-current assets 523,987 515,997 338,494 1.5% 52.4%
Total assets 559,293 554,011 378,559 1.0% 46.3%
Current liabilities
Payables 5,144 5,168 4,318 (0.5%) 19.7%
Borrowings 550 577 509 (4.7%) 13.4%
Provisions 4,596 4,855 4,715 (5.3%) 3.0%
Total current liabilities 10,290 10,600 9,542 (2.9%) 11.1%
Non-current liabilities
Borrowings 6,732 7,216 6,832 (6.7%) 5.6%
Provisions 1,070 1,053 1,180 1.6% (10.8%)
Total non-current liabilities 7,802 8,269 8,012 (5.6%) 3.2%
Total liabilities 18,092 18,869 17,554 (4.1%) 7.5%
Net assets 541,201 535,142 361,005 1.1% 48.2%

Mid-Western Regional Council Page 36
Table 4-Cashflow
Cashflow Statement ($'000s) Year ended 30 June
2011 2010 2009
Cashflows from operating activities 21,797 16,986 21,425
Cashflows from investing activities (25,962) (20,667) (14,617)
Proceeds from borrowings and advances 0 1,000 0
Repayment of borrowings and advances (511) (548) (483)
Cashflows from financing activities (511) 452 (483)
Net increase/(decrease) in cash and equivalents (4,676) (3,229) 6,325
Cash and equivalents 25,354 30,030 33,259
Mid-Western Regional Council Page 37
Appendix B Glossary
Asset Revaluations
In assessing the financial sustainability of NSW councils, IPART found that not all councils reported
assets at fair value.1 In a circular to all councils in March 20092, DLG required all NSW councils to
revalue their infrastructure assets to recognise the fair value of these assets by the end of the 2009/10
financial year.
Collateralised Debt Obligation (CDO)
CDOs are structured financial securities that banks use to repackage individual loans into a product that
can be sold to investors on the secondary market.
In 2007 concerns were heightened in relation to the decline in the “sub-prime” mortgage market in the
USA and possible exposure of some NSW councils, holding CDOs and other structured investment
products, to losses.
In order to clarify the exposure of NSW councils to any losses, a review was conducted by the DLG with
representatives from the Department of Premier and Cabinet and NSW Treasury.
A revised Ministerial investment Order was released by the DLG on 18 August 2008 in response to the
review, suspending investments in CDOs, with transitional provisions to provide for existing investments.
Division of Local Government (DLG)
DLG is a division of the NSW Department of Premier and Cabinet and is responsible for local
government across NSW. DLG’s organisational purpose is “to strengthen the local government sector”
and its organisational outcome is “successful councils engaging and supporting their communities”.
Operating within several strategic objectives DLG has a policy, legislative, investigative and program
focus in matters ranging from local government finance, infrastructure, governance, performance,
collaboration and community engagement. DLG strives to work collaboratively with the local government
sector and is the key adviser to the NSW Government on local government matters.
Depreciation of Infrastructure Assets
Linked to the asset revaluations process stated above, IPART’s analysis of case study councils found
that this revaluation process resulted in sharp increases in the value of some council’s assets. In some
cases this has led to significantly higher depreciation charges, and will contribute to higher reported
operating deficits.
EBITDA
1IPART “Revenue Framework for Local Government” December 2009 p.83
2 DLG “Recognition of certain assets at fair value” March 2009

Mid-Western Regional Council Page 38
EBITDA is an acronym for “earnings before interest, taxes, depreciation, and amortisation”. It is often
used to measure the cash earnings that can be used to pay interest and repay principal.
Grants and Contributions for Capital Purposes
Councils receive various capital grants and contributions that are nearly always 100% specific in nature.
Due to the fact that they are specifically allocated in respect of capital expenditure they are excluded from
the operational result for a council in TCorp’s analysis of a council’s financial position.
Grants and Contributions for Operating Purposes
General purpose grants are distributed through the NSW Local Government Grants Commission. When
distributing the general component each council receives a minimum amount, which would be the
amount if 30% of all funds were allocated on a per capita basis. When distributing the other 70%, the
Grants Commission attempts to assess the extent of relative disadvantage between councils. The
approach taken considers cost disadvantage in the provision of services on the one hand and an
assessment of revenue raising capacity on the other.
Councils also receive specific operating grants for one-off specific projects that are distributed to be spent
directly on the project that the funding was allocated to.
Independent Commission Against Corruption (ICAC)
ICAC was established by the NSW Government in 1989 in response to growing community concern
about the integrity of public administration in NSW.
The jurisdiction of the ICAC extends to all NSW public sector agencies (except the NSW Police Force)
and employees, including government departments, local councils, members of Parliament, ministers,
the judiciary and the governor. The ICAC's jurisdiction also extends to those performing public official
functions.
Independent Pricing and Regulatory Tribunal (IPART)
IPART has four main functions relating to the 152 local councils in NSW. Each year, IPART determines
the rate peg, or the allowable annual increase in general income for councils. They also review and
determine council applications for increases in general income above the rate peg, known as “Special
Rate Variations”. They approve increases in council minimum rates. They also review council
development contributions plans that propose contribution levels that exceed caps set by the
Government.
Infrastructure Backlog
Infrastructure backlog is defined as the estimated cost to bring building, infrastructure and other
structures to a satisfactory standard, measured at a particular point in time. It is unaudited and stated
within Special Schedule 7 that accompanies the council’s audited annual financial statements.
Integrated Planning and Reporting (IP&R) Framework

Mid-Western Regional Council Page 39
As part of the NSW Government’s commitment to a strong and sustainable local government system, the
Local Government Amendment (Planning and Reporting) Act 2009 was assented on 1 October 2009.
From this legislative reform the IP&R framework was devised to replace the former Management Plan
and Social Plan with an integrated framework. It also includes a new requirement to prepare a long-term
Community Strategic Plan and Resourcing Strategy. The other essential elements of the new framework
are a Long-Term Financial Plan (LTFP), Operational Plan and Delivery Program and an Asset
Management Plan.
Local Government Cost Index (LGCI)
The LGCI is a measure of movements in the unit costs incurred by NSW councils for ordinary council
activities funded from general rate revenue. The LGCI is designed to measure how much the price of a
fixed “basket” of inputs acquired by councils in a given period compares with the price of the same set of
inputs in the base period. The LGCI is measured by IPART.
Net Assets
Net Assets is measured as total assets less total liabilities. The Asset Revaluations over the past years
have resulted in a high level of volatility in many councils’ Net Assets figure. Consequently, in the short
term the value of Net Assets is not necessarily an informative indicator of performance. In the medium to
long term however, this is a key indicator of a council’s capacity to add value to its operations. Over time,
Net Assets should increase at least in line with inflation plus an allowance for increased population and/or
improved or increased services. Declining Net Assets is a key indicator of the council’s assets not being
able to sustain ongoing operations.
Roads and Maritime Services (RMS)
The NSW State Government agency with responsibility for roads and maritime services, formerly the
Roads and Traffic Authority (RTA).
Section 64 Contribution
Development Servicing Plans (DSPs) are made under the provisions of Section 64 of the Local
Government Act 1993 and Sections 305 to 307 of the Water Management Act 2000.
DSPs outline the developer charges applicable to developments for Water, Sewer and Stormwater
within each Local Government Area.
Section 94 Contribution
Section 94 of the Environmental Planning and Assessment Act 1979 allows councils to collect
contributions from the development of land in order to help meet the additional demand for community
and open space facilities generated by that development.
It is a monetary contribution levied on developers at the development application stage to help pay for
additional community facilities and/or infrastructure such as provision of libraries; community facilities;
open space; roads; drainage; and the provision of car parking in commercial areas.

Mid-Western Regional Council Page 40
The contribution is determined based on a formula which should be contained in each council's
Section 94 Contribution Plan, which also identifies the basis for levying the contributions and the works
to be undertaken with the funds raised.
Special Rate Variation (SRV)
A SRV allows councils to increase general income above the rate peg, under the provisions of the Local
Government Act 1993. There are two types of special rate variations that a council may apply for:
a single year variation (section 508(2)) or
a multi-year variation for between two to seven years (section 508A).
The applications are reviewed and approved by IPART.

Mid-Western Regional Council Page 41
Ratio Explanations
Asset Maintenance Ratio
Benchmark = Greater than 1.0x
Ratio = actual asset maintenance / required asset maintenance
This ratio compares actual versus required annual asset maintenance, as detailed in Special Schedule 7.
A ratio of above 1.0x indicates that the council is investing enough funds within the year to stop the
infrastructure backlog from growing.
Building and Infrastructure Renewals Ratio
Benchmark = Greater than 1.0x
Ratio = Asset renewals / depreciation of building and infrastructure assets
This ratio compares the proportion spent on infrastructure asset renewals and the asset’s deterioration
measured by its accounting depreciation. Asset renewal represents the replacement or refurbishment of
existing assets to an equivalent capacity or performance as opposed to the acquisition of new assets or
the refurbishment of old assets that increase capacity or performance.
Cash Expense Cover Ratio
Benchmark = Greater than 3.0 months
Ratio = current year’s cash and cash equivalents / total expenses – depreciation – interest costs
This liquidity ratio indicates the number of months a council can continue paying for its immediate
expenses without additional cash inflow.
Capital Expenditure Ratio
Benchmark = Greater than 1.1x
Ratio = annual capital expenditure / annual depreciation
This indicates the extent to which a council is forecasting to expand its asset base with capital
expenditure spent on both new assets, and replacement and renewal of existing assets.
Debt Service Cover Ratio (DSCR)
Benchmark = Greater than 2.0x
Ratio = operating results before interest and depreciation (EBITDA) / principal repayments (from the
statement of cash flows) + borrowing interest costs (from the income statement)
This ratio measures the availability of cash to service debt including interest, principal and lease
payments
Mid-Western Regional Council Page 42
Infrastructure Backlog Ratio
Benchmark = Less than 0.02x
Ratio = estimated cost to bring assets to a satisfactory condition (from Special Schedule 7) / total
infrastructure assets (from Special Schedule 7)
This ratio shows what proportion the backlog is against total value of a council’s infrastructure.
Interest Cover Ratio
Benchmark = Greater than 4.0x
Ratio = EBITDA / interest expense (from the income statement)
This ratio indicates the extent to which a council can service its interest bearing debt and take on
additional borrowings. It measures the burden of the current interest expense upon a council’s operating
cash.
Operating Ratio
Benchmark = Better than negative 4%
Ratio = (operating revenue excluding capital grants and contributions – operating expenses) / operating
revenue excluding capital grants and contributions
This ratio measures a council’s ability to contain operating expenditure within operating revenue.
Own Source Operating Revenue Ratio
Benchmark = Greater than 60%
Ratio = rates, utilities and charges / total operating revenue (inclusive of capital grants and contributions)
This ratio measures the level of a council’s fiscal flexibility. It is the degree of reliance on external funding
sources such as operating grants and contributions. A council’s financial flexibility improves the higher the
level of its own source revenue.
Unrestricted Current Ratio
Benchmark = 1.5x (taken from the IPART December 2009 Revenue Framework for Local Government
report)
Ratio = Current assets less all external restrictions / current liabilities less specific purpose liabilities
Restrictions placed on various funding sources (e.g. Section 94 developer contributions, RMS
contributions) complicate the traditional current ratio because cash allocated to specific projects are
restricted and cannot be used to meet a council’s other operating and borrowing costs. The Unrestricted
Current Ratio is specific to local government and is designed to represent a council’s ability to meet debt
payments as they fall due.