miki takagi - university of illinois urbana-champaign
TRANSCRIPT

ELECTROHYDRODYNAMIC JET PRINTING: ADVANCEMENTS IN MANUFACTURING
APPLICATIONS
BY
MIKI F. TAKAGI
THESIS
Submitted in partial fulfillment of the requirements for the degree of Master of Science in Mechanical Engineering
in the Graduate College of the University of Illinois at Urbana-Champaign, 2013
Urbana, Illinois Adviser Professor Placid M. Ferreira

ii
ABSTRACT
Electrohydrodynamic jet printing offers advantages such as high resolution over more traditional
manufacturing printing techniques, but lacks in the high throughput that is demanded by
industry. At the University of Illinois at Urbana-Champaign, UIUC, a high resolution technique
for printing was developed and also a desktop system designed and built. UIUC has been
researching the advancements of E-jet in manufacturing applications for many years. This thesis
includes work which continues to push the abilities of the current E-jet system to be more
appealing for manufacturing along with developing a new printing technique utilizing the
fundamental physics of E-jet printing.
A multi-nozzle array (MNA) print head is proposed which has the capability of addressing each
nozzle individually or simultaneously print with the whole array. For proof of concept, a four
nozzle print head is discussed and has the potential to be increased for batch pattern/image
printing. By powering the nozzles with a pulse width DC voltage, the printed image quality can
be controlled depending on the desired application and is also studied. The standard deviation of
the achieved droplet size across the multi-nozzle print head is approximately 0.5-0.6µm. A
simple cost analysis was performed to determine feasibility of a one-time use nozzle print head.
Finally, preliminary efforts of printing from an ink film by means of a generated rather than
applied voltage is developed, tested, and discussed in this thesis. This work eliminates the need
for a physical nozzle that is used in nearly all current E-jet printing setups. By implanting
pyroelectricity to E-jet, droplet diameters as small as 300µm were printed. Although these
droplets are large compared to current E-jet printing, the work discussed is a proof of concept
and by further understanding the physics of pyroelectricity, it is hoped that a comparable
resolution of droplet size can be achieved.

iii
ACKNOWLEDGMENTS
I would like to thank my advisor, Professor Placid Ferreria, for allowing me to be a part of his
research group and working on E-jet. His guidance and novel ideas for E-jetting applications
were always exciting. His demand for quality results pushed me to work hard and efficiently
which resulted in successfully completing my Master’s degree.
I would also like to thank the other members of Professor Ferreira’s research group. With the
wide variety of projects our group does research in, there was rarely a question I had that would
go unanswered. They always had encouraging words to help me stay focused and find joy in my
research. I would specifically like to thank Ala’a Al-Okaily for setting aside large amounts of
time to assist me with my experiments, he always made time to run the laser for my experiments
and providing excellent discussions and ideas on the results to my experiments. I would also like
to thank the other members of my group that made research and our office an enjoyable
environment to work in; Numair Ahmed, Bruno Azeredo, Jorge Correra, Kyle Jacobs, and
Bonjin Koo.
Keng Hsu must also be thanked for his insight on rapid prototyping and part production and
Michael Philpott for providing the aPriori cost analysis on my multi-nozzle array research. I
would also like to express my deepest gratitude to the late Mark Shannon. He gave me the
opportunity to be involved with his research as an undergraduate which fueled my desire to
continue my studies and obtain my Master’s degree.
Lastly I would like to thank my family and friends for their constant encouragement and words
of motivation. Words cannot describe how grateful I am to have such a large support group to
help me through the struggles of graduate school and to celebrate the accomplishments I have
achieved.

iv
TABLE OF CONTENTS
List of Figures ................................................................................................................................ vi
List of Tables ................................................................................................................................. ix
Chapter 1: Introduction ................................................................................................................... 1
1.1 Background of E-jet .............................................................................................................. 2
1.2 Current Technology ............................................................................................................... 4
1.3 Current E-jet Limitations ...................................................................................................... 5
Chapter 2: Multi-nozzle array printhead ......................................................................................... 7
2.1 Introduction ........................................................................................................................... 7
2.2 Design of holders and mounts ............................................................................................... 8
2.3 Nozzle Alignment ............................................................................................................... 10
2.4 Experimental Setup ............................................................................................................. 11
2.5 Printing Experiments ........................................................................................................... 13
2.6 Results and Analysis of Simultaneous MNA Printing ........................................................ 16
2.6.1 PWM Parametric Study ............................................................................................... 16
2.6.2 Conclusion of MNA PWM printing ............................................................................ 19
2.7 Cost Analysis of V-groove MNA ........................................................................................ 22
Chapter 3: Nozzle-less Printing .................................................................................................... 24
3.1 Introduction ......................................................................................................................... 24
3.2 Pyroelectricity ..................................................................................................................... 25
3.2.1 Background and History .............................................................................................. 25
3.2.2 Physics of Pyroelectricity ............................................................................................ 26
3.2.3 Materials and Applications .......................................................................................... 28
3.3 Experimental Setup ............................................................................................................. 29
3.4 Experiments with Heat source ............................................................................................. 31
3.4.1 Soldering Iron .............................................................................................................. 31
3.4.2 Resistive Heater Coil ................................................................................................... 33
3.4.3 Near Infrared (NIR) Laser Diode ................................................................................. 36
3.5 Experiments with Infrared Absorber ................................................................................... 36
3.5.1 NIR Absorbing Dye with PDMS ................................................................................. 37

v
3.5.2 NIR Dye ....................................................................................................................... 45
3.5.3 Silicon Micro Dies ....................................................................................................... 46
3.6 Experiments with Pyroelectric Material .............................................................................. 51
3.6.1 Lithium Niobate (LiNbO3 or LN) Crystal ................................................................... 51
3.6.2 Lead Zirconium Titanate (PZT) Ceramic .................................................................... 52
3.6.3 Lithium Tantalate (LiTaO3 or LT) Crystal .................................................................. 52
3.7 Studying Effects of Printing Setup ...................................................................................... 54
3.7.1 Air Gap......................................................................................................................... 54
3.7.2 Stack Orientation ......................................................................................................... 55
3.7.3 Ground Electrode Location .......................................................................................... 57
Chapter 4: Conclusion................................................................................................................... 60
4.1. Multi-Nozzle Array E-jet Printing ..................................................................................... 60
4.1.1 Conclusion ................................................................................................................... 60
4.1.2 Future Work ................................................................................................................. 61
4.2 Nozzle-less Printing Using Pyroelectricity ......................................................................... 62
4.2.1 Conclusion ................................................................................................................... 62
4.2.2 Future Work ................................................................................................................. 63
References ..................................................................................................................................... 65

vi
LIST OF FIGURES
Figure 1. Schematic of UIUC E-jet printer. ................................................................................... 3
Figure 2. Image of nozzle, nozzle reflection, and a printed droplet from 5-axis E-jet setup. ........ 4
Figure 3. CAD drawings of the Teflon nozzle holder (left) and nozzle alignment setup with
Teflon holders (right). ......................................................................................................................9
Figure 4. CAD drawings of the v-groove nozzle holder (left) and alignment setup (right). ....... 10
Figure 5. Final v-groove nozzle print head with four secured nozzles. ....................................... 11
Figure 6. RP E-jet mount and rotational stage attached to the 5-axis E-jet printer. .................... 12
Figure 7. Composite image of the nozzles and nozzle reflections for alignment purposes
for a four nozzle MNA. ..................................................................................................................13
Figure 8. UIUC logo used for demonstrating simultaneous printing with the MNA. ................. 14
Figure 9. Initial MNA simultaneous printing of UIUC logo with T1 parameters. ...................... 16
Figure 10. Enlarged area of printed pattern from the same area for each nozzle of the MNA
print head for five experiments. .....................................................................................................17
Figure 11. Final MNA simultaneous printing with high density of droplets with PWM T5
parameters. .....................................................................................................................................19
Figure 12. Enlarged T1 (top) and T5 (bottom) printed image of common printing defects. ....... 20
Figure 13. Printed pattern of two of the four images to display the spacing of the four MNA. .. 21
Figure 14. Graphical representation of relationship between thermal, mechanical, and
electrical properties with the primary and secondary pyroelectric coefficients highlighted
[23]. ................................................................................................................................................26
Figure 15. Ink film pyroelectric E-jet printing schematic (top) and actual image of setup
(bottom)..........................................................................................................................................30
Figure 16. Composite of printed droplets from experiments with a soldering iron heat
source and LN crystal. ...................................................................................................................32
Figure 17. Resistive heater coil printing setup. ............................................................................ 33
Figure 18. Image of liquid bridge formed with SS resistive heater coil instead of a printed
droplet ............................................................................................................................................34
Figure 19. Image of ink film deformation profile while printing and a printed droplet is
seen in the ink reflection. ...............................................................................................................35
vii
Figure 20. Droplets printed with a resistive heater coil heat source and LN crystal. .................. 36
Figure 21. Schematic of NIR dye mixed with PDMS as NIR laser absorbing material for
pyroelectric E-jet printing. .............................................................................................................37
Figure 22. Optical images of printed droplets from Table 5 using a pulse laser heat source
and LN crystal ................................................................................................................................39
Figure 23. mPDMS pulsed laser printing experiments with no glass on the mPDMS and Cu
tape under entire ink resulting in multiple printed droplets from Table 6. ....................................40
Figure 24. Printed “I” pattern using mPDMS and NIR laser heat source. ................................... 41
Figure 25. Printed lines attempts with continuous NIR laser and mPDMS. ................................ 43
Figure 26. Composite of printed droplets from experiments with varying PDMS to NIR
dye ratios A (top) and C (bottom). .................................................................................................44
Figure 27. mPDMS damage (left) and misaligned printed droplet to mPDMS damage
(right) due to laser printing. ...........................................................................................................45
Figure 28. NIR dye directly on crystal (far left), printed droplets (middle left & right),
damaged crystal after printing due to overheating (far right). .......................................................46
Figure 29. Schematic of Si µ-square NIR laser absorbing pyroelectric E-jet printing. ............... 47
Figure 30. Laser focus on a 200x200x10µm Si µ-square (left) and three Si µ-squares with
successfully printed droplets (right)...............................................................................................48
Figure 31. Schematic of altered Si µ-square location for NIR laser absorbing pyroelectric
E-jet printing. .................................................................................................................................49
Figure 32. Three different Si µ-squares with printed droplets using the flipped crystal/Si µ-
square setup. ...................................................................................................................................49
Figure 33. 100x100x10µm Si µ-square with flipped crystal/Si µ-square setup. ......................... 50
Figure 34. Three different Si µ-squares with printed droplets at 20A using the flipped
crystal/Si µ-squares setup. .............................................................................................................50
Figure 35. Three different Si µ-squares with successfully printed droplets using a LT crystal. . 53
Figure 36. Two Si µ-squares with successfully printed droplets using the flipped LT/Si µ-
square setup. ...................................................................................................................................54
Figure 37. Alternative setups for pyroelectric E-jet printing from an ink film directly to the
LT crystal (left) and printing away from the LT crystal to glass (right). .......................................56
Figure 38. Printed droplet from Setup A and NIR laser with Si µ-square absorber. ................... 56

viii
Figure 39. Setup B print attempt with an image captured immediately after laser is off
(left), after approximately 11s (middle) and when there is no more observed changes
(right). ............................................................................................................................................57
Figure 40. Alternative schematics for ground electrode placement in pyroelectric E-jet
printing from an ink film................................................................................................................58
Figure 41. Two printed droplets using Setup A from Figure 40. ................................................. 59

ix
LIST OF TABLES
Table 1. Initial jetting voltages and gaps for a single printing experiment (the gaps are
approximated through image processing and may not be accurate to actual distance) .................15
Table 2. Varying PWM parameters for each printed test run ...................................................... 15
Table 3. Average size and standard deviation of counted printed droplets from enlarged
area in Figure 10 ............................................................................................................................18
Table 4. Average size droplets printed with a soldering iron as the heat source and LN crystal 32
Table 5. Parameters for pulsed laser pyroelectric E-jet printing and droplet diameters of
successful prints .............................................................................................................................38
Table 6. mPDMS printing experiments with the pulsed laser...................................................... 40
Table 7. Printed I with mPDMS and NIR laser droplet analysis ................................................. 42
Table 8. Different mPDMS ratios and thickness, labeled A - D .................................................. 43

1
CHAPTER 1: INTRODUCTION
Printing technologies such as thermo or piezo inkjets, Xerography, and 3D printing have made
advancements in manufacturing processes by increasing resolution and throughput. With 3D
printing tools such as selective laser sintering (SLS), fused deposition modeling (FDM), and
stereolithography (SLA), direct writing is achievable at low costs and at relatively good
resolutions (typically 20-50µm). However, there is a demand for direct write technologies that
can achieve even higher resolution. These demands can be met by using electrohydrodynamic
jet (E-jet or EHD) printing techniques which can achieve resolutions unattainable with the more
traditional printing capabilities. E-jet not only provides advantages in high resolution, but also
has the capability of printing a variety of materials including nanoparticles, polymers, and bio-
material suspensions onto a varied set of conducting and non-conducting substrates including
bare silicon, polymers, oxides and metal films [1-6].
To enhance the appeal of E-jet for manufacturing, a multi-nozzle array holder is designed and
tested for increasing the throughput of printing a single image. There are benefits to developing
a multi-nozzle array (MNA) for any printing tool. One benefit is to have each nozzle in a print
head print a separate but identical image and therefore increase the throughput of printing
multiples of the same image. Instead of decreasing the time to print a single image, the time to
print an array of images will be decreased. Another advantage to a multi-nozzle array is if the
proximity of the nozzles are close, each nozzle could print different subsections of one image
simultaneously therefore aiding in decreasing the time to print a large single image. However,
there are many issues associated with trying to have nozzles in close proximity of each other
though. The main obstacle is the electrical interference or cross talk of the nozzles while
printing, which has been studied by many [7, 8]. When the nozzles are placed in too close
proximity, the electric fields generated will affect the neighboring nozzles printing, and the
droplets will no longer be printed directly below the nozzle orifice, but will be displaced
depending on how much the electric fields interact. Simultaneous printing multiples of the same
image is discussed in Chapter 2.

2
Further improvements to E-jet printing can be achieved by removing the need for physical
nozzles to print the ink material. Increasing the number of printing nozzles by fabricating or
assembling a high density array possesses many challenges and requires significant time and
capital investment to develop. The ability to print from an ink film eliminates the issues
associated with nozzles such as alignment, electrical crosstalk, or requirements for a high voltage
power supply or amplifier, and offers the advantages of printing viscous inks, reducing material
costs, and making E-jet more appealing for manufacturing applications. Successful printing
from an ink film using pyroelectricity is discussed in Chapter 3 where the goal is to simply
modify the printing setup to obtain a desired size droplet. Using the developed techniques of
pyroelectric E-jet printing from an ink film allows for multiple droplets varying in size to be
patterned on a substrate surface without having to change nozzles sizes.
1.1 Background of E-jet
The concept of electrohydrodynamic jet (E-jet) printing has been documented in literature as
early as 1986 by Hayati et al. [9] but didn’t become a popular area of research until about 5 years
ago. Since then, it has been a very active area of research with an increasing understanding of
the physics behind e-jetting along with advancements in printing resolution, printable materials
(ink and substrate), scaling, and so forth to advance E-jet from a research setting to a mass
manufacturing technique.
The driving mechanism for E-jet printing is an electric field generated by a voltage difference
between the conductive nozzle and the substrate. Figure 1 is a simplified schematic of the UIUC
E-jet printing setup. Glass micro pipettes are coated with a gold palladium alloy, Au/Pd, and
connected to a voltage source to act as the print head top electrode. A metallic chuck that
supports the substrate acts as the grounded electrode.

3
Figure 1. Schematic of UIUC E-jet printer.
Inks to be printed are loaded into a syringe and are supplied to the pipette orifice under a small
back pressure. When a positive (negative) voltage is applied to the pipette tip, the fluid at the tip
meniscus is polarized with cations (anions) migrating toward the substrate and the anions
(cations) traveling in the opposite direction. Due to the ion interactions (Coulombic repulsion), a
positive (negative) ion concentrated pendant drop will form [10]. At a low voltage which is
dependent on nozzle diameter and air gap, the pendant droplet has balanced electrostatic stress
and surface tension forces and will not print. As the voltage is increased, the meniscus is
deformed to become conical and can be modeled as a Taylor cone with both a normal and
tangential component to the electric polarization stress due to the electric field [11, 12]. When
the voltage is increased to a “jetting voltage”, the electrostatic shear stress the ions exert on the
meniscus will overcome the surface tension and a droplet is released from the tip of the Taylor
cone and propelled towards the substrate. If the initial jetting voltage is surpassed, the E-jet can
be operated in a continuous spraying mode. The jetting voltage depends on not only the ink
properties, but also the printing substrate material, the distance between the nozzle tip, and the
printing substrate [12]. While printing with a DC voltage, the droplet size can be controlled by
altering the pipette orifice/nozzle diameter, applied voltage, ink, and substrate materials [13].

4
1.2 Current Technology
The current UIUC E-jet system uses a function generator (Agilent 33220A) to generate the data
signal for printing. A camera is set up to provide feedback on successful printing and is also used
to set the air gap, or working distance, by viewing the reflection of the nozzle as shown in Figure
2.
Figure 2. Image of nozzle, nozzle reflection, and a printed droplet from 5-axis E-jet setup.
The E-jet machine is a custom built, five degree of freedom (DOF), computer controlled
substrate positioning system using Aerotech stages and a standard manual z stage for adjusting
the nozzle syringe holder’s distance to the substrate. To reduce the effects of external vibrations,
the entire E-jet system is assembled and operated on an isolation table. Using a LabView
interface created specifically for the UIUC E-jet system, the 5-axis E-jet stage is operated either
manually by moving the stage in the x and y directions or in a computer numerical control
(CNC) mode. When using the CNC mode, a G-code (EIA RS274) program is generated to
control the direction of stage movement in the X and Y direction, stage speed/feed rate, turning

5
on and off the amplifier and the dwell duration at a desired coordinate while the amplifier is on
or off. A DC signal with high impedance is supplied to determine the initial jetting voltage of a
specific nozzle. The initial jetting voltage is recorded and then a pulse width modulated (PWM)
signal is used to print-on-demand a line of single droplets [12]. The frequency/period, pulse
width/duty cycle, high/low voltages are specified using the function generator. The high and low
voltage for PWM are set typically to ± 10-20V of the initial jetting voltage. Altering the
specified printing parameters set by the function generator, the stage speed, and the working
distance will change the size and spacing of the printed droplets.
1.3 Current E-jet Limitations
Currently, E-jet printing cannot compete with inkjet or Xerox printing when it comes to high
throughput because typically only a single nozzle is used to print [1, 4, 12-15]. At UIUC,
success in decreasing the single nozzle printing time of a pattern using a pulsed signal has been
reported [12], but efforts must now be directed in developing either a high density nozzle print
head or finding alternative means of precisely delivering small droplets using similar physics as
E-jet, dispensing inks using electrostatics. Also at UIUC, there have been developments in
multi-syringe holder type devices to increase the throughput of printing with E-jet, Sutanto et al.
developed a single nozzle “carrousel” which allows for multiple materials to potentially be
printed in the same area [4]. Multiple materials can be loaded into different syringes and the
carousel can be rotated to call upon each syringe to print. This achievement allows for multiple
materials to be printed with ease but does not significantly decrease the printing time of an
image.
Fabrication of a high density nozzle array can be expensive if made with traditional silicon
processing. There would be a high initial cost to develop a process for fabrication but could be
batch fabricated later. Having the actual printing orifices fabricated from a single substrate can
significantly reduce the issues of nozzle alignment. There is however the issue of cross talk that
could potentially occur with a high density array with strong electric fields in close proximity of
each other.

6
There is a minimum size droplet that can be produced for a given nozzle inner diameter. To
further decrease the size of the droplet, the nozzle size would also have to be decreased. The
issue of nozzle clogging becomes more apparent when decreasing the size of the nozzle.
Clogging can be a result of many variables such as the humidity of the environment, the
viscosity and/or vapor pressure of the ink material, and also the composition of the ink, whether
it is a suspension of nanoparticles or polymer chains. For these reason, to print at high
resolutions with current E-jet printing techniques, the ink selection is restricted to low viscous
materials.

7
CHAPTER 2: MULTI-NOZZLE ARRAY PRINTHEAD
2.1 Introduction
Fabricating a high density array to compete with an inkjet printer head is challenging due to how
E-jet works. Alignment of the nozzle tips and cross talk are key issues when trying to achieve
uniform printing with multiple nozzles. The nozzles used in the following experiments are pre-
pulled, thin walled, borosilicate glass pipettes commercially purchased from World Precision
Instruments (WPI) and can vary in total length, therefore individual nozzle alignment in the print
head is necessary. As previously discussed, there are many advantages to being able to print
multiple nozzles simultaneously. The motivation for the work discussed in this chapter is to
design an inexpensive print head which can secure nozzles in a linear array to demonstrate
simultaneously printing of a pattern. The total printing time of an array of nozzles can be
roughly estimated using the time to print an image with a single nozzle divided by the number of
nozzles in the array. The capability of the work done on a MNA is demonstrated and later
discussed by simultaneous printing a four nozzle print head made from off the shelf products and
low cost custom mounting pieces.
With the desire to increase printing throughput, many issues have to be addressed in order to
have successful multi-nozzle printing. The most significant factor for determining successful
printing with a single nozzle is finding the correct printing voltage for the given air gap between
the nozzle tip and the printing substrate. A one micron difference in air gap can change the
printing voltage by 1-10V, which is enough to start or stop E-jetting, therefore alignment is the
most dominant issue that must be addressed when scaling to multiple nozzles. Unlike an entirely
fabricated micro-array print head, alignment of the commercially purchased nozzles must be
done while building the print head. Once a print head is created, it is important to test the array
to demonstrate that the print head operates identically to how a single nozzle would perform.
Since the goal is to increase the throughput of printing, the nozzles must be able to print
simultaneously and must have uniform droplet size across the array. By increasing the number
of printing nozzles, the cost of print manufacturing can decrease so a low cost print head must be
designed and produced to show this approach of increasing the number of printing nozzles is
feasible.

8
There have been many advancements in developing a multiple nozzle E-jet delivery system to
decrease production time [4, 7, 10, 16, 17]. As previously mentioned, Sutanto et al. developed a
single nozzle “carrousel” which allows for multiple materials to potentially be printed in the
same area. This tool advances the ability to repeatedly print multiple materials in the same spot
without having to change out nozzles, but it is still single nozzle printing [4]. Lee et al.
fabricated a three nozzle array using PDMS and an FR-4 substrate using standard printed circuit
board processing. This array eliminates the use of glass micropipettes and reported a printed line
width of 100µm or greater from a 120µm opening [10]. Choi et al. developed a five multi-
nozzle array made from molding PDMS to allow for glass micropipettes to be inserted with a
pitch of 3mm and the reported average line with this array was approximately 30 µm. In Choi’s
setup, copper electrodes are fed directly into the ink in each nozzle to supply voltage and each
nozzle has an individual ink inlet [7, 16, 17]. However, there is currently no reported array that
can achieve the density of nozzles in a print head comparable to inkjet printing.
2.2 Design of holders and mounts
Initially the nozzle holder, or print head, was a custom design machined out of Teflon. Teflon
was chosen because it is chemically inert which allows for a set of nozzles to be secured in the
holder and then later removed to reuse the holder. To keep the pitch of the nozzles small, every
other nozzle required to be bent in a 90° angle to allow for enough tolerance for tubing to be
secured to the ends of the nozzles. Nozzles were bent using a butane torch but it was difficult to
ensure the bend was in the same location of each nozzle because the total length of each nozzle is
not the same. To keep the nozzles as vertical as possible once mounted in the holder, a second
Teflon holder was machined to assist in the horizontal alignment. Figure 3 shows a computer
aided design (CAD) drawing cross section of the initial holder design in which the nozzles were
inserted vertically through the designated holes. Alignment was done by inserting the nozzles,
tip first, through the Teflon holders and allowing them to rest on a parallel PDMS spun glass
slide. This was a physical alignment process which resulted in severe damage to the tips
rendering then unusable for printing. In order to demonstrate the feasibility of producing a
MNA, the alignment must be precise with minimal damage to the nozzles themselves so an
alternative nozzle holder design was made.

9
Figure 3. CAD drawings of the Teflon nozzle holder (left) and nozzle alignment setup with Teflon holders (right).
The second and final print head design utilizes predefined v-groove slots for the nozzles to rest
in. Figure 4 shows the design of the v-groove print head in a CAD software. The “V” spacing is
defined by the desired pitch of the nozzles, which in turn is limited by the outer diameter of the
pipettes (1mm) and the tubing (1mm), which supplies ink to each nozzle. By incorporating the
tubing thickness and a clearance of 0.25mm on either side of the pipettes, a pitch spacing of
2.5mm will also ensure electrical isolation and eliminate cross talk while printing. Due to the
small size and complicated geometry, machining the v-groove holder would be very difficult and
expensive for this proof-of-concept device so it is built using 3D rapid prototyping (RP)
techniques. By designing the print head in a CAD software, it is compatible with the RP
machines and allows for changing the number of grooves required to be done with ease. The RP
material chosen is ProtoGen O-XT 18420 white which is an ABS-like photopolymer. This
material gives good accuracy in resolution but is not chemically resistant and therefore is a one-
time use part. The used nozzles cannot be removed without permanent damage to the v-groove
holder therefore a whole new print head with nozzles would be required to print more images.

10
Figure 4. CAD drawings of the v-groove nozzle holder (left) and alignment setup (right).
To simplify the mounting of a small nozzle print head to the actual E-jet system, each print head
has compression tabs located on either side of the part. An E-jet mount is designed to have slots
allowing for the tabs to be press fitted into and is also made from RP techniques. Only one E-jet
mount needs to be built for a given width of the print head. Should the number of nozzles
increase, the E-jet mount will need to be adjusted to accommodate the increase or decrease in the
v-groove nozzle holder width.
2.3 Nozzle Alignment
A camera with a high magnification lens is mounted perpendicular to an optical grating used to
align the nozzles. Once the nozzles are laid into each groove, a differential adjuster fixed to a
linear stage is used to push the ends of each nozzle individually to the desired line on the grating.
Figure 4 shows the alignment setup assembled in a CAD software on the right. Norland Optical
Adhesive (NOA74) is selected as the adhesive to secure the nozzles because it remains a liquid
until cured with UV light and has low shrinkage. Due to the groove shape, each nozzle can be
cured independently of the others. Although this alignment process yields much lower damage
to nozzles, it is still a manual process which leaves room for error. Ideally with high precision
alignment, all nozzles mounted will be printed both individually and simultaneously because
they will all require the same jetting voltage. Figure 5 shows the final alignment of four nozzles
in the v-groove holder with copper tape around them. Based on the optical alignment technique
and using a differential adjuster, the nozzle tips are aligned to within ±1.6µm standard deviation.

11
Figure 5. Final v-groove nozzle print head with four secured nozzles.
2.4 Experimental Setup
The v-groove MNA print head is successful in eliminating any misalignment in the horizontal
direction, out of plane, and the need for physical contact to ensure alignment. However there is
the issue of alignment of each nozzle to be perpendicular to the printing substrate. In addition to
the 5 DOF stages and manual z stage, the current UIUC E-jet is equipped with an additional
rotating stage that is mounted to the manual z stage. To address the potential perpendicular
misalignment issue while printing, the designed E-jet mount attaches to the rotating stage to
ensure the nozzles are all perpendicular to the printing substrate and require roughly the same
voltage to jet. Figure 6 shows the rotational stage with the E-jet mount.

12
Figure 6. RP E-jet mount and rotational stage attached to the 5-axis E-jet printer.
Once the nozzles have been aligned and secured, the print head is press fitted into the designated
slots on the E-jet mount. The nozzles are then lowered into a hydrophobic coating solution to
help pin the meniscus to the inner diameter of the nozzle to aid in forming a Taylor cone and
printing. The coating is a mixture of 0.1% percent weight of 1H, 1H, 2H, 2H-perfluorodecane-1-
thiol (Sigma-Aldrich) to dimethylformamide (DMF) (Sigma-Aldrich) where the thiol component
binds with the gold coating on the nozzles creating a monolayer of a hydrophobic carbon chain.
For the stage alignment to the nozzle array, the mount is leveled to the machine itself. To
confirm the alignment of the printing substrate to the nozzles, the tip and tilt of the stage is
adjusted with respect to only one nozzle. If there is poor nozzle tip alignment, the working
distance (air gap) is set based on the nozzle closest to the substrate. The working distance
determines the printing voltage and can be at a variety of heights but the closer the nozzle is to
the substrate, the lower the required printing voltage. Figure 7 is a composite of the four nozzle
MNA tip (N1-N4) images from a single print head taken with the E-jet camera. The pitch
spacing of the nozzles is too large to view simultaneously with the installed optics on the camera.
To power each nozzle, a small alligator clip is attached to the high voltage electrode and clamped

13
onto the copper tape wrapped around each nozzle. The capability to address each nozzle is
important for determining which nozzle(s) will actually print and at what jetting voltages. An
array of gold spring loaded pogo pins can also be installed to replace the copper tape by making
a RP holder to align each pin with an Au/Pd coated nozzle. The pogo pins allow for good
contact to the nozzles and by eliminating the use of tape, the risk of damaging the nozzles is also
reduced.
Figure 7. Composite image of the nozzles and nozzle reflections for alignment purposes for a four nozzle MNA.
2.5 Printing Experiments
The ink selection for all experimental printing with the MNA is NOA74. NOA74 is selected due
to its good charge mobility and dielectric constant. The printing substrate for all experiments is a
single side polished silicon wafer. Both 10µm and 2µm inner diameter nozzles are tested with
the MNA but the printing results presented here will reflect an experiment only using 2µm
nozzles. The 2µm nozzles are selected because the droplet sizes are more suitable for the
production of high density droplet images for printing fine or intricate features.

14
After ensuring each nozzle individually successfully prints in both DC and PWM mode,
simultaneous printing is achieved by connecting a single electrode to each of the functioning
nozzles. The capability of printing is determined by whether or not the nozzle is broken or
clogged and can be determined either visually or simply by not being able to print. The voltage
required to print all four nozzle simultaneously did not vary from the jetting voltages of an
individual nozzle. To demonstrate the full capability of the linear multi-nozzle array print head
and the current E-jet system, a G-code was generated and used to print with all four nozzles.
The image chosen to print is the UIUC logo of an “I” and can be seen in Figure 8. As previously
stated, the G-code CNC feature on the UIUC E-jet was used to print this image automatically.
Figure 8. UIUC logo used for demonstrating simultaneous printing with the MNA.
The air gap is set to 20µm for the nozzle closest to the substrate, which is nozzle 4 (N4) in Figure
7. The initial jetting voltages and estimated air gaps can be found in Table 1. The air gap for
each nozzle is approximated because they are determined with image processing and is
dependent on the camera resolution. For the N4 set to a 20µm air gap, the initial jetting voltage
is ~130V. N2 and N3 have roughly a 24 µm air gap requiring voltages of 136 and 141V

15
respectively to print. This confirms the correlation between smaller working distances requiring
less voltage.
Table 1. Initial jetting voltages and gaps for a single printing experiment (the gaps are approximated through image processing and may not be accurate to actual distance).
Nozzle #Vertical
Spacing [µm]Initial Jetting Voltage [V]
1 ~22 1322 ~24 136.43 ~24 140.84 ~20 130.4
The goal for all the experiments is to have all nozzles simultaneously print by determining the
optimal printing parameters for a print head with a given nozzle size and set air gap. For the
purpose of this work, the desired printed image is one with a high density of uniform size printed
droplets across the print head. By changing the PWM components, the effect of an individual
parameter can be studied so an optimal printing signal for a given print head can be achieved.
Highlighted in yellow in Table 2 are the varied PWM parameters changed from each test print.
The PWM parameters were iteratively changed after each CNC print to achieve the desired
results.
Table 2. Varying PWM parameters for each printed test run.
High/Low [V]
Period [ms]
Pulse Width [ms]
Speed [mm/s]
Line Distance
[µm]
Dwell On/Off
[µs]
T1 120/148 10 5 1 10 100/100T2 120/148 10 5 0.7 10 50/100T3 120/148 10 5 0.5 10 10/100T4 120/148 10 5 0.6 5 10/100T5 120/148 10 5 0.6 5 10/1

16
2.6 Results and Analysis of Simultaneous MNA Printing
From the experimental initial jetting voltages found in Table 1, the first print (T1) has a low and
high voltage for simultaneous PWM of 122/148V respectively, a pulse spacing of 10ms, pulse
width of 5ms, and the on and off dwell times are both 10ms. The feed rate is 1mm/s in both the
x and y direction and the image line spacing in the x direction is 10µm. These parameters can
also be found in Table 2, along with the five other printing tests ran (T1-T5). Figure 9 shows the
printed images of an MNA with T1 parameters. There are some defects such as missing droplets
and enlarged first droplets on a line. These defects can be attributed to the signal generation
rather than the MNA print head because the defects are consistent across all four printed images.
The only differences in the printed images between the nozzles are the droplet sizes, which is to
be expected due to the different initial jetting voltages of each nozzle.
Figure 9. Initial MNA simultaneous printing of UIUC logo with T1 parameters.
2.6.1 PWM Parametric Study
All five printing tests were carried out and Figure 10 shows an enlarged portion of the printed
pattern for the five different experiments with modifying different PWM parameters such as
dwell on time, stage speed, and line spacing. The images are taken from the same area for each
nozzle printed pattern with the same number of lines. This enlarged area is where the image

17
analysis of consistency across the print head is done. Post processing image analysis is
performed in ImageJ to determine the variation of printed droplets between the nozzles in the
print head.
Figure 10. Enlarged area of printed pattern from the same area for each nozzle of the MNA print head for five experiments.
T2 had a decrease in stage speed and half the on dwell time compared to T1 and resulted in
smaller initial droplets and can be seen in Figure 10. In Table 3, the standard deviation of
droplet size decreased from 1.84µm to 1.08µm for the total print head (across all four nozzles
combined). Although this decrease in standard deviation is desired, the value is still too large
given the actual droplet size is approximately 2.6µm. The large standard deviation in droplet
diameter is due to the large initial droplets: the initial droplet for T2 is approximately 7.21µm
and T3 is 5.19µm with a standard deviation of 0.54µm for just the large initial droplets of both

18
printed images. The initial first droplets for T1, T2, and T3 were measured to confirm the
correlation of decrease in dwell on time to smaller droplets but are not presented.
Table 3. Average size and standard deviation of counted printed droplets from enlarged area in Figure 10
N1 N2 N3 N4 Print Head
Average [µm] 2.97 2.34 3.15 2.68 2.71Std. Dev. [µm] 1.72 1.75 1.89 2.00 1.84
# Droplets 218 269 222 265Average [µm] 2.42 2.16 2.77 2.68 2.49Std. Dev. [µm] 0.97 1.07 1.19 1.23 1.08
# Droplets 312 327 259 269Average [µm] 2.63 2.53 2.86 2.88 2.75Std. Dev.[µm] 0.43 0.49 0.46 0.58 0.53
# Droplets 313 317 298 300Average [µm] 2.54 2.48 2.97 2.96 2.77Std. Dev. [µm] 0.46 0.51 0.57 0.70 0.59
# Droplets 615 640 576 564Average [µm] 2.30 2.24 2.72 2.82 2.56Std. Dev. [µm] 0.54 0.63 0.53 0.58 0.64
# Droplets 630 625 529 527
T1
T2
T3
T4
T5
Table 3 also has the calculated average printed droplet size and standard deviation for the
measured number of droplets for each individual nozzle, N1-N4, for all five tests. By decreasing
the dwell on time and slowing down the printing speed, more uniform droplets are printed. For
T3 shown in Figure 10, the average droplet size is 2.75µm with a standard deviation of 0.53µm.
Further decreasing both the stage speed and line spacing results in more droplets printed per line
and more lines printed in a given area as seen by the T4 images. Increasing the frequency or
decreasing the pulse spacing will also increase the number of droplets printed per line, but the
pulse width will then need to be adjusted to maintain the same size droplets. For simplification,
the speed was decreased to achieve the same result. For T5, the dwell off time was decreased to
try and eliminate the issue of missed droplets. The final printed pattern for this set of
experiments, T5, can be seen in Figure 11 with an average droplet size of 2.56µm and a standard
deviation of 0.64µm.

19
Figure 11. Final MNA simultaneous printing with high density of droplets with PWM T5 parameters.
2.6.2 Conclusion of MNA PWM printing
When comparing Figure 9 of the initial print (T1) to Figure 11 of the final print, the MNA
demonstrates the capability of printing with all nozzles simultaneously and an optimal PWM
signal was generated. As previously discussed, the initial printing setup had large first droplets,
and they were eliminated using T5 printing parameters. Figure 12 is an enlarged portion of a
section of the printed pattern from the initial print, T1, and the final print T5. Not all the issues
of extra and skipped droplets were addressed, which can also be seen in Figure 12, but there was
an overall improvement in printing, with a high density printed image.
20
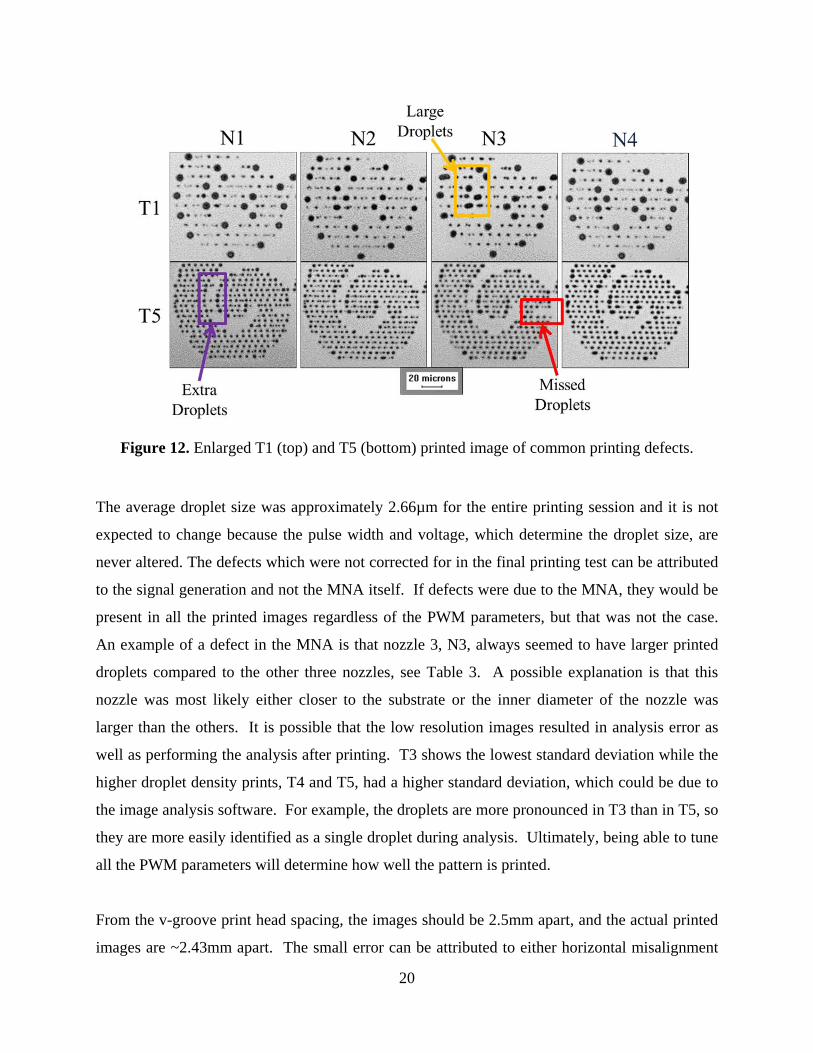
Figure 12. Enlarged T1 (top) and T5 (bottom) printed image of common printing defects.
The average droplet size was approximately 2.66µm for the entire printing session and it is not
expected to change because the pulse width and voltage, which determine the droplet size, are
never altered. The defects which were not corrected for in the final printing test can be attributed
to the signal generation and not the MNA itself. If defects were due to the MNA, they would be
present in all the printed images regardless of the PWM parameters, but that was not the case.
An example of a defect in the MNA is that nozzle 3, N3, always seemed to have larger printed
droplets compared to the other three nozzles, see Table 3. A possible explanation is that this
nozzle was most likely either closer to the substrate or the inner diameter of the nozzle was
larger than the others. It is possible that the low resolution images resulted in analysis error as
well as performing the analysis after printing. T3 shows the lowest standard deviation while the
higher droplet density prints, T4 and T5, had a higher standard deviation, which could be due to
the image analysis software. For example, the droplets are more pronounced in T3 than in T5, so
they are more easily identified as a single droplet during analysis. Ultimately, being able to tune
all the PWM parameters will determine how well the pattern is printed.
From the v-groove print head spacing, the images should be 2.5mm apart, and the actual printed
images are ~2.43mm apart. The small error can be attributed to either horizontal misalignment

21
(nozzles not seated in the v-grooves properly) or the v-groove part was not designed with
sufficient tolerances to accommodate for the RP build inaccuracy. Figure 13 shows two of the
UIUC logos printed using the 2µm nozzle MNA. Overall the error in spacing can be
accommodated for in the future by improving the alignment setup.
Figure 13. Printed pattern of two of the four images to display the spacing of the four MNA.
Even though larger nozzles like 10µm are easier to align because they are larger and more
robust, it is challenging to get simultaneous printing to occur with all four nozzles in the print
head. Most failed printing occurred due to poor alignment or broken nozzles. By using a higher
magnification lens, the alignment is improved and a set of 10µm nozzles printed simultaneously
with initial jetting voltages averaging 360.5V and a standard deviation of 22.66V. There was
still some difficulty with controlling the printing parameters, so to simplify the print and to lower
the required voltages, 2µm nozzles were used. However, the design of the v-groove does not

22
restrict the size of the inner diameter nozzle as long as the outer diameter (OD) remains the
same. This specific v-groove design is for an OD of 1mm. With the 2µm nozzles, the printing
experiments which were successful for all four nozzles had much lower standard deviations like
the discussed experiment. The average printing voltage was 134.9V with a standard deviation of
4.68V. Since the determination of accurate working distance is difficult, a more accurate
representation of the quality of alignment is reflected by the initial jetting voltages. Nozzles
being damaged or having poor alignment was and is still an issue when making the proposed
multi-nozzle print head.
2.7 Cost Analysis of V-groove MNA
A simple cost analysis of the MNA print head can done based on the work completed thus far.
The RP machined used to build the v-groove holder is a Viper SLA Project 6000 Professional 3D
Printer with a printing envelope of 240x240x240mm. The ProtoGen O-XT 18420 material costs
$0.35/gram and the final v-groove piece weighs 0.7 grams resulting in a unit cost of $0.25. The
v-groove holder is printed vertically with dimensions of 14x25x3.25mm so with a 4mm
clearance around each part, up to 441 four nozzle v-groove units could be built in one print/build
session. Using RP technologies allows for the ease of altering the v-groove holder for a custom
print head. If the width of the print head is to change, a new E-jet mount will also need to be
constructed. For the experiment discussed above, the E-jet mount is 70x120x7mm, so if this part
is built on the same RP platform as the v-groove units, potentially 371 v-grooves could be built.
Each glass micro-pipette nozzle from WPI costs $12.50 and has to be coated in Au/Pd to be
conductive. The metal deposition is done using a sputtering tool and costs $10.54/min including
overhead for the material. Up to 25 glass nozzles can fit on the sputtering platform and are
typically coated for 120secs, resulting in approximately 12nm of deposited Au/Pd. An amount
of $5 includes all other materials such as the adhesive, tubing, luer locks and the copper tape
used for a print head. The unit cost of one four nozzle print head based on this bill of materials is
approximately $60.
Using a photopolymer material and the NOA adhesive, the current v-groove holder is a one-time
use holder. The lifetime of the MNA is difficult to determine due to the numerous factors that
can affect printing. The greatest factor in ceasing the ability to print is nozzle clogging. Ink

23
material properties that are suspensions of nano-particles, highly viscous, high vapor pressure, or
high surface tension can cause clogging after a short time of printing, less than two hours. The
printing environment can also affect nozzle clogging. For example, it has been observed that
nozzles have a tendency to clog faster if the humidity is low. The hydrophobic coating that is
applied to the nozzles is not a permanent coating and the effects can be reduced over time which
could lead to failure of the print head. For the presented experiments, using NOA as an ink, the
total printing time was approximately five hours with no signs of nozzle clogging or variation in
printing.
With the current alignment setup, it takes roughly 45-60 minutes to align and secure four
nozzles. The RP build time based on university resources will be approximately three hours
which includes the pre-processing, printing and post processing steps. If the manufacturer of the
print head were to pay an employee the federal minimum wage reported by the US Dept. of
Labor of $7.25, then the fabrication of a four MNA print head would cost minimum of $90. This
total does not include the cost of the equipment such as the lens, camera, and computer required
for the alignment process or the cost of the RP machine itself.
RP manufacturing parts is useful when making custom print heads or a few thousand a year, but
if the number of print heads demanded were to increase, plastic injection molding would have to
be used. For the purpose of mass production, aPrioir software is used to perform a cost analysis
based on injection molding 500,000 units/year. There is a large capital investment for the hard
tooling, but if ABS is to be used as the material, the unit price for an injection molding the v-
groove holder is $0.16. This price per unit takes into account variable costs such as labor,
material, and overhead, unlike the simplified cost analysis performed for using RP machines to
produce the v-groove holders.

24
CHAPTER 3: NOZZLE-LESS PRINTING
3.1 Introduction
Electrohydrodynamic jet printing has the capability of enhancing printing capabilities in
manufacturing processes, but many issues still remain. In the previous chapter, the issue of
throughput was addressed by developing a print head that increases the number of nozzles
available to print. The alignment issues during the fabrication of the print head with
commercially purchased nozzles proved to be a significant challenge. If the alignment issue of
the physical nozzles could be completely eliminated, the appeal of E-jet for manufacturing would
increase dramatically. In this chapter, research has been done to print small droplets from a thin
liquid film using similar physics as E-jet. With E-jet printing, an electric field is used as the
mechanism for printing which essentially causes small quantities of ions within a liquid to
accumulate and print resulting in much smaller droplets compared to inkjet. The goal is to still
use of an electric field and the formation of a Taylor cone to print small droplets consistently on
a substrate but find an alternative way of delivering ink to the system.
There are many advantages to eliminating the need for physical nozzles for E-jet printing. As
previously mentioned, eliminating the need for nozzles will eliminate the alignment issues of
multiple printing orifices. With the proposed setup, the only alignment required is between two
stationary parallel surfaces. Further, the electric field is locally generated, eliminating the need
for a high voltage power supply or amplifier. This technique may have a higher capital cost but
may have a lower consumables’ cost as one does not need to prepare printing nozzles. Further,
the issue of nozzle clogging is completely eliminated. If the ink has changed in material
properties over a printing session, the ink film only needs to be replaced or refreshed to continue
printing. With typical nozzle E-jetting, either new nozzles or a quick way of cleaning the
nozzles without damaging them is required to carry on printing. With the potential advantages of
printing from an ink film, E-jet can become more attractive for common manufacturing
processes such as roll-to-roll printing. The desired final setup used will be similar to Xerox
printing with rollers, continuous ink supply, and the ability to print at any location on a substrate.

25
The initial goal for printing from an ink film is to prove that it can actually be achieved. This
study focuses on using pyroelectricity as a high voltage source to pull droplets from an ink film.
There are many advantages to using pyroelectrics such as the fast response time, operation in a
wide range of temperatures, and relatively low cost [18]. After demonstrating feasibility, the
problem of controlling the size of the droplet is addressed. The desired droplet size was
determined after initial experiments were conducted to know what an achievable range is when
using pyroelectrics. The current desired diameter of droplets for printing from an ink film using
pyroelectricity is 500µm or smaller.
3.2 Pyroelectricity
3.2.1 Background and History
Pyroelectricity is the conversion of thermal flux to an electrical quantity, such as current or
voltage, and is often described in a vector form [19]. The first documented observation of the
pyroelectric phenomenon can be traced back all the way to the late 4th to early 3rd century BC
[20]. The observation of a lyngourion stone being charged to electrostatically attract materials
like straw and metals when it was heated is documented in a treatise titled “On Stones” [18, 20].
The author of the treatise is unknown but the material content has been credited to the Greek
philosopher Theophrastus [20]. It wasn’t until 1717 when the chemist and physician Louis
Lemery first wrote a scientific paper on the electrostatic phenomena of pyroelectricity.
Throughout the 18th and 19th centuries, there was much advancement made in both
pyroelectricity and the field of electrostatics using a stone called tourmaline. The term
“pyroelectricity” wasn’t first used until 1824 when David Brewster defined the phenomena as
such. After the electrometer was developed in 1859, John Mothée Gaugain made the first
precise measurement of the charges generated from a pyroelectric material. However, when
ferroelectricity was discovered in 1920, all interests and efforts in the research of pyroelectricity
nearly disappeared until 1938 when Yeou Ta reignited the field by publishing a paper with the
application of pyroelectric materials in IR sensors [18]. In 1974, Rosenblum et al. were the first
to study the pyroelectric effect in materials by observing the “thermally stimulated electron
emissions” or “thermally stimulated field emission” (TSFE), from lithium niobate [21, 22]

26
3.2.2 Physics of Pyroelectricity
Pyroelectricity is the reversible coupling of mechanical, electrical and thermal responses. In the
discussed work, the relationships between thermal and electrical properties are studied while any
mechanical responses are neglected. Figure 14 is adapted from Yuan et al. published work to
graphically explain the relationship of pyroelectrics and is found in many other references [18,
23]. The green highlighted path represents the primary pyroelectric coefficient and the red
dashed path is representative of the secondary pyroelectric coefficient. These two coefficients
are discussed in the later in this section.
Figure 14. Graphical representation of relationship between thermal, mechanical, and electrical properties with the primary and secondary pyroelectric coefficients highlighted [23].
The resultant charge that is generated due to a thermal change is proportional to the cross
sectional area of the crystal [18]. The generation of charge is due to the asymmetric interaction
of the atoms within the pyroelectric material [18, 19, 24]. For example, in the material lithium
niobate, the cations (lithium and niobium) shift relative to anions (oxygen) to the “centre of
gravity” of the unit cell [18, 24]. This leads to a horizontal alignment of the electron dipole
moments or spontaneous polarization, Ps, when the material is heated (or cooled) which causes a

27
surface charge density to build up on one of the material surfaces. If the material is immediately
cooled (heated), then the charge will essentially go to zero because equal amounts of charge is
generated when cooled but with the reverse sign than when heated [18, 21].
The pyroelectric effect is only present if the temperature change applied on the material is below
the Curie temperature. The Curie temperature, Tc, is the transition temperature of a material at
which the spontaneous polarization will approach zero [24]. For most single crystals and
ceramics, increasing the temperature decreases the spontaneous polarization due to the decrease
in the charge bound at the surface. The redistribution of the free charges then tries to
compensate for this depletion of charge at the surface causing current to flow [18]. Rosenblum
et al. compared what occurs when a pyroelectric material is continuously heated to a gas
discharge by field ionization of a residual gas or the environment. Before the steady-state
equilibrium of electron field emission is reached, there is field ionization. The discharge will
neutralize most of the surface charge and reduce the electric field but if heat is continuously
supplied to the system, a periodic process will repeat [21].
The spontaneous polarization is not only dependent on the temperature change of the material,
but also the pyroelectric coefficient, γ, which is an experimentally determined material constant.
The relationship of the change of spontaneous polarization with respect to heating time and
pyroelectric coefficient at constant electric field and elastic stress is [19, 24].
∆ , ∙ ∆ in a 3D space (i=1,2,3) (3.1)
The pyroelectric coefficient is an experimentally determined number so depending on the setup,
material properties, and assumptions made, this value can vary but not by a significant amount.
Typically the value of the pyroelectric coefficient reported is the total effect, , which is the
sum of the primary and secondary coefficients at constant pressure or stress as seen in Equation
3.2 [19, 24].
, (3.2)

28
The primary pyroelectric coefficient, , is measured at constant strain and the secondary
pyroelectric coefficient is calculated by the piezoelectric, d, elastic stiffness, c, and thermal
expansion, α, coefficients which result from thermal deformation at a given temperature.
Typically, if the pyroelectric material is free and not fixed, the secondary pyroelectric effect can
be neglected. However, if just a small area of the entire crystal is heated, then the bulk of the
material will essentially act as a clamp and the secondary effect must be considered [24]. There
is also a tertiary coefficient in which a change in temperature generates shear stress in the
material, but this coefficient is commonly neglected when discussing the total pyroelectric
coefficient due to the assumption of constant stress. The tertiary coefficient is also highly
depended on the experimental setup so the value is not commonly reported [19, 24].
3.2.3 Materials and Applications
Due to the coupling of mechanical, thermal, and electrical properties, all pyroelectric materials
are piezoelectric, but the reverse is not true [24]. Lang et al. explains that there are three criteria
that must be met for a material to be considered pyroelectric. “The molecular structure must
have a nonzero dipole moment, the material must have no center of symmetry, and lastly, the
material must have either no axis of rotational symmetry or a single axis of rotational symmetry
that is not included in an inversion axis” [18]. As previously mentioned, only materials with a
polar point group symmetry, a dipole moment, can exhibit the pyroelectric effect [18, 19, 24].
Of the 32 point symmetry crystalline groups, only 10 have vectorial polarization. These groups
are 1, 2, m, 2mm, 4, 4mm, 3, 3m, 6, and 6mm [24]. There are also ionic ceramics and crystalline
or covalently bonded polymers that are considered pyroelectric materials, but they have less
possibilities of polar axis which will lower the spontaneous polarization and in turn the
pyroelectric coefficient because of the relationship derived in Equation 3.1 [24].
Pyroelectric materials can be categorized as non-ferroelectrics or ferroelectric. Non-ferroelectric
pyroelectric materials are those that the polarization cannot be switched with an applied electric
field while ferroelectrics polarizes with an external electric field [19]. Ferroelectrics are more
temperature dependent and polarization occurs at temperatures below the Curie temperature. If
the temperature exceeds the material Curie temperature, then the element will behave like a non-
ferroelectric material and lose the ability to spontaneous polarize. Ferroelectrics also are more

29
dominated by the primary pyroelectric coefficient which is typically negative because of the
spontaneous polarization decreasing with increasing temperature [19].
Some common and favorable pyroelectric materials for applications are triglycine sulfate (TGS)
due to is high pyroelectric coefficient, 550 [19], and low permittivity [18]. Lithium tantalate
(LT) and lithium niobate (LN) also have high pyroelectric coefficients, -176 to -230 and -83
respectively, and can be used in high temperature applications due to their high Curie
temperatures [19]. There are also polymers that exhibit the pyroelectric effect, like
polyvinylidene fluoride (PVDF). Even though PVDF has a very low Curie temperature, the low
thermal conductivity and dielectric constant, along with a pyroelectric coefficient of 27 [19],
can be desirable if used in the appropriate application. For ceramic materials, lead zirconate
titanate (PZT) is the most commonly used due to its robustness in both mechanical and chemical
applications. PZT is a unique material in that changing the component ratio, specifically the
zirconium and titanium, not only alters the mechanical properties but also the pyroelectric
coefficient to give a possible range of -50 to -268.0 [18].
Currently, the use of pyroelectric materials can be found in infrared detectors, vidicons, point
detectors, and fast pulse detectors [19, 24]. They can also be used as sensors for electromagnetic
radiation and thermal imaging systems [24]. There have been many applications of pyroelectrics
in sensors but none yet in a printing manufacturing process which is what is motivating the
presented research.
3.3 Experimental Setup
Drawing analogies to E-jetting, the high voltage source is the pyroelectric material, the printing
substrate will be glass, and the ink used, NOA74, will be the same as the MNA experiments.
The setup is simple with ink spun onto a piece of cover glass in order to control the thickness.
Glass spacers are used to set the air gap between the ink and the glass printing substrate. On top
of the printing substrate, the pyroelectric material is placed to be in direct contact with the heat
source. Unless specifically mentioned, all pyroelectric material thickness is 500µm and all ink

30
thickness is approximately 20µm. Figure 15 is a simplified schematic of the pyroelectric
electrohydrodynamic jet printing and an actual image of the setup to show the printing stack.
Grounded copper tape is placed along the perimeters of the bottom substrate surface where the
ink is spun. Varying the different parameters of the setup, the heat source material, and the
pyroelectric material are studied and discussed in this chapter.
Figure 15. Ink film pyroelectric E-jet printing schematic (top) and actual image of setup (bottom).
For the initial experiments, the above described printing stack was mounted on the same 5-axis
E-jet machine in Chapter 2, and a horizontal camera was used to view printing. The goal was to
not only view the droplets being printed, but also see the profile of the deformed ink to see if a
Taylor cone profile is generated. However, due to the small desired size of droplets and the
quick rate of printing using E-jet, this camera placement and capture rate were not ideal to view
actual printing of small droplets. Instead a top-down camera is implemented in later experiments
to view through the pyroelectric material and printing substrate to give feedback of successful
31
printing and also to measure the size of the printed droplet in real time. The printing setup in
Figure 15 is altered during experiments and the modified schematics will be further discussed in
the following sections. All the reported diameters are estimated based on optical microscope
measurements or from post image processing.
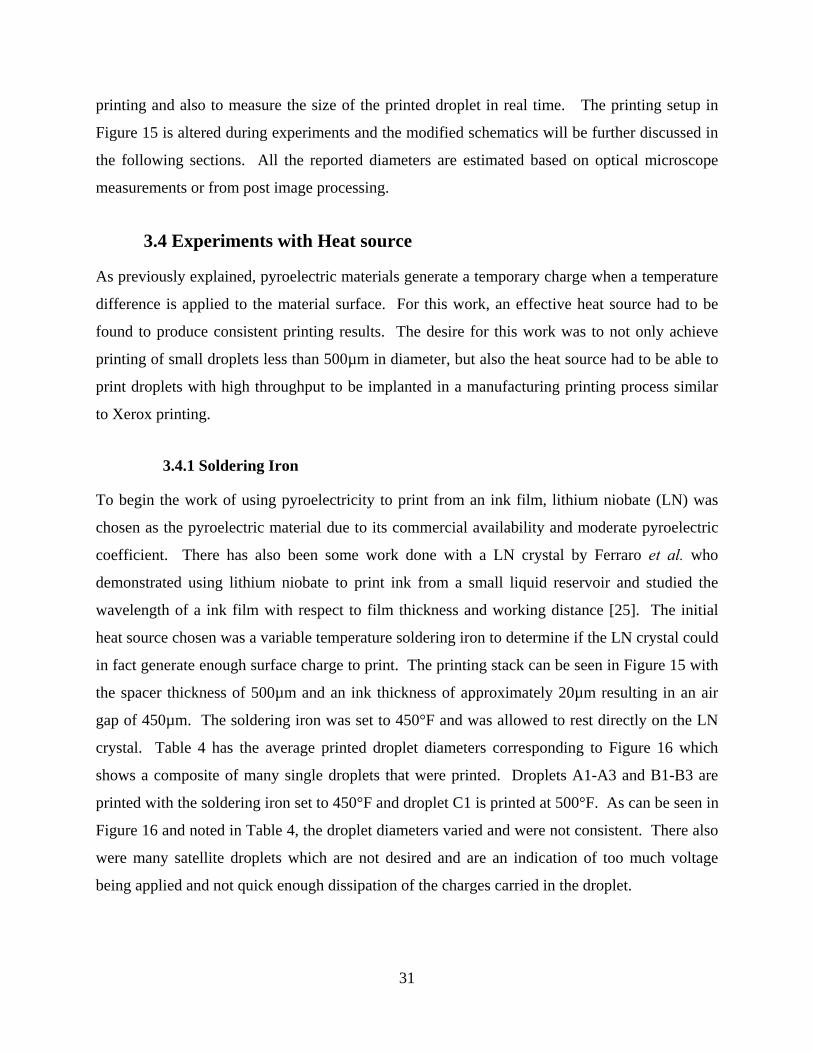
3.4 Experiments with Heat source
As previously explained, pyroelectric materials generate a temporary charge when a temperature
difference is applied to the material surface. For this work, an effective heat source had to be
found to produce consistent printing results. The desire for this work was to not only achieve
printing of small droplets less than 500µm in diameter, but also the heat source had to be able to
print droplets with high throughput to be implanted in a manufacturing printing process similar
to Xerox printing.
3.4.1 Soldering Iron
To begin the work of using pyroelectricity to print from an ink film, lithium niobate (LN) was
chosen as the pyroelectric material due to its commercial availability and moderate pyroelectric
coefficient. There has also been some work done with a LN crystal by Ferraro et al. who
demonstrated using lithium niobate to print ink from a small liquid reservoir and studied the
wavelength of a ink film with respect to film thickness and working distance [25]. The initial
heat source chosen was a variable temperature soldering iron to determine if the LN crystal could
in fact generate enough surface charge to print. The printing stack can be seen in Figure 15 with
the spacer thickness of 500µm and an ink thickness of approximately 20µm resulting in an air
gap of 450µm. The soldering iron was set to 450°F and was allowed to rest directly on the LN
crystal. Table 4 has the average printed droplet diameters corresponding to Figure 16 which
shows a composite of many single droplets that were printed. Droplets A1-A3 and B1-B3 are
printed with the soldering iron set to 450°F and droplet C1 is printed at 500°F. As can be seen in
Figure 16 and noted in Table 4, the droplet diameters varied and were not consistent. There also
were many satellite droplets which are not desired and are an indication of too much voltage
being applied and not quick enough dissipation of the charges carried in the droplet.

32
Table 4. Average size droplets printed with a soldering iron as the heat source and LN crystal
Droplet A1 A2 A3 B1 B2 B3 C1Avg. Diameter [µm] 524.8 443.9 441.3 576.8 437.8 367.6 354.7
Figure 16. Composite of printed droplets from experiments with a soldering iron heat source and LN crystal.
The initial experiments with the soldering iron confirmed successful pyroelectric E-jet printing
from a liquid film using the LN crystal. The variation in size is most likely due to the inability to
hold the soldering iron at a single point without deflecting the printing substrate toward the ink.
With the weight of the soldering iron resting on the glass, the air gap was decreased and

33
therefore the results could not be reliably replicated. A more controlled method of resting a heat
source onto the LN crystal had to be developed in order to print consistently size droplets and to
decrease the heat spot size by decreasing the heat tip diameter.
3.4.2 Resistive Heater Coil
Since the application of the soldering iron to the crystal is very difficult, a resistive heater coil
was made using nichrome wire and wrapping it around a small diameter steal metal tube. A 22
gage stainless steel (SS) hypodermic needle is then inserted into the metal sleeve. As current
passes through the wire, there will be joule heating, and in turn, the needle becomes heated
which will now act as the heat source. By mounting the heater sleeve on the current E-jet 5-axis
system, the heat source can be lowered onto the crystal to allow for better control over location.
Additionally, there is less force exerted on the printing substrate because the SS needle is small
and is not fixed in the sleeve. Figure 17 shows the schematic of pyroelectric printing with
lithium niobate and the resistive heater coil. The SS needle was filed to have a larger contact
area to the LN crystal and is approximately 74µm wide.
Figure 17. Resistive heater coil printing setup.
Even with better control of the heat source placement, printing was not consistent. Controlling
the heat to the LN crystal was challenging because the heater sleeve is the source of heat, so the
heat applied to the crystal is more dominated by the distance of the heater sleeve to the crystal,

34
δy, rather than the heat in the SS needle tip. Many tests resulted in a liquid bridge, seen in Figure
18, instead of a printed droplet from the liquid steaming or Taylor cone regime. When a liquid
bridge formed, there was no droplet printed and the ink did not relax to its original profile.
Figure 18. Image of liquid bridge formed with SS resistive heater coil instead of a printed droplet.
Figure 19 shows a still frame from a video of printing with the heater coil and LN as the
pyroelectric material. As seen in the image, the ink deformation profile is large and a printed
droplet is seen in the reflection in the ink film. The printing occurs too quickly to see if a Taylor
cone is formed. A high speed camera is required to view the droplet being ejected from the
deformed ink apex because it occurs in less than 1ms. These experiments showed that if the ink
behaves in the liquid streaming regime, the ink film will relax nearly immediately after a droplet
is printed. If a liquid bridge has formed and made contact to the printing substrate, then the ink
will not relax to its original thickness. The ink deformation is expected to relax due to the
physics of pyroelectricity. When temperature is applied, there is a buildup of charge generated
on the surface and the crystal behaves similar to a capacitor. The capacitor, or in this case the
LN crystal, will build up charge and once the circuit is closed, the capacitor or surface charge,
will be drained. For the specific example captured in Figure 19 , this occurs roughly 300ms after
the droplet reflection is observed. During the 300ms after the droplet reflection appears, is

35
difficult to tell if there were multiple droplets being printed or just a single one. Only one
droplet is expected to print, but the temperature is still changing due to the applied heat source so
there is a possibility that multiple droplets have printed which could result in larger diameters
and in some instances, a liquid bridge.
Figure 19. Image of ink film deformation profile while printing and a printed droplet is seen in the ink reflection.
In Figure 20, increasing the temperature of the SS needle would sometimes result in the droplet
diameter increasing, but this trend was not consistent across experiments. The feedback of
successful printing was done visually, and once a droplet was printed, the heat source was
removed. However, removing the heat source was not an efficient or consistent way of printing,
and the application of heat needs to be more controlled with respect to time. Although the use of
a soldering iron and resistive heater coil produced the desired outcome of printing a droplet, a
more controlled method of supplying heat in a localized manner had to be developed.

36
Figure 20. Droplets printed with a resistive heater coil heat source and LN crystal.
3.4.3 Near Infrared (NIR) Laser Diode
To better control the duration of heating the pyroelectric crystal, a 805nm near infrared LED
laser was used as the heating source. Using a laser eliminates the need for physical or
conductive heat transfer to the crystal, allows for precise control of the power of the heating
element, and also reduces the applied heat time down to milliseconds. Both pulsed and
continuous laser settings were tested to determine which would result in smaller droplets. Two
laser power settings were used, 20A and 10A which are approximately 8W and 3.16W
respectively. Now that the heat source is the conversion of power/intensity to heat, the
wavelength of the light has to be absorbed by either the pyroelectric material directly, or by an
absorber. Two of the pyroelectric materials used in this work, lithium niobate and lithium
tantalate, are fully transparent in the NIR range so a NIR absorbers was required in order to
convert the laser energy to heat to generate the temperature gradient on the crystal surface. All
the following experiments were done using the NIR laser and discussed in depth in the following
sections.
3.5 Experiments with Infrared Absorber
As stated in the previous Section 3.4.3, the laser used in these experiments has a wavelength of
805nm so a NIR absorber had to be used when using the LN and LT pyroelectric crystals.

37
Initially used to absorb the laser power, a NIR organic dye (5768 Epolight Company) was mixed
in PDMS to control the concentration. Micron size silicon dies were also used to absorb the laser
and both methods are discussed in this section. Lithium niobate was the pyroelectric crystal
material chosen for all the experiments in this section unless if otherwise mentioned. In theory, if
enough power and heat is applied to the pyroelectric crystal, then the crystal will generate
enough charge to print. However, if the required parameters were at or beyond the limits of the
laser and optics used, then the setup was deemed to be unsuccessful for printing.
3.5.1 NIR Absorbing Dye with PDMS
PDMS (Dow Corning Corp. Sylgard 184) was chosen as a material to mix with the NIR dye so
that different parameters that affect the amount of absorption of the NIR laser could be
controlled. Once the NIR dye was diluted in toluene, it was mixed with PDMS (1:5 ratio of
curing agent to polymer base), spun onto cover glass and cured. The cured modified PDMS,
mPDMS, is placed directly onto the lithium niobate crystal surface to have good thermal contact
between the two surfaces. Figure 21 shows a schematic of the printing stack with the mPDMS in
green directly on top of the pyroelectric material. For each experiment, the printing stack does
not change when modifying experimental parameters so that altering a variable, such as heat
source, can be evaluated for its effect on the printing process.
Figure 21. Schematic of NIR dye mixed with PDMS as NIR laser absorbing material for pyroelectric E-jet printing.

38
Initially, the laser parameters are 20A, 2Hz, 100ms pulse width, and an air gap of approximately
576µm because four cover glasses were used as spacers. The PDMS was mixed with a 3:1 ratio
with the NIR dye in solution. Once spun, the resultant thickness for the mPDMS was 65µm and
for testing, the mPDMS is still attached to the glass slide it was spun and cured on. Copper tape
was placed directly under the ink to ground the ink itself but undesired secondary droplets were
printed. These secondary droplets were believed to be attributed to the reflection of the laser off
the Cu surface and heating another location on the crystal. This is the reason for placing the
copper tape around the perimeter of the stack to ground the base rather than under the ink. Table
5. has the printing results of how the pulse width, number of pulses, and the laser power were
changed using this setup and if a droplet was printed successfully. If there were successful
droplets printed, the approximate diameter of the droplets was also recorded. It can be seen that
printing could only be achieved at higher powers with the number of pulses to print varying. The
number of pulses and the size of the droplets may be related as noted in Table 5 and Figure 22,
but that relationship would require further testing in order to be validated.
Table 5. Parameters for pulsed laser pyroelectric E-jet printing and droplet diameters of successful prints.
Test #Current
[A]Pulse Width
[ms]# of
PulsesAverage Droplet Diameter [µm]
1 10 1 -2 50 1 -3 100 1 -4 10 1 -5 50 1 -6 100 1 -7 100 6-7 826.828 50 10 -9 100 10 882.8110 100 11-12 911.52
10
20

39
Figure 22. Optical images of printed droplets from Table 5 using a pulse laser heat source and LN crystal.
In an effort to try and reduce the size of the droplets while maintaining the desired circular shape,
the spacer thickness was changed to three cover glass slips or approximately 435µm thick, which
results in an air gap of approximately 227µm. This air gap was kept constant for all experiments
discussed in this thesis unless specified. The laser parameters were kept constant at 20A, 2Hz
and 100ms pulse widths. Table 6 shows selected mPDMS and NIR laser printing experimental
results for pyroelectric printing with modified PMDS. Test A, in Figure 23, shows multiple
droplets printed, which occurred once the glass slide with the mPDMS was removed. Multiple
droplets being printed with the laser center at a set position was an undesired effect, but the
droplet size did decrease to about 400-450µm as noted in Table 6. Another possible cause of
multiple droplets is the uniformity of NIR dye in the mPDMS within the laser spot size
(approximately 600µm). With Test B, it was noticed that even after the laser had been pulsed,
there was always a secondary droplet being printed in the same general location. As mentioned
earlier, once the copper tape was removed from under the ink and moved to the perimeter, the
secondary droplet was eliminated. The unpredictable printing can be seen in Figure 23 because
there was no change between the actual mPDMS between Test A and Test B, yet the results are
very different

40
Table 6. mPDMS printing experiments with the pulsed laser.
Droplet A1 A2 A3 A4 B1 B2# Pulses 6 6-7 6-7 6-8 9 -
Avg. Diameter [µm] 401.04±10 450.52±26 392.15±45 402.34±40 432.29±10 402.13±6
Figure 23. mPDMS pulsed laser printing experiments with no glass on the mPDMS and Cu tape under entire ink resulting in multiple printed droplets from Table 6.
Additional experiment achieved better control over printing by using a continuous laser rather
than a pulsed laser source. To determine the time required to achieve printing with the mPDMS,
the laser power was lowered to 10A and was left on until printing occurred. Using the 65µm
mPDMS with a ratio of 4:1 to NIR dye, a letter “I”, as seen in Figure 24, was printed to
demonstrate control over droplet placement, printing time, and size. The droplets were printed
with 1mm pitch spacing.

41
Figure 24. Printed “I” pattern using mPDMS and NIR laser heat source.
A more detailed analysis was performed with the printed “I” image compared to the previously
discussed results of a single droplet. Since the ink used is NOA74, the droplets were cured with
a UV light source so the size and volume of each droplet could be measured using a profilometer
(KLA-Tencor Alpha-step IQ). Table 7 has the height and width of all eight printed droplets that
form the “I”. The average height of the pattern was 38.52µm with a standard deviation of
3.36µm, and the average diameter was 446.22µm with a standard deviation of 20.86µm. The
volume of the droplets was also calculated using a spherical cap model, and the average volume
was 12.12nL with a standard deviation of 1.78nL.

42
Table 7. Printed I with mPDMS and NIR laser droplet analysis.
Height Width Height Width
1 40.30 444.02 39.49 425.68 39.90 434.85 11.882 40.26 472.97 40.04 444.50 40.15 458.74 13.313 34.90 444.02 33.49 412.64 34.20 428.33 9.884 41.43 492.28 39.87 489.39 40.65 490.84 15.425 32.61 426.64 32.04 458.98 32.33 442.81 9.976 43.25 432.92 40.17 427.12 41.71 430.02 12.157 39.92 453.67 38.66 447.39 39.29 450.53 12.568 39.50 434.36 40.34 432.92 39.92 433.64 11.82
Avg. Volume
Test #X Direction [µm] Y Direction [µm] Avg.
Height Avg. Width
Figure 23 and also from the Table 7 show that the droplets are fairly uniform but some have
satellite droplets. Since the mPDMS is a mixture with the NIR dye, the dye may not have been
uniformly distributed throughout the entire mPDMS mixture, and there may be locations in the
mPDMS that require lower power or pulse width to achieve enough heating to print a droplet.
This “extra” heat will generate more charge which can result in satellite droplets.
After successfully printing droplets in a controlled manner with a continuous laser source, a
printed line was attempted. Figure 25 shows images of two attempts to print a continuous line by
moving the laser at 100µm/s which resulted in droplets. Unfortunately, a continuous line was
not achieved because when the ink makes contact with the pyroelectric material, it essentially
removes all the surface charge that was generated which causes the ink to relax resulting in a
single droplet, see Figure 19. Attempts at printing lines showed that even if the first droplet was
printed, the laser continued to stay on while it was moving. By having the laser on and moving
locations on the mPDMS, there was enough charge built up along the crystal which caused
another droplet to print quickly but also very close to the previously printed droplet. Printing
was faster most likely due to the ink film profile not relaxing completely, therefore the air gap is
smaller requiring less voltage to print. Although a continuous line was not achieved, it can be
seen that the spacing between printed droplets can be less than 1mm, and in these experiments, a
500µm pitch was achieved.

43
Figure 25. Printed lines attempts with continuous NIR laser and mPDMS.
To further attempt to decrease the size of the printed droplets, the mPDMS thickness and ratio of
the dye was altered. Having thicker mPDMS would result in more dye in a given volume, so it
was expected that it would absorb more of the laser power and therefore generate more heat.
The ratio of curing agent to base ratio was not altered for all experiments done with mPDMS.
Two different ratios of NIR dye and PDMS (1:4 and 1:2) were mixed and spun at two different
speeds (300 and 500 RPM). The four different combinations of NIR dye and spin speeds are
listed as A-D in Table 8 with the measured thickness of the resultant mPDMS. Increasing the
amount of NIR dye in the PDMS resulted in thinner, less viscous mPDMS because of the
toluene.
Table 8. Different mPDMS ratios and thickness, labeled A – D.
Ratio NIR dye:PDMS Spin Speed [rpm] mPDMS thickness [µm]
A 1:4 300 137B 1:4 500 63.95C 1:2 300 47.1D 1:2 500 29.3
Out of the four mixtures, only A and C resulted in successful printing. It was concluded that for
a given amount of NIR dye mixed into the PDMS, there is a minimum thickness required for

44
enough heat to be generated through absorbance of the laser. For mPDMS A, droplets were
consistently printed with 10A and a 3.5s laser pulse. Images of the droplets can be found in
Figure 26. The droplets in Figure 26 are not perfectly circular, but the diameters are similar at
approximately 567.87µm and 590.71µm for droplets A1 and A2, respectively. For mPDMS C,
droplets were printed with 10A and a 2.5s laser pulse. These droplets were slightly smaller, C1
and C2 have diameters of approximately 468µm and 508.47µm. Even though mPDMS C is
significantly thinner than mPDMS A, the printing results are similar with respect to the printing
time and the size of droplet. Further experimentation and study will need to be done to
determine the optimal mPDMS ratio of dye and PDMS and the thickness to achieve the smallest
size droplets.
Figure 26. Composite of printed droplets from experiments with varying PDMS to NIR dye ratios A (top) and C (bottom).
Using the mPDMS allows for a droplet to be printed essentially anywhere on the crystal surface
because the entirety of the mPDMS should absorb exactly the same amount. This allows for any
pattern to be printed because there is no restriction to where the laser can strike the surface and
generate heat to induce pyroelectricity. However, some damage on the mPDMS where the laser
strikes prevents that exact location to be used again for printing. Figure 27 shows the damage in

45
the mPDMS while printing with the NIR laser diode, which corresponds to the laser spot size of
approximately 600µm. It can be seen in the right image in Figure 27 that the center of the laser
spot and the droplet center were not always aligned with up to a potential 200µm center offset.
Figure 27. mPDMS damage (left) and misaligned printed droplet to mPDMS damage (right) due to laser printing.
3.5.2 NIR Dye
From the previously discussed experiments of mixing a near infrared absorbing dye with PDMS,
the idea of placing the NIR dye directly on the crystal was explored. Figure 28 shows an image
of the NIR dye on the lithium niobate crystal on the left. The required pulse of the laser to
achieve printing was found similarly to the previous experiments. Small pulse times were tested
ranging from 1ms to 300ms in intervals of 100ms. Droplets were printed at 200ms and 300ms
but as can be seen in Figure 28, there was no control over the location of the droplet, there were
significant amounts of satellite droplets. Also seen in Figure 28, the LN crystal sustained
irreversible damage and the dye is completely used. This application of the NIR material for
absorbing the laser was not further explored.

46
Figure 28. NIR dye directly on crystal (far left), printed droplets (middle left & right), damaged crystal after printing due to overheating (far right).
3.5.3 Silicon Micro Dies
Although using mPDMS offers the advantage of printing essentially anywhere within the area of
the crystal, the irreversible damage due to printing and possible non-uniformity of the NIR dye in
the mPDMS was less than ideal. Within the NanoCEMMS center, research is currently being
done with transfer printers printing a variety of prefabricated structures and micro silicon
squares, referred to as silicon inks [23, 26, 27]. Silicon is an excellent absorber of infrared light
so a variety of sizes of Si µ-squares were printed directly onto one of the pyroelectric material
surfaces to act as the heat source. Figure 29 shows a schematic of pyroelectric E-jet printing
using the NIR laser and Si µ-squares. The hope for using Si µ-squares is to use an IR absorbing
material that will not be damaged and can be used for multiple prints. Additionally, the heat
affected zone is expected to be much smaller because when using the mPDMS, the entire 600
µm laser spot diameter was absorbed by the mPDMS and therefore creating a large heating spot
on the crystal. By using these small Si µ-squares, the spot size for heating the pyroelectric
material will be limited to the surface area of the Si µ-squares themselves when using
pyroelectric crystal materials that do not absorb in the IR range.

47
Figure 29. Schematic of Si µ-square NIR laser absorbing pyroelectric E-jet printing.
Four different size Si µ-squares were fabricated and tested, 200x200x10µm, 100x100x10µm,
100x100x3µm, 50x50x3µm. Thicker inks were also fabricated but could not be printed
successfully on the pyroelectric crystal for testing. Through experimentation, it was discovered
that only the 200x200 squares could successful absorb enough NIR laser to generate the required
amount of heat to induce the pyroelectric response to print using the setup in Figure 29. As
previously discussed, the reason the other inks were deemed unsuccessful for printing is because
the lasers’ and optics’ limit was reached. The air gap is kept constant at 227µm and a 10A, 2.5s
pulsed laser was required to achieve successful pyroelectric E-jet printing using a lithium niobate
crystal. As shown in Figure 30, the droplets printed are larger than the Si µ-squares and had
many satellite droplets. Three µ-squares were printed approximately 1mm apart in a corner
configuration. As labeled in Figure 30, Si I droplet was approximately 582.81µm, Si II
557.81µm and Si III 576.56µm in diameter, which is not smaller than when using the mPDMS.
With these results, and the fact that the smaller inks could not print, it was concluded that the
droplet size is controlled by the profile of change in temperature on the crystal face closest to the
ink, not the one closest to the laser. Even though the heat spot size on one surface is roughly
200µm, the heat will dissipate and spread within the crystal so by the time it is seen on the
opposing face, the one closest to the ink, it is much larger than where the heat was initially
generated. From here, two setup alterations were explored. The first moved the location of the

48
Si µ-square closer to the ink surface and the second decreased the crystal thickness, which is
discussed later is Section 3.6.
Figure 30. Laser focus on a 200x200x10µm Si µ-square (left) and three Si µ-squares with successfully printed droplets (right).
Figure 31 shows a schematic of reorienting the crystal so the Si µ-square is now also in contact
with the printing substrate and is closer to the ink surface. All the other printing parameters were
kept the same from when the Si µ-square was on top of the crystal, exposed to air. By changing
the location of the Si µ-square, the hypothesis is the droplet size and time for printing will both
decrease because the surface closes to the ink will generate charge in a smaller area. Even if the
heat is dissipated into the pyroelectric material, the printing will not be as affected as the
previous configuration like before where the heat had to travel through the material to achieve
printing.

49
Figure 31. Schematic of altered Si µ-square location for NIR laser absorbing pyroelectric E-jet printing.
This new configuration did yield a smaller printed droplet size and a shorter time that the laser
had to be on to print. The laser was set to 10A and a 1s pulse. Figure 32 shows three Si µ-
squares used for printing and the droplets formed. Si I had a droplet diameter of approximately
264.20µm, Si II 282.37µm, and Si III was 292.61µm. The Si µ-squares appear darker because
the squares are printed onto the crystal, and the crystal is flipped showing the underside of the
squares. The backside of the Si µ-squares revealed that the Si adhesion is another possible
parameter that can affect printing. The adhesion of the Si µ-squares to the crystal surface is not
the same and can contribute to variations of the droplet size while printing. As seen in Figure 32,
Si II has lighter corners while Si III is completely dark. Studying the correlation of printed
droplets to Si µ-square adhesion will be addressed in future work.
Figure 32. Three different Si µ-squares with printed droplets using the flipped crystal/Si µ-square setup.
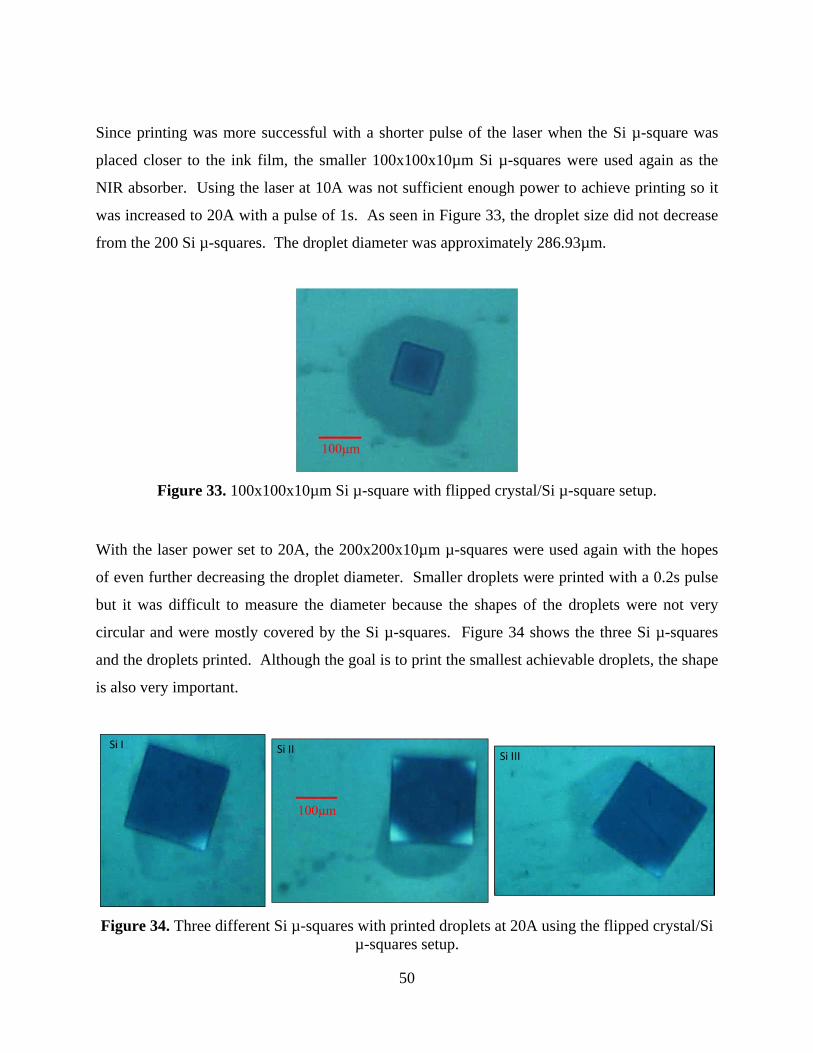
50
Since printing was more successful with a shorter pulse of the laser when the Si µ-square was
placed closer to the ink film, the smaller 100x100x10µm Si µ-squares were used again as the
NIR absorber. Using the laser at 10A was not sufficient enough power to achieve printing so it
was increased to 20A with a pulse of 1s. As seen in Figure 33, the droplet size did not decrease
from the 200 Si µ-squares. The droplet diameter was approximately 286.93µm.
Figure 33. 100x100x10µm Si µ-square with flipped crystal/Si µ-square setup.
With the laser power set to 20A, the 200x200x10µm µ-squares were used again with the hopes
of even further decreasing the droplet diameter. Smaller droplets were printed with a 0.2s pulse
but it was difficult to measure the diameter because the shapes of the droplets were not very
circular and were mostly covered by the Si µ-squares. Figure 34 shows the three Si µ-squares
and the droplets printed. Although the goal is to print the smallest achievable droplets, the shape
is also very important.
Figure 34. Three different Si µ-squares with printed droplets at 20A using the flipped crystal/Si µ-squares setup.

51
3.6 Experiments with Pyroelectric Material
Initially, lithium niobate was chosen as the pyroelectric material because of the work done in
current literature with respect to pyroelectricity and availability of the material [25]. This section
includes the discussion of exploring other pyroelectric materials to get a shorter printing time and
a smaller droplet. Lead zirconium titanate and lithium tantalate were two options explored as
alternative materials.
3.6.1 Lithium Niobate (LiNbO3 or LN) Crystal
LN is a common material chosen when studying pyroelectricity and is also commercially
available. All the reported results in the previous sections were done using a LN crystal. The
total pyroelectric coefficient of LN is -83 which is measured experimentally and is reported
elsewhere [18, 19]. Since this is an experimentally determined value so there are varying values
of the pyroelectric coefficient for all the mentioned materials. The LN crystal was purchased
from MTI Corp. and is poled in the z direction, 500µm thick, optical grade, and double sided
polished. It is part of the 3m point symmetry group and has a Curie temperature of 1160°C. LN
does not absorb in the IR range and therefore an IR absorber was required. The smallest droplet
achieved using LN as the pyroelectric material was found to be approximately 264µm and is
reported in the previous section using a Si µ-square closest to the ink film.
Since reorienting the Si µ-square and crystal resulted in smaller drops, decreasing the thickness
of the crystal will hopefully decrease the amount of heat that can dissipate in the crystal. Since
printing occurs due to the surface charge generated from a change in temperature, the thickness
of the crystal was not taken into account initially as a variable to affect printing. For this reason,
a 100µm LN crystals was investigated, but printing was not demonstrated using either the
mPDMS or the Si µ-squares. However, an interesting “side effect” was observed when printing
with the Si µ-squares. At both higher powers and longer laser pulses, the Si µ-squares would
actually move and sometimes enough to move out of the field of view of the camera. In the
future, a deeper understanding of the physics behind pyroelectricity is required to determine how
the thickness of the material affects the charge generation and therefore the jetting.

52
3.6.2 Lead Zirconium Titanate (PZT) Ceramic
Lead zirconium titanate (PZT) was chosen as an alternate pyroelectric material because it not
only has a higher reported pyroelectric coefficient but also absorbs in the infrared range. The
pyroelectric coefficient for PZT can range from -50 to -268.0 depending on the composition
of each component in PZT [19]. Unfortunately the exact ratio of composition of the ceramic
PZT that was purchased from STEMiNC (Steiner & Martins, Inc.) for our experiments was
unknown, so the exact pyroelectric coefficient is unknown. A wide range of laser power and
pulse durations were used to achieve printing with the PZT but no combination resulted in
successful printing. During the heating of the ceramic, it was observed that there was an
unknown material precipitating out of the PZT so the decision to not pursue this as a pyroelectric
material was made. PZT also has a very large secondary pyroelectric coefficient which can
lower the overall total pyroelectric coefficient because they are opposite signs. This is why the
ratio of the PZT causes such a large change in coefficient because of thermal and piezoelectric
coefficients that vary based on the composition.
3.6.3 Lithium Tantalate (LiTaO3 or LT) Crystal
A material that is similar to LN but has a higher pyroelectric coefficient was desired to study the
effects of increasing the coefficient with respect to printing. It is expected that if the material
properties are exactly the same, then a higher pyroelectric coefficient should just decrease the
printing time. To test this theory, a lithium tantalate, LT, 500µm thick, z cut, double sided
polished crystal was purchased. LT is also part of the 3m point symmetry group and has a Curie
temperature of 610°C which is much lower than LN. The pyroelectric coefficient is almost twice
that of the LN crystal at -176 to -230 [19]. LT absorbs only in the UV range, similar to LN,
so IR absorbing materials had to be used again.
The first experiment with the LT crystal is the same setup as seen in Figure 29. The
200x200x10µm Si µ-squares are printed directly on top of the LT crystal as the laser absorbing
material. With this setup, the laser was set to 10A and took a pulse of 1s to print, compared to
the 3s required for LN. The droplets printed are shown in Figure 35. Si I droplet diameter was
approximately 554.05µm, for Si II 516.22µm, and for Si III 518.92µm. These values are slightly
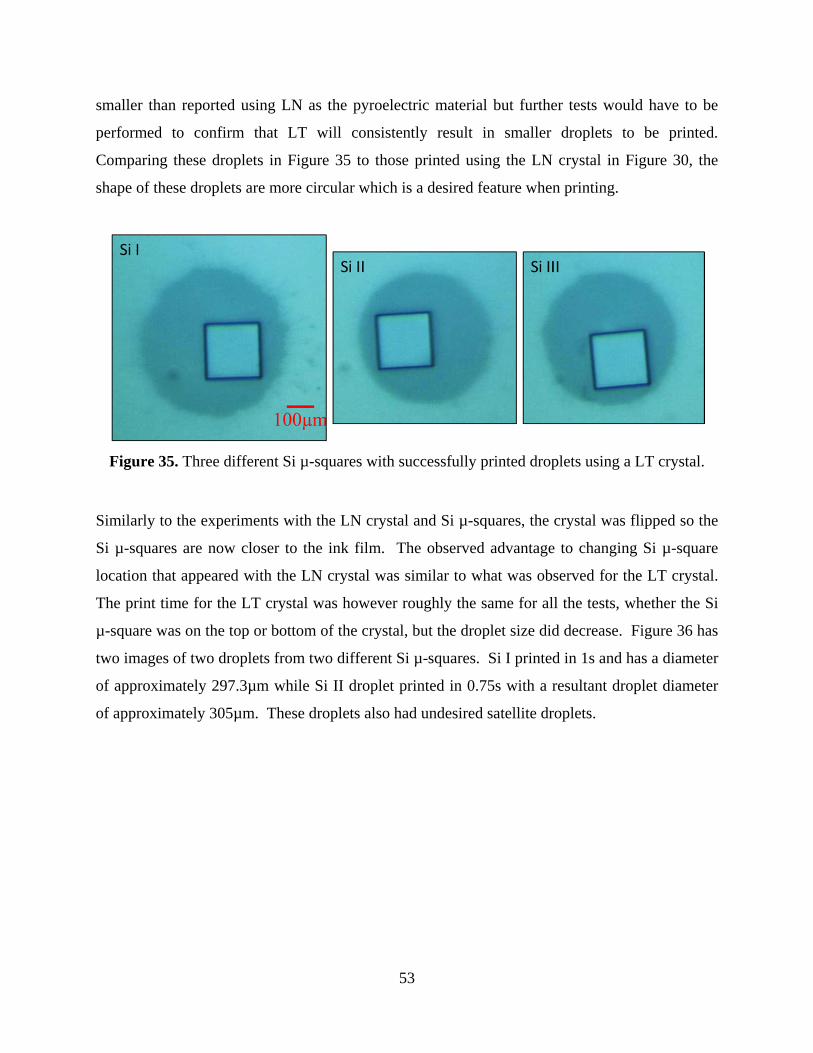
53
smaller than reported using LN as the pyroelectric material but further tests would have to be
performed to confirm that LT will consistently result in smaller droplets to be printed.
Comparing these droplets in Figure 35 to those printed using the LN crystal in Figure 30, the
shape of these droplets are more circular which is a desired feature when printing.
Figure 35. Three different Si µ-squares with successfully printed droplets using a LT crystal.
Similarly to the experiments with the LN crystal and Si µ-squares, the crystal was flipped so the
Si µ-squares are now closer to the ink film. The observed advantage to changing Si µ-square
location that appeared with the LN crystal was similar to what was observed for the LT crystal.
The print time for the LT crystal was however roughly the same for all the tests, whether the Si
µ-square was on the top or bottom of the crystal, but the droplet size did decrease. Figure 36 has
two images of two droplets from two different Si µ-squares. Si I printed in 1s and has a diameter
of approximately 297.3µm while Si II droplet printed in 0.75s with a resultant droplet diameter
of approximately 305µm. These droplets also had undesired satellite droplets.

54
Figure 36. Two Si µ-squares with successfully printed droplets using the flipped LT/Si µ-square setup.
3.7 Studying Effects of Printing Setup
Throughout the presented research, the printing stack was kept as consistent as possible so the
effects of changing the NIR absorbing and pyroelectric material could be isolated and studied.
This section discusses the few experiments performed which study the effects of changing the
printing stack with respect to the air gap, stack orientation and where the ground electrode was
placed. Optimizing the setup with respect to the above mentioned parameters of the stack
formation will most likely result in better printing performance. More experiments would need
to be performed to conclude which parameters of the stack is the most dominant factor in
successful small droplet diameter pyroelectric E-jet printing from an ink film.
3.7.1 Air Gap
To study the effects of air gap and pyroelectric E-jet printing from an ink film, the setup was
modified to allow for the glass printing substrate to be actuated in the vertical direction. The
glass spacers were eliminated, and the glass printing substrate was mounted to a z-stage. The
pyroelectric material, is lithium niobate crystal with a 200x200x10µm Si µ-square, was placed
on top of the glass printing substrate. The NOA74 ink was spun to approximately 16-20µm

55
thick. The laser was set to 10A of power, and the air gap was changed to determine the optimal
working distance to produce the smallest droplet for a 3s pulse. A 3s pulse was chosen because
from the previous experiments with a 270µm gap, a 3s pulse was required to achieve printing.
Initially the air gap was set to approximately 800µm but there were no droplets successfully
printed. A droplet was not able to be printed using a 3s pulse, but required 5s so it could be
inferred that going above 700µm would not result in a small droplet. The 5s pulse resulted in a
droplet with the diameter of approximately 630.3µm. The gap was then lowered by 100µm to a
600µm working distance and a droplet diameter of 716.67µm was printed with a 3s pulse. The
gap was further decreased to 500µm resulting in a droplet of 562.69µm in diameter. At an air
gap of 450µm, the droplet formed with a 3s pulse increased to 611.94µm but with a 2s pulse
printed a 508.96µm diameter droplet. At an air gap of both 400µm and 350µm, the droplets
printed with a 3s were very large with many satellite droplets. It is expected that for a given ink
thickness and voltage generated, there is an ideal air gap to get the smallest droplet printed.
These experiments showed that the optimal thickness for this setup of ink thickness, LN crystal
and with a 3s pulse is somewhere between 450-500µm gap. These results are consistent with
the previously reported results of printing with LN and Si µ-squares with an air gap of 270µm in
Section 3.5.3. Most of the printed droplets were circular in shape with minimal satellite droplets.
3.7.2 Stack Orientation
The stack orientation was also altered to determine if there was a better printing setup that will
result in small droplets. Figure 37 shows two alternative setups that were tested. For setup A,
the glass printing substrate was removed to allow the ink to be printed directly to the pyroelectric
material, which in this case was the LT crystal. The air gap was set to 270µm to be consistent
with most of the previously reported setups and results. Setup B has ink spun directly onto the
LT crystal surface and is roughly the same thickness as if the NOA was spun onto glass, ~16-
20µm. The air gap again is set to 270µm and the printing substrate is glass.

56
Figure 37. Alternative setups for pyroelectric E-jet printing from an ink film directly to the LT crystal (left) and printing away from the LT crystal to glass (right).
Setup A was able to print a droplet but required a longer pulse than previously reported. The
power was set to 10A and a pulse of 1.85s resulted in a 444.44µm droplet being printed but with
many satellite droplets seen in Figure 38. No droplets were printed when using setup B. Figure
39 shows three images taken after a pulse of the laser on a single 200x200x10µm Si µ-square.
As can be seen in the first image (left), there is an observed changed that grows radially out from
the Si µ-square. After the laser has been turned off and cooling occurs, the change begins to
shrink towards the Si ink and after approximately 20.5s, the effect is gone. In this case, the NOA
ink itself maybe deformed, but not in the normal profile required for printing. Instead, it seems
the ink is being pushed away from the Si µ-square forming a void of NOA ink directly
underneath the Si µ-square. It is difficult to provide a concluding remark with respect to if it is
indeed ink moving or just some heat affected stress gradients in the LT.
Figure 38. Printed droplet from Setup A and NIR laser with Si µ-square absorber.

57
Figure 39. Setup B print attempt with an image captured immediately after laser is off (left), after approximately 11s (middle) and when there is no more observed changes (right).
3.7.3 Ground Electrode Location
The location of the ground electrode was also altered in the stack orientation to see if the printing
results would vary. Initially, the ink was spun onto a silicon die and grounded, but this did not
produce any printed droplets. Indium tin oxide (ITO) was then sputtered directly onto the
pyroelectric material, LT, so the crystal itself could be grounded. ITO was chosen as an
electrode material because it is transparent in the IR range. ITO was also sputtered onto cover
glass which was used to spin NOA74. There were four setups tested and can be found in Figure
40. Once again the air gap is set to 270µm and the NOA74 ink was16-20µm thick.
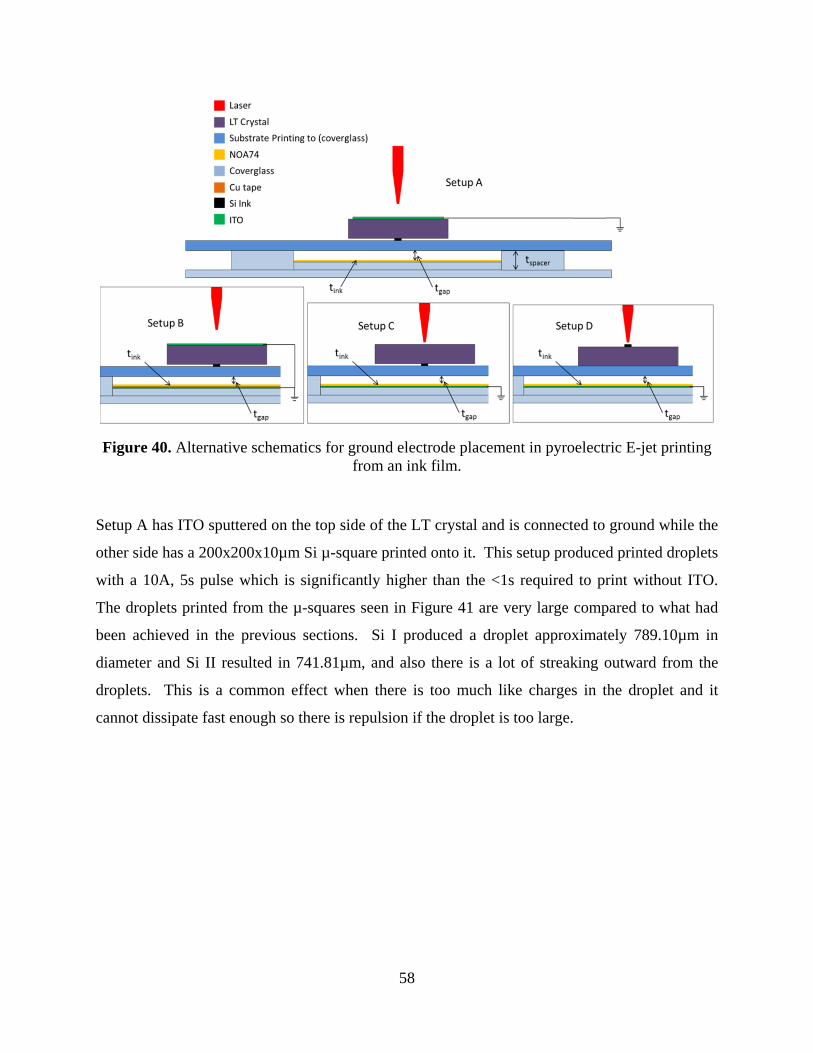
58
Figure 40. Alternative schematics for ground electrode placement in pyroelectric E-jet printing from an ink film.
Setup A has ITO sputtered on the top side of the LT crystal and is connected to ground while the
other side has a 200x200x10µm Si µ-square printed onto it. This setup produced printed droplets
with a 10A, 5s pulse which is significantly higher than the <1s required to print without ITO.
The droplets printed from the µ-squares seen in Figure 41 are very large compared to what had
been achieved in the previous sections. Si I produced a droplet approximately 789.10µm in
diameter and Si II resulted in 741.81µm, and also there is a lot of streaking outward from the
droplets. This is a common effect when there is too much like charges in the droplet and it
cannot dissipate fast enough so there is repulsion if the droplet is too large.
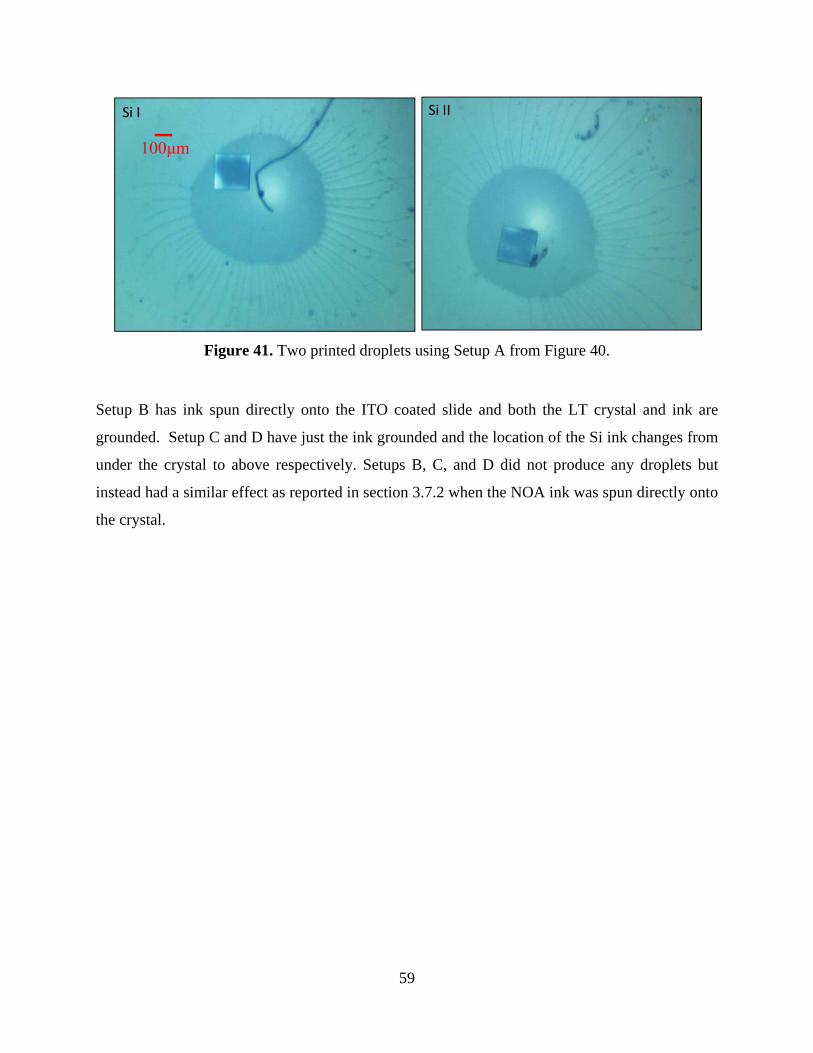
59
Figure 41. Two printed droplets using Setup A from Figure 40.
Setup B has ink spun directly onto the ITO coated slide and both the LT crystal and ink are
grounded. Setup C and D have just the ink grounded and the location of the Si ink changes from
under the crystal to above respectively. Setups B, C, and D did not produce any droplets but
instead had a similar effect as reported in section 3.7.2 when the NOA ink was spun directly onto
the crystal.

60
CHAPTER 4: CONCLUSION
The current work presented is to advance E-jet printing to a large scale manufacturing process.
Chapter 2 demonstrated a low cost print head multi-nozzle array for commercially purchased
nozzles. The goal to successful print with four nozzles with minimal variation of droplet size in
the print head was achieved. Chapter 3 explores the option of eliminating the need for physical
nozzles for E-jet printing. Preliminary experiments were performed and discussed to
demonstrate using pyroelectric physics as a promising alternative to generate the required
voltage for printing from an ink film. Since both presented E-jet advancements are proof-of-
concept, there are many directions the ongoing work can go to further improve what was
presented for manufacturing applications.
4.1. Multi-Nozzle Array E-jet Printing
4.1.1 Conclusion
For applications in manufacturing, simultaneous printing can decrease the printing time, reduce
cost, and increase output. The idea to have a linear nozzle array allows for multiple identical
images to be printed simultaneously. A potential application for E-jet MNA is to print traces on
multiple circuit boards. If the boards are identical, one could print traces on the same number of
circuit boards as there are nozzles. The spacing between nozzles can be adjusted for a custom
print head or the print head can have a number of v-grooves greater than the required number of
nozzles and then secure the nozzles in the desired groove while leaving others blank. The results
presented in this work show the consistency of a MNA print head with droplet sizes of ~2.66µm
and a standard deviation of less than 0.6µm. To decrease the standard deviation, alignment will
need to be improved, along with the optimizing the PWM printing parameters.
Currently, the largest cost of materials is the nozzles themselves. If one could pull nozzles “in
house” this could reduce the cost of a fully assembled MNA. With a $37.62/hr fiber/pipette
puller and using borosilicate thin wall glass tubes, the cost of pulling a single nozzle can be
$1.60 compared to purchasing an already pulled pipette for $12.50. This simple cost analysis is
based on the assumption that all the pulling parameters are set to produce a nozzle that matches

61
the standards from WPI (without any post processing) and it takes 5 minutes to load and unload
the glass tubes. A thorough cost analysis will need to be performed for mass production of
MNAs.
4.1.2 Future Work
Future work includes addressing the issues with nozzle alignment and minimizing the
misalignment due to human error. These proof-of-concept MNA printing experiments uses only
four nozzles, but with the ease of designing a wider print head with more grooves, up to ten
nozzles could be achieved. Before attempting to increase the number of nozzles, the alignment
issue has to be addressed to increase the probability of all the nozzles being able to print at a
given voltage. An automated alignment setup where the nozzle tips will be tracked will give the
best precision and accuracy of nozzle alignment. Currently, only one differential adjuster is used
and can only push one nozzle at a time due to size restriction. If the nozzles are pushed too far,
they have be to carefully pulled back by hand or removed from the groove and reset further back.
If the nozzles could be actuated both forward and backwards, then better alignment can be
achieved.
Since the MNA never went above four nozzles, more research will need to be conducted to study
the effects of increasing the number of nozzles simultaneously printing with a single power
supply. There were no differences in initial jetting voltage of an individual nozzle to when the
whole array was printing with four nozzles. If higher density print heads are to be fabricated,
this will most likely become a more dominant issue. If currently delivery from a single power
supply is not an issue, work can be done to increase the linear array to up to ten nozzles or
develop a 2D array such as a four by four nozzle array.
An additional future effort is to have a single power supply and function generator power all four
nozzles, but be able to print different images with each nozzle, given the printed image area is
the same. This will require more electrical work with extensive research into controls to be able
to delay a signal to only certain nozzles to get the desired printed images. This would result in
different images to be printed in a given area. Since the focus of this work is to be able to
increase throughput by printing multiple images of the same pattern, this was not studied.

62
4.2 Nozzle-less Printing Using Pyroelectricity
4.2.1 Conclusion
The best and most successful printing results were produced using a laser as a heat source for
nozzle-less printing. By eliminating the need for a physical heat source such as the soldering
iron or the resistive heater coil, any stress that is induced by the contact or weight of the heaters
is eliminated. A laser also offers the advantage of precisely controlling the power and the pulse
duration to find either the minimum power or time required to print a desired size droplet.
It is experimentally determined that from the three NIR absorbing materials mentioned in
Section 3.5, the implantation of Si µ-squares as an absorber when printing with non NIR
absorbing pyroelectric materials is preferred. Not only did the Si µ-squares produce the smallest
droplets but there was less variation in the actual Si µ-squares themselves. These Si µ-squares
are batch fabricated and can be printed essentially anywhere directly on the pyroelectric material
surface. The only challenge to using the Si µ-squares is that nozzle-less printing from the ink
film is limited to where the µ-squares are placed on the pyroelectric material.
It can be concluded for the purpose of applying pyroelectricity to E-jet printing that using a
material with a high pyroelectric coefficient is desired. Using a material with a higher
coefficient decreases the printing time which is a major goal for current E-jet printing. From the
presented work in Section 3.6, lithium tantalate would be the material of choice out of the three
tested to use for further experiments. The material properties of the pyroelectric material such as
heat capacity, thermal expansion, conductivity, and other thermal quantities were not studied in
the presented work but should be taken into consideration when selecting a pyroelectric material.
With respect to the actual printing stack setup discussed in Section 3.7, there is an optimal air
gap for a given ink thickness and pyroelectric material. Once the optimal printing air gap is
determined, if the ink thickness can be kept constant while printing, then the stack can be built
without alterations. The stack orientation and location of the grounded electrode does make a
significant difference when printing from an ink film. By removing the glass printing substrate
and printing directly onto the pyroelectric material, it is concluded that there is not a significant

63
loss of charge within the glass. The location of a grounded material is important in that it should
not be placed on the surface closest to the ink film or else the surface charge will be depleted
instantly. No droplets were printed when the ink itself was grounded but the pyroelectric
material introduces undesired effects of larger droplets with satellite droplets when it was
grounded.
4.2.2 Future Work
The geometry of the Si µ-square was not explored because the readily available dies were
square. Circular Si µ-dies can be used to eliminate the possible side effects of printing with a
square. The expectations are with a circle, there is better uniform heating and will result in a
droplet printing centered to the Si µ-circle die. The proximity limit for the Si µ-square
placement to produce small circular droplets was not explored in this work. For applications in
manufacturing, these experiments would have to be done to create a high density array of Si µ-
squares on a pyroelectric surface. As mentioned in Section 3.5.3, it appeared that the Si µ-
squares did not all have the same adhesion to the pyroelectric material so a topic for future work
can also include developing a process to ensure good thermal contact between the two surfaces.
Besides the pyroelectric response, the actual material properties of the pyroelectric element
should be studied. Even though the material is not clamped and the mechanical response is not
of interest, the dielectric coefficient, thermal expansion, heat capacity and other values are most
likely responsible for the large difference in printing with a Si ink on the top or bottom of the LN
crystal as opposed to the LT crystal where the print time was almost the same. Both of the
crystals were 500µm thick, but the trend of decreasing time was not the same or proportional for
both materials. If the work is to be continued with the current setup, a transparent pyroelectric
material will be needed to give feedback of successful printing. There are many other crystals
that are pyroelectric but have different point symmetries which is another parameter that can be
studied.
Due to the ink film being so thin, there is an optimal thickness desired which will overcome the
boundary effects of thin films. If the ink is too thin, then the surface tension is too high and the
ink will have difficultly deforming into a small peak. If the ink film is too thick, then the

64
deformed profile will be large and a large droplet will be printed. Preliminary experiments were
performed but not presented for changing the ink thickness and also the ink property. More
studies will need to be performed to provide concluding remarks on the ink properties and how it
affects printing. A fluid dynamics calculation can be performed to determine if an ink film is too
thin and the boundary layer effect is dominate preventing the movement of ink to deform into a
Taylor cone. Studying the fluid dynamics could also provide insight to the exact reason why a
liquid bridge is formed instead of printed droplets for a given setup. For a given temperature, it
is expected that printing is uniform but there may be some variation in ink film thickness which
most likely contributes to a liquid bridge forming.
Printing from an ink film using pyroelectrics discussed in this Thesis is essentially applying a
point source of voltage and deforming a thin liquid. How a thin film of ink deforms when a
point charge is introduced into the system should also be studied for future work to further the
understanding of what has been presented. Some preliminary experiments were performed with
applying a high voltage to an Au/Pd glass pulled rod and capturing how an ink film deforms.
The goal is to simplify the setup to isolate different variables when trying to print. By applying a
known voltage to an electrode, the ink film and air gap can be studied. These results can then be
compared to the pyroelectric printing experiments to optimistically provide insight on how the
pyroelectric material affects printing. Currently using the laser as the heat source and Si µ-
squares as the NIR absorbers, the amount of heat generated and therefore the amount of voltage
produced is unknown. Ideally a model would be generated to study this generation of charge,
but with the simplified printing setup, if the air gap and thickness are set identically to a given
pryoelectric experiment, the voltage required to pull the ink and print can be determined and then
the corresponding temperature can be calculated with equations and relationships provided in the
literature for pyroelectric materials.

65
REFERENCES
1. Park, J.-U., et al., High-resolution electrohydrodynamic jet printing. Nature Materials, 2007. 6(10): p. 782-789.
2. Pikul, J.H., et al., High precision electrohydrodynamic printing of polymer onto microcantilever sensors. IEEE Sensors Journal, 2011. 11(10): p. 2246-2253.
3. Poellmann, M.J., et al., Patterned Hydrogel Substrates for Cell Culture with Electrohydrodynamic Jet Printing. Macromolecular Bioscience, 2011. 11(9): p. 1164-1168.
4. Sutanto, E., et al., A multimaterial electrohydrodynamic jet (E-jet) printing system. Journal of Micromechanics and Microengineering, 2012. 22(4): p. 11.
5. Lee, S., et al., Patterned oxide semiconductor by electrohydrodynamic jet printing for transparent thin film transistors. Applied physics letters, 2012. 100(10).
6. Shigeta, K., et al., Functional Protein Microarrays by Electrohydrodynamic Jet Printing. Analytical chemistry, 2012.
7. Choi, K.-H., et al., Effects of nozzles array configuration on cross-talk in multi-nozzle electrohydrodynamic inkjet printing head. Journal of electrostatics, 2011. 69(4): p. 380-387.
8. Quang Tran Si, B., B. Doyoung, and L. Sukhan, Experimental and theoretical study of a cone-jet for an electrospray microthruster considering the interference effect in an array of nozzles. Journal of aerosol science, 2007. 38(9): p. 924-934.
9. Hayati, I., A.I. Bailey, and T.F. Tadros, Mechanism of stable jet formation in electrohydrodynamic atomization. Nature, 1986. 319(6048): p. 41-43.
10. Lee, J.-S., et al. Electrohydrodynamic Jet Printing Capable of Removing Substrate Effects and Modulating Printing Characteristics. in Micro Electro Mechanical Systems, 2009. MEMS 2009. IEEE 22nd International Conference on. 2009.
11. Taylor, G., Electrically Driven Jets. Proceedings of The Royal Society London A, 1969. 313(1515): p. 453-475.
12. Mishra, S., et al., High-speed and drop-on-demand printing with a pulsed electrohydrodynamic jet. Journal of micromechanics and microengineering, 2010. 20(9): p. 8.
13. Choi, H.K., et al., Scaling laws for jet pulsations associated with high-resolution electrohydrodynamic printing. Applied physics letters, 2008. 92(12).
14. Park, J.-U., et al., Nanoscale, electrified liquid jets for high-resolution printing of charge. Nano letters, 2010. 10(2): p. 584-591.
15. Park, J.-U., et al., Nanoscale patterns of oligonucleotides formed by electrohydrodynamic jet printing with applications in biosensing and nanomaterials assembly. Nano letters, 2008. 8(12): p. 4210-4216.
16. Khan, A., et al., Multi-nozzle electrohydrodynamic inkjet printing of silver colloidal solution for the fabrication of electrically functional microstructures. Applied physics. A, Materials science & processing, 2011. 104(4): p. 1113-1120.
17. Khan, A., et al., Direct printing of copper conductive micro-tracks by multi-nozzle electrohydrodynamic inkjet printing process. Journal of materials processing technology, 2012. 212(3): p. 700-706.
18. Lang, S.B., Pyroelectricity: From ancient curiosity to modern imaging tool. Physics today, 2005. 58(8): p. 31-36.

66
19. Lee, M.H., R. Guo, and A.S. Bhalla, Pyroelectric sensors. Journal of electroceramics, 1998. 2(4): p. 229-242.
20. Caley, E.R. and J.F.C. Richards, eds. Theophrastus on stones: introduction, greek text, english translation, and commentary. 1956, Literary Licensing, LLC: Columbus, Ohio State University.
21. Rosenblum, B., P. Braunlich, and J.P. Carrico, Thermally stimulated field-emission from pyroelectric LiNbO3. Applied physics letters, 1974. 25(1): p. 17-19.
22. Rosenman, G., et al., Electron emission from ferroelectrics. Journal of applied physics, 2000. 88(11): p. 6109-61.
23. Saeidpourazar, R., et al., A prototype printer for laser driven micro-transfer printing. Journal of manufacturing processes, 2012. 14(4): p. 416-424.
24. Whatmore, R.W., Pyroelectric devices and materials. Reports on progress in physics, 1986. 49(12): p. 1335-1386.
25. Coppola, S., et al. Dispensing and manipulation of nano-drops by pyro-EHD (electro-hydro-dynamic) effect. in BioPhotonics, 2011 International Workshop on. 2011.
26. Li, R., et al., Thermo-mechanical modeling of laser-driven non-contact transfer printing: Two-dimensional analysis. Soft matter, 2012. 8(27): p. 7122-7127.
27. Saeidpourazar, R., et al., Laser-Driven Micro Transfer Placement of Prefabricated Microstructures. Journal of Microelectromechanical Systems, 2012. 21(5): p. 1049-1058.