minding the gap: identifying risk profiles of first-time entrants for the diploma of nature...
TRANSCRIPT
Minding the gap: Identifying risk Minding the gap: Identifying risk profiles of first-time entrants for profiles of first-time entrants for
the Diploma of Nature the Diploma of Nature Conservation at the Cape Conservation at the Cape Peninsula University of Peninsula University of
TechnologyTechnology
Dr Bruce Mckenzie and Dr Joseph KiokoDr Bruce Mckenzie and Dr Joseph Kioko
Department of Biodiversity and ConservationDepartment of Biodiversity and ConservationCPUTCPUT
THE CHALLENGETHE CHALLENGE LESS THAN 20% OF THE 60 FIRST TIME ENTRANTS LESS THAN 20% OF THE 60 FIRST TIME ENTRANTS
COMPLETE THE DIPLOMA IN THE MINIMUM TIMECOMPLETE THE DIPLOMA IN THE MINIMUM TIME
FEWER THAN 50% EVER COMPLETE THE DIPLOMAFEWER THAN 50% EVER COMPLETE THE DIPLOMA
GOOD CORRELATION BETWEEN EXTENDED CURRICULUM GOOD CORRELATION BETWEEN EXTENDED CURRICULUM STUDENTS AND MAINSTREAM STUDENTS IN TERMS OF STUDENTS AND MAINSTREAM STUDENTS IN TERMS OF SUCCESS (OR FAILURE) AT THE END OF THE FIRST YEARSUCCESS (OR FAILURE) AT THE END OF THE FIRST YEAR
CAN RISK PROFILES BE IDENTIFIED TO INFORM CAN RISK PROFILES BE IDENTIFIED TO INFORM THE DEPARTMENT IN TERMS OF PLACEMENT OF THE DEPARTMENT IN TERMS OF PLACEMENT OF STUDENTS IN PROGRAMMES, AND THE FORM OF STUDENTS IN PROGRAMMES, AND THE FORM OF CURRICULUM DELIVERY, THUS INCREASING THE CURRICULUM DELIVERY, THUS INCREASING THE POTENTIAL FOR AN ENHANCED THROUGHPUT POTENTIAL FOR AN ENHANCED THROUGHPUT RATE ?RATE ?
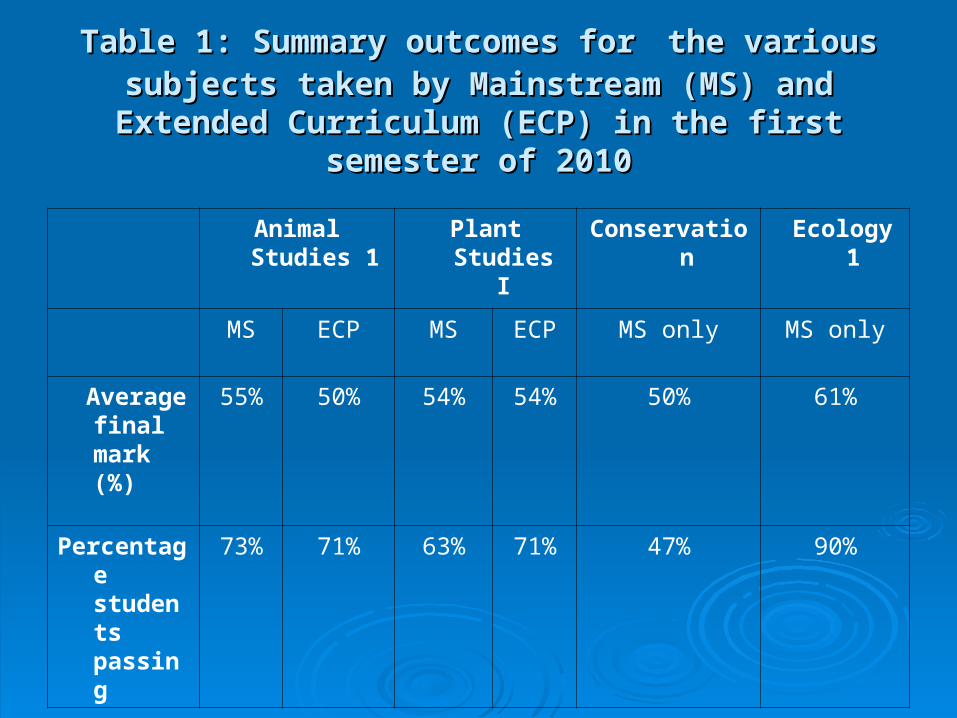
Table 1: Summary outcomes forTable 1: Summary outcomes for the various subjects the various subjects taken by Mainstream (MS) and Extended Curriculum taken by Mainstream (MS) and Extended Curriculum
(ECP) in the first semester of 2010(ECP) in the first semester of 2010
Animal Studies 1 Plant Studies I Conservation
Ecology 1
MS ECP MS ECP MS only MS only
Average final mark (%)
55% 50% 54% 54% 50% 61%
Percentage students passing
73% 71% 63% 71% 47% 90%
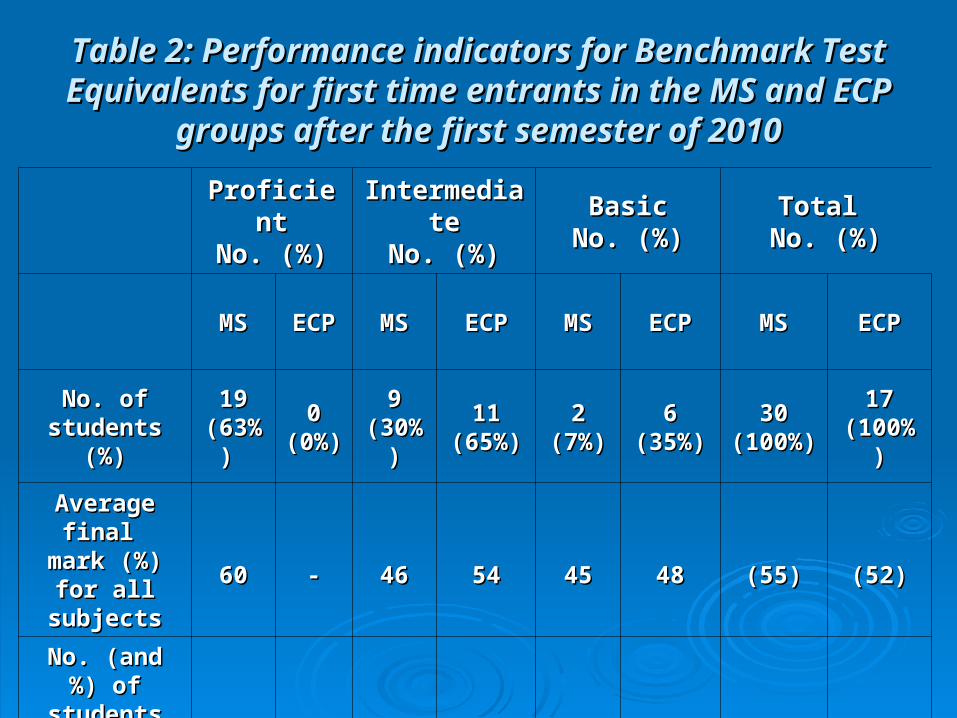
Table 2: Performance indicators for Benchmark Test Table 2: Performance indicators for Benchmark Test Equivalents for first time entrants in the MS and ECP Equivalents for first time entrants in the MS and ECP
groups after the first semester of 2010groups after the first semester of 2010
ProficientProficientNo. (%)No. (%)
IntermediateIntermediateNo. (%)No. (%)
BasicBasicNo. (%)No. (%)
Total Total No. (%)No. (%)
MSMS ECPECP MSMS ECPECP MSMS ECPECP MSMS ECPECP
No. of students No. of students (%)(%)
19 19 (63%) (63%)
00(0%)(0%)
99(30%)(30%)
1111(65%)(65%)
22(7%)(7%)
66(35%)(35%)
3030(100%)(100%)
1717(100%)(100%)
Average final Average final mark (%) for mark (%) for
all subjectsall subjects6060 -- 4646 5454 4545 4848 (55)(55) (52)(52)
No. (and %) of No. (and %) of students students
passing >50% passing >50% of subjects(%)of subjects(%)
1616(84%)(84%)
--22
(22%)(22%)77
(64%)(64%)00
(0%)(0%)22
(33%)(33%)1818
(60%)(60%)99
(53%)(53%)

SUMMARYSUMMARY
PROFICIENT PROFICIENT 40% of student intake, 40% of student intake, all in mainstream.all in mainstream.
INTERMEDIATEINTERMEDIATE 43% of student intake, 43% of student intake, equally divided equally divided
between MS and ECPbetween MS and ECP
BASICBASIC 17%, majority in ECP 17%, majority in ECP
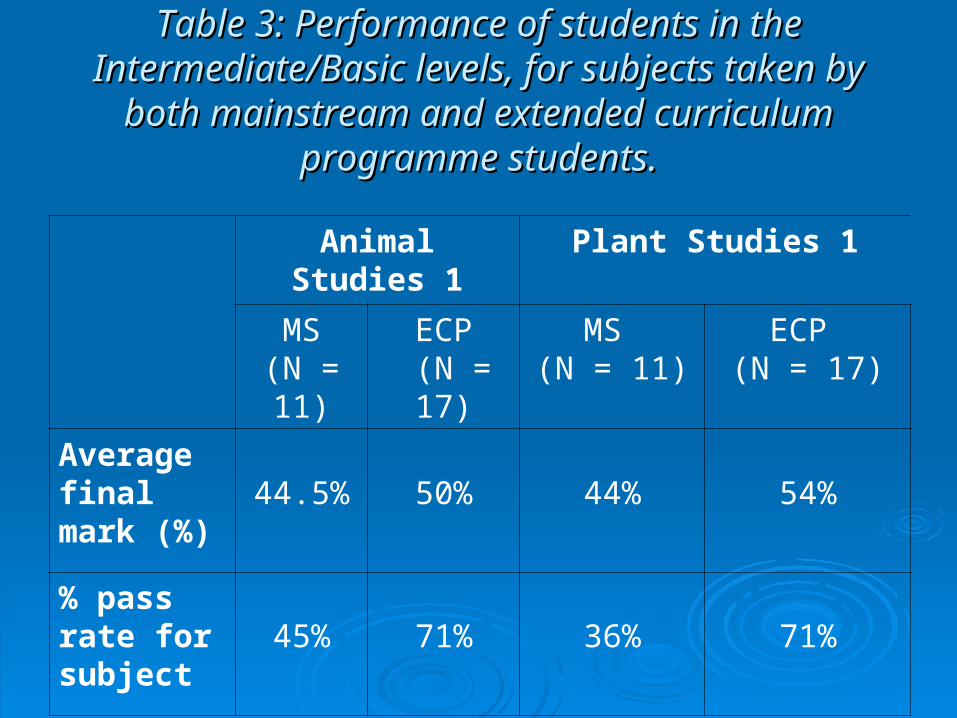
Table 3: Performance of students in the Table 3: Performance of students in the Intermediate/Basic levels, for subjects taken by Intermediate/Basic levels, for subjects taken by
both mainstream and extended curriculum both mainstream and extended curriculum programme students.programme students.
Animal Studies 1 Plant Studies 1
MS(N = 11)
ECP (N = 17)
MS (N = 11)
ECP (N = 17)
Average final mark (%)
44.5% 50% 44% 54%
% pass rate for subject 45% 71% 36% 71%

Table 4: Average ratings for three required Table 4: Average ratings for three required matriculation subjectsmatriculation subjects
NBT levelNBT level PERCENTAGE PERCENTAGE OF OF
SUBJECTSSUBJECTSPASSEDPASSED
MS/ MS/ ECPECP
NSC achievement in required subjectNSC achievement in required subject
ENGLISHENGLISH LIFE LIFE SCIENCESSCIENCES
MATHSMATHS AVERAGEAVERAGE
ProficientProficient 75% or more75% or more MSMS 5.35.3 55 4.54.5 55
ECPECP N/AN/A N/AN/A N/AN/A N/AN/A
Intermediate Intermediate and and
BasicBasic
75% or more75% or more MSMS 55 4.54.5 3.53.5 44
ECPECP 4.64.6 3.93.9 2.52.5 3.753.75
Intermediate Intermediate and and
BasicBasic
50% or less50% or less MSMS 55 4.54.5 3.53.5 44
Intermediate Intermediate and and
BasicBasic
50% or less50% or less ECPECP 44 3.13.1 2.12.1 3.33.3
Requirements for the DiplomaRequirements for the Diploma 44 44 33

SUMMARY TO DATESUMMARY TO DATE
Proficient level requires students to Proficient level requires students to perform 10% (1 score) better than the perform 10% (1 score) better than the present Departmental requirements for present Departmental requirements for acceptanceacceptance
Intermediate level requires that students Intermediate level requires that students on MS need matric scores of 5% > than on MS need matric scores of 5% > than requirements for Life Science and for ECP requirements for Life Science and for ECP students they need to meet the minimum students they need to meet the minimum

IDENTIFYING RISKIDENTIFYING RISK PROFILESPROFILES
All first time entrants were placed in one of All first time entrants were placed in one of three RISK PROFILES based on all the three RISK PROFILES based on all the above analyses and using their matric above analyses and using their matric scores for the relevant subjectsscores for the relevant subjects
The present distribution of the 60 first time The present distribution of the 60 first time entrants and the preferred placement of entrants and the preferred placement of them are shown in the next tablethem are shown in the next table

Table 5: Present and preferred placement of 2010 Table 5: Present and preferred placement of 2010 first time entrants (N = 60) based on at risk first time entrants (N = 60) based on at risk
categoriescategories Risk profile based on Matric scores
Percentageof Students at
Present
StudentNumbers as at
present
PreferredPlacement of present
students
MS ECP MS ECP MS ECP
Low Risk 53%
41%
21
8
21 20
Medium Risk 40%
24%
16
5
3 16
High Risk 7%
35%
3
7
0 0
Total 100%
100%
40
20
24
36

SUMMARYSUMMARY
If the class size for new entrants remains If the class size for new entrants remains at 60 students then;at 60 students then;
About 21(35%) should be About 21(35%) should be LOW RISK LOW RISK in MSin MS
About 20 (33%) should be About 20 (33%) should be LOW RISKLOW RISK ECP ECP
About 19 (32%) should be at About 19 (32%) should be at MEDIUM RISKMEDIUM RISK either on MS or ECPeither on MS or ECP

CONCLUSIONSCONCLUSIONS To increase throughput generally and more To increase throughput generally and more
specifically in the minimal time the following are specifically in the minimal time the following are suggested:suggested:
In the In the short termshort term about half the first year intake of about half the first year intake of mainstream students should be given extra support mainstream students should be given extra support similar to the ECP type programmesimilar to the ECP type programme
In the In the longer termlonger term serious consideration should be serious consideration should be given to placing up to 60% of the first time intake on a given to placing up to 60% of the first time intake on a four year programme with the ECP model catering for four year programme with the ECP model catering for this groupthis group