mire element collection mechanisms and gap analysis · pdf filemire element collection...
TRANSCRIPT

MIRE Element Collection Mechanisms and Gap Analysis
FHWA Safety Program
http://safety.fhwa.dot.gov
FOREWORD
The Federal Highway Administration's (FHWA 's) Highway Safety Improvement Program (HSIP) is a data driven program that relies on crash, roadway, and traffic data for States to conduct effective analyses for problem identification and evaluation. The FHWA developed the Model Inventory of Roadway Elements (MIRE) to provide a recommended listing and data dictionary of roadway and traffic data elements cri tical to supporting highway safety management programs. MIRE is intended to help support the states' HSIPs and other safety programs.
The MIRE Management Information System (MI RE-MIS) was a project to explore better means of collecting MIRE data elements, using and integrating the data and identifyi ng optimal data file structures. The resulting products include reports on the findings from the MIRE-MIS Lead Agency Program, a MIRE Guidebook on the collection of MIRE, a suggested MIRE data file structure report and a report on Metrics to Assess Quality that will assist the states in conducting a more effective safety program. The intent of the MIRE-MIS project is the integration of MIRE into States' safety management processes.
The MIRE Element Collection Mechanisms and Gap Analysis report is one of the products of the MIRE-MIS effort This document presents the findings of the effort to explore existing and emerging data collection technologies to narrow the gaps between the elements in the MIRE li sting and the current data available from agencies' inventories and supplementa l databases. This report will provide data managers and collectors with potential techniques for advancing future data collection of roadway and traffic inventory data.
Michael S. Griffith Director, Office of Safety Technologies
Monique R. Evans Director, Office of Safety Research and Development

ii
Notice
This document is disseminated under the sponsorship of the U.S. Department of Transportation in the interest of information exchange. The U.S. Government assumes no liability for the use of the information contained in this document.
The U.S. Government does not endorse products or manufacturers. Trademarks or manufacturers’ names appear in this report only because they are considered essential to the objective of the document.
Quality Assurance Statement
The Federal Highway Administration (FHWA) provides high-quality information to serve Government, industry, and the public in a manner that promotes public understanding. Standards and policies are used to ensure and maximize the quality, objectivity, utility, and integrity of its information. FHWA periodically reviews quality issues and adjusts its programs and processes to ensure continuous quality improvement.

iii
TECHNICAL DOCUMENTATION PAGE 1. Report No. FHWA-SA-11-49
2. Government Accession No.
3. Recipient's Catalog No.
4. Title and Subtitle MIRE Element Collection Mechanisms and Gap Analysis
5. Report Date September 2012
6. Performing Organization Code
7.Author(s) Jagannath Mallela, Suri Sadasivam, and Nancy Lefler
8. Performing Organization Report No.
9. Performing Organization Name and Address Applied Research Associates 4300 San Mateo Blvd. NE, Suite A-220 Albuquerque, NM 87110 Vanasse Hangen Brustlin, Inc (VHB) 8300 Boone Blvd., Suite 700 Vienna, VA 22182-2626
10. Work Unit No.
11. Contract or Grant No. DTFH61-05-D-00024 (VHB)
12. Sponsoring Agency Name and Address Federal Highway Administration Office of Safety 1200 New Jersey Ave., SE Washington, DC 20590
13. Type of Report and Period Final Report, August 2009 – September 2012
14. Sponsoring Agency Code FHWA
15. Supplementary Notes The contract managers for this report were Dr. Carol Tan (HRDS-06) and Robert Pollack (HSA).
16. Abstract
Quality data are the foundation for making important decisions regarding the design, operation, and safety of roadways. FHWA developed the Model Inventory of Roadway Elements (MIRE) to provide a recommended model of what a comprehensive roadway and traffic data inventory should be for effective safety management. A critical step toward acceptance and implementation of MIRE is the conversion of MIRE, which is now a listing of variables, into a Management Information System (MIS). This report provides an assessment of State highway agencies’ roadway inventory data collection practices, identifying gaps in current practices and providing recommendations for filling those gaps in order to support the MIRE MIS effort.
17. Key Words: safety data, MIRE, MIS, roadway inventory data, traffic data, data collection
18. Distribution Statement No restrictions.
19. Security Classif. (of this report) Unclassified
20. Security Classif. (of this page) Unclassified
21. No. of Pages 59
22. Price
Form DOT F 1700.7 (8-72) Reproduction of completed pages authorized

51* (MODERN METRIC) CONVERSION FACTORS APPROXIMATE CONVERSIONS TO Sl UNITS
Symbol When You Know Multiply By To Find Symbol LENGTH
in inches 25.4 millimeters mm ft feet 0.305 meters m yd yards 0.914 meters m mi miles 1.61 kilometers km
in2 ft2 yd2
square inches square feet square yard
AREA 645.2 square millimeters
0.093 square meters 0.836 square meters
2 mmm2 m2
ac mi2
acres square miles
0.405 hectares 2.59 square kilometers
ha km2
VOLUME fl oz fluid ounces 29.57 milliliters ml gal ft3
gallons cubic feet
3.785 liters 0.028 cubic meters
L m3
yd3 cubic yards 0.765 cubic meters 3 NOTE: volumes greater than 1000 L shall be shown in m
m3
MASS oz ounces 28.35 grams g lb pounds 0.454 kilograms kg T short tons (2000 lb) 0.907 megagrams (or "metric ton") Mg (or''t")
OF Fahrenheit TEMPERATURE (exact degrees)
5 (F-32)/9 Celsius oc or (F-32)/1.8
ILLUMINATION fc fl
foot-candles 10.76 lux foot-Lamberts 3.426 candela/m2
lx cd/m2
FORCEandPRESSUREorSTRESS lbf
2 lbf/inpoundforce 4.45 newtons poundforce per square inch 6.89 kilopascals
N kPa
APPROXIMATE CONVERSIONS FROM Sl UNITS Symbol When You Know Multiply By To Find Symbol
LENGTH mm millimeters 0.039 inches in m meters 3.28 feet ft m meters 1.09 yards yd km kilometers 0.621 miles mi
2 mmm2 m2
AREA square millimeters 0.0016 square inches square meters 10.764 square feet square meters 1.195 square yards
in2 ft2 yd2
ha km2
hectares 2.47 acres square kilometers 0.386 square miles
ac mi2
VOLUME ml milliliters 0.034 fluid ounces fl oz L m3
liters 0.264 gallons cubic meters 35.314 cubic feet
gal ft3
m3 cubic meters 1.307 cubic yards yd3
MASS g grams 0.035 ounces oz kg kilograms 2.202 pounds lb Mg (or "t") megagrams (or "metric ton") 1.103 short tons (2000 lb) T
oc TEMPERATURE (exact degrees)
Celsius 1.8C+32 Fahrenheit OF
ILLUMINATION IX lux 0.0929 foot-candles fc
2 cd/m 2 candela/m 0.2919 foot-Lamberts fl
FORCEandPRESSUREorSTRESS N kPa
newtons kilopascals
0.225 poundforce 0.145 poundforce per square inch
lbf 2 lbf/in
' SI IS the symbol lor the International System or Units. Appropnate round1ng should be made to comply w1th Sect1on 4 or ASTM E380. (ReVISed March 2003)
iv

v
TABLE OF CONTENTS
EXECUTIVE SUMMARY ................................................................................................ IX
CHAPTER 1: BACKGROUND......................................................................................... 1
CHAPTER 2: MODEL INVENTORY OF ROADWAY ELEMENTS ............................ 3
CHAPTER 3: MIRE MANAGEMENT INFORMATION SYSTEM ................................ 5
CHAPTER 4: REVIEW OF DATA INVENTORIES OF STATE DOTS ....................... 6
HSIS and Non-HSIS Data Inventories .....................................................................................................7
Summary of MIRE Workshop Polls ...................................................................................................... 11
NCHRP Safety Data Collection Survey .............................................................................................. 14
HPMS Data Inventory .............................................................................................................................. 14
Gap Analysis of MIRE Data Elements .................................................................................................. 18
CHAPTER 5: POTENTIAL SUPPLEMENTAL DATA SOURCES ............................ 22
Pavement Management Systems ........................................................................................................... 22
Roadway Hardware Management Systems ......................................................................................... 24
Supplemental Databases ......................................................................................................................... 27
CHAPTER 6: TECHNOLOGIES FOR COLLECTION OF ROADWAY INVENTORY DATA ....................................................................................................... 29
Need for Advanced Technologies ........................................................................................................ 29
Data Collection and Presentation Technologies ............................................................................... 29
Use of Automation in Roadway Inventory Data Collection .......................................................... 35
CHAPTER 7: COMPATIBILITY OF COLLECTION TECHNOLOGIES WITH MIRE ROADWAY ELEMENTS ................................................................................................ 38
CHAPTER 8: CONCLUSIONS AND RECOMMENDATIONS .................................. 53
Recommendations .................................................................................................................................... 55
REFERENCES .................................................................................................................. 56

vi
LIST OF TABLES
Table 1. Number of MIRE elements in HSIS State databases. ................................................................ 9 Table 2. Number of MIRE elements in non-HSIS State databases. ..................................................... 10 Table 3. MIRE workshop poll summary for roadway segment descriptors. .................................... 12 Table 4. MIRE workshop poll summary for roadway alignment descriptors. .................................. 13 Table 5. MIRE workshop poll summary for roadway junction descriptors. ..................................... 13 Table 6. Commonality between the HPMS dataset and MIRE. ........................................................... 17 Table 7. Number of States that have an inventory and tracking system for roadway hardware assets. ............................................................................................................................................................... 24 Table 8. State collection of roadway hardware asset inventory. ........................................................ 26 Table 9. Inventory of selected assets. ....................................................................................................... 27 Table 10. Number of agencies using automated pavement distress data collection. ..................... 36 Table 11. Potential of technologies to collect MIRE elements. ........................................................... 40
LIST OF FIGURES
Figure 1. Frequency of data elements in pavement management inventory. ................................... 23 Figure 2. Frequency of pavement condition data availability. ............................................................... 23 Figure 3. Methods used for original inventory of roadway hardware assets. .................................. 25 Figure 4. Schematic representation of the airborne LIDAR system. ................................................. 31 Figure 5. Caltrans DHIPP image showing roadway features. ............................................................... 35

vii
ACRONYMS
3D Three-dimensional
AADT Average annual daily traffic
AASHTO American Association of State Highway and Transportation Officials
AHMCT Advanced Highway Maintenance and Construction Technology Research Center
C&P Condition and performance
Caltrans California Department of Transportation
CARMS Centre for Applied Remote Sensing, Modeling, and Simulation
CFR Code of Federal Regulations
DHIPP Digital Highway Inventory Photography Program
DHMS Digital Highway Measurement System
DMI Distance measuring instruments
DOT Department of Transportation
EGM96 Earth Gravitational Model of 1996
FDE Fundamental Data Elements
FHWA Federal Highway Administration
G-Rail Guardrail Management System
GIS Geographic information system
GPS Global positioning system
HMMS Highway Maintenance Management System
HOV High-occupancy vehicle
HPMS Highway Performance Monitoring System
HSIP Highway Safety Improvement Program
HSIS Highway Safety Information System
HSM Highway Safety Manual
ICAS Inventory and Condition Assessment System
INS Inertial navigation systems
IRI International Roughness Index

viii
KML Keyhole Markup Language
LIDAR Light detection and ranging
MIRE Model Inventory of Roadway Elements
MIS Management information system
MMS Maintenance management system
MMUCC Model Minimum Uniform Crash Criteria
N.A. No additional collection needed
NASA National Aeronautics and Space Administration
NCHRP National Cooperative Highway Research Program
NHS National Highway System
OAV Oblique Aerial View
PMS Pavement management system
PSR Pavement Serviceability Rating
RFI Road Feature Inventory
RFIP Roadside Features Inventory Program
STRAHNET Strategic Highway Network
TIAMS Transportation infrastructure asset management system
TMG Traffic Monitoring Guide
TMS Traffic Monitoring System
WGS84 World Geodetic System of 1984
XML Extensive Markup Language

MIRE ELEMENT COLLECTION MECHANISMS AND GAP ANALYSIS
ix
EXECUTIVE SUMMARY
The Highway Safety Improvement Program (HSIP) is a core program of the Federal Highway Administration (FHWA) and the agency’s principal safety program. The HSIP requires that States use a data-driven process in selecting and implementing effective countermeasures for reducing fatalities and serious injuries on public roads. Regulations governing the HSIP (23 Code of Federal Regulations [CFR] Part 924) specify that the HSIP planning process shall incorporate the collection and analyses of crash, roadway, and traffic data on all public roads (1). Crash data have long been a key component of State safety planning processes. However, fewer States have demonstrated an ability to integrate roadway inventory and traffic data with crash data to conduct more effective safety analyses for their safety programs.
The FHWA recognizes that current trends of constrained resources, competing priorities, and shrinking workforces will likely be the norm for at least the near future. States will need to find better ways to identify, prioritize, and treat safety problems to address these issues. One potential solution is for States to enhance their capabilities regarding the collection, maintenance and use of roadway data as part of normal business practices.
The FHWA encourages States to collect and use roadway inventory and traffic data in their analytical processes for safety and other transportation programs. Several tools and methodologies are available to conduct more rigorous approaches for traffic safety analyses and countermeasure selection. These include tools developed at the national level such at the Highway Safety Manual (HSM) (2), as well as many tools that States have developed in-house. These tools require detailed crash, roadway, and traffic data to achieve the most accurate results. The FHWA developed the Model Inventory of Roadway Elements (MIRE) to provide a recommended listing and data dictionary of roadway and traffic data elements critical to supporting highway safety management programs (3). For cases where resource limitations prohibit the collection of the total list of MIRE data elements on all public roads, FHWA issued the “Guidance Memorandum on Fundamental Roadway and Traffic Data Elements to Improve the Highway Safety Improvement Program” on August 1, 2011 (4). This memorandum identifies a subset of MIRE elements - the Fundamental Data Elements (FDE) - that FHWA recommends States collect to help support their safety programs. This guidance notwithstanding, FHWA still recommends that States collect as many of the MIRE data elements as possible on as many roadways as possible.
MIRE MIS PROJECT
To assist States in developing and integrating the MIRE into a management information system structure that will provide greater utility in collecting, maintaining, and using MIRE data, FHWA has undertaken the MIRE Management Information System (MIRE MIS) project.

MIRE ELEMENT COLLECTION MECHANISMS AND GAP ANALYSIS
x
This report provides an assessment of State highway agencies’ roadway inventory data collection practices, identifying gaps in current practices and providing recommendations for filling those gaps in order to support States’ implementation of the MIRE MIS. The research team assessed State roadway inventory data collection practices by reviewing Highway Safety Information Systems (HSIS) data from nine States and roadway inventory databases from 14 States. The results of this review are based on information readily available to the project team and not an exhaustive review of each States’ entire data systems. Most of the databases contain administrative information, such as location, classification, pavement cross section, and traffic volume, and a few contain information on alignment features. However, these databases lack information on elements such as intersections, interchanges, circular intersections, ramps, signs, rumble strips, sidewalks, pedestrians, bicycles, and motorcycles. Overall, the HSIS and non-HSIS databases contain only one-sixth to one-third of the MIRE data elements. The FHWA polled safety professionals during a series of MIRE Webinars held in 2009 and 2010 and found that the data elements considered most difficult to collect tend to be those that are most often missing from data inventories.
The research team also reviewed data elements collected for the Highway Performance Monitoring System (HPMS) to identify other possible sources for MIRE data. The HPMS requires States to collect roadway characteristic data on Federal-aid highways and report those data to FHWA. Federal-aid highways include all functional systems excluding rural minor collectors and locals. FHWA uses HPMS data for several purposes including apportioning Federal-aid funds back to the States. Although FHWA only requires States collect HPMS data on Federal-aid roads, and safety programs focus on all public roads, there often is a strong correlation between HPMS data requirements and State highway agency data collection practices. In this sense, the HPMS data can help in understanding future trends in data availability in State databases. The Full Extent dataset of HPMS contains data for 21 MIRE elements, while the Sample dataset contains data for 24 MIRE elements. This does not cover the entire public roadway system unless data collection practices change over time, but collection of these sample variables may lead to collection of the same variables on a wider network basis.
The researchers conducted a literature search to identify potential supplemental databases that contain information on MIRE data elements. Literature on States’ pavement management practices confirmed that a majority of States collect and store pavement condition data (e.g. roughness and surface friction) in their databases. Some States also collect rumble strip information. Only one-third of the States use hardware management systems for signs, signals, guardrails, and lighting. States maintain these databases either as a separate system or as part of a broader management system. While the supplemental databases cannot supply all the MIRE information for safety analysis, they could serve as alternate sources for some categories of MIRE elements. Many of the elements in the MIRE listing either do not exist in current database systems or are contained in a series of disparate systems that are not accessed easily. Agencies

MIRE ELEMENT COLLECTION MECHANISMS AND GAP ANALYSIS
xi
interested in collecting MIRE elements would need to collect data not found in existing datasets or, in some cases, compile data that may already exist but cannot be integrated with other datasets.
The research team evaluated the potential for existing and emerging data collection technologies to narrow the gaps between the elements in the MIRE listing and the current data available from agency inventory and supplemental databases. Many State agencies use semi- or fully automated systems for data collection. In semi-automated systems, only the data collection is fully automated through the use of imaging and/or sensor technologies, with the reduction of raw data into useful information being done manually by the operator. In fully automated systems, both data collection and processing are automated using software with no or minimal manual intervention. Among the automated systems in practice, the mobile mapping systems have emerged as a promising choice for automated data collection.
While these systems have the flexibility to accommodate a custom set of geo-referencing and descriptive technologies, and can collect data at highway speeds, post-processing data and cross-referencing to other linear referencing systems still appear to be time-consuming and labor-intensive. Technologies such as light detection and ranging (LIDAR) and satellite imagery show promise. There are continual improvements in technical capabilities, such as the availability of high-resolution imagery that should help overcome any current limitations. The Keyhole Markup Language (KML) browsers, including Google Earth and Bing, could serve as an intuitive visualization tools for data presentation in roadway inventory applications.
The research team evaluated the ability of four existing and emerging technologies to collect the required information for MIRE data elements: mobile mapping, airborne LIDAR, terrestrial LIDAR, and satellite imagery. While these technologies can collect most of the MIRE data elements, they are not without their limitations. Moreover, there are no accepted industry standards at this time that establish the desired accuracy of roadway measurement systems. Transportation agencies will need to conduct significant work in this regard. The airborne technologies cannot collect information on signs, whereas the terrestrial technologies have issues with collecting data on steep slopes. Neither can identify smaller objects, such as the pedestrian signalization type. The system accuracy, defined by either image resolution or point density of laser scans, is a critical factor in selecting an appropriate technology for inventory data collection. Irrespective of the technology used for data collection, significant post-processing efforts are anticipated for data extraction. Terrestrial LIDAR systems have demonstrated the potential to collect many of the MIRE elements through case studies.
Collecting additional roadway safety data can be a large undertaking. Based on the results of this effort, the research team developed several recommendations to help States implement a MIRE MIS. States should consider using available information systems as an alternative source of data. Integrating the available data systems and data needs within the agency will help minimize the data collection and processing efforts of various internal departments. States should also standardize data collection methods to ensure quality and simplify transfer between information

MIRE ELEMENT COLLECTION MECHANISMS AND GAP ANALYSIS
xii
systems. While there are multiple technologies available to assist States in data collection, public and private sectors should explore the development of automated techniques for extracting inventory feature data from advanced collection techniques into a usable database format. These steps can help States implement a MIRE MIS to help support their safety programs through data-driven decision-making.

MIRE ELEMENT COLLECTION MECHANISMS AND GAP ANALYSIS
1
CHAPTER 1: BACKGROUND
Quality data are the foundation for making important decisions regarding the design, operation, and safety of roadways. While crash data have been a consistent element of highway safety analysis, in recent years there has been an increased focus on the combination of crash, roadway, and traffic data to make more precise and prioritized safety decisions. The application of advanced highway safety analysis processes and tools requires a comprehensive inventory of roadway safety data combined with crash data to better identify and understand problems, prioritize locations for treatment, apply appropriate countermeasures, and evaluate the effectiveness of those countermeasures. Comprehensive roadway safety data include information on roadway and roadside features, traffic operations, traffic volumes, and crashes. In search of new strategies for an improved safety information system, the Federal Highway Administration (FHWA), the National Cooperative Highway Research Program (NCHRP), and the American Association of State Highway and Transportation Officials (AASHTO) sponsored a scanning tour to study the existing systems in Europe and Australia. The expert scan team identified the following strategies to improve traffic safety information in the U.S. (5):
Increase support for both safety programs and safety information systems from top-level administrators in State and local transportation agencies.
Improve safety data by defining good inventory data and institutionalizing continual improvement toward established performance measures.
Improve safety data by making them easier to collect, store, and use.
Improve safety data by increasing the use of critical safety analysis tools, which themselves require good data.
Improve and protect safety data by storage and linkage with critical non-safety data.
To develop good safety inventory data, the expert scan team recommended a list of roadway inventory and operations data elements as a companion to the Model Minimum Uniform Crash Criteria (MMUCC) (6). Furthermore, Federal safety programs support data-driven decision-making. For example, the Highway Safety Improvement Program (HSIP) requires that States use a data-driven process in selecting and implementing effective countermeasures for reducing fatalities and serious injuries on public roads. Regulations governing the HSIP (23 Code of Federal Regulations [CFR] Part 924) specify that the HSIP planning process shall incorporate the collection and analyses of crash, roadway, and traffic data on all public roads (1). To this end, FHWA developed the Model Inventory of Roadway Elements (MIRE), a recommended listing and data dictionary of roadway and traffic data elements critical to supporting highway safety management (3).

MIRE ELEMENT COLLECTION MECHANISMS AND GAP ANALYSIS
2
For cases where resource limitations prohibit the collection of the total list of MIRE data elements on all public roads, FHWA issued the “Guidance Memorandum on Fundamental Roadway and Traffic Data Elements to Improve the Highway Safety Improvement Program” on August 1, 2011 (4). This memorandum identifies a subset of MIRE elements—the Fundamental Data Elements (FDE)—that FHWA recommends the States collect to help support their safety programs. This guidance notwithstanding, FHWA still recommends that States collect as many of the MIRE data elements as possible on as many roadways as possible.

MIRE ELEMENT COLLECTION MECHANISMS AND GAP ANALYSIS
3
CHAPTER 2: MODEL INVENTORY OF ROADWAY ELEMENTS
MIRE is a recommended listing and associated data dictionary of roadway inventory and traffic elements that are critical to the safety management of highways. The initial version of MIRE was released in 2007 (7), and a revised version, MIRE Version 1.0, was released in late 2010 (3). MIRE Version 1.0 consists of 202 data elements divided into the following categories:
I. Roadway Segment Descriptors:
a. Segment Location/Linkage Elements.
b. Segment Roadway Classification.
c. Segment Cross Section.
i. Surface Descriptors.
ii. Lane Descriptors.
iii. Shoulder Descriptors.
iv. Median Descriptors.
d. Roadside Descriptors.
e. Other Segment Descriptors.
f. Segment Traffic Flow Data.
g. Segment Traffic Operations/Control Data.
h. Other Supplemental Segment Descriptors.
II. Roadway Alignment Descriptors:
a. Horizontal Curve Data.
b. Vertical Grade Data.
III. Roadway Junction Descriptors:
a. At-Grade Intersection/Junctions.
i. At-Grade Intersection/Junction General Descriptors.
ii. At-Grade Intersection/Junction Descriptors (Each Approach).
b. Interchange and Ramp Descriptors.
i. General Interchange Descriptors.
ii. Interchange Ramp Descriptors.

MIRE ELEMENT COLLECTION MECHANISMS AND GAP ANALYSIS
4
FHWA recognizes that current trends of constrained resources, competing priorities, and shrinking workforces will likely be the norm for at the least the near future. In order to address these issues, States need to find better ways to identify, prioritize, and treat safety problems. One potential solution is for States to enhance their capabilities regarding the collection, maintenance, and use of roadway data as part of normal business practices.

MIRE ELEMENT COLLECTION MECHANISMS AND GAP ANALYSIS
5
CHAPTER 3: MIRE MANAGEMENT INFORMATION SYSTEM
A critical step toward acceptance and implementation of MIRE is the conversion of MIRE (which is now a listing of variables) into a management information system (MIS). To assist States in developing and integrating the MIRE into an MIS structure that will provide greater utility in collecting, maintaining, and using MIRE data, FHWA has undertaken the MIRE MIS project.
The proposed MIRE MIS design will include the exploration, development, and documentation of the following:
Mechanisms for data collection.
A highly efficient process for data handling and storage.
Details of data file structure.
Methods to assure the integration of MIRE data with crash data and other data types.
Performance metrics to assess and assure MIRE data quality and MIS performance.
This report represents the first step in the MIS effort—mechanisms for data collection. The purpose of this report it to provide an assessment of roadway inventory data collection efforts by State Departments of Transportation (DOTs), identify gaps in current practices, and provide recommendations for filling those gaps in order to support States’ implementation of the MIRE MIS.

MIRE ELEMENT COLLECTION MECHANISMS AND GAP ANALYSIS
6
CHAPTER 4: REVIEW OF DATA INVENTORIES OF STATE DOTS
Existing roadway inventory and traffic data serve as potential resources agencies could use when developing a data management inventory system for MIRE. Therefore, it is necessary to review DOT roadway data collection and inventory practices and identify whether MIRE elements exist in the DOT’s databases. The research team reviewed the databases of 9 States that have contributed to the Highway Safety Information System (HSIS) and reviewed the roadway inventories of 14 non-HSIS States. The team also reviewed the data requirements as outlined in the “Highway Performance Monitoring System (HPMS) Reassessment 2010+ Data Specifications” (8). In addition, the researchers conducted a literature review to obtain information on whether there are supplemental databases—such as pavement and other asset management databases—that could supply any of the MIRE data elements. Finally, the team compiled information on emerging automated roadway data collection methodologies to understand future possibilities with regard to the MIRE dataset. The research team explored methodologies with varying levels of automation. In fully automated systems, both data collection and processing are automated using software with no or minimal manual intervention. In semi-automated systems, the data collection is only wholly automated through the use of imaging and/or sensor technologies, while an operator manually reduces the raw data to useful information.
The research team reviewed the roadway inventory databases of 23 DOTs to ascertain whether they contain the MIRE data elements. The review included only the inventories that were readily available to the research team, such as the FHWA’s HSIS database, and did not include all data systems maintained by each of the State agencies. The HSIS is a multistate safety database that contains crash data, roadway inventory data, traffic volume data, and other inventory-related elements, such as intersections, interchanges, and roadside hardware. The States that have provided inventory data to the HSIS database include California, Illinois, Maine, Michigan, Minnesota, North Carolina, Ohio, Utah, and Washington. (Michigan and Utah are no longer active contributors due to changes in their data systems.) The HSIS databases are known to have extensive roadway inventory data and should not be considered as representative samples. The research team also reviewed 14 non-HSIS States roadway inventory databases, which included Arizona, Arkansas, Florida, Indiana, Maryland, Massachusetts, Mississippi, Missouri, New Hampshire, Oklahoma, Pennsylvania, South Carolina, Texas, and Virginia. The results presented in this section reflect only an overview of the inventory information that was readily available to the research team as of late 2009, as this is not an exhaustive review of all current data systems maintained by all State agencies.
In addition to reviewing the inventory databases of HSIS and non-HSIS States, the researchers investigated the following sources of information to further understand the extent of information that may be available to support the development of a MIRE MIS.
MIRE ELEMENT COLLECTION MECHANISMS AND GAP ANALYSIS
7
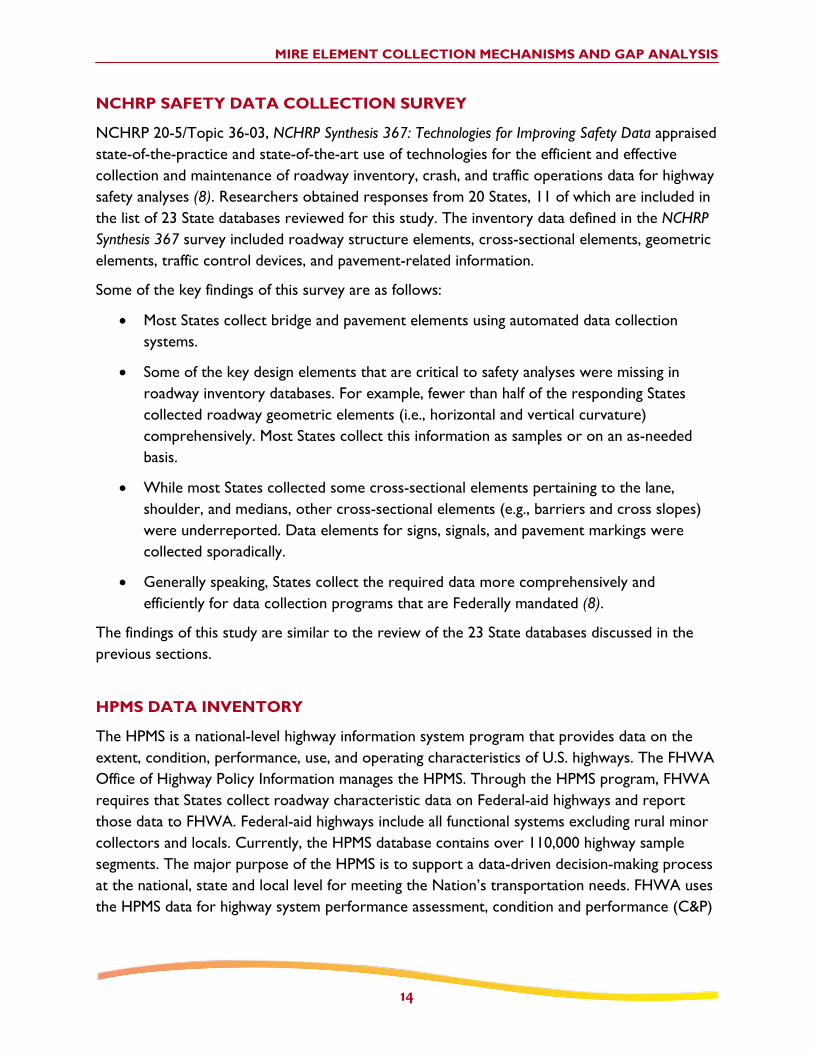
NCHRP 20-5/Topic 36-03, NCHRP Synthesis 367: Technologies for Improving Safety Data. This included a survey conducted to document the roadway data inventory practices of 20 State DOTs (8).
Documentation on reporting requirements of HPMS. Although it is expected that most of the HPMS data pertinent to MIRE will be collected on a sample basis, the future data collection plans were reviewed because of the strong tendency of DOTs to collect full extent and sample data required by HPMS on a wider network basis (8).
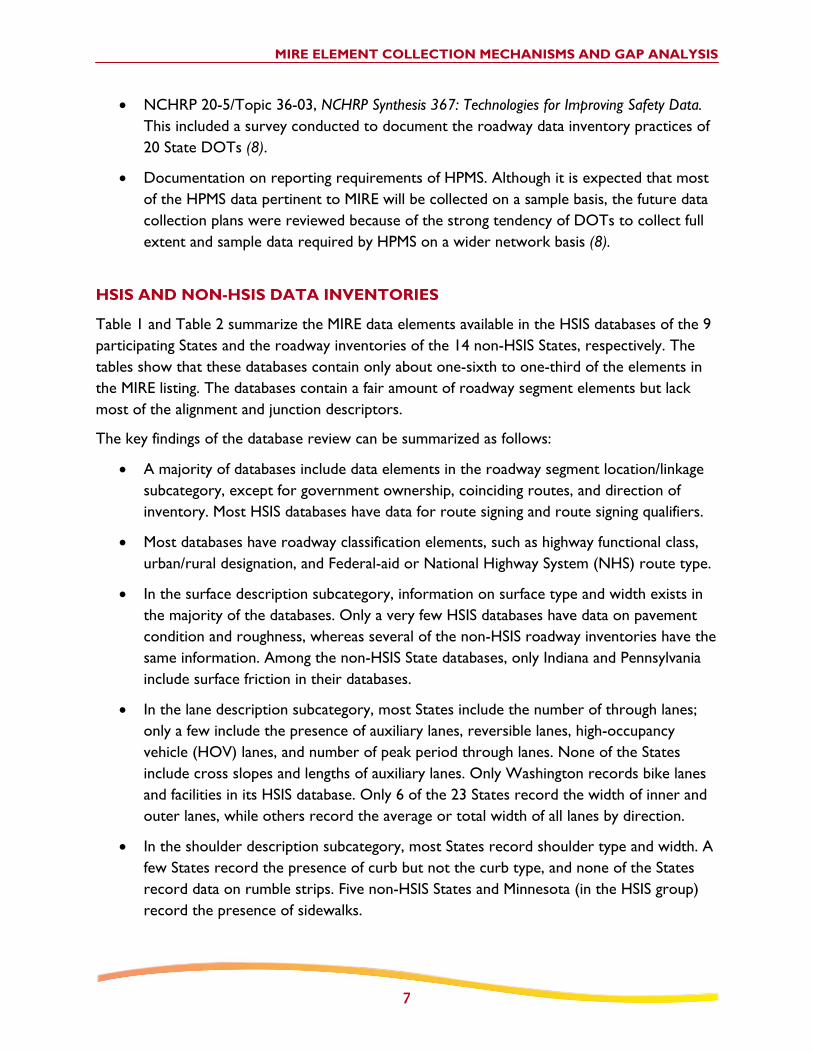
HSIS AND NON-HSIS DATA INVENTORIES
Table 1 and Table 2 summarize the MIRE data elements available in the HSIS databases of the 9 participating States and the roadway inventories of the 14 non-HSIS States, respectively. The tables show that these databases contain only about one-sixth to one-third of the elements in the MIRE listing. The databases contain a fair amount of roadway segment elements but lack most of the alignment and junction descriptors.
The key findings of the database review can be summarized as follows:
A majority of databases include data elements in the roadway segment location/linkage subcategory, except for government ownership, coinciding routes, and direction of inventory. Most HSIS databases have data for route signing and route signing qualifiers.
Most databases have roadway classification elements, such as highway functional class, urban/rural designation, and Federal-aid or National Highway System (NHS) route type.
In the surface description subcategory, information on surface type and width exists in the majority of the databases. Only a very few HSIS databases have data on pavement condition and roughness, whereas several of the non-HSIS roadway inventories have the same information. Among the non-HSIS State databases, only Indiana and Pennsylvania include surface friction in their databases.
In the lane description subcategory, most States include the number of through lanes; only a few include the presence of auxiliary lanes, reversible lanes, high-occupancy vehicle (HOV) lanes, and number of peak period through lanes. None of the States include cross slopes and lengths of auxiliary lanes. Only Washington records bike lanes and facilities in its HSIS database. Only 6 of the 23 States record the width of inner and outer lanes, while others record the average or total width of all lanes by direction.
In the shoulder description subcategory, most States record shoulder type and width. A few States record the presence of curb but not the curb type, and none of the States record data on rumble strips. Five non-HSIS States and Minnesota (in the HSIS group) record the presence of sidewalks.

MIRE ELEMENT COLLECTION MECHANISMS AND GAP ANALYSIS
8
Most State databases have data elements for median width and type; a few have information on median barrier type, but none have data elements for rumble strips, side slopes, inner paved shoulder width, or crossover/left lane turn types.
None of the States have roadside elements that include clear zone width, side slopes, and driveways. Washington’s Roadside Features Inventory Program (RFIP) collects information on roadside slopes and ditches.
In the other segment descriptors category, approximately half of the States’ databases contain roadway terrain type. Only Florida, New Hampshire, and Utah have the number of intersection types in a roadway segment (i.e., the number of signalized, stop-controlled, or uncontrolled intersections in a roadway segment).
In the traffic flow category, the databases of most States contain traffic volume data; however, only a few databases contain information on traffic characteristics such as percent trucks, traffic growth and forecasts, and directional and K-factors. None of the State databases contain information on hourly traffic volumes or counts of motorcycles, bicycles, or pedestrians.
In the traffic operations/controls subcategory of roadway segments, several States include data on one-way/two-way operations, speed limits, and truck route designations. Nearly all databases lack data on the presence of edgelines, centerlines, passing zone percentage, 85th percentile speed, nighttime speed limit, and truck speed limit. Only a few databases contain information on school zone indicator, presence/type of on-street parking, and toll facilities. Only Mississippi includes roadway lighting in its inventory.
In the roadway alignment category, only four of the nine HSIS States provide data on horizontal curves that include the curve length, radius, and identifiers. Similarly, only three of the nine HSIS States have data on vertical alignment and grades. In the non-HSIS group, only Florida has data on horizontal curve radius, identifiers, deflection angle, and vertical alignment feature type. Most States do not include superelevation, transition curves, deflection angles, or length of vertical grade and horizontal curves. In general, the State databases lack roadway alignment elements.
In the roadway junction category, the majority of HSIS databases contain limited data on one or more of the three junction descriptors: interchanges, intersections, and ramps. These States have limited data on descriptors such as location identifiers, number of lanes, traffic volume, and traffic control. Only two have full intersection inventory files. None of the HSIS databases have data to describe pedestrian features, turn counts, and turn prohibitions, rumble strips, intersection geometry, and circular intersections. Only a few HSIS States have data on location identifiers and traffic volume on interchanges and ramps. None of the non-HSIS databases includes junction-related data elements.

MIRE ELEMENT COLLECTION MECHANISMS AND GAP ANALYSIS
9
Table 1. Number of MIRE elements in HSIS State databases.
MIRE Data Subcategories (total elements in a subcategory)
Number of Elements for MIRE Inventory in HSIS Databases by State
NC CA IL ME MI MN OH UT WA
I. ROADWAY SEGMENT DESCRIPTORS (Total number of MIRE Elements = 106)
I.a. Segment location/linkage variables (18) 12 9 12 10 8 8 16 9 9
I.b. Segment roadway classification (4) 4 4 4 4 3 4 4 4 4
I.c. Segment cross-section (39) 13 14 16 7 12 17 15 7 17
I.d. Segment roadside descriptors (13) 0 0 0 0 0 0 0 0 5
I.e. Other segment descriptors (4) 1 1 0 0 1 0 0 4 1
1.f. Segment traffic flow data (12) 4 1 2 2 2 3 3 4 3
I.g. Segment traffic operations/control data (15) 3 2 3 1 4 4 3 5 4
I.h. Other supplemental descriptors (1) 0 0 0 0 0 0 0 0 1
II. ROADWAY ALIGNMENT DESCRIPTORS (Total number of MIRE Elements = 13)
II.a. Horizontal curve data (8) 0 0 5 0 4 0 4 0 5
II.b. Vertical grade data (5) 0 0 0 0 0 0 4 0 5
III. ROADWAY JUNCTION DESCRIPTORS (Total number of MIRE Elements = 83)
III.a. At-grade intersection/junctions (58) 0 23 1 12 2 22 4 1 2
III.b. Interchange and ramp descriptors (25) 0 4 0 9 0 7 3 0 12
Total Number of Elements (202) 37 58 43 45 36 65 56 34 68

MIRE ELEMENT COLLECTION MECHANISMS AND GAP ANALYSIS
10
Table 2. Number of MIRE elements in non-HSIS State databases.
MIRE Data Subcategories (total elements in a subcategory)
Number of Elements for MIRE Inventory in Other State Databases by State
FL MO NH OK MS SC TX IN VA AR MD PA AZ MA
I. ROADWAY SEGMENT DESCRIPTORS (Total number of MIRE Elements = 106)
I.a. Segment location/linkage variables (18) 9 9 8 9 11 7 14 8 5 8 12 11 10 12
I.b. Segment roadway classification (4) 3 2 3 3 4 2 3 2 2 4 3 4 3 4
I.c. Segment cross-section (39) 18 8 9 10 10 2 12 8 13 13 18 16 13 16
I.d. Segment roadside descriptors (13) 0 0 0 0 0 0 0 0 0 0 0 0 0 0
I.e. Other segment descriptors (4) 4 0 2 1 0 0 0 0 0 1 0 0 1 1
1.f. Segment traffic flow data (12) 5 2 0 1 5 1 7 1 0 2 2 7 5 2
I.g. Segment traffic operations/control data (15) 3 1 3 2 5 2 4 1 2 1 2 4 4 2
I.h. Other supplemental descriptors (1) 1 1 1 0 0 0 0 0 0 1 0 0 0 0
II. ROADWAY ALIGNMENT DESCRIPTORS (Total number of MIRE Elements = 13)
II.a. Horizontal curve data (8) 3 0 0 0 0 0 0 0 0 0 0 0 0 0
II.b. Vertical grade data (5) 1 0 0 0 0 0 0 0 0 0 0 0 0 0
III. ROADWAY JUNCTION DESCRIPTORS (Total number of MIRE Elements = 83)
III.a. At-Grade intersection/junctions (58) 5 2 2 1 0 0 0 2 0 0 1 0 1 0
III.b. Interchange and ramp descriptors (25) 3 1 0 0 0 0 0 2 0 1 0 0 0 0
Total Number of Elements (202) 55 26 28 27 35 14 40 24 22 31 38 42 37 37

MIRE ELEMENT COLLECTION MECHANISMS AND GAP ANALYSIS
11
SUMMARY OF MIRE WORKSHOP POLLS
FHWA hosted a series of workshops from November 2009 through January 2010 (via Webinar) to present the proposed MIRE elements and receive feedback from safety professionals and roadway data inventory specialists in State and local highway agencies. The MIRE elements were organized by topic and were presented in each of the three workshops: roadway segment and alignment variables, intersection-related variables, and interchange and ramp variables. For each of the workshops, the MIRE elements were grouped into several categories, and the participants were asked to respond to two questions:
1) Which elements are very important to your safety program/decisions?
2) Which elements will be very difficult to collect?
Table 3 through Table 5 summarizes the participant responses. Notably, most elements that the participants considered important to safety analyses were the ones identified as difficult to collect and were unavailable in the HSIS and non-HSIS data. This implies that States may lack critical roadway inventory data required to make effective decisions in highway safety management, further confirming the necessity for States to address these data gaps and overcome difficulties in their current data collection practices.

MIRE ELEMENT COLLECTION MECHANISMS AND GAP ANALYSIS
12
Table 3. MIRE workshop poll summary for roadway segment descriptors.
Descriptors Category Elements Difficult to Collect Elements Important to Safety Programs
Segment roadway classification and surface
Surface friction Surface friction
Lane Width of marked bicycle lane or bike path
Auxiliary lane length
Shoulder
Sidewalk presence
Rumble strip type
Right/left paved shoulder width
Rumble strip presence
Median
Median rumble strip type
Median (inner) paved shoulder width
Median shoulder rumble strip presence
Median (inner) paved shoulder width
Segment roadside
Side slope roadside rating
Roadside rating
Roadside clear zone width
Roadside clear zone width
Driveway information
Driveway information
Other segment descriptors
Number of signalized intersections in sections
RR grade crossing
Number of uncontrolled / other intersections
Number of stop-controlled intersections in segments
Traffic flow data
Total daily two-way pedestrian count/ exposure
Bicycle count/exposure
Hourly traffic volumes
Percent combination trucks
Traffic operations/ control data
85th percentile speed
Roadway lighting
85th percentile speed
Roadway lighting
Edgeline presence/type

MIRE ELEMENT COLLECTION MECHANISMS AND GAP ANALYSIS
13
Table 4. MIRE workshop poll summary for roadway alignment descriptors.
Descriptors Category Elements Difficult to Collect Elements Important to Safety Programs
Curve superelevation or Curve superelevation superelevation adequacy Curve identifiers and linkage
Horizontal curve data variables
Curve feature type
Horizontal curve length
Vertical grade data Percent of gradient Percent of gradient
Table 5. MIRE workshop poll summary for roadway junction descriptors.
Descriptors Category Elements Difficult to Collect Elements Important to Safety Programs
Intersection – general (identifiers)
-- Location identifiers for road 1 & 2 crossing point
Intersection – general (geometry)
Intersection skew angle Intersection/junction geometry
Intersection/junction – general (traffic control)
Number of quadrants with limited sight distance
Traffic control
Number of quadrants with limited sight distance
Intersection/junction – general (circular intersections)
Bicycle facility
Circulatory width
Number of circulatory lanes
Intersection approach Length of exclusive left/right turn lanes
Approach average annual daily traffic (AADT)
Intersection approach
Crossing pedestrian count/ exposure
Signal progression
Approach traffic control
Intersection approach Left/right turn counts/ percent
Left/right turn counts/percent
Left/right turn prohibitions
Intersection approach (circular intersections)
Entry/exit radius Number of entry/exit lanes
General interchange descriptors
Interchange lighting
Unique intersection identifier
Interchange type
Interchange ramp
Ramp AADT
Ramp posted speed limit
Ramp AADT
Unique ramp identifier
Ramp length
MIRE ELEMENT COLLECTION MECHANISMS AND GAP ANALYSIS
14
NCHRP SAFETY DATA COLLECTION SURVEY
NCHRP 20-5/Topic 36-03, NCHRP Synthesis 367: Technologies for Improving Safety Data appraised state-of-the-practice and state-of-the-art use of technologies for the efficient and effective collection and maintenance of roadway inventory, crash, and traffic operations data for highway safety analyses (8). Researchers obtained responses from 20 States, 11 of which are included in the list of 23 State databases reviewed for this study. The inventory data defined in the NCHRP Synthesis 367 survey included roadway structure elements, cross-sectional elements, geometric elements, traffic control devices, and pavement-related information.
Some of the key findings of this survey are as follows:
Most States collect bridge and pavement elements using automated data collection systems.
Some of the key design elements that are critical to safety analyses were missing in roadway inventory databases. For example, fewer than half of the responding States collected roadway geometric elements (i.e., horizontal and vertical curvature) comprehensively. Most States collect this information as samples or on an as-needed basis.
While most States collected some cross-sectional elements pertaining to the lane, shoulder, and medians, other cross-sectional elements (e.g., barriers and cross slopes) were underreported. Data elements for signs, signals, and pavement markings were collected sporadically.
Generally speaking, States collect the required data more comprehensively and efficiently for data collection programs that are Federally mandated (8).
The findings of this study are similar to the review of the 23 State databases discussed in the previous sections.
HPMS DATA INVENTORY
The HPMS is a national-level highway information system program that provides data on the extent, condition, performance, use, and operating characteristics of U.S. highways. The FHWA Office of Highway Policy Information manages the HPMS. Through the HPMS program, FHWA requires that States collect roadway characteristic data on Federal-aid highways and report those data to FHWA. Federal-aid highways include all functional systems excluding rural minor collectors and locals. Currently, the HPMS database contains over 110,000 highway sample segments. The major purpose of the HPMS is to support a data-driven decision-making process at the national, state and local level for meeting the Nation’s transportation needs. FHWA uses the HPMS data for highway system performance assessment, condition and performance (C&P)

MIRE ELEMENT COLLECTION MECHANISMS AND GAP ANALYSIS
15
reporting, apportionment of Federal-aid highway funds, reporting of highway statistics, and other transportation related analyses.
Although safety programs should consider all public roads, and HPMS is only collected on a portion of the roadway network, there is often a strong correlation between HPMS data requirements and State highway agency data collection practices. In this sense, the HPMS data can help in understanding future trends in data availability in State databases. Additionally, the collection of these sample variables may lead to the collection of the same variables on a wider network basis. The current HPMS database (HPMS 2010+) contains numerous datasets sorted into six different catalogs (8):
Shapes – This catalog stores geographic data for use in geospatial analyses and includes such features as routes and county and state boundaries.
Sections – This catalog stores the roadway attributes submitted by the States for the entire network or sampled sections.
Summaries – This catalog contains summaries of travel, highway system length, and demographic data for a defined area, such as a State, county, or urban area.
References – This catalog stores line reference data that identifies highway sections as the NHS, Strategic Highway Network (STRAHNET), and National Freight Network. It also contains point data to identify location and type of grade-separated interchanges on the Federal-aid system.
Estimates – This catalog stores information that can be used as inputs in FHWA's pavement deterioration models to describe the pavement condition estimates at the National or State level.
Metadata – This catalog contains data that captures and explains variability in the collection and reporting of traffic and pavement data in HPMS.
The roadway-section-level attributes reported in the Sections catalog are the primary interest for highway safety analysis. The section-level data in the catalog contain 63 data elements provided by the States describing the following attributes of a roadway section: inventory, route, traffic, roadway geometry, and pavement. In addition, the Sections catalog includes seven items calculated internally by the HPMS software, seven for sample panel identification, four reported by FHWA, and two coded by FHWA based on data provided by the States.
FHWA requires States to report the section-level data for all highway functional classes within the Federal-aid highway program and all NHS routes. States report a limited number of data elements within the Sections catalog for the entire system (referred to as Full Extent data items). States report more detailed information for samples of roadway sections (referred to as Sample data items). States select the samples randomly to represent various attributes at a
MIRE ELEMENT COLLECTION MECHANISMS AND GAP ANALYSIS
16
system-wide level. The geographic coverage of Full Extent and Sample data items may vary with the functional classes within the Federal-aid Highway Program.
Of 70 data items (63 elements collected by States and 7 software-calculated elements) in the Sections catalog, the Full Extent dataset contains data items ranging from a maximum of 21 items for NHS sections to a minimum of 13 items for collector roads. The Sample dataset contains data items ranging from a maximum of 47 data items for rural minor arterial sections to a minimum of 38 items for NHS sections.
The researchers compared the HPMS dataset to MIRE Version 1.0 to identify common data items between the two systems. The HPMS Sample dataset covers up to 22 elements in the MIRE listing; however, because this dataset contains data for only a limited number of sampled sections, it does not cover all public roads. The Full Extent dataset includes 19 elements in the MIRE listing for all functional systems and for 7 elements for certain functional systems. Table 6 presents a list of MIRE data elements that are common to both the Full Extent and Sample datasets. The table indicates how many data elements these datasets can contribute to a potential MIRE MIS for any possible integration.

MIRE ELEMENT COLLECTION MECHANISMS AND GAP ANALYSIS
17
Table 6. Commonality between the HPMS dataset and MIRE.
HPMS Full Extent Data Items
HPMS “Limited Full Extent” Data Items
HPMS Sample Panel Data Items
Year_Record Route_Number At_Grade_Other
State_Code Route_Signing Curves
Route_ID Route_Qualifier Dir_Factor
Begin_Point International Roughness Grades
End_Point Index (IRI) K_Factor
Section Length AADT_Single Lane_Width
F_System AADT_Combination Median_Type
Urban_Code Access_Control Median_Width
Urban Name Peak_Lanes
County_Code Peak_Parking
County Name Shoulder_Type
Facility_Type Shoulder_Width_L
Ownershp Shoulder_Width_R
Through_Lanes Signal_Type
HOV_Type Signals
HOV_Lanes Speed_Limit
Toll_Charged Stop_Signs
Toll_Type Surface_Type
AADT
Terrain_Type
Turn_Lanes_L
Turn_Lanes_R
PSR
In this comparison, the Sample dataset was included to emphasize the capability of the States to collect certain data items, whether mandated or not. The review indicated the following:
The HPMS contains MIRE data elements for segment location, linkage, classification, and cross-sectional descriptors for surface, lanes, shoulders, and medians. However, it does not contain specific data for surface friction, cross slopes, median side slopes, rumble strips for medians and shoulders, curbs, sidewalks, or bicycle facilities.
The HPMS has route numbers, route signing, and route qualifiers in the Full Extent dataset for Interstates, other freeways, and principal and minor arterials; it does not require reporting for collector and local roads.

MIRE ELEMENT COLLECTION MECHANISMS AND GAP ANALYSIS
18
International Roughness Index (IRI) is reported to Full Extent only for routes classified as Interstates and principal arterials, whereas the Pavement Serviceability Rating (PSR) is reported for Sample dataset sections on all urban minor arterials, urban and rural major collectors, and urban minor collector routes. The HPMS does not require a PSR value for a sample section if a measured IRI value is reported for that section.
The HPMS does not include any MIRE data elements that describe roadside attributes.
The HPMS contains data items for location, length, number of lanes, AADT, and functional classification data for ramps and interchanges.
The HPMS contains traffic volume in the Full Extent dataset, while other traffic data items, such as the annual escalation based on future traffic forecasts, K-factor, directional factor, and truck traffic, are contained in the Sample dataset. The HPMS requires the State agencies to report motorcycle travel data as a percentage of total travel. However, it lacks information on pedestrians and bicycles.
Although the HPMS includes some data items for traffic operations and control (e.g., speed limits and toll facilities), it lacks information on the presence of school zones, pavement markings, and lighting.
In the HPMS, required Sample data include the number of horizontal curves within categories of degree/radius and the number of grades within categories of percent gradient. The States may submit the location and descriptors of each specific curve or grade within the sample section (as compliance with MIRE would require), but it is not required for the HPMS.
The HPMS Sample dataset contains data items for signal type and percent green time, but only for the “governing” or “typical” intersection within a sample section. It includes the number of signalized, stop-controlled, and uncontrolled intersections in a sample section. However, unlike MIRE, it does not include an intersection database that contains inventory data on each approach to each intersection.
The HPMS lacks information on circular intersections and pedestrian facilities.
GAP ANALYSIS OF MIRE DATA ELEMENTS
The review of databases from HSIS and non-HSIS States, the MIRE workshop survey results, and the HPMS data requirements indicated that some MIRE elements are not collected or planned for collection. Most State databases have MIRE elements for roadway location, linkage, and classification categories. These databases contain most of the elements that describe surface, lanes, shoulders, and medians. However, they lack information on elements such as surface friction, presence of curbs, rumble strips, sidewalks, and bicycle facilities. While almost all databases contain traffic volume, only a few databases contain data elements that describe

MIRE ELEMENT COLLECTION MECHANISMS AND GAP ANALYSIS
19
traffic growth, forecast, percent trucks, and directional factors. Only a few State databases contain information on basic alignment features, traffic operations, traffic control in intersections, and parking restrictions. Most databases lack information on roadside features, roadside hardware, pavement marking, lighting, intersections, interchanges, ramps, circular intersections, and in-depth alignment features. None of the databases contain information on traffic counts or facilities for pedestrians, bicycles, and motorcycles.
The research team identified the following MIRE Version 1.0 elements as gaps in traditional roadway inventories based on the review of existing data sources:
Roadway Cross-Sectional Elements:
o Cross slope.
o Length of auxiliary lanes.
o Presence/type of bicycle facility.
o Width of bicycle facility.
o Number of peak period through lanes.
o Type of rumble strips on shoulders and medians.
o Type of curbs on shoulders and barriers on medians.
Roadway Alignment Description:
o Direction, degree, transition, and deflection angle of horizontal curves.
o Length of vertical curves.
o Curve and grade identifiers.
o Percent grades.
Roadside Elements:
o Clear zone width and side slopes.
o Lighting on roadways, intersections, interchanges.
o Driveway counts.
o Roadside rating.
Traffic Flow and Operations/Control:
o Edgeline presence.
o Centerline presence and centerline rumble strips.
o Speed limits trucks, night time travel, mean speed, and 85th percentile speed.
Passing zone percentage. o

MIRE ELEMENT COLLECTION MECHANISMS AND GAP ANALYSIS
20
Pedestrian/Bicycle Related Information:
o Pedestrian facilities – sidewalks & crosswalks.
o Bicycle lanes and bike paths.
o Pedestrian and bicycle counts on through lanes and intersections.
o Pedestrian and bicycle facilities at intersections and circular intersections.
o School zone indicator on through lanes and junctions.
o Pedestrian signals.
Intersections and Circular Intersections:
o Intersection identifiers (e.g., intersection milepost or coordinates).
o Geometry of intersection – number of legs, geometry, offset distance.
o Cross-sectional elements at junctions – medians, splitter island, rumble strips.
o Geometry of circular intersections – number of entry, exit and circulatory lanes, entry and exit radius, width of entry, exit, and circulatory lanes.
o Traffic control at intersections and circular intersections.
o AADT at non-State crossing routes.
In general, HPMS includes data elements that describe the administrative, cross-sectional, and traffic characteristics of highways and their condition. Similarly, the databases of HSIS and non-HSIS States have data categories pertaining to vehicular traffic only. This could be the reason why these databases have very little or no specific information on exposure and facilities for pedestrians, bicycles, and motorcycles.
The coverage of MIRE elements in the States’ databases is similar to that of the HPMS. There is a strong correlation between the data availability in most State databases and HPMS reporting requirements. Although the HPMS has a limited number of samples from the entire roadway network, the review of HPMS gives an indication of what data the States may have in their databases and their capability to collect these elements. This observation is similar to a conclusion drawn in NCHRP Synthesis 367—that Federally mandated data programs, such as HPMS and those for bridge structures and railroad crossings, have a strong effect on the States’ comprehensive collection of data (8). This study also concluded that States have adopted efficient data collection methods where Federal programs required more comprehensive data. For instance, most State databases contain information on pavement condition and traffic volume, whereas they lack information on pedestrian facilities and circular intersections. The HPMS and similar Federally mandated programs (e.g., the Traffic Monitoring System [TMS]), require States to report on pavement conditions and traffic volumes but not on pedestrian facilities or circular intersections.

MIRE ELEMENT COLLECTION MECHANISMS AND GAP ANALYSIS
21
The review of databases from HSIS and non-HSIS States indicated that these databases lack information on various safety elements, such as pavement markings (including centerlines and edgelines), traffic signals, and roadway lighting. There is a possibility that these elements might exist in other data inventories maintained by the States. In addition, technological advancements in data collection methodologies could aid State agencies in filling the data gaps for MIRE.

MIRE ELEMENT COLLECTION MECHANISMS AND GAP ANALYSIS
22
CHAPTER 5: POTENTIAL SUPPLEMENTAL DATA SOURCES
The research team explored supplemental data sources that potentially could be used to obtain MIRE data elements. Examples of supplementary databases include pavement management systems, sign management systems, and other asset inventories. This exploration focused primarily on roadway inventory data and does not include sources of traffic counts. FHWA provides information on traffic data collection in the Traffic Monitoring Guide (TMG) (10). FHWA is currently updating the TMG with updated methodologies and expanded count types (e.g., pedestrian and bicycle counts).
PAVEMENT MANAGEMENT SYSTEMS
Most States maintain a pavement management system (PMS) database. According to a 2004 survey on State PMS practices, typical PMS data elements include pavement type, shoulder type, pavement width, shoulder width, layer thickness, and number of lanes (11); these are also MIRE data elements. Figure 1 presents the frequency of specific data elements that States maintain in PMS databases. Figure 2 presents the frequency of pavement condition data in these databases, which include MIRE elements such as roughness, friction, and pavement condition.
About 80 percent of the 2004 PMS survey respondents indicated they collect surface friction data (11). Surface friction data, identified as a gap in the HSIS and non-HSIS databases, can thus be obtained from PMS.
Several States measure pavement surface friction at the network level for a variety of reasons, including simple evaluations of crash rates, detailed crash analyses, restoration of friction performance, and friction-related design strategies. The frequency or extent of data collection may be determined by factors such as prioritizing testing sites based on special request from their maintenance unit, local concerns, crash rates, or scheduled measurements for a network-level friction management program. States store the collected information primarily for in-house use, and this information may not be available in the public domain. State agencies developing roadway inventory for MIRE can coordinate within their agency, as necessary, for friction data.

MIRE ELEMENT COLLECTION MECHANISMS AND GAP ANALYSIS
23
0%10%20%30%40%50%60%70%80%90%100%
Pavement Type
Pavement Width
Shoulder Type
Shoulder Width
Number of Lanes in
Each
Direction
Layer Thickness
Joint Spacing
Transverse Joint Load
Transfer
Subgrade Type and
Material Classification
Layer Material
Properties
Drainage
Percent of States Responding
Data Category
Figure 1. Frequency of data elements in pavement management inventory (11).
0%
10%
20%
30%
40%
50%
60%
70%
80%
90%
100%
IRI PSR Surface Friction
Composite Index
Percent of States Responding Hot Mix Asphalt Pavements
Jointed Plain/Reinforced Concrete Pavements
Continuously Reinforced Concrete Pavements
Composite Pavements
Note: Percentages calculatd by dividing the number of States that collect each type of data by the number of States that have that type of pavement.
Figure 2. Frequency of pavement condition data availability (11).

MIRE ELEMENT COLLECTION MECHANISMS AND GAP ANALYSIS
24
ROADWAY HARDWARE MANAGEMENT SYSTEMS
AASHTO conducted a survey in 2000 to evaluate States’ roadway safety hardware asset management systems. The AASHTO study, as reported by Hensing and Rowshan, included the following categories of assets in the survey (12):
• Roadway signs.
• Signals.
• Roadway lighting.
• Supports and structures for signs, signals, and lighting.
• Guardrails, barriers, and crash cushions.
• Pavement markings and treatments.
• Detectors.
Of the 40 State agencies that responded to the AASHTO survey, only one-third use hardware management systems. Table 7 presents the number of States that have an inventory system for the seven roadway hardware assets listed above. The table also provides the number of States that track the location of all or some or none of the inventoried items. For instance, of the 25 States that have an inventory for signs, 15 track the location of all inventoried items, while 7 others track the location of only some items, and the remaining 3 do not track any items at all. Similarly, of the 14 States that have an inventory for lighting assets, 9 track the location of all items, 3 track some items, and 2 do not track any items.
Table 7. Number of States that have an inventory and tracking system for roadway hardware assets (12).
Inventory States
Having an Inventory
States Tracking
Location of All Inventory
Items
States Tracking Location of
Some Inventory Items
States Not Tracking
Location of Any Items
Signs 25 15 7 3
Signals 26 24 2 0
Lighting 14 9 3 2
Supports 19 9 9 1
Guardrails 19 13 2 4
Pavement Markings
21 9 9 2
Detectors 17 12 3 2

MIRE ELEMENT COLLECTION MECHANISMS AND GAP ANALYSIS
25
Figure 3 shows the data collection methods the States reported that they used to develop their hardware asset inventories. As shown, States collect an overwhelming majority of the data through “manual surveys.” This study selected eight States for case studies on roadway safety hardware management systems to provide information to other State agencies that would help increase their use of state-of-the-practice techniques. It reviewed the agency practices that use fully or semi-integrated asset management systems leading to higher-level databases and presented two State models—New Mexico and Virginia—in detail.
0 5 10 15 20 25 30 35 40 45 50
Signs
Signals
Lighting
Supports
Guardrails
Pvmt Markings
DetectorsManual Survey
Semi‐Automated
Automated
Other
Figure 3. Methods used for original inventory of roadway hardware assets (12).
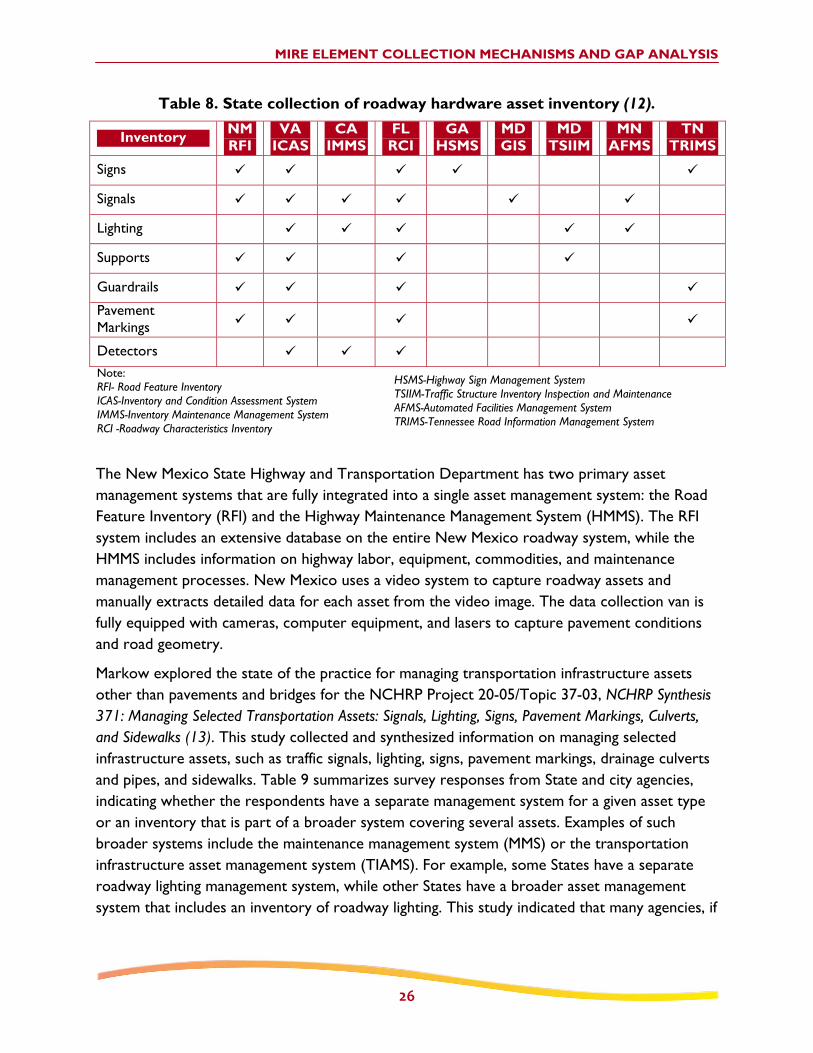
Table 8 summarizes the roadway hardware asset data collected in States included in the AASHTO study (12). For example, Virginia uses the Inventory and Condition Assessment System (ICAS) to collect inventory and condition data for all roadway assets that exist within the State’s highway fenceline boundaries. Virginia captures a global positioning system (GPS)-referenced digital videolog along every segment of highway for ICAS and uses these data to develop centerline coordinates of the roadway network.
MIRE ELEMENT COLLECTION MECHANISMS AND GAP ANALYSIS
26
Table 8. State collection of roadway hardware asset inventory (12).
Inventory NM RFI
VA ICAS
CA IMMS
FL RCI
GA HSMS
MD GIS
MD TSIIM
MN AFMS
TN TRIMS
Signs
Signals
Lighting
Supports
Guardrails
Pavement Markings
Detectors
Note: RFI- Road Feature Inventory ICAS-Inventory and Condition Assessment System IMMS-Inventory Maintenance Management System RCI -Roadway Characteristics Inventory
HSMS-Highway Sign Management System TSIIM-Traffic Structure Inventory Inspection and Maintenance AFMS-Automated Facilities Management System TRIMS-Tennessee Road Information Management System
The New Mexico State Highway and Transportation Department has two primary asset management systems that are fully integrated into a single asset management system: the Road Feature Inventory (RFI) and the Highway Maintenance Management System (HMMS). The RFI system includes an extensive database on the entire New Mexico roadway system, while the HMMS includes information on highway labor, equipment, commodities, and maintenance management processes. New Mexico uses a video system to capture roadway assets and manually extracts detailed data for each asset from the video image. The data collection van is fully equipped with cameras, computer equipment, and lasers to capture pavement conditions and road geometry.
Markow explored the state of the practice for managing transportation infrastructure assets other than pavements and bridges for the NCHRP Project 20-05/Topic 37-03, NCHRP Synthesis 371: Managing Selected Transportation Assets: Signals, Lighting, Signs, Pavement Markings, Culverts, and Sidewalks (13). This study collected and synthesized information on managing selected infrastructure assets, such as traffic signals, lighting, signs, pavement markings, drainage culverts and pipes, and sidewalks. Table 9 summarizes survey responses from State and city agencies, indicating whether the respondents have a separate management system for a given asset type or an inventory that is part of a broader system covering several assets. Examples of such broader systems include the maintenance management system (MMS) or the transportation infrastructure asset management system (TIAMS). For example, some States have a separate roadway lighting management system, while other States have a broader asset management system that includes an inventory of roadway lighting. This study indicated that many agencies, if

MIRE ELEMENT COLLECTION MECHANISMS AND GAP ANALYSIS
27
not all, have location information in their inventories that could be useful in any possible data integration for MIRE.
Table 9. Inventory of selected assets (13). States/Cities that Have States/Cities that Include Their
Inventory Separate Management Maintenance/Asset Management Systems System
AR, MI, SC, VT, CO (Region 2), FL, NM, NC, ND, UT, CO(Region 5), Signs Dakota County, NE, City of Cape Coral, FL
City of Tampa, FL City of Portland, OR
Signals MI, MN, NC, OH, OR, CO (Region 4)
MD, NM, OH, OR, VA, CO (Regions 1 and 5), City of Portland, OR
FL, IO, MN, OH, OR, Lighting CO (Region 4) CO (Regions 1, 3 and 5), City of Portland,
OR
Pavement Markings
IA, KS, MN, OH, CO (Region 4), City of Tampa, FL
FL, MD, NM, NC, OH, TX, UT, Dakota County, CO (Regions 2 and 5), NE,
City of Portland, OR
The Idaho Transportation Department has developed a new system called Guard Rail Management System (G-Rail). The G-Rail system uses Microsoft Access Visual Basic™ as an interface between the photo log data sources and the guardrail inventory database. The system uses a van that is capable of collecting high-quality images, GPS location data, and the distance traveled. Idaho is in the process of implementing an enterprise-wide data system that connects all of its business functions with available information. Roadside features included in this system are guardrail, signs, sign structures, culverts, railroad crossings, bridges, and approaches (14).
SUPPLEMENTAL DATABASES
Overall, the review of supplemental databases indicates that these could serve as an excellent source of information for MIRE data. For instance, a majority of DOTs collect surface condition data that are not present in the HSIS and non-HSIS databases. Some agencies also store rumble strip information in their databases. Similarly, some DOTs maintain separate databases for other roadway elements like signs, signals, lighting, and pavement markings. The AASHTO survey conducted in 2005 indicated that only one-third of responding DOTs use hardware management systems (12).
It should be noted that the information on supplemental databases, as extracted from available published literature, is limited. Future research should focus on how many States collect and maintain inventories of supplemental information (e.g., physical assets). Key details of these

MIRE ELEMENT COLLECTION MECHANISMS AND GAP ANALYSIS
28
databases, such as their attributes, structure, and the ability to link with other data inventories, remain largely unknown. An extensive survey of such supplemental databases would be required to ascertain what data are being collected and how they are stored.
While large volumes of data may exist at State and other agencies, the data managers may store these data in a wide variety of databases, reports, and other documents. Furthermore, disparate groups within each agency may be collecting or maintaining these various data sets. There are significant technological and institutional barriers to the cost-effective mining of these data sources for information applicable to safety. Additionally, the accuracy of the data will vary widely based on the method of collection, method of data mining, and the overall age of the datasets being used. Field data collection will be required to collect data not found in existing datasets and may be more effective in some cases where data already exist.

MIRE ELEMENT COLLECTION MECHANISMS AND GAP ANALYSIS
29
CHAPTER 6: TECHNOLOGIES FOR COLLECTION OF ROADWAY INVENTORY DATA
NEED FOR ADVANCED TECHNOLOGIES
As noted previously, many of the data gaps that were identified correspond to data elements that the MIRE workshop participants considered difficult to collect. The use of advanced technologies could help fill the data gaps for safety analyses. The expert scan team that proposed the need for MIRE also recommended the increased use of validated automated technologies that can collect roadway and roadside data at highway speeds to improve the quality of safety data.
The use of automated technologies can be cost-effective over time by minimizing the need for labor-intensive and time-consuming processes associated with manual methodologies. Considering the fact that data collection is expensive, the automated technologies can help integrate the data needs of various internal business units within an agency and minimize replication of the process. For instance, a mobile mapping system can be used to collect information for pavement management and roadside inventory effort with a single data collection operation. The use of these technologies could also help manage some inadequacies in existing practices, such as the lack of precision measurement and reporting, lack of automated tools, inadequate coverage of the roadway network, incomplete data or missing data elements, and integration issues among databases (15).
DATA COLLECTION AND PRESENTATION TECHNOLOGIES
Highway agencies invest a significant amount of resources to collect, maintain, and update roadway inventories, and they employ a host of methods and technologies for data collection to suit their inventory requirements. Many agencies currently deploy semi-or fully automated systems—such as the mobile mapping systems or light detection and ranging (LIDAR)—for roadway inventory data collection.
With technological advancements, the use of high-resolution satellite imagery in transportation applications has gained widespread attention. Though not a data collection technology, Keyhole Markup Language (KML)-based geobrowsers are increasingly being used as visualization tools for better presentation in roadway inventory applications.
While there is an array of technologies available for roadway inventory data collection and processing, the usefulness of inventory data significantly depends on the data accuracy of both georeference and descriptive information obtained from these technologies, the economic viability of data collection, and post-processing efforts. The conventional wisdom from the comparative studies reported in the literature indicates that no single technology can collect all

MIRE ELEMENT COLLECTION MECHANISMS AND GAP ANALYSIS
30
roadway inventory elements efficiently (8, 16, 17). For instance, digital imaging appears to be promising for filling the MIRE data gaps; however, it still requires labor-intensive methods to identify false positives and missed assets and produce good results. Furthermore, the level of precision for MIRE data elements is largely undefined at this point. In other words, the sensitivity of data precision levels (as collected using various techniques) to safety analysis is unknown.
The following section provides a discussion on various existing and emerging data collection technologies.
Mobile Mapping Systems
A mobile mapping system is a specially instrumented vehicle that has the flexibility to accommodate a wide array of sensors to collect georeferenced and descriptive data, as well as computers to synchronize the data collection activities and store the data. These vehicles can collect data at near highway speeds with a high degree of accuracy. They are usually configured with a combination of technologies for georeferencing that include differential GPS, distance measuring instruments (DMI), and inertial navigation systems (INS). Differential correction techniques are also applied to enhance the quality of location data gathered using GPS receivers in real time or during post-processing. INS uses accelerometers and gyroscopes that measure vehicle pitch, roll, and heading, which are then converted into roadway alignment and superelevation data.
Some systems are equipped with additional sensors to collect pavement condition and roadside inventories at highway speeds. Typical technologies include laser-based road profilers (for measuring pavement roughness), pavement imaging systems (for measuring pavement distress), scanning lasers (for measuring transverse profile/rutting), GPS, and macro-texture sensors. Agencies can also use optical character recognition for the classification of features like guardrails and signs. FHWA’s Digital Highway Measurement System (DHMS) involved an instrumented vehicle that used this approach (18).
The mobile mapping systems are typically configured with digital video cameras to collect high-resolution stereo images for roadway inventory. The use of digital video cameras or videologs allows an agency to store and analyze captured images with ease on computers with no further need for digitization. Users can enter descriptive data into the system by viewing the images, with a lower risk of errors caused by digitization.
The collected data are processed using photogrammetric software packages to obtain the desired georeferencing and descriptive data elements for the items being inventoried. Image processing packages are also used to detect and extract the selected inventory data automatically from the digital images. These packages have been used successfully in processing selected pavement distresses, traffic monitoring images, and traffic signs with a high level of accuracy (19-22).

MIRE ELEMENT COLLECTION MECHANISMS AND GAP ANALYSIS
31
LIDAR
LIDAR is an optical remote sensing system that utilizes an airborne or terrestrial platform integrated with GPS, precision INS, laser range finders, and high-speed computing for data collection. The integrated system is capable of acquiring data to produce accurate digital elevation models. In a LIDAR system, a laser scans the footprint of an object using optical pulses that are transmitted, reflected off the object, and returned to a receiver. The receiver measures the travel time of the pulse accurately from its start to its return. The GPS measures the range, angle, and position of the laser, and the INS measures the laser orientation (23). Figure 4 presents the schematic representation of an airborne LIDAR system.
Figure 4. Schematic representation of the airborne LIDAR system.
Airborne LIDAR
The airborne LIDAR systems, also called airborne laser swath mapping, can collect data at high altitudes and, thus, can cover even remote locations relatively quickly. Applications like flood mapping, coastal zone mapping, and atmospheric studies use airborne LIDAR systems, but the applications in highway engineering are limited.
LIDAR produces high-resolution three-dimensional (3D) surfaces whose accuracy depends on the density of cloud points. The cloud point collected from LIDAR can be as dense as millions of points per square mile, depending on the point spacing (distance between two points), pulse repetition rate, flying height, and flying speed. The airborne systems can produce elevation models with an accuracy of 2 inches and point spacing (indicator of horizontal accuracy) as

MIRE ELEMENT COLLECTION MECHANISMS AND GAP ANALYSIS
32
small as 1 foot. These accuracy standards may not be adequate for typical roadway inventory purposes. A higher cloud density may have useful applications but involves considerable time and cost for data collection and processing.
With LIDAR, a significant data processing effort is required to generate digital elevation models using automated processes. Several software packages are available in the market that process LIDAR cloud point data. Fernandez et al. provide a comparison of the processing capabilities of various software packages available in the market (24). Typical operations performed on LIDAR data include georeferencing, gridding, data visualization, measurement of distances and angles, primitive fitting of geometric shapes, segmentation, classification, merging of several point clouds of the same object, and filtering. Inventory applications require some manual editing and quality control.
In its current form, the true potential of airborne LIDAR in highway applications appears to be a supplemental form of traditional mapping practices. Unable to completely replace existing methods, the airborne systems only find increasing utility in roadway inventory applications when combined with traditional photogrammetry (25-29).
Terrestrial LIDAR
Terrestrial LIDAR systems use a motorized vehicle instrumented with lasers, GPS, and INS. The Centre for Applied Remote Sensing, Modeling, and Simulation (CARMS) at the University of Victoria, British Columbia, released a white paper on the various applications of LIDAR data and the general state of the LIDAR market and commercial vendors (30).
There have been several demonstrations on the use of terrestrial LIDAR for inventory data collection (31). Oregon tested a system on approximately 77 miles of highway on Interstate 5 to collect an inventory of roadside features to support various safety improvements and pavement projects. Tennessee has implemented a terrestrial LIDAR-based survey for its entire State-maintained network. A commercial vendor scanned a 6.6-mile stretch of an urban Interstate in Kansas. Similar use of terrestrial systems has been demonstrated in the U.K. and Denmark (32). Washington State DOT conducted a field pilot study to collect empirical data on the feasibility of collecting inventory information using terrestrial LIDAR. The pilot study demonstrated the potential positive impacts on business processes, and it also highlighted the need for best practices documentation for using mobile LIDAR to ensure consistent and accurate results (33).
The Minnesota DOT conducted a survey to find out which U.S. and Canadian agencies were seriously considering an investment in mobile laser systems, as well as those that already have purchased mobile scanner technology (34). The survey indicated that only Florida has purchased a terrestrial LIDAR system; Oregon and the Province of British Columbia have used this system for surveying or highway inventory purposes.

MIRE ELEMENT COLLECTION MECHANISMS AND GAP ANALYSIS
33
The literature provided by terrestrial LIDAR vendors indicates that these systems can collect typical MIRE elements, such as signs, pavement markings, and lighting (35-38). However, there is no peer-reviewed literature or proven track record to demonstrate the capability or evaluate the accuracy of terrestrial LIDAR. The utility of terrestrial LIDAR systems in roadway inventory collection is expected to be seen in the near future.
Satellite Imagery
High-resolution satellite imagery holds potential for inexpensive, real-time collection of large-area roadway inventory elements. The digital images captured using satellite imagery can be used for collecting data involving plan view measurement and feature recognition.
Hallmark et al. conducted a pilot study on a 4.1-mile corridor with four panchromatic1 imagery datasets with resolutions of 2, 6, 24, and 40 inches for feature recognition, accuracy of linear measurements, and positional accuracy of roadway inventory elements (39). The feature recognition elements included signs, traffic signals, geometric design of intersections, lane elements, roadside hardware, cross-sectional elements, pedestrian facilities, and bicycle facilities. This study included roadway elements similar to those included in the MIRE listing. The elements identified from imagery sets of varying resolutions were then compared with those identified in the field. The study found that the elements identified in the high-resolution datasets (2 and 6 inches) were consistent with those in the field, while there was a significant reduction in the number of features identified and higher measurement errors in the low-resolution datasets (24 and 40 inches). This study gives an indication as to the requirements of image resolution appropriate for roadway inventory data collection.
The positional accuracy of satellite images obtained from IKONOS, a commercial earth observation satellite launched in 1999, provided a spatial resolution of 40-inch panchromatic and 160-inch multispectral imagery2 in 7-mile swaths. The resolution of these images provided only a handful of data elements; thus, these images are inadequate for inventory applications (17). Launched in 2008, the GeoEye-1 satellite provides a spatial resolution of 16.14-inch panchromatic and 65-inch multispectral imagery in 9.44-mile swaths. These images can yield geopositioning accuracy of close to 4 inches in planimetry (i.e., the measurement of plane areas) and 10 inches in height through the use of a single ground control point (40). However, the feasibility of using GeoEye-1 imagery for roadway inventory purposes is yet to be established.
1 An image collected in the broad visual wavelength spectrum range (i.e., wavelengths from about 390 to 750 nm)
but rendered in black and white.
2 A multi-spectral image is one that captures image data at specific frequencies across the electromagnetic spectrum. The electromagnetic spectrum extends from low frequencies used for modern radio to gamma radiation at the short-wavelength end, covering wavelengths from thousands of kilometers down to a fraction of the size of an atom.

MIRE ELEMENT COLLECTION MECHANISMS AND GAP ANALYSIS
34
The positional accuracy of satellite imaging is expected to improve in the foreseeable future. Planned to launch in 2013, the GeoEye-2 satellite is expected to provide better images with a panchromatic resolution of 10 inches. The resolution of GeoEye-2 imagery may still be inadequate for routine inventory data collection purposes, but it can be used in conjunction with aerial or LIDAR imagery to produce better terrain models with minimal editing.
Oblique Aerial View (OAV) imagery is fast emerging as a supplement for orthoimagery. Orthoimagery is a map-quality aerial image corrected for topographic relief, lens distortion, and camera tilt. The biggest difference between OAV images and normal oblique images used in orthoimagery is perspective, with the latter offering more of an overhead image of a ground feature compared to the former. OAV finds applications in image analysis by providing multiple angled views of ground features and helps mitigate some of the limitations of traditional orthoimagery. While several commercial vendors offer this technology, information on large-scale, network-level implementation is yet to be seen.
While the satellite imagery provides an economic advantage to users, the available image resolution capacities often are inadequate for roadway inventory applications. However, the potential for satellite imagery applications is expected to improve as the technology improves. Nevertheless, these applications require significant post-processing and manual manipulation of data.
Applications of Keyhole Markup Language (KML) and Geobrowsers
KML is a file format that is used to display geographic data in a geobrowser. A geobrowser is a 3D virtual representation of the Earth that allows the superimposition of images obtained from satellite imagery, aerial photography, and geographic information system (GIS) 3D globe. Examples of geobrowsers include Google Earth, ESRI ArcGIS Explorer, Microsoft Virtual Earth, and the National Aeronautics and Space Administration (NASA) World Wind.
Geobrowsers use a coordinate system based on the World Geodetic System of 1984 (WGS84) for latitudinal and longitudinal components and the Earth Gravitational Model of 1996 (EGM96) Geoid vertical datum for altitude. Many browsers offer free services to view surface terrain, satellite imagery, and maps, and their commercial editions include expanded functionalities to host information internally on an agency’s own servers and datasets, as well as to use advanced geocoding capabilities with greater volume and speed in a secure domain.
The application of KML and geobrowsers would serve primarily as a visualization tool for elements in the MIRE listing. Once an agency completes data collection efforts, the agency can use these tools to enable geographic annotation and intuitive visualization of geospatial data. Agencies can also use these applications for overlaying different data sources, including the roadway network, pavement condition, sign and signal inventories, bridge inventory, traffic data, etc.

MIRE ELEMENT COLLECTION MECHANISMS AND GAP ANALYSIS
35
The California DOT’s (Caltrans’) Digital Highway Inventory Photography Program (DHIPP) uses Google Earth with the imagery and elevation data for a wide variety of applications, such as an intuitive visualization of survey control points, asset management, right-of-way record maps, and real-time traffic conditions (41). Figure 5 shows an image from Caltrans’ DHIPP showing roadway features of interest to MIRE. The Advanced Highway Maintenance and Construction Technology Research Center (AHMCT) at the University of California, Davis, is working on identifying and recommending best practices in roadway inventory for Caltrans. As part of this study, researchers are expected to develop a software-based asset management tool for tracking inventory of roadside features using a KML client (42). Similarly, HPMS is developing a data visualization using Microsoft Bing maps.
Figure 5. Caltrans DHIPP image showing roadway features (41).
USE OF AUTOMATION IN ROADWAY INVENTORY DATA COLLECTION
Prior to promoting the use of automated systems or other advanced technologies for collecting MIRE data elements, it is important to assess the extent of use and application of automated data collection by various State agencies. Most State agencies employ some form of automation to serve a particular purpose but have not yet extended it to other objectives. For example, many State agencies use automated data collection systems for pavement management purposes. This project did not determine whether these agencies use such systems for collecting inventory of roadside hardware or signs.
Under NCHRP Synthesis 20-05/Topic 34-04, NCHRP Synthesis 334: Automated Pavement Distress Collection Techniques, survey responses were collected from 43 State highway agencies, 2 FHWA offices, 10 Canadian provinces or territories, and Transport Canada regarding their automated data collection processes (19).

MIRE ELEMENT COLLECTION MECHANISMS AND GAP ANALYSIS
36
Table 10 presents the number of respondents utilizing automation for data collection using either images or sensors for different pavement distresses. As shown in the table, the respondents overwhelmingly use automation techniques for collecting pavement distress and condition data.
Table 10. Number of agencies using automated pavement distress data collection.
Distress Agency Vendor Total
Cracking 10 20 30
Roughness 31 23 54
Rutting 30 21 51
Joint Faulting 21 12 33
NCHRP Synthesis 367 found a similar trend (8). Over half of the responding States reported the use of specialized vans to collect pavement data. However, the States used the collected data only for pavement management applications. Although several States use automation techniques for collecting pavement distress or condition data, fewer use these advanced technologies for collecting other roadway inventory data. NCHRP Synthesis 367 found that only four States use videologging for collecting cross-sectional elements (e.g., barriers and clear zone maintenance), while others conduct field surveys using pen and paper, and still others do not collect these data elements at all (8).
Similarly, of the States who collect sign and pavement marking inventories, NCHRP Synthesis 367 found that most use as-built plans or videologs to obtain this information (8). Colorado and Washington use GPS technology for their sign inventories, while four other States collect retroreflectivity data for pavement markings and inventoried signs. Seven of the responding States indicated that they use sensor technology to collect geometric data elements (e.g., roadway grades and cross slope), while seven others extract these data from as-built or construction plans. Collection of geometric alignment data involves post-processing raw spatial data using specialized software packages. For instance, Florida estimates horizontal curvature information by processing centerline data using its GIS application, and Massachusetts estimates vertical alignment data using its GIS application. Five of the responding States use videologging for geometry data, two States use pen and paper, and two States do not collect this information at all.
DeGray and Hancock synthesized the practice of ground-based imaging technologies in the six New England States (43). These States collect and extract several roadway elements (typical of those in the MIRE list) from imagery for inventory purposes. This study discussed the economic viability issues in implementing these systems. As every State is concerned with a cost-benefit ratio, small and predominantly rural States, such as New Hampshire, will typically see the least “bang for their buck” and may be inclined to keep the current data collection systems in place.

MIRE ELEMENT COLLECTION MECHANISMS AND GAP ANALYSIS
37
This study also addressed the issue of underutilizing systems like videologging and the need to demonstrate its potential to users. The authors observed that the maximum effectiveness of advanced systems could be realized in a single, well-managed, well-promoted data collection system that provides nearly all of the data collection needs of the State at a relatively low cost.
While these systems can generate large volumes of data in relatively short lengths of time with limited field exposure, they also require fairly large volumes of labor to extract useful data from the raw field files. Even well-researched systems that perform automated pavement distress ratings require significant operator supervision to resolve issues that are not addressed by the processing algorithms. This situation is far more pronounced as the data extraction moves from pavements to 3D environment assets, such as signs and guardrails. While the effort to collect data by automated means is far safer and less time-consuming than manual field surveys, it is still a major undertaking.
In summary, the literature review indicates that the application of advanced technologies is limited to pavement management and videologs. However, some States have demonstrated the use of these systems for collecting other roadway elements, such as alignment features, signs, pavement markings, and guardrails. The obstacles to using these technologies are both technical and institutional. The technical difficulties include data accuracy issues and automatic information extraction from images, and the institutional challenges include a mediocre cost-benefit ratio and under-utilization.

MIRE ELEMENT COLLECTION MECHANISMS AND GAP ANALYSIS
38
CHAPTER 7: COMPATIBILITY OF COLLECTION TECHNOLOGIES WITH MIRE ROADWAY ELEMENTS
There a variety of existing and emerging technologies that an agency can employ to collect data elements that are compatible with those included in the MIRE listing. Multiple factors come into play in the selection of these data collection technologies, including cost, availability of skilled personnel, institutional challenges, and policies. To help identify appropriate technologies for MIRE, the project team categorized the data elements into different groups based on the characteristics/type of data:
Administrative (route number, functional class, etc.).
Surface measurement elements (surface friction, roughness and pavement condition).
Shape elements (curb type, hardware descriptors, lighting, etc.).
Sign elements (school zone indicator, speed limit, on-street parking presence, etc.).
Visual identification elements (surface type, rumble strip type).
Marking elements (edgeline, crosswalk presence, median left-turn lane type, etc.).
Plan view identification (curve identifiers, number of through lanes).
Plan view measurement elements (interchange type, shoulder width, etc.).
Traffic elements (AADT, bicycle count, etc.).
o FHWA provides information on traffic data collection in the TMG (10) and is currently revising it with updated methodologies and expanded count types (e.g., pedestrian and bicycle counts); traffic count collection methodologies will not be covered in this section.
These categories define the type of information needed for an element (e.g., visual identification, shape, measurement, etc.) and the functional requirements for a technology to collect such information. For example, a sign indicates the presence of on-street parking, and the technology used should be capable of recognizing the location and description (i.e., the content) of the sign. Similarly, for collecting the on-street parking type, the surface marking or striping defines the attributes (i.e., angle or parallel). Surveyors should identify the surface type (e.g., asphalt or concrete) and the rumble strip type (e.g., milled or rolled) from either high-resolution imagery or an onsite assessment. The technology that is used for collecting such elements should be able to identify surface markings. Aerial imagery could be capable of identifying striping but not the content of a sign.
It should be noted that the elements in the list above are not mutually exclusive. Some elements can be defined by two or more categories, depending on the required information.

MIRE ELEMENT COLLECTION MECHANISMS AND GAP ANALYSIS
39
For instance, location identifiers can be obtained from spatial coordinates, as well as signs. Similarly, the presence of HOV lanes can be obtained from pavement striping, signs, and plan view measurements.
The following four existing and emerging technologies were evaluated for their ability to collect the required information for MIRE:
Ground-based imagery (e.g., mobile mapping systems).
Aerial imagery.
Airborne LIDAR with imagery.
Terrestrial LIDAR.
Table 11 shows whether a particular technology has the potential to collect a certain type of data. Note that there is no additional data collection (indicated by N.A.) needed for administrative and pavement condition data items, as these elements are either already available within agencies that manage the roadway network or already being collected by the same agency for other purposes. For example, an agency can use information on pavement condition for roadways within its jurisdiction on which it already routinely collects the same information for asset management purposes.
For the shape category, where the attributes of the elements can be recognized from their shape, elements like curb type, barrier type, roadside hardware, and lighting can be recognized by all four technologies. However, there is a significant amount of post-processing involved in using these technologies where these elements have to be manually tied with imaging/LIDAR data. Automation may help to reduce the labor required in these efforts, but the problem is not a trivial one to solve, given the number of variables involved. Because the raw data must be collected from a moving platform, the imaging angle will vary greatly. Additional variables induced by weather conditions, sun glare, material variability, partial obstruction due to vegetation, passing traffic, etc. create major obstacles to automation. The trained human eye is able to manage these conditions with relative ease.
The primary problem of collecting sufficient data to locate and classify assets has largely been solved. The cost-effective reduction of these data into a database of classified and attributed assets remains a work in progress. Using these technologies requires a laborious and time-consuming effort to collect data on smaller “shape” elements, such as signalization type or pedestrian signal special features. Information on median type can be obtained from their shape and plan view.
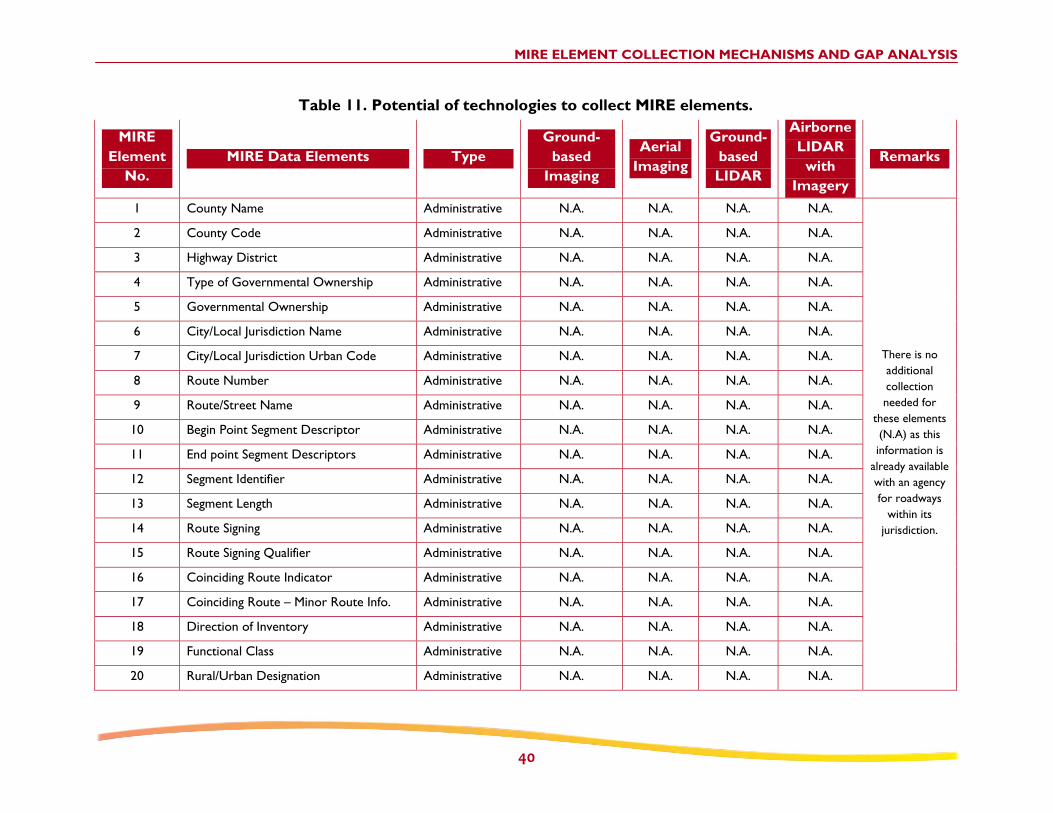
MIRE ELEMENT COLLECTION MECHANISMS AND GAP ANALYSIS
40
Table 11. Potential of technologies to collect MIRE elements.
MIRE Element
No. MIRE Data Elements Type
Ground-based
Imaging
Aerial Imaging
Ground-based LIDAR
Airborne LIDAR
with Imagery
Remarks
1 County Name Administrative N.A. N.A. N.A. N.A.
There is no additional collection needed for
these elements (N.A) as this information is
already available with an agency
2 County Code Administrative N.A. N.A. N.A. N.A.
3 Highway District Administrative N.A. N.A. N.A. N.A.
4 Type of Governmental Ownership Administrative N.A. N.A. N.A. N.A.
5 Governmental Ownership Administrative N.A. N.A. N.A. N.A.
6 City/Local Jurisdiction Name Administrative N.A. N.A. N.A. N.A.
7 City/Local Jurisdiction Urban Code Administrative N.A. N.A. N.A. N.A.
8 Route Number Administrative N.A. N.A. N.A. N.A.
9 Route/Street Name Administrative N.A. N.A. N.A. N.A.
10 Begin Point Segment Descriptor Administrative N.A. N.A. N.A. N.A.
11 End point Segment Descriptors Administrative N.A. N.A. N.A. N.A.
12 Segment Identifier Administrative N.A. N.A. N.A. N.A. for roadways
within its jurisdiction.
13 Segment Length Administrative N.A. N.A. N.A. N.A.
14 Route Signing Administrative N.A. N.A. N.A. N.A.
15 Route Signing Qualifier Administrative N.A. N.A. N.A. N.A.
16 Coinciding Route Indicator Administrative N.A. N.A. N.A. N.A.
17 Coinciding Route – Minor Route Info. Administrative N.A. N.A. N.A. N.A.
18 Direction of Inventory Administrative N.A. N.A. N.A. N.A.
19 Functional Class Administrative N.A. N.A. N.A. N.A.
20 Rural/Urban Designation Administrative N.A. N.A. N.A. N.A.

MIRE ELEMENT COLLECTION MECHANISMS AND GAP ANALYSIS
41
Table 11. Potential of technologies to collect MIRE elements (cont.).
MIRE Element
No. MIRE Data Elements Type
Ground-based
Imaging
Aerial Imaging
Ground-based LIDAR
Airborne LIDAR
with Imagery
Remarks
21 Federal Aid/ Route Type Administrative N.A. N.A. N.A. N.A.
22 Access Control Administrative N.A. N.A. N.A. N.A.
26 Surface Friction Date Administrative N.A. N.A. N.A. N.A.
28 Pavement Roughness Date Administrative N.A. N.A. N.A. N.A.
30 Pavement Condition (PSR) Date Administrative N.A. N.A. N.A. N.A.
67 Roadside Rating Administrative N.A. N.A. N.A. N.A.
101 Toll Facility Administrative N.A. N.A. N.A. N.A.
106 Bridge Numbers for Bridges in Segment Administrative National Bridge Inventory
128 Railroad Crossing Number Administrative USDOT Railroad Crossing Directory
23 Surface Type Visual Yes No No No
43 Right Shoulder Type Visual Yes No No No
47 Left Shoulder Type Visual Yes No No No
46 Right Shoulder Rumble Strip Presence and Type
Visual Yes Yes Yes Yes
Type Depends on the
resolution of camera
58 Median Shoulder Rumble Strip Presence and Type
Visual Yes Yes Yes Yes
50 Left Shoulder Rumble Strip Presence and Type
Visual Yes Yes Yes Yes
104 Centerline Rumble Strip Presence and Type
Visual Yes Yes Yes Yes
167 Transverse Rumble Strip Presence Visual Yes Yes Yes Yes
99 On-Street Parking Type Marking Yes Yes Yes Yes
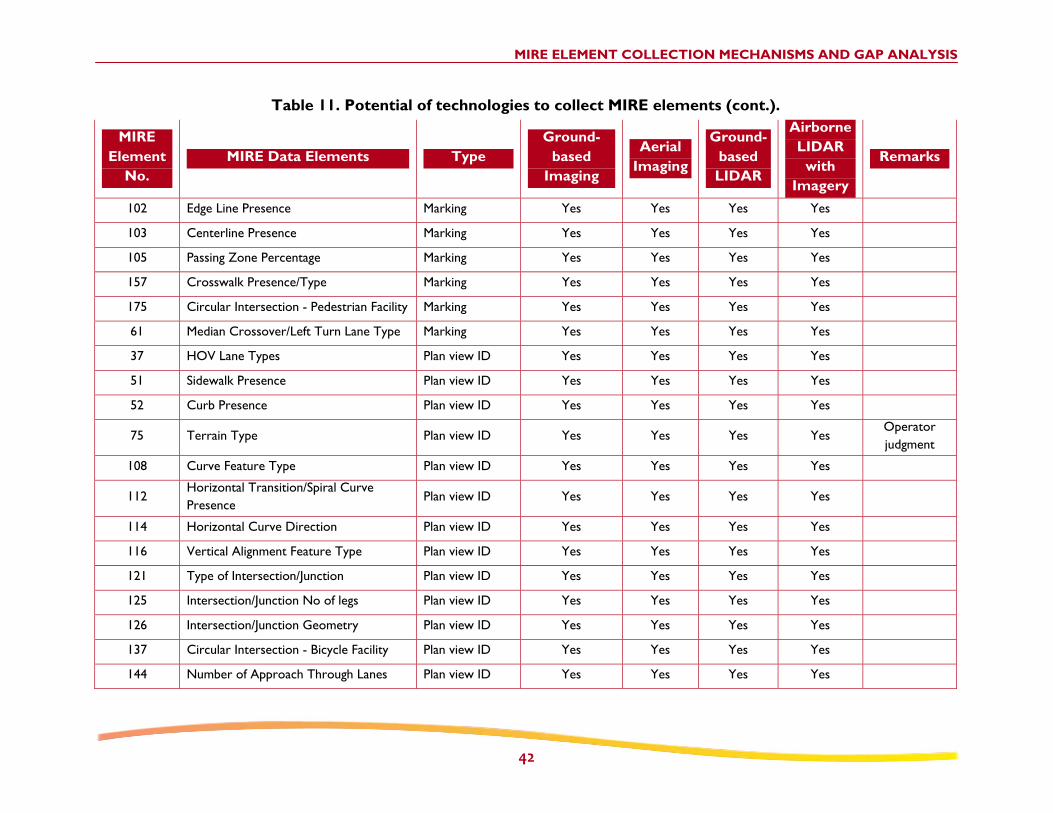
MIRE ELEMENT COLLECTION MECHANISMS AND GAP ANALYSIS
42
Table 11. Potential of technologies to collect MIRE elements (cont.).
MIRE Element
No. MIRE Data Elements Type
Ground-based
Imaging
Aerial Imaging
Ground-based LIDAR
Airborne LIDAR
with Imagery
Remarks
102 Edge Line Presence Marking Yes Yes Yes Yes
103 Centerline Presence Marking Yes Yes Yes Yes
105 Passing Zone Percentage Marking Yes Yes Yes Yes
157 Crosswalk Presence/Type Marking Yes Yes Yes Yes
175 Circular Intersection - Pedestrian Facility Marking Yes Yes Yes Yes
61 Median Crossover/Left Turn Lane Type Marking Yes Yes Yes Yes
37 HOV Lane Types Plan view ID Yes Yes Yes Yes
51 Sidewalk Presence Plan view ID Yes Yes Yes Yes
52 Curb Presence Plan view ID Yes Yes Yes Yes
75 Terrain Type Plan view ID Yes Yes Yes Yes Operator judgment
108 Curve Feature Type Plan view ID Yes Yes Yes Yes
112 Horizontal Transition/Spiral Curve Presence
Plan view ID Yes Yes Yes Yes
114 Horizontal Curve Direction Plan view ID Yes Yes Yes Yes
116 Vertical Alignment Feature Type Plan view ID Yes Yes Yes Yes
121 Type of Intersection/Junction Plan view ID Yes Yes Yes Yes
125 Intersection/Junction No of legs Plan view ID Yes Yes Yes Yes
126 Intersection/Junction Geometry Plan view ID Yes Yes Yes Yes
137 Circular Intersection - Bicycle Facility Plan view ID Yes Yes Yes Yes
144 Number of Approach Through Lanes Plan view ID Yes Yes Yes Yes

MIRE ELEMENT COLLECTION MECHANISMS AND GAP ANALYSIS
43
Table 11. Potential of technologies to collect MIRE elements (cont.).
MIRE Element
No. MIRE Data Elements Type
Ground-based
Imaging
Aerial Imaging
Ground-based LIDAR
Airborne LIDAR
with Imagery
Remarks
145 Left turn Lane Type Plan view ID Yes Yes Yes Yes
146 Number of Exclusive Left Turn Lanes Plan view ID Yes Yes Yes Yes
148 Right Turn Channelization Plan view ID Yes Yes Yes Yes
150 Number of Exclusive Right Turn Lanes Plan view ID Yes Yes Yes Yes
182 Interchange Type Plan view ID Yes Yes Yes Yes
190 Ramp Number of Lanes Plan view ID Yes Yes Yes Yes
31 Number Of Through Lanes Plan view ID / Marking
Yes Yes Yes Yes
134 Circular Intersection - Number of Circulatory Lanes
Plan view ID / Marking
Yes Yes Yes Yes
170 Circular Intersection – Presence and Type of Exclusive Right turn Lane
Plan view ID / Marking
Yes Yes Yes Yes
24 Total Paved Surface Width Plan view measurement Yes Yes Yes Yes
32 Outside Through Lane Width Plan view measurement Yes Yes Yes Yes
33 Inside Through Lane Width Plan view measurement Yes Yes Yes Yes
34 Cross Slope Plan view measurement Yes Yes Yes Yes Curve fitting
or tracing; post-
processing needed
59 Median Side Slope Plan view measurement Yes Yes Yes Yes
60 Median Side Slope Width Plan view measurement Yes Yes Yes Yes
36 Auxiliary Lane Length Plan view measurement Yes Yes Yes Yes

MIRE ELEMENT COLLECTION MECHANISMS AND GAP ANALYSIS
44
Table 11. Potential of technologies to collect MIRE elements (cont.).
MIRE Element
No. MIRE Data Elements Type
Ground-based
Imaging
Aerial Imaging
Ground-based LIDAR
Airborne LIDAR
with Imagery
Remarks
41 Width of Bicycle facility Plan view measurement Yes Yes Yes Yes
44 Right Shoulder Total Width Plan view measurement Yes Yes Yes Yes
45 Right Paved Shoulder Width Plan view measurement Yes Yes Yes Yes
48 Left Shoulder Total Width Plan view measurement Yes Yes Yes Yes
49 Left Paved Shoulder Width Plan view measurement Yes Yes Yes Yes
55 Median Width Plan view measurement Yes Yes Yes Yes
57 Median (Inner) Paved Shoulder Width Plan view measurement Yes Yes Yes Yes
62 Roadside Clear Zone Width Plan view measurement Yes Yes Yes Yes
63 Right Side Slope Plan view measurement No Yes Yes Yes Measurable
using ground based
technologies if not steep
64 Right Side Slope Width Plan view measurement No Yes Yes Yes
65 Left Side Slope Plan view measurement No Yes Yes Yes
109 Horizontal Curve Degree or Radius Plan view measurement Yes Yes Yes Yes Curve fitting
or tracing; post-
processing needed
110 Horizontal Curve Length Plan view measurement Yes Yes Yes Yes
111 Curve Superelevation Plan view measurement Yes Yes Yes Yes

MIRE ELEMENT COLLECTION MECHANISMS AND GAP ANALYSIS
45
Table 11. Potential of technologies to collect MIRE elements (cont.).
MIRE Element
No. MIRE Data Elements Type
Ground-based
Imaging
Aerial Imaging
Ground-based LIDAR
Airborne LIDAR
with Imagery
Remarks
113 Horizontal Curve Intersection/Deflection Angle
Plan view measurement Yes Yes Yes Yes
117 Percent Of Gradient
Plan view measurement Yes Yes Yes Yes
118 Grade Length Plan view measurement Yes Yes Yes Yes
119 Vertical Curve Length Plan view measurement Yes Yes Yes Yes
129 Intersection Skew Angle Plan view measurement Yes Yes Yes Yes
130 Intersection/Junction Offset Distance Plan view measurement Yes Yes Yes Yes
135 Circular Intersection - Circulatory Width
Plan view measurement Yes Yes Yes Yes
136 Circular Intersection - Inscribed Diameter
Plan view measurement Yes Yes Yes Yes
147 Amount of Left turn Lane Offset Plan view measurement Yes Yes Yes Yes
151 Length of Exclusive Left Turn Lanes Plan view measurement Yes Yes Yes Yes
152 Length of Exclusive Right Turn Lanes Plan view measurement Yes Yes Yes Yes
168 Circular Intersection - Entry Width Plan view measurement
Yes Yes Yes Yes
169 Circular Intersection - Number of Entry lanes
Plan view measurement
Yes Yes Yes Yes
171 Circular Intersection - Entry Radius Plan view measurement Yes Yes Yes Yes

MIRE ELEMENT COLLECTION MECHANISMS AND GAP ANALYSIS
46
Table 11. Potential of technologies to collect MIRE elements (cont.).
MIRE Element
No. MIRE Data Elements Type
Ground-based
Imaging
Aerial Imaging
Ground-based LIDAR
Airborne LIDAR
with Imagery
Remarks
172 Circular Intersection - Exit Width Plan view measurement Yes Yes Yes Yes
173 Circular Intersection - Number of Exit lanes
Plan view measurement Yes Yes Yes Yes
174 Circular Intersection - Exit Radius Plan view measurement Yes Yes Yes Yes
176 Circular Intersection - Crosswalk Location (distance from yield line)
Plan view measurement Yes Yes Yes Yes
177 Circular Intersection – Island Width Plan view measurement Yes Yes Yes Yes
187 Ramp Length Plan view measurement Yes Yes Yes Yes
188 Ramp Acceleration Lane Length Plan view measurement Yes Yes Yes Yes
189 Ramp Deceleration Lane Length Plan view measurement
Yes Yes Yes Yes
53 Curb Type Shape Yes Yes Yes Yes Aerial data depend on vegetation
cover; manual post-
processing; labor-
intensive; can
56 Median Barrier Type Shape Yes Yes Yes Yes
100 Roadway Lighting Shape Yes Yes Yes Yes
132 Signalization Type Shape No No No No
133 Intersection/Junction Lighting Shape Yes Yes Yes Yes
183 Interchange Lighting Shape Yes Yes Yes Yes be obtained as
derivatives based on rules
159 Pedestrian Signal Special Features Shape No No No No
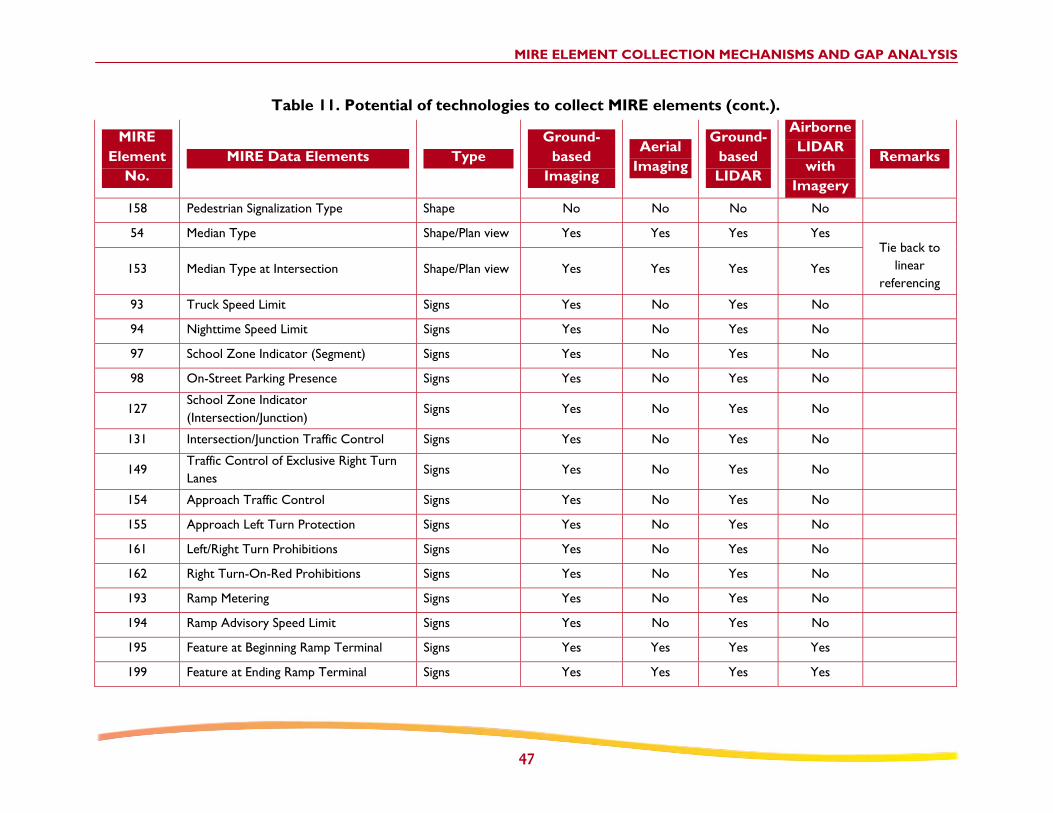
MIRE ELEMENT COLLECTION MECHANISMS AND GAP ANALYSIS
47
Table 11. Potential of technologies to collect MIRE elements (cont.).
MIRE Element
No. MIRE Data Elements Type
Ground-based
Imaging
Aerial Imaging
Ground-based LIDAR
Airborne LIDAR
with Imagery
Remarks
158 Pedestrian Signalization Type Shape No No No No
54 Median Type Shape/Plan view Yes Yes Yes Yes Tie back to
153 Median Type at Intersection Shape/Plan view Yes Yes Yes Yes linear referencing
93 Truck Speed Limit Signs Yes No Yes No
94 Nighttime Speed Limit Signs Yes No Yes No
97 School Zone Indicator (Segment) Signs Yes No Yes No
98 On-Street Parking Presence Signs Yes No Yes No
127 School Zone Indicator (Intersection/Junction)
Signs Yes No Yes No
131 Intersection/Junction Traffic Control Signs Yes No Yes No
149 Traffic Control of Exclusive Right Turn Lanes
Signs Yes No Yes No
154 Approach Traffic Control Signs Yes No Yes No
155 Approach Left Turn Protection Signs Yes No Yes No
161 Left/Right Turn Prohibitions Signs Yes No Yes No
162 Right Turn-On-Red Prohibitions Signs Yes No Yes No
193 Ramp Metering Signs Yes No Yes No
194 Ramp Advisory Speed Limit Signs Yes No Yes No
195 Feature at Beginning Ramp Terminal Signs Yes Yes Yes Yes
199 Feature at Ending Ramp Terminal Signs Yes Yes Yes Yes

MIRE ELEMENT COLLECTION MECHANISMS AND GAP ANALYSIS
48
Table 11. Potential of technologies to collect MIRE elements (cont.).
MIRE Element
No. MIRE Data Elements Type
Ground-based
Imaging
Aerial Imaging
Ground-based LIDAR
Airborne LIDAR
with Imagery
Remarks
68 Major Commercial Driveway Count Signs /Plan ID
view Yes Yes Yes Yes
Manual intervention necessary; Significant
post-processing
effort needed; QA/QC
necessary
69 Minor Commercial Driveway Count Signs /Plan view ID
Yes Yes Yes Yes
70 Major Residential Driveway Count Signs /Plan view ID
Yes Yes Yes Yes
71 Minor Residential Driveway Count Signs /Plan view ID
Yes Yes Yes Yes
72 Major Industrial/Institutional Driveway Count
Signs /Plan view ID
Yes Yes Yes Yes
73 Minor Industrial/Institutional Driveway Count
Signs / Plan view ID
Yes Yes Yes Yes
74 Other Driveway Count Signs / Plan view ID
Yes Yes Yes Yes
107 Curve Identifiers and Linkage Elements Signs / Plan view ID
Yes Yes Yes Yes Manual intervention necessary; Significant
post-processing
effort needed; quality
assurance/quality control (QA/QC) necessary
115 Grade Identifiers and Linkage Elements Signs / Plan view ID
Yes Yes Yes Yes
120 Unique Junction Identifier Signs / Plan view ID
Yes Yes Yes Yes
122 Location Identifier for Road 1 Crossing Point
Signs / Plan view ID
Yes Yes Yes Yes
123 Location Identifier for Road 2 Crossing Point
Signs / Plan view ID
Yes Yes Yes Yes
124 Location Identifier for Road 3, 4, etc Signs / Plan view ID
Yes Yes Yes Yes

MIRE ELEMENT COLLECTION MECHANISMS AND GAP ANALYSIS
49
Table 11. Potential of technologies to collect MIRE elements (cont.).
MIRE Element
No. MIRE Data Elements Type
Ground-based
Imaging
Aerial Imaging
Ground-based LIDAR
Airborne LIDAR
with Imagery
Remarks
138 Intersection Identifier for this Approach Signs / Plan view ID
Yes Yes Yes Yes
139 Unique Approach Identifier Signs / Plan view ID
Yes Yes Yes Yes
142 Approach Mode Signs / Plan view ID
Yes Yes Yes Yes
143 Approach is Two-Way, One-Way Signs / Plan view ID
Yes Yes Yes Yes
178 Unique Interchange Identifier Signs / Plan view ID
Yes Yes Yes Yes
Manual intervention necessary; Significant
post-processing
effort needed; QA/QC
necessary
179 Location Identifier for Road 1 Crossing Point
Signs / Plan view ID
Yes Yes Yes Yes
180 Location Identifier for Road 2 Crossing Point
Signs / Plan view ID
Yes Yes Yes Yes
181 Location Identifier for Road 3, 4, etc Signs / Plan view ID
Yes Yes Yes Yes
185 Interchange Identifier for this Ramp Signs / Plan view ID
Yes Yes Yes Yes
186 Unique Ramp Identifier Signs / Plan view ID
Yes Yes Yes Yes
197 Location Identifier for Roadway At Beginning Ramp Terminal
Signs / Plan view ID
Yes Yes Yes Yes
201 Location Identifier For Roadway At Ending Ramp Terminal
Signs / Plan view ID
Yes Yes Yes Yes
196 Ramp Descriptor at Beginning Ramp Terminal
Signs / Plan view ID
Yes No Yes No
198 Location of Beginning Ramp Terminal Relative to Mainline Flow
Signs / Plan view ID
Yes Yes Yes Yes
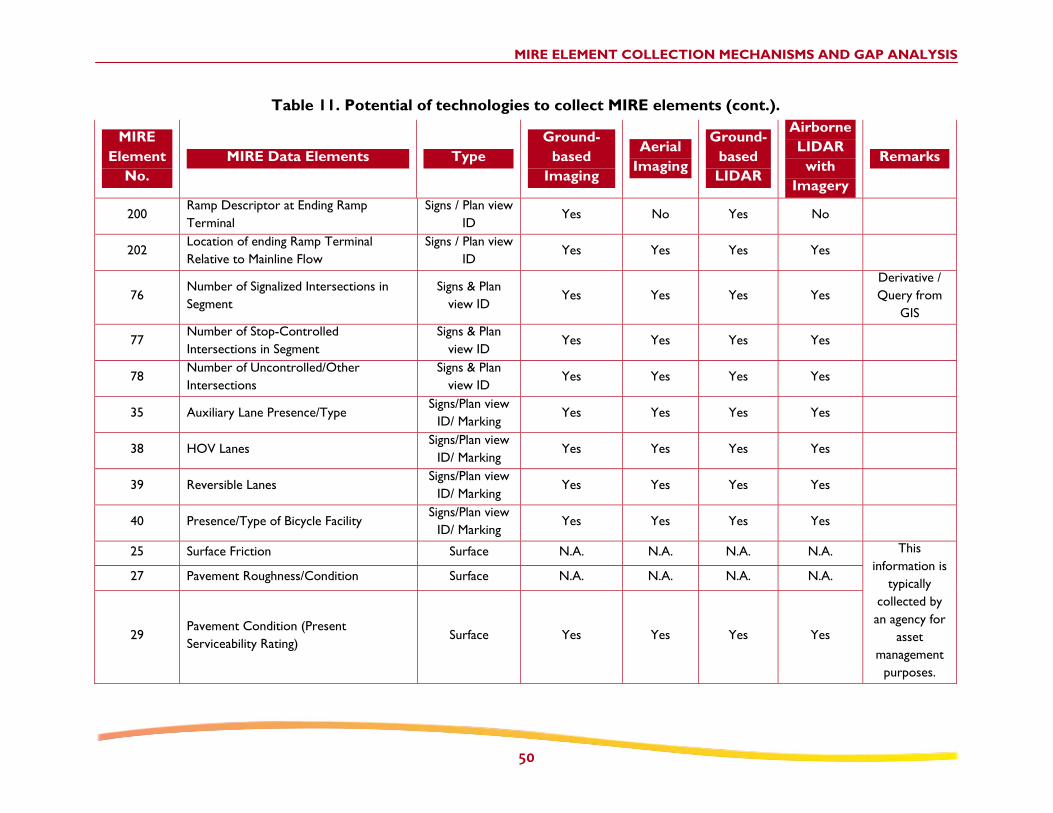
MIRE ELEMENT COLLECTION MECHANISMS AND GAP ANALYSIS
50
Table 11. Potential of technologies to collect MIRE elements (cont.).
MIRE Element
No. MIRE Data Elements Type
Ground-based
Imaging
Aerial Imaging
Ground-based LIDAR
Airborne LIDAR
with Imagery
Remarks
200 Ramp Descriptor at Ending Ramp Terminal
Signs / Plan view ID
Yes No Yes No
202 Location of ending Ramp Terminal Relative to Mainline Flow
Signs / Plan view ID
Yes Yes Yes Yes
76 Number of Signalized Intersections in Segment
Signs & Plan view ID
Yes Yes Yes Yes Derivative / Query from
GIS
77 Number of Stop-Controlled Intersections in Segment
Signs & Plan view ID
Yes Yes Yes Yes
78 Number of Uncontrolled/Other Intersections
Signs & Plan view ID
Yes Yes Yes Yes
35 Auxiliary Lane Presence/Type Signs/Plan view
ID/ Marking Yes Yes Yes Yes
38 HOV Lanes Signs/Plan view
ID/ Marking Yes Yes Yes Yes
39 Reversible Lanes Signs/Plan view
ID/ Marking Yes Yes Yes Yes
40 Presence/Type of Bicycle Facility Signs/Plan view
ID/ Marking Yes Yes Yes Yes
25 Surface Friction Surface N.A. N.A. N.A. N.A. This information is
typically collected by an agency for
asset management
purposes.
27 Pavement Roughness/Condition Surface N.A. N.A. N.A. N.A.
29 Pavement Condition (Present Serviceability Rating)
Surface Yes Yes Yes Yes

MIRE ELEMENT COLLECTION MECHANISMS AND GAP ANALYSIS
51
The required information for “sign” elements includes the location, shape, and content of the signs. The ground-based imaging and LIDAR technologies are capable of collecting this information. FHWA’s DHMS uses optical character recognition to read the content of signs, while the terrestrial LIDAR can recognize sign content from the reflectivity of laser pulses. An agency can derive certain elements, such as the number of signalized or stop-controlled or uncontrolled intersections in a segment, through a GIS-based query if information is available on the presence/type of signs and the number of intersections in a segment obtained from plan views. An agency can obtain location identifiers for curves, grades, intersecting roads, and ramps from signs or plan views, but it requires significant post-processing efforts and quality checks.
The reviewed technologies can collect all elements in the pavement markings category. However, only terrestrial imaging can collect visual data, such as surface type, shoulder type, and the presence and type of rumble strips. An agency would need high-resolution cameras to identify lane elements (e.g., auxiliary, HOV, and reversible lanes) using signs, pavement striping, or plan views, or some combination thereof. An agency can identify the presence and type of bicycle facilities by signs, marking, or plan views.
Plan views obtained from imagery or LIDAR techniques with GPS data can identify as many as 18 elements. The spatial data serve to identify attributes for elements like the type of interchanges and alignment features and the number of different lane types. Similarly, plan views can provide the means to measure as many as 40 elements, provided accurate spatial data are available. All four technologies can provide x-, y-, and z-coordinates. Using the spatial data coordinates, such as length, width, and height, an agency can measure directly or indirectly in computation of features. An agency can obtain elements like the length of ramps, curves, and turn lanes directly from the longitudinal measurements.
Similarly, elements such as the surface width, shoulder width, and entry and exit widths of circular intersections can be measured from transverse measurements. Side slopes and roadside clear zone widths can also be obtained; however, there are limitations with ground-based techniques if the sides are too steep beyond the reach of the camera or lasers. Terrain information, whether flat, mountainous, or rolling, can be gathered using the operator’s judgment.
Some elements (e.g., intersection skew angles or the entry and exit radii of circular intersections) must be derived from further computations of spatial coordinates. Roadway alignment elements (e.g., the radius of a horizontal curve or percent vertical gradient) need further computations and post-processing work such as tracing and curve fitting to obtain more accurate information.
In summary, these technologies can collect most of the data elements in MIRE. However, significant post-processing efforts, including manual intervention and quality checks, are necessary in most cases. These technologies have limitations too. The airborne technologies are

MIRE ELEMENT COLLECTION MECHANISMS AND GAP ANALYSIS
52
not appropriate for collecting information on signs, whereas the ground-based technologies have limitations in collecting information on side slope and width if the slope is too steep. Only terrestrial imaging can collect information on image elements where high-resolution is necessary. None of these technologies can collect information on smaller objects for traffic control, such as the type of pedestrian signals. It also should be noted that the scope of information provided in Table 11 is restricted to the capabilities of these four technologies. However, other important factors, including the accuracy of information and cost considerations, were not taken into account.
The fact that a system is capable of extracting an asset with accurate attributes is not a direct indication that the system is capable of producing these results in a cost-effective manner. Each system has a different set of requirements for field data collection and subsequent office work to extract asset results. The efforts required to produce high-quality results in a timely manner are significant but difficult to quantify. The true time and cost to extract assets is proprietary for most data collection vendors.

MIRE ELEMENT COLLECTION MECHANISMS AND GAP ANALYSIS
53
CHAPTER 8: CONCLUSIONS AND RECOMMENDATIONS
The following conclusions are drawn from this study:
The HSIS and non-HSIS State databases reviewed in this study do not contain all of the inventory data needed for conducting sophisticated safety analyses. The HSIS and non-HSIS databases include a reasonable number of data elements for MIRE’s roadway segment location/linkage, classification, cross section (lane, shoulders, and medians), surface condition, and traffic volume subcategories. However, most of these databases lack some specific data elements (e.g., surface friction, rumble strips, curbs, and sidewalks) in these subcategories.
None of the databases reviewed herein included any information on traffic volumes, facilities, and other features for pedestrians and bicycles. HPMS provides only statewide summaries of motorcycle data (percent of total travel related to motorcycles) for each functional classification.
Only a few State databases have information on basic alignment features for horizontal curves and vertical grades. Often these databases lack geometric features that are critical to safety analyses.
While only a few of the HSIS State databases contain limited information on location and traffic volumes, supplementary analyses of available traffic and spatial data may help establish information for intersections, interchanges, and ramps.
Among the HSIS states, only California and Minnesota have intersection files that contain information on both intersection geometry and intersection traffic control. None of the non-HSIS inventories contain data to describe traffic control at intersections, turn counts and prohibitions, rumble strips, intersection geometry, and circular intersections.
Most of the State databases reviewed in this study do not include information on roadside elements, safety hardware, signs, signals, pavement markings, or lighting.
Per the results of the polls conducted as part of the MIRE workshops, the data elements that are considered difficult to collect tend to be the data elements that are missing from existing data inventories.
The HPMS inventory contains 21 Full Extent and 24 Sample data items in MIRE. While HPMS only requires a large number of data items for sample segments rather than for the Full Extent file, the review of HPMS could indicate what data the States may have in their databases. There appears to be a strong correlation between the data available in State databases and HPMS reporting requirements.

MIRE ELEMENT COLLECTION MECHANISMS AND GAP ANALYSIS
54
Automated data collection techniques seem to have an edge over manual surveys in terms of improved efficiency and accuracy. Adoption of these techniques for data collection would help to ensure crew safety and cost-efficiency, which might make agencies more likely to collect the data elements necessary for MIRE. However, most of the automated techniques require further development before specific MIRE elements can be collected.
Most States have used automated data collection technologies successfully for pavement management purposes. However, only a few have used these techniques for collecting other roadway inventory data, such as alignment features. Some States still extract data from as-built plans, and others do not collect the data at all.
The specialized instrumented vehicles and the mobile mapping system appear to be the most popular and most promising choice for States’ inventory data collection. These systems are well-equipped to collect MIRE data elements and for other inventory purposes.
Agencies are increasingly using technologies (e.g., LIDAR and satellite imagery) for data collection purposes. However, they require a concentrated effort for automated data extraction and post-processing. The increased use of these technologies in both research and production-level projects, as well as technological advancements, will help move these issues forward.
Agencies can use the KML-based browsers, such as Google Earth, as a visualization tool for presenting roadway inventory data.
Agencies can collect most of the elements in the MIRE listing using the technologies evaluated in this study; however, there are limitations in their capabilities. Significant post-processing will be required to extract the desired MIRE data elements using manual, fully automated, or semi-automated methods. Since agencies do not routinely collect many of the MIRE data elements during the automated data collection surveys, agencies may need to develop standard formulas or analysis methods to ensure that the data collected meet MIRE requirements.
While much of the data required for MIRE exists in the record sets of agencies, particularly larger agencies, often the agency has the data scattered among disparate databases and paper record sets. The data may be inaccurate due to either poor data collection or data aging. An up-to-date, accurate, and comprehensive dataset is needed.
This research effort includes a thorough review of all readily available resources; however, it was not an exhaustive examination of each State’s collection practices. Additional potential research could include a more comprehensive review of all State data inventories and systems.

MIRE ELEMENT COLLECTION MECHANISMS AND GAP ANALYSIS
55
RECOMMENDATIONS
The key recommendations for addressing the MIRE data gaps are as follows:
Agencies should consider using available information systems, such as asset management systems, to serve as alternate sources of data for MIRE.
Other supplemental systems that contain inventories of physical assets (e.g., roadside hardware, signs, and signals) can also be used for filling the data gaps. Future research should focus on exploring other supplemental databases to determine their value for collecting MIRE data.
States should consider integrating the information collected for various internal purposes (e.g., planning, asset management, etc.) across the entire agency to create linkages and export data between systems. In this vein, States should explore cloud computing solutions and data warehousing techniques to achieve better integration.
States should also consider integrating their data needs to save time and resources.
States should develop data standards for MIRE collection to ensure data quality and facilitate transfer between information systems.
The public and private sector should explore the development of automated techniques for extracting inventory feature data from advanced collection techniques into a usable database format.
Quality data are essential for making informed decisions regarding the design, operation, and safety of roadways. However, collecting additional roadway safety data can be a large undertaking. Integrating existing data systems, standardizing data collection and storage, and utilizing automated technologies are just some of the recommendations for States to move forward in expanding their data capabilities. These steps can help States implement a roadway inventory system, such as MIRE MIS, to help support their safety programs through data-driven decision-making.

MIRE ELEMENT COLLECTION MECHANISMS AND GAP ANALYSIS
56
REFERENCES
1) Federal Highway Administration, Highway Safety Improvement Program Reporting Guidance, Federal Highway Administration, Washington, DC, May 2009.
2) American Association of State Highway and Transportation Officials, Highway Safety Manual, 1st Edition, American Association of State Highway and Transportation Officials, Washington, DC, 2010.
3) Lefler, N., F. Council, D. Harkey, D. Carter, H. McGee, and M. Daul. “Model Inventory of Roadway Elements – MIRE Version 1.0,” Federal Highway Administration, FHWA-HRT-10-048, Washington, DC, October 2010.
4) Furst, A. “Guidance Memorandum on Fundamental Roadway and Traffic Data Elements to Improve the Highway Safety Improvement,” Federal Highway Administration, August 1, 2011.
5) Council, F.M. and D.L. Harkey. Traffic Safety Information Systems International Scan: Strategy Implementation White Paper, Report No. FHWA-HRT-06-099, Federal Highway Administration, McLean, VA, 2006.
6) National Highway Traffic Safety Administration. Model Minimum Uniform Crash Criteria, Third Edition, Washington, DC, 2008.
7) Council, F.M., D.L. Harkey, D.L. Carter, and B. White. Model Minimum Inventory of Roadway Elements—MMIRE, Report No.FHWA-HRT-07-046, Federal Highway Administration, McLean, VA, 2007.
8) Federal Highway Administration, HPMS Reassessment 2010+ Data Specifications, Final Report, Federal Highway Administration, Washington, DC, May 2009. http://www.tfhrc.gov/safety/pubs/05055/05055.pdf (Accessed August 6, 2009.)
9) Ogle, J.H. Technologies for Improving Safety Data, NCHRP Synthesis 367, Transportation Research Board, Washington, DC, 2007.
10) Federal Highway Administration, Traffic Monitoring Guide, FHWA-PL-010-021, Federal Highway Administration, Washington, DC, 2001.
11) Federal Highway Administration, State Pavement Management Survey, Technical Memorandum 3, Federal Highway Administration, Washington, DC, 2004.
12) Hensing, D.J. and S. Rowshan. Roadway Safety Hardware Asset Management Systems Case Studies, Report No. FHWA-HRT-05-073, Federal Highway Administration, McLean, VA, 2005.

MIRE ELEMENT COLLECTION MECHANISMS AND GAP ANALYSIS
57
13) Markow, M.J. Managing Selected Transportation Assets: Signals, Lighting, Signs, Pavement Markings, Culverts, and Sidewalks, NCHRP Synthesis 371, Transportation Research Board, Washington, DC, 2007.
14) Federal Highway Administration, Transportation Asset Management System for Roadway Safety: Idaho's Guardrail Management System Saves Lives, Time, and Money, Publication No. FHWA-HRT-05-055, Federal Highway Administration, McLean, VA, 2005.
15) Pfefer, R.C. and T.R. Neuman. Improved Safety Information to Support Highway Design, NCHRP Report 430, Transportation Research Board, Washington, DC, 1999.
16) Hummer, J.E., C.R. Scheffler, A.J. Khattak, and H.A. Karimi. “Choosing an Inventory Data Collection System,” Transportation Research Record No.1690, Journal of the Transportation Research Board, Washington, DC, 1999.
17) Karimi, H.A., J.E. Hummer, and A.J. Khattak. Collection and Presentation of Roadway Inventory Data, NCHRP Report 437, Transportation Research Board, Washington, DC, 2000.
18) Trentecoste, M. “FHWA’s Digital Highway Measurement and Ground Penetrating Radar Technologies,” 5th international Visualization in Transportation Symposium and Workshop, Denver, CO, 2006.
19) McGhee, K.H. Automated Pavement Distress Collection Techniques, NCHRP Synthesis 334, Transportation Research Board, Washington, DC, 2004.
20) Wang, K.C.P., W. Gong, and Z. Hou. “Automated Inventory and Analysis of Highway Assets,” Report No. MBTC 2065, Mack-Blackwell Transportation Center, University of Arkansas, Fayetteville, AR, 2007.
21) Rosenbaum, D., B. Charmette, F. Kurz, S. Suri, U. Thomas, and P. Reinartz. “Automatic Traffic Monitoring from an Airborne Wide Angle Camera System,” Proceedings of Commission III, ISPRS Congress, The International Society for Photogrammetry and Remote Sensing, Beijing, 2008. http://www.isprs.org/congresses/beijing2008/proceedings/3b_pdf/105.pdf (Accessed August 6, 2009.)
22) Tsai, Y. Using Image Pattern Recognition Algorithms for Processing Video Log Images to Enhance Roadway Infrastructure Data Collection, NCHRP-IDEA Program Project Final Report, National Cooperative Highway Research Program, Transportation Research Board, Washington, DC, 2009.
23) Mosaic Mapping Systems, A White Paper on LIDAR Mapping, 2001. ftp://ftp-fc.sc.egov.usda.gov/NCGC/products/elevation/lidar-applications-whitepaper.pdf (Accessed August 6, 2009.)

MIRE ELEMENT COLLECTION MECHANISMS AND GAP ANALYSIS
58
24) Fernandez, J.C., Singhania, A., Caceres, J., Slatton, K.C., Starek, M., Kumar, R., "An Overview of LIDAR Point Cloud Processing Software," GEM Center Report No, Rep_2007_12_001, University of Florida, Gainesville, 2007. http:// www.aspl.ece.ufl.edu/reports/GEM_Rep_2007_12_001.pdf (Accessed May 14, 2010.)
25) Pottle, D. “Asset Maintenance Management,” Earth Observation Magazine, Vol. 7, 1998.
26) Khattak, A.J., S.L. Hallmark, and R.R. Souleyrette. “Application of Light Detection and Ranging (LIDAR) Technology to Highway Safety,” Transportation Research Record No. 1836, Journal of the Transportation Research Board, Washington, DC, 2003, pp. 7-15.
27) Shamayleh H., and A.J. Khattak. “Utilization of LiDAR Technology for Highway Inventory,” Proceedings of the 2003 Mid-Continent Transportation Research Symposium, Iowa State University, August 2003.
28) Souleyrette, R.R., S.L. Hallmark, and D. Veneziano. "Comparison of LIDAR and Conventional Mapping Methods for Highway Corridor Studies," Final Report, Iowa State University, Prepared for the National Consortium on Remote Sensing in Transportation for Infrastructure, 2002.
29) Veneziano, D., R. Souleyrette, and S. Hallmark. “Integrating LIDAR and Photogrammetry in Highway Location and Design,” Transportation Research Record No.1836, Journal of the Transportation Research Board, Washington, DC, 2003.
30) Centre for Applied Remote Sensing, Modeling and Simulation (CARMS), “LIDAR – Overview of Technology, Applications, Market Features & Industry,” University of Victoria, British Columbia, 2006. http://carms.geog.uvic.ca/LiDAR%20Web%20Docs/LiDAR%20paper%20june%202006.pdf (Accessed August 6, 2009.)
31) Hohner, L.N. “Opportunities on the Move,” Point of Beginning, Troy, MI, 2009. http://www.pobonline.com/Articles/Features/BNP_GUID_9-5-2006_A_10000000000000537476 (Accessed August 6, 2009.)
32) Haala, N., M. Peter, J. Kremer, and G. Hunter. "Mobile LIDAR Mapping for 3D Point Cloud Collection in Urban Areas - A Performance Test,” Proceedings of the XXI ISPRS Congress, Beijing, 2008. http://www.isprs.org/proceedings/XXXVII/congress/5_pdf/191.pdf (Accessed November 23, 2010.)
33) Yes, K., B. Ravani, and T. Lasky. LiDAR for Data Efficiency, WA-RD 778.1, Washington State Department of Transportation, September 2011.
34) AASHTO RAC Member Survey, Mobile Laser Scanner Survey, American Association of State Highway and Transportation Officials, Washington, DC, 2009. http://research.transportation.org/?siteid=55&pageid=3076 (Assessed August 6, 2009.)

MIRE ELEMENT COLLECTION MECHANISMS AND GAP ANALYSIS
59
35) Streetmapper, “LIDAR Application: Accurate Terrestrial Laser Scanning from a Moving Platform,” Geomatics World, Herts, United Kingdom, 2006. http://www.streetmapper.net/articles/Paper%20-%20Geomatics%20World%20-%20Accurate%20Terrestrial%20Laser%20Scanning%20-%20July%202006.pdf (Accessed August 6, 2009.)
36) Terrametrix, Asset Inventory, Terrametrix, LLC, Omaha, NE, 2008. http://www.terrametrix3d.com/Asset%20Inventory.html (Accessed August 6, 2009.)
37) Glennie, C., “A Kinematic Terrestrial LIDAR Scanning System,” Terrapoint USA, Inc., The Woodlands, TX, 2009. http://ambercore.com/files/Paper%20-%20A%20Kinematic%20Terrestrial%20LiDAR%20Scanning%20System.pdf (Accessed August 6, 2009.)
38) Mandli, Applications of SRH Systems, Mandli Communications Inc., Madison, WI, 2009. http://www.mandli.com/systems/vba.php (Accessed August 6, 2009.)
39) Hallmark, S., K. Matravadi, R.R. Souleyrette, and D. Veneziano. "Use of Remote Sensing for Collection of Data Elements for Linear Referencing Systems," Submitted to the Iowa Department of Transportation, 2001. http://www.ctre.iaState.edu/reports/remote_sensing_lrs.pdf (Accessed August 6, 2009.)
40) Fraser, C. and M. Ravanbakhsh. “Georeferencing Accuracy of GeoEye-1 Imagery,” Photogrammetric Engineering & Remote Sensing, American Society of Photogrammetry and Remote Sensing, Bethesda, MD, 2009. http://www.asprs.org/publications/pers/2009journal/june/feature.pdf (Accessed August 6, 2009.)
41) Ewers, R. “Google Earth Implementation at Caltrans,” AASHTO GIS for Transportation Symposium, Nashville, TN, 2007. http://www.gis-t.org/files/vwJpK.pdf (Accessed August 6, 2009.)
42) Advanced Highway Maintenance and Construction Technology, "Best Practices in Roadside Inventory Assessment," University of California Davis, 2007. http://www.ahmct.ucdavis.edu/index.php?title=RoadsideInventory (Accessed August 6, 2009.)
43) DeGray, J. and K.L. Hancock. Ground-Based Image and Data Acquisition Systems for Roadway Inventories In New England, A Synthesis of Highway Practice, Report No. NETCR 30, Prepared for the New England Transportation Consortium, Storrs, CT, 2002.

For More Information:Visit: http://www.mireinfo.org/
FHWA, Office of SafetyRobert [email protected]
FHWA-SA-11-49