mistik paper journalv - the idrc digital library
TRANSCRIPT

Assessing the Impacts of Forest Management on Aboriginal Hunters: Evidence from Stated and Revealed Preference Data1
Wiktor Adamowicz2, Peter Boxall, Michel Haener, Yaoqi Zhang, Donna Dosman and Juanita Marois
Department of Rural Economy
University of Alberta Edmonton, AB
Canada T6G-2H1
November, 2002
Corresponding author: Dr. Peter Boxall, Department of Rural Economy, University of Alberta, Edmonton Alberta, Canada T6G-2H1. Office phone : 780-492-5694; Fax: 780-492-0268. Email address: [email protected]
1 This research was supported by Mistik Management, the Social Sciences Humanities Research Council, Natural Sciences and Engineering Research Council and the Canadian Forest Service (SSHRC-NSERC-CFS Research Partnerships Program). 2 Adamowicz was a Gilbert White Visiting Fellow at Resources for the Future, Washington, D.C. when this paper was prepared.

2
Assessing the Impacts of Forest Management on Aboriginal Hunters: Evidence from Stated and Revealed Preference Data. Abstract: Assessing the impacts of forest harvesting activities on Aboriginal People and incorporating these considerations into forest management plans is one of the challenges facing Canadian forest managers. In this study we model hunting behavior using stated and revealed preference data on subsistence use of wildlife resources. We use this framework to assess the impacts of forest management changes on Aboriginal People in northwestern Saskatchewan. Innovative approaches to data collection are employed to address challenges in obtaining data in these contexts. The econometric analysis combines the stated and revealed preference information to account for limitations in the revealed preference data. Monetary measures of welfare are examined, but we also assess resource compensation and zoning as mechanisms for addressing the impact of forest harvesting on subsistence wildlife use. The results also demonstrate the use of GIS information in linking forest management and Aboriginal resource use.

3
Introduction Most forest management activity in Canada takes place on public land. Forest managers
operating on public lands are required to take into account non-timber values in addition to
timber values when making management plans. One of the major beneficiaries of non-timber
values are Aboriginal People (Haener and Adamowicz, 2000). The majority of Canada’s
Aboriginal People live in the forest and forest resources are culturally as well as materially
important for them (Tobias and Kay 1993; Usher 1976; Beckley and Hirsch 1997). Aboriginal
People also account for a substantial percentage of northern Canada’s population and their
population growth rates are significantly higher than the rest of the Canadian population
(DIAND, 2001). Policy makers have begun to recognize that the values of Aboriginal People
should be incorporated into management planning and forestry activity and are increasingly
requiring forest managers to consult with Aboriginal People before embarking on management
plans.
It is not clear, however, how the values of Aboriginal People can be incorporated into
forest management planning. Conceptually, these values could be incorporated by adjusting the
optimal timber rotation and harvesting plan for non-timber values (Bowes and Krutilla, 1985;
Mendelsohn, 1996). This would involve measuring the values associated with non-timber goods
at different forest ages and modifying rotation ages and harvesting plans to account for these
values (e.g. Englin, 1990). In practice difficulties arise when collecting general harvest
information given there are many non-timber goods to consider, and the spatial nature of the ir
values must be accounted for to be useful from a forest management perspective. A further
difficulty is that information about the use of non-timber goods is privately held by Aboriginal
People and this information on wildlife harvesting, for example, will not be freely released
because of its value to hunters and its sensitive nature. Information may also be withhe ld because
of the cultural importance of certain sites or activities. Aboriginal protests against forestry
activity may also result in difficulties in gathering information on non-timber harvest activities.
Given the cultural significance of these resources, and that different regulations apply to
Aboriginal harvesters, information from recreational hunting licenses and related wildlife harvest
statistics that are routinely gathered from non-aboriginal hunters are not relevant for most
aboriginal hunters. These issues suggest that data gathering techniques used in typical studies of
recreational hunting demand are not useful in an Aboriginal hunting context.

4
In addition to obtaining information on activity levels or use of non-timber products,
incorporation into economic models typically requires assessment in monetary terms, which
introduces further difficulties. First, monetary valuation may imply property rights that are
rejected by the Aboriginal People. Property rights issues surrounding Aboriginal Peoples’ access
and rights to forest resources remain controversial. A contingent valuation approach that
requests a willingness to pay for improved quality of non-timber goods would likely be rejected
as it implies that the Aboriginal People do not have the rights to the resource. An approach that
involved an offer of compensation would also likely be rejected, in part because of the usual
difficulties with compensation based contingent valuation but also because of the lesser
importance of monetary transactions for some segments of the Aboriginal population. In cases
where monetary values have been required for compensation replacement cost methods have
been used (e.g. Usher, 1976). Even though these methods have been criticized (Beckley and
Hirsch, 1997; Brown and Burch, 1992; see also Haener et al. 2001b) they continue to be popular
in applied work. In this paper we view the impact of forest management activity as broader than
simply a reduced harvest of wild game. In fact, forestry activities may result in increased game
populations in some cases, yet they may reduce the welfare of the hunters. Therefore, we choose
to model actual behavior and focus on the behavioral changes and implied value changes arising
from changes in the forest environment. A behavioral approach also allows us to examine non-
monetary as well as monetary measures of compensation.
The challenges described above can be summarized as data collection challenges and
valuation challenges. In this study we describe an integrated approach that attempts to address
both issues. The study is carried out in a Forest Management Area (FMA) in Northern
Saskatchewan. Mistik Management, a not-for-profit corporation, manages this area. Mistik’s
management’s objectives are to manage the 3.3 million ha area to provide fibre for a pulp mill
and a sawmill located near Meadow Lake Saskatchewan. The company is to do this without
compromising the non-timber resources flowing from the forest region. A unique aspect of this
situation is the fact that a single entity manages a large landscape with the objective to supply
mills with different fibre requirements. Furthermore, the Meadow Lake Tribal Council1 owns the
NorSask sawmill to which Mistik Management supplies fiber. Thus, concerns regarding the flow
1 This is an organization consisting of nine First Nations that is charged with providing services and programs to facilitate economic development for the communities in the region.

5
of non-timber resources to Aboriginal People are integral to Mistik’s land management
approach. The firm has also put considerable effort into developing co-management boards with
Aboriginal communities in the region and providing mechanisms for Aboriginal People to
benefit from the employment opportunities created in the region.
This paper begins with a description of a data collection effort that focused on building
trust and developing the research program in cooperation with the communities. This unique data
collection approach, we believe, is likely the only way to collect data of the type required for
assessment of aboriginal non-timber values2. Three types of data were collected: (1) Information
on “special sites” identified by members of the Aboriginal Community was collected. The
community members expected the researchers to pass information on these sites on to the
management agency so that action could be taken to avoid harvesting in or near these sites,
though no cessation of forestry activity was promised by the researchers or Mistik. This
information included identification of areas with high moose populations, cabins, salt licks and
other attributes of the land. This “traditional ecological knowledge” of the hunters is an
important component of our modeling strategy. (2) Information on actual hunting activities was
collected from Aboriginal hunters. The collection of this revealed preference (RP) information is
described below. (3) Stated preference (SP) information was collected to better ident ify
preferences for attributes of wildlife harvesting sites. In addition to the data gathered from the
Aboriginal People, data on forest characteristics were obtained from geographical information
system (GIS) data provided by Mistik Management.
After describing the data collection process the paper continues with a description of the
modeling process (combining RP and SP data) and the simulation of hunting behavior following
forest-harvesting plans. The impacts of forest harvesting on hunting are examined using
monetary welfare measures as well as a form of resource compensation. In addition, an
alternative forest management strategy that involves concentrated forest harvesting (or zoning) is
explored.
2 The data collected at the individual level are confidential. Even representations of predicted activities (maps, etc.) that are based on these individual data are considered confidential. In this paper results are presented in aggregate form or in cases where more disaggregate results are presented, all identifiers have been removed to prevent any possibility of revealing individual level information. The use of such information in forest management planning clearly requires a similar degree of protection of confidential information by the management agency. Without such agreements it is unlikely that private information of this type will be made available.

6
The results suggest that modeling actual behavior can be used as a method of capturing
some of the value of non-timber resources accruing to Aboriginal People. These methods also
provide significant insight into the impact of forest harvesting on non-timber activities. However,
substantial investments in data collection are required in order to obtain data for such analysis.
Furthermore, challenges in identifying the opportunity cost of time make the monetary valuation
of non-timber resources difficult. Use of resource compensation methods, however, appears to
be promising. The methods presented in this paper provide insights into the potential for resource
compensation as a practical way to incorporate the value of Aboriginal People into forest
management. The analysis of zoning, or concentrated forest harvesting versus dispersed
harvesting, also suggests potential for this as an approach that incorporates Aboriginal values
into forest management. The paper concludes with a discussion of some of the limitations of the
study and challenges associated with incorporating Aboriginal values into forest management
planning.
Data Collection Study Area and Sample
The study area for this project is the Millar Western-NorSask Forest Management
Agreement (FMA) area in northwestern Saskatchewan, which extends along the Alberta-
Saskatchewan border, comprising 3.3 million ha of land (see Figure 1). The current population of
the FMA area is about 25,000 spread over about 22 communities in and around the FMA area.
This population includes people of Cree, Dene, Metis and European descent. Although NorSask
utilizes the softwood and Millar Western utilizes the hardwood in the region, the landscape
planning for the region as a whole is undertaken by Mistik Management Ltd. Mistik’s mandate
is “to provide the mills with a long term sustainable wood supply while taking into account the
many resources and uses of the forest” (Mistik Management Information Booklet).
Data Collection Process
Initial contacts with the communities and the forest management agency identified that
even though Aboriginal People are engaged in collection and use of many different non-timber
forest products, large game harvesting (in particular moose; deer and caribou to a lesser extent)
was considered the most important for this study. The community members themselves were

7
interested in participating in a study of hunting as this activity is important culturally as food for
hunters and other members of the community, and as an activity that could be significantly
affected by forest management actions. Thus, the initial contacts with the communities to obtain
permission to conduct research also helped to focus the research question on a topic of interest to
the communities. An approach that engages the community in defining the research program is
emerging as a requirement in conducting research with Aboriginal communities.
During the period October 1999 to September 2000, 124 interviews with Metis and First
Nations hunters were conducted in 7 communities (Green Lake, Waterhen, Canoe Narrows, Jans
Bay, Cole Bay, Beauval and Dillon) representing 5 co-management areas. Slightly more Metis
(59%) hunters were interviewed than First Nations (41%) hunters. In addition, an attempt was
made to capture hunters from both northern (37%) and southern (63%) communities, to facilitate
investigating the influence of better access to larger commercial centers on harvesting behavior.
The process by which the data were collected differed from previous hunting research in
the economic literature. Data were collected in informal in-person interviews. While the design
of the survey was to be a straightforward question and answer session, the interview that evolved
was more of a conversation allowing “story telling” and elicitation of information from a
conversation. The interviews took approximately 40-120 minutes and averaged just over one
hour. Further information on the sample and the interview process can be found in Dosman et al.
(2002).
Trust was an important factor in the entire process. Community members were
apprehensive about discussing hunting and trapping activities with a stranger, especially a non-
Aboriginal person. In response, we employed one primary interviewer who became known in the
communities and developed relationships with the local people. We also employed a community
resident who socially and culturally had access to the hunters. This person helped to arrange
interviews, attended them to ease the participants, and translated some unfamiliar concepts. The
interviewer lived in the communities for approximately one year, which facilitated the
development of trust between the interviewer and community members. The fact that the
interviewer lived and participated in the community was a fundamental component of the
research process.
Reciprocity also played a vital role in securing relationships with the respondents.
Reciprocity for participation in the study was offered at several levels. First, the research group

8
made a commitment to report back the findings to each of the communities. Each hunter was
asked during the mapping exercise to identify special sites such as nesting areas, calving areas,
burial sites, cabins or historical sites. A map of special sites was created for each community and
presented to community leaders. Second, an incentive of a draw in each community for a gift
certificate at a local hunting store was offered to all respondents. Individual respondents
responded favourably to the incentive. Third, in interviews with First Nations elders an offering
of tobacco was made at the beginning of the interview. This offering is a sign of respect and
helps to formalize the relationship between the interviewer and the elder.
Revealed Preference Information
Hunting trip information for the past hunting season was collected in two complementary
formats. The first was a traditional trip log, which recorded the location and frequency of each
trip. It also included information on the approximate distance traveled, the modes of
transportation, with whom the trip was taken, the duration of the trip, the season of the trip and
the number of moose and other game harvested by the individual being interviewed and by the
group.
The second format was a map of the NorSask FMA area on which the hunters drew their
general hunting area and the location of the trips recorded in the trip log. 3 We defined the general
hunting area as the entire area in which an individual hunter would consider going to hunt
moose.
Both the map and the trip log were used simultaneously in collecting information. Some
of the more traditional hunters would require significant interpretation of the map because they
were not accustomed to seeing horizontal representations of the land base. Once this was
accomplished, the use of a map as a visual tool worked to make the respondents feel more at ease
with the process. Many informants preferred to talk in stories and they would point out the sites
and then begin to remember the rest of the trip details that were needed to complete the trip log.
Information provided on each respondent’s map was transferred into digital form using
ArcView. Mistik Management provided digital files for the region including lakes, rivers, roads,
trails, FMA and other planning unit boundaries. This information was used as geographic
references for developing general hunting area and hunting trip locations. Although individual
3 The map provided was approximately 6x3 feet in size so that detailed information could be recorded.

9
trips were digitized, to ensure confidentiality, the data were aggregated for each community.
Aggregating the individual general hunting areas by community also helped determine the
geographical extent of hunting trips for each community. General hunting areas for several
communities overlapped, but for the most part they followed the boundaries of Fur Conservation
Areas which are based on traditional trapping areas.
Special Sites Map / Information
Respondents were also asked to mark ‘special sites’ such as salt licks, cabins, areas of
exceptional moose habitat, burial sites, and avian nesting areas on the maps.4 These maps are
similar to those generated in traditional land-use mapping exercises and reflect the traditional
ecological knowledge of the hunters (MacKinnon et al, 1999; Pyc, 1999). This information
provided a spatial record of characteristics that may be important in explaining hunter site
choice. We employ some of this information in developing measures of the attributes of hunting
sites.
Stated Preference Information
We extend existing studies on Aboriginal hunting (e.g. Winterhalder 1983, 2001; Feit
1987) by incorporating stated preference methods into our survey. We used a choice experiment
approach to investigate how Aboriginal people in the region select where they hunt and how
their behavior might change in response to changes in moose, forestry, costs and other factors.
The design of the choice experiment began with a list of hunting site characteristics used
in earlier choice experiments designed to capture preferences of southern hunters for hunting
sites in central and northern Saskatchewan. This list of potential hunting site characteristics was
presented to a focus group; the appropriateness of each attribute was discussed and culturally
appropriate levels were determined. This set of attributes was further vetted through an elder
hunter who after some discussion approved the list. From these approved attributes a choice
experiment was designed.
The attributes themselves did not differ radically from earlier designs used in studying
4 Most of these data are not used here for modeling purposes, but these individual maps were compiled into one and this was provided to Mistik Management to be used when drafting their forest harvest plans. We also derived “community-level” special sites maps and presented these to each community during presentations in June 2001. This procedure assisted in the process of building trust during the data collection exercise.

10
non-aboriginal hunters (e.g. Adamowicz et al. 1997; Boxall and Macnab 2000). However, the
levels of the attributes did (see Table 1). In particular, the levels for the distance travelled and
the mode of transportation attributes differed from earlier surveys reflecting the fact that
Aboriginal hunters live in their hunting regions and that past cultural practices influence the
mode of transportation for some of them.
The prototype choice experiment was initially text based, similar to choice experiments
used in mail surveys of licensed hunters in the south (e.g. see Boxall and Macnab, 2000). One
elder informant, who was conversant in English but had difficulty reading, found that reading the
survey and discerning the specifics of the choice experiments difficult. It was decided that an
illustrative approach would be more appropriate in this setting. Photographs were used for
attributes for which a picture would easily illustrate its meaning, such as time since harvest and
access to the hunting site. More detail on the choice experiment can be found in Dosman et al.
(2002) and Haener et al. (2001b).
Socio-demographic and cultural data
In addition to the information related to actual hunting behavior and the responses to the
choice experiment, we also collected socio-demographic data including age, community born,
gender, education, marital status, number of children, employment status, partner’s employment
status, and aboriginal status. During the development of the survey tool we were informed that it
would be culturally inappropriate for us to ask respondents to report their annual income. We
thought annual income could be imputed from the respondent’s employment status and industry
in which they worked. However, it became evident during the interviews that over the course of
a year many respondents were employed in a series of jobs that last for a few days to several
weeks or months in many different industries ranging from forest fire fighting to road
construction to forestry work. A much more detailed employment record for the year would be
needed to be able to impute individual income levels.
These features have significant implications for the accuracy of value of time calculations
derived from travel distances using standard economic approaches (i.e. travel cost models). Since
many individuals in our sample changed their employment-related activities over the year we use
the average male income for the region in our computation of a wage rate. We attained average

11
male income levels from the national aboriginal census (Statistics Canada, 1998).5
Methods
Descriptions of the behavior of boreal aboriginal hunters in the anthropological literature
suggest that they have considerable knowledge of moose biology and that their hunting behavior
represents decisions that optimally provide opportunities for harvest. For example, Winterhalder
(1983) describes frequent use by hunters of areas in proximity to water and forest areas recently
disturbed by fire, and that they adjusted their hunting behavior seasonally to match changes in
habitat use by moose. These features correlate well with biologists’ analysis of preferred moose
habitats (e.g. Saskatchewan Forest Habitat Project 1991). Feit (1987) suggested that Cree
hunters use indicators of moose populations to guide hunting decisions. This information
suggests that models of hunting site choice by aboriginal hunters should incorporate such
indicators and their potential change as a result of landscape alteration through timber harvests.
Our modeling framework is illustrated in Figure 2. We employ hunter knowledge and
forest characteristics to develop a model of moose population or abundance. This model provides
measures of one of the most important attributes of the sites. In addition to information on moose
populations, forest landscape and road network characteristics are directly used as exp lanatory
variables in a revealed preference model. We then employ a combination of revealed preference
and stated preference data to generate a joint model of hunter preferences. Each of these
components will be outlined below.
Spatial Resolution
Since our objective was to develop a hunting site choice model that could be used to
simulate the effect of landscape changes on behavior, a spatial framework must be chosen which
incorporates landscape and hunting attributes as well as trip behavior. For this spatial scale the
Operating Area (OA) was selected as the unit of analysis. Mistik Management considers the OA
as the smallest spatial unit used to plan forest harvest operations in the FMA. Hunters in our
sample took trips to most of the 450 operating areas in the FMA, as well as some outside the
5 Since many individuals in our sample changed their employment related activities over the year one could develop a model explaining the changes as a function of characteristics of the opportunities (wages, etc.) and the season of the year (an indicator of the value of non-timber based activities). This would provide a measure of the implied

12
FMA.
From the digital files provided by Mistik Management, the following variables for each
OA were developed: lake area (ha), length of rivers (km), length of road (km) by class of road
(1-8), and size of the OA (ha). For the OAs in the FMA the following forest landscape
characteristics were available: crown closure class (4 classes ranging from open to closed based
on % cover), age class, the area of recent (5 years or less) and older (> 5 years) timber harvests,
the area burned in forest fires, non-forest area (e.g. muskeg), productive forest area, and the area
not subjected to previous timber harvest operations.
Moose Population / Abundance Model
One important landscape attribute that was not available was the abundance and
availability of moose. Usually aerial survey transects are used by biologists to estimate moose
abundance, but these had not been completed in the study region. To overcome this gap in the
data, and following the research by Feit (1987), information provided by the hunters was used to
develop a moose abundance indicator for each OA. To create this indicator OAs were identified
in which respondents indicated there were exceptional areas for moose. The information on
moose populations and forest landscape attributes were used to construct a model of moose
populations. Given the discrete nature of this variable (exceptional habitat or not) a logit model
was used to estimate the probability that any OA in the FMA had exceptional moose habitat.
Landscape features related to moose habitat preferences discussed in the biological
literature were included in the model (e.g. variables used to develop moose habitat suitability
indices in the Saskatchewan Forest Habitat Project, 1991). These included the density of rivers,
areas of disturbance from fire or previous timber harvests, the area of standing water, the area of
muskeg, and the area of forest classified as relatively open (crown closure 0-25%). Other
variables were chosen that were related to human use and perception such as the number of
cabins within 10 km of an OA and the presence of a salt lick within 10 km of the OA.
The logit model with the best fit is reported in Table 2. The influential explanatory
variables were recent anthropogenic disturbance (new cuts), the presence of salt licks, and those
related to aquatic habitat (muskeg and water). The crown closure and river density variables
reservation wage associated (and value of time) with non-timber based activities. However, our data were not detailed enough to construct such an analysis.

13
were significant at the 10% level. This model was used to estimate the probability that each OA
in the FMA would contain exceptional moose habitat.
Choice Model Development
The interest in this paper is in developing a model to explain why hunters visit certain
OAs over others and how their choices might be affected by timber harvesting. This information
represents discrete choice data, which can be analyzed using econometric methods based on
random utility theory (Louviere, Hensher and Swait 2000). This theory maintains that the utility
an individual derives from visiting an alternative site, i, is considered to be associated with the
attributes of that alternative. This utility function (Ui) can be represented as Ui=Vi+ε i where Vi
signifies a deterministic component and ε i an unobservable or stochastic component.
Vi can be characterized by its attributes. Thus, Vi = βkXi where Xi is a vector of k attributes
associated with alternative i and βk is a vector of parameters or taste weights. If the distribution
of the stochastic components is characterized as IID Gumbel, the conditional probability of
selecting alternative i from a set, C, of alternative sites is:
(1) ∑∈
µβµβ=
Cjjk
ik)Xexp(
)Xexp()i(prob
where µ is a scale parameter and C is the choice set.
When a single set of data is used to estimate a model, µ is confounded with the parameter
vector and cannot be identified. However, in models in which multiple data sources are merged
to estimate the parameter vector, the scale of one dataset can be estimated relative to the other
(Louviere, Hensher and Swait 2000).
We anticipated that the revealed preference attribute data would not be sufficient to
capture the preferences of the hunters. In part this arises because data for some important
attributes were not available (e.g. moose populations). In addition, the revealed preference
attributes are likely correlated and confound effects. For example, the effect of forest harvesting
on the aesthetics and appearance of a site would be confounded with the impact on moose
populations. Finally, it appears that joint stated – revealed preference models can outperform

14
revealed preference models in predicting actual behavior when the stated preference data are
carefully collected (Haener, Boxall and Adamowicz, 2001a). Therefore, both data types are
employed in modeling the trip locations of aboriginal hunters.
Since the SP data were generated from a controlled design, the number of alternatives in
the choice set, C, was 3 and the attribute levels (Table 1) were predetermined. However, this is
not the case for the RP data. For the RP data, the choice set for each community determined by
the survey was different, ranging from 30 to 207 OAs. To facilitate estimation, each
community’s choice set size was reduced to 30 OAs by randomly selecting a subset of the
relevant OAs for each trip from the full choice set. This procedure has been shown to produce
parameters that are not significantly different from those derived using the full choice set (e.g.
Parsons and Kealy, 1992).
The landscape attributes used in the models and their coding are described in Table 3.
Since we combined the RP and SP data in a joint model, several variables from the RP data and
SP data were transformed so that their coding was commensurate. Note that there is not complete
overlap between the RP and SP data series. The encounters variable, for example, exists only in
the SP data. The joint model combines data for the attributes common to both sets of data, while
still allowing the coefficients of the attributes unique to the RP and SP data to be estimated. The
model we use for simulation is based only on the attributes common to both models and one
variable unique to the RP data (i.e. cabins). Since the SP data are based on an orthogonal design
we can employ a subset of the attributes in estimation and simulation without significant concern
about specification error. The combined variables and their resulting codes are listed in rows 2
to 7 of Table 3. The remaining rows show the variables that are unique to the RP and SP
datasets.
In modeling hunting site choice, travel cost is commonly used as proxy for the cost of
visiting areas (e.g. Adamowicz et al. 1997; Boxall and Macnab 2000). Following the standard
procedures in the travel cost literature it is assumed that travel cost is a function of out of pocket
expenses related to travel distance and the time costs of traveling (e.g. Boxall et al. 1996).
Travel distance was included in the design of the SP choice experiment. However, it was
necessary to calculate travel distances for the RP data. To estimate these distances, the shortest
road distance between each community and the centroid of each OA in the community general
hunting area was determined using the GIS. In several parts of the FMA the road network is

15
sparse, therefore travel distances include the distance by road and the remaining ‘non-road’
distance required to reach the operating area. The ‘non-road’ distance also serves as an indicator
of the remoteness of the operating area. The operating cost of vehicle use associated with the
road distance was estimated at $0.589/km (reported by the Canadian Automobile Association).
The operating costs associated with the non-road portion of the distance was assumed to be 3
times this figure, as supported by information suggesting that the fuel mileage of off-road
vehicles and snowmobiles is about one-third that of a car or truck.6
The standard means of incorporating the value of travel time was also used. We assumed
an average speed of 80 kph and use one-third the estimated wage rate for the region. The wage
rate was determined by dividing the average male income for the region by the total number of
work hours in a year (assuming a 40 hr work week). We recognize that this method of valuing
time may be inappropriate for this context and suggest that trade-offs associated with pursuing
subsistence activities need to be further investigated.
Results
Choice Model Parameters
The parameter estimates for the joint RP-SP model and the corresponding RP and SP
models are reported in Table 4. The RP model only has parameters for those attributes that could
be related to the spatial information provided by the hunters and Mistik Management. For the SP
model, parameters displayed are only for those attributes used in the choice experiment. The
joint model contains parameters for all of the characteristics in the RP and SP models, but recall
that these parameters are constrained to be equal across the two sets of data. Since the joint
model provides the most complete information on attributes, it is discussed in detail below.
However, it should be noted that the signs of those parameters identified as statistically
significant are consistent across the three models but for one exception.7 The dummy variable on
new cuts (recent harvests) in the RP model is positive and significant, likely a result of
confounding between harvest, access and moose populations.
6 This information is reported by Kreag and Moe (2002) and at http://www.labaronssports.com/pages/mancominiatv.htm 7 A likelihood ratio test was performed to examine whether the RP and SP parameter vectors are significantly different that those of the joint model. The results (χ2=76.8, 4 df.) suggest that the joint model is significantly different. This test, however, is recognized in the literature as being rather strict and it appears that only one or two parameters drive this result. Nevertheless, we plan on further research to investigate this issue.

16
In the joint model the travel cost and the encounter parameters are negative and
significant. This suggests that the hunters prefer to hunt closer to their communities and that they
would prefer fewer encounters with other hunters while hunting. The cabins, water access, and
the moose abundance indicator variables are positive and significant. These findings suggest that
the hunters prefer to hunt in OAs with or near cabins, that have good water access, and that
contain high moose numbers. Note, however, that the access variables, while positive, are
statistically insignificant.
The parameters on the timber harvest variables in the joint model suggest a preference
pattern where newly harvested areas are avoided, while those with older are slightly preferred to
new harvest, but not as desirable as areas with no harvests (the base). Since moose abundance is
also related to forest disturbance patterns (see the newcut variable in Table 2), the choice model
parameters suggest a complex pattern of preferences for forest age and disturbance. It appears
that there are amenity effects for the forest condition independent of the forest effects on moose
abundance. Thus, recent timber harvests have a negative effect on utility through the new cut
dummy in the joint model, but have a positive effect on utility through their beneficial impacts
on moose abundance.
Using the Model to Simulate the Effects of Forest Landscape Changes
An advantage of using choice models to examine preferences over attributes is that the
model can be used to examine changes in choice behavior when attributes of one or more
alternatives in the choice set change. This can be done in a probabilistic framework using
equation 1 above. In addition, given that a cost variable is included in the model, monetary
measures of economic welfare can also be associated with these changes in attributes (see
Hanemann, 1982). These features were used to simulate the effects of two different timber
harvesting plans on the distribution of hunting trips in the general hunting areas of two
communities in the study and the associated economic impacts.8 Once these effects are
understood, we then consider whether actions to improve moose populations in certain areas
would “compensate” for the effects of harvesting.
Simulation of Timber Harvesting
8 We do not identify these communities in this paper for reasons of confidentiality.

17
To determine the influence of timber harvesting on hunting behavior two harvesting
scenarios for two communities were imposed on the current distribution of trips in the relevant
general hunting areas. The first scenario uses Mistik Management’s harvesting plan (see the
dispersed plan in Fig. 3). According to this plan, about 3000 ha of forest, distributed in 19 OAs,
will be harvested in the general hunting area for community 1, and about 6000 ha of forest,
distributed in 20 OAs, will be harvested in community 2.
A strategy that has been receiving significant attention in forest management recently is
the zoning of land areas and the concentration of activities within zones. Rather than attempting
to practice sustainable forest management “everywhere” on a landscape, foresters, for example,
could emphasize timber production in one zone, leave another zone for wildlife and landscape
protection and manage using multiple use principles in a third. This zoning strategy is often
referred to as the TRIAD (a three zone strategy involving an intensive forest management zone, a
protected area and a multiple use management zone). It corresponds to the notion of increasing
management effort and capital investment in those regions best suited for forest management
(Vincent and Binkely, 1994). We consider an analogous strategy here, however the zoning
considered is a concentration of forest harvesting and implicitly identifying zones where hunting
could be the main land use strategy.
Based on the zoning concept and considering the distribution of uncut forest in the OAs,
an alternative forest harvesting plan involving a more spatially concentrated harvest is used for
comparison with the dispersed harvesting plan. The 3000 ha of dispersed harvesting planned for
the general hunting area of community 1 is reallocated into 3 OAs, and the 6000 ha of harvesting
planned for the general hunting area of community 2 is reallocated into 4 OAs.
If the total number of trips taken in each community in a year is held fixed, then
following the timber harvests the distribution of trips across the OAs in each community’s
general hunting area will change. These changes result from the effects of harvesting on both
moose habitat and hunter preferences through changes in the new cut variable in the moose
abundance model (Table 2), and changes in the new cut dummy variable in the choice model
(Table 4).
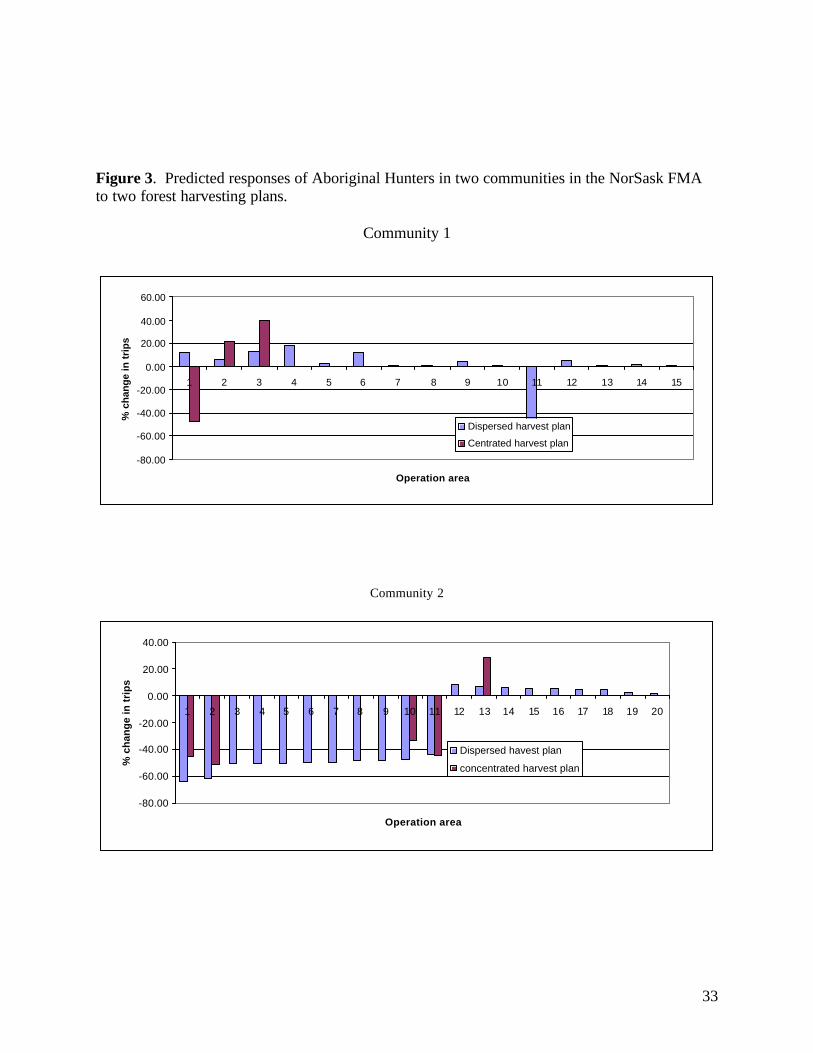
Figure 3 shows those OAs that experience relatively significant changes in the predicted
distribution of trips following the dispersed and concentrated timber harvests. The change in trips
is measured by the percentage change in trips taken to the operating area (i.e., (post-harvest trip –

18
pre-harvest trip)/pre-harvesting trips*100). The response to the dispersed forest harvesting plan
shows that the most significant impact arises in OAs that have not been previously harvested.
Hunting trips to these sites would decrease by 30 to 40 percent. Because most of the forest
harvesting in the area of community 2 occurs on such lands, the impacts are more severe on
hunters in this community. Hunters are expected to move to other areas, but they reallocate over
a large number of OAs instead of simply switching to a small number of other sites.
Employing a concentrated forest harvesting plan significantly reduces the impact on
hunters. In part this is because of the decreased number of OAs affected, but it is also because
most of the sites selected for concentrated harvests had already experienced some degree of
timber harvesting. As one would expect, concentration appears to result in an improved overall
outcome.
The welfare impacts9 associated with the timber harvesting plans in each community are
presented in Table 5. The harvesting effects are more pronounced in community 2 and are
insignificant in community 1. As mentioned above, the reason for this difference is that timber
harvesting has occurred near community 1 for a number of years. However, timber harvesting is
just beginning near community 2. Therefore, hunters in community 1 are already hunting in
areas containing recent cutblocks, and further harvesting in this area has a limited effect on
aboriginal hunters using the area. In community 2, however, most areas visited by hunters in the
community have never been subjected to forestry operations. As a result, timber harvests in this
area causes the hunters to substitute away from the newly cut areas. The hypothetical
concentrated harvesting plan mediated the negative effects of harvesting in community 2. An
unexpected result occurs in community 1. Dispersed harvesting results in a positive welfare
effect as the positive effect on moose populations dominates the negative effect of harvest on
aesthetics. However, the concentrated harvests do not positively affect as many sites and result in
a very small net loss in welfare. Both these effects are quite small in per trip and aggregate terms.
Resource Compensation as an Alternative to Monetary Welfare Measures
Forest managers have some ability to counteract the effects of forest harvesting by
compensating “in-kind”. This could involve enhancing the hunting related attributes of sites
9 Hanemann’s (1982) welfare measure was used to assess the economic effects of these harvest plans in each community.

19
known to be preferred by hunters. This strategy is somewhat analogous to the concept underlying
zoning in that land use specialization is being employed. Strategies that forest managers could
employ include removing access (to reduce encounters and congestion), investing in wildlife
habitat improvements, or, with cooperation from fish and wildlife management agencies, limiting
access by non-aboriginal hunters to certain OAs. We examine resource compensation in terms
of investments in wildlife habitat that generate increased moose populations in select OAs.
Improvements in moose populations could result from restricting human access to lower
the moose mortality rates from hunting, or landscape alterations through forest management to
provide more moose habitat (e.g. Saskatchewan Forest Habitat Project. 1993). In this study it is
assumed that actions can be taken to affect moose abundance and that these measures will affect
the moose abundance measure described above and in Table 2. We also consider the possibility
that different levels of intensity of investment in increasing moose populations could occur. The
first is a low intensity plan that increases the probability of an OA having exceptional moose
abundance to 0.20. The second is a high intensity plan that will increase the probability to 0.50.
The model of hunting preferences along with the information on site attributes provides a
way to determine the best area to invest in habitat improvements to increase moose populations.
To determine which OAs were the best candidates for moose improvements, the moose
abundance probability was increased to the target level (i.e., 0.2 or 0.5) at each individual OA.
For each change the change in total welfare per trip was calculated. The OAs were then ranked
according to the change in total welfare per trip resulting from improving moose probability at
that site. To determine how many of the OAs require improvement, the effect of improving
moose habitat is simulated for the top 2 ranked sites, then the top 3 ranked sites, then the top 4
ranked sites, etc. until the welfare impact is just enough to offset the impact of the timber harvest
plan. This strategy is similar to that employed in resource compensation efforts in the Natural
Resource Damage Assessment literature (e.g. Desvousges, MacNair and Smith, 2000).
The result s of these simulations for each community are reported in Table 6. For
community 1, in which considerable harvesting has occurred in the general hunting area in the
past, no OAs required improvement to offset the negative impacts of the timber harvest plan
since the net impact of timber harvest was positive. Of course the impact of the plan on hunters
in this area was also judged to be relatively minor. However, in community 2, 13 OAs required
management intervention to achieve improvement in the low intensity scenario, and 1 OA was

20
required in the high intensity scenario. Thus, in the area that has not experienced forestry
operations in the past, considerable intervention is required to compensate hunters.
This leads one to question what are the features of those OAs in which intervention is
required for compensation. For community 2, where many OAs have never been harvested, the
best candidates for moose enhancement are OAs where no cutting occurred in the past and no
new harvesting occurs. Other candidate OAs would be those with more cabins nearby, are most
accessible by water, and as measured by the moose abundance indicator model, moose habitat is
relatively poor.
Discussion and Conclusions
Increasing importance is being placed on recognizing the values of Aboriginal People in
resource management decisions. In the context of forest management in Canada, Aboriginal
People are often significantly affected by forestry decisions. Attempts to incorporate Aboriginal
People’s values into management have included various co-management strategies and
consultation strategies but even these have not necessarily addressed the challenge adequately.
Monetary compensation for the impact of industrial activity on traditional land use activities has
been used in some cases, but the methods of determining such monetary compensation are
questionable.
In this paper we make use of a unique data set that allows us to assess the impact of forest
management on Aboriginal hunting activities. We employ a behavioral approach in order to
better understand the tradeoffs that hunters make and the implicit value of changes in the
environment. We use this behavioral model to assess impacts of forest harvesting and to develop
monetary measures of this impact. We also use this model to examine alternative strategies for
managers including resource compensation and zoning.
The first conclusion arising from our study is that investment in the data collection
component is critical for the collection of data on use of non-timber resources by Aboriginal
People. Without the investments made to collect the data in an atmosphere of trust and
reciprocity our study would not have been possible. The unique character of our study area that
includes a forest management agency that has previously invested in co-management
relationships with the Aboriginal People should also not be undervalued. It is unlikely that very
many forest management contexts would involve such characteristics. Nevertheless, if the values

21
of Aboriginal People are to be effectively incorporated into management, such investments are
necessary.
In addition to investing significantly in data collection we also made the choice to obtain
and employ stated preference data, revealed preference data and hunter perceptions / knowledge.
We believe that the use of traditional ecological knowledge of the hunters improved our ability
to model choice. We also believe that the use of stated preference data is important in contexts
such as these where the revealed preference data may be highly correlated and where new
management strategies may extend landscape conditions beyond those that are currently being
experienced. However, issues remain regarding econometric implications of our sequential
estimation strategy, the appropriate weighting of RP and SP data in estimation, and the degree to
which understanding and behavioral prediction is improved by combining data sources.
A second conclusion is that it is clear that Aboriginal hunters do make trade off decisions
that are consistent with an underlying optimization framework. This conclusion is consistent
with the research of Winterhalder (2001) and others who examine aboriginal hunter behavior in
an optimal foraging framework. Thus, aboriginal hunting behavior can be used to develop
measures of value associated with environmental attributes. This supports the use of behavioral
studies in the Aboriginal context. However, it is not clear that we have accurately captured the
behavioral relationships. In particular, the tradeoffs regarding time use require more
investigation. Aboriginal hunters respond to opportunities, both market and non-market, that
arise over time. A more careful assessment of the choice of these opportunities could provide
valuable insights into the implicit value of time in hunting activities. Hunting activities are not
recreation for many Aboriginal People. The choice to invest time in hunting rather than market
wage opportunities reflects a type of reservation wage that could be identified from detailed
activity data. This we feel is an avenue for future research that could help identify the
importance, both culturally and materially, of hunting within Aboriginal societies.
While estimated monetary measures of welfare are reported in this paper, we believe that
our investigation of resource compensation and zoning (concentrated forest harvesting) could be
more useful to resource managers. Increasingly it is recognized that wide scale multiple use
forestry may not be the best way to manage forests and that specialization may be an improved
management model. Our results suggest that investments in habitat at a few sites could offset
the impacts of forest harvesting. It would be interesting to examine the costs of such investments

22
versus the monetary compensation required to offset these impacts. However, while resource
compensation addresses the impacts in total, it does not address the distribution of impacts. Such
distributional impacts have been identified as a difficulty in resource compensation exercises or
indeed in any form of benefit cost analysis that does not use money as the numeraire (Brekke,
1997).
The distribution of impacts across the population of Aboriginal People has been ignored
in this study. That is clearly a limitation of our approach to this point. In previous research the
heterogeneity across Aboriginal Peoples has been highlighted as a significant feature in the data
(Haener et al. 2001b). Incorporating heterogeneity into our modeling approach through the use of
mixed logit models or finite mixture models (e.g. Boxall and Adamowicz forthcoming) will
undoubtedly improve our understanding of behavior and provide us with improved measures of
welfare and resource compensation. However, incorporating heterogeneity will also increase the
complexity of the measurement of welfare and resource compensation.

23
References Adamowicz, W.L., J. Swait, P.C. Boxall, J. Louviere, and M. Williams. 1997. Perceptions versus objective measures of environmental quality in combined revealed and stated preference models of environmental valuation. Journal of Environmental Economics and Management 32: 65-84. Beckley, T.M., and B.H. Hirsch. “Subsistence and non- industrial forest use in the lower Liard valley.” Inf. Rep. NOR-X-352. Ottawa: Natural Resources Canada, Canadian Forest Service, 1997. Bowes, M.D. and J.V. Krutilla. 1985. Multiple use management of public forestlands. Handbook of Natural Resource and Energy Economics. A.V. Kneese and J.L. Sweeney (eds). Elsevier Science Publishers, New York. Pp. 531-569. Boxall, P.C., B.L. McFarlane and M. Gartrell. 1996. An aggregate travel cost approach to valuing forest recreation at managed sites. Forestry Chronicle 72: 615-621. Boxall, P.C. and W.L. Adamowicz. forthcoming. Understanding heterogeneous preferences in random utility models: A latent class approach. Environmental and Resource Economics. Boxall, P.C. and B. Macnab. 2000. Exploring the preferences of wildlife recreationists for features of boreal forest management: a choice experiment approach. Canadian Journal of Forest Research 30:1931-1941. Brekke, K.A. 1997. The numeraire matters in cost-benefit analysis. Journal of Public Economics. 64:17-123. Brown, T.C. and E.S. Burch. 1992. Estimating the economic value of subsistence harvest of wildlife in Alaska. in Valuing Wildlife Resources in Alaska. G.L. Peterson, C. S. Swanson, D.W. McCollum and M.H. Thomas, ed., pp. 203-54. Boulder: Westview Press. Desvousges, W.H., D.J. MacNair and G.A. Smith. 2000. Lower Fox River and Bay of Green Bay: Assessment of Potential Recreational Fishing Losses and Offsets. Triangle Economic Research, Durham, NC. DIAND (Department of Indian Affairs and Northern Development). 2001. Basic Departmental Data. First Nations and Northern Statistics Section. Ottawa, Canada. Dosman, D., M. Haener, W. Adamowicz, J. Marois and P. Boxall. 2002. Assessing Impacts of Environmental Change on Aboriginal People: An Economic Examination of Subsistence Resource Use and Value. Project Report 02-1, Department of Rural Economy, University of Alberta, Edmonton, Alberta. Englin, J. 1990. Backcountry hiking and optimal timber rotation. Journal of Environmental Management 31: 97-105.

24
Feit, H. A. 1987. North American native hunting and management of moose populations. Swedish Wildlife Research Suppl. 1:25-42. Haener, M. K. and W. L. Adamowicz. 2000. Regional forest resource accounting: A Northern Alberta case study. Canadian Journal of Forest Research 30: 264-273. Haener, M., P.C. Boxall and W.L. Adamowicz. 2001a. Modeling recreation site choice: Do hypothetical choices reflect actual behavior? American Journal of Agricultural Economics 83: 629-642 Haener, M, D. Dosman, W. Adamowicz and P.C. Boxall. 2001b. Can stated preference methods be used to value attributes of subsistence hunting by Aboriginal Peoples: A case study in northern Saskatchewan. American Journal of Agricultural Economics 83: 1334-1340. Hanemann, W.M., 1982. Applied welfare analysis with qualitative response models, Working Pap. No. 241. Univ. California, Berkeley, 26 pp. Kreag, G. and J. Moe. 2002. Minnesota’s north shore snowmobile trail: what is its value? Minnesota Sea Grant Tourism Outreach, University of Minnesota. Accessed at: http://www.seagrant.umn.edu/tourism/snow.html May 7, 2002. Louviere, J., D. Hensher and J. Swait. 2000. Stated Choice Methods: Analysis and Applications in Marketing, Transportation and Environmental Valuation. Cambridge University Press. MacKinnon, L. C. Apentik and M.P. Robinson. 1999. Revisiting traditional land use and occupancy studies: relevance and implications for resource management in Alberta. Sustainable Forest Management Network Working Paper 1999-16. Edmonton. Mendelsohn, R. 1996. An economic-ecological model for ecosystem management. In W.L. Adamowicz, P.C. Boxall, M.K. Luckert, W.E. Phillips and W.A. White. Forestry, Economics and the Environment. Wallingford: CAB International, pp. 213-221. Parsons, G.R. and M.J. Kealy. 1992. Randomly drawn opportunity sets in a random utility model of lake recreation. Land Economics 68:93-106. Pyc, C. 1999. The use of traditional knowledge in Cree hunting Strategies. Sustainable Forest Management Network Working Paper 1999-14. Edmonton. Saskatchewan Forest Habitat Project. 1991. Annual Report. Wildlife Branch, Saskatchewan Parks and Renewable Resource, Prince Albert, Saskatchewan. Saskatchewan Forest Habitat Project. 1993. Integrated forest/wildlife management parameters. Wildlife Branch, Saskatchewan Environment and Resource Management, Prince Albert, Saskatchewan.

25
Statistics Canada. 1998. Welcome to Statistical Profile of Canadian Communities. http://ww2.statcan.ca/english/profil/ Tobias, T. N. and J. J. Kay. 1993. The Bush Harvest in Pinehouse, Saskatchewan, Canada. Arctic 47: 207-21. Usher, Peter J. and George Wenzel, 1987. Native harvest surveys and Statistics: A critique of their construction and use. Arctic 40: 145-160. Usher, P. J. 1976. Evaluating country food in the Northern Native economy. Arctic 29:105-120. Vincent, J.R. and C.S. Binkley 1994. Efficient multiple-use forestry may require land-use specialization. Land Economics 69: 370- 376. Winterhalder, B. 1983. Boreal foraging strategies. Pp 201-241 In Steegmann, A.T. (Editor) Boreal Forest Adaptations: The Northern Algonkians, Plenum Press, NY
Winterhalder, B. 2001. Recent Work on the Behavioral Ecology of Hunter-Gatherers. Pp 12-38 In Catherine Panter-Brick, Robert Layton and Peter Rowley-Conwy (Editors) Hunter-Gatherers: An Interdisciplinary Perspective Cambridge University Press, Cambridge.

26
Table 1. Definition of hunting site attributes for the choice experiment administered to the Aboriginal hunters.
Attributes Levels How far hunting site is from home. 10 km
50 km 100 km 200 km
How many people you see at the hunting site. Nobody else, except other in my hunting party Other people
How many signs of moose you will see each day.
Signs of less than 1 moose per day Signs of 1 to 2 moose per day Signs of 3 moose per day Signs of more than 4 moose per day
How hunters travel to the site. On foot without trails or cutlines. By quads on old logging roads. By 4-wheel drive on new logging roads. By boat through interconnected lakes.
How long it has been since the site was harvested.
Site just harvested. Site logged 3 to 5 years. Site logged 10 to 15 years. No evidence of logging.

27
Table 2. Parameter estimates for a logit model used to estimate the probability that an Operating Area (OA) contains high moose populations.
Variable Description Parameter estimate
t- statistic
Constant -3.0948 -10.88
Crown A Percent forest area in the OA with crown closure 0 to 25% density -16.2631 -1.92
Salt licks A dummy variable indicating presence of salt lick(s) within the OA
0.7641 5.10
Water Percent OA area covered by water 0.0262 2.35 Muskeg Percent OA area classified as muskeg 0.0272 2.35
New cut Percent OA area classified as new cuts 7.8367 4.06
River density Density of rivers in the OA 0.1810 1.87

Table 3. A description of variables used to estimate choice models using revealed (RP) and stated (SP) preference information from aboriginal hunters in the NorSask FMA.
Common Variables Coding Revealed preference data Stated preference data
Travel cost $’00 Road distance was transformed to a travel cost as follows: (2*(road distance +3*non-road distance)*(0.589+(income/(3*90*2040)))/100*
Moose abundance 0 - 1
Based on predicted probability from the OA moose habitat model in Table 3
0.05 - signs of less than 1 moose /day 0.375 - signs of 1-2 moose/day 0.750 - signs of 3 moose/day 1.000 - signs of more than 4 moose/day
New cut dummy 0, 1 1 = new cuts area < old cut area and < 90% of area uncut; 0 otherwise
Site harvested 5 or fewer years ago
Old cut dummy 0, 1 1 = old cuts area >= new cut area and < 90% of area uncut; 0 otherwise
Site harvested 10 to 15 years ago
No cut Base = > 90% of the area is uncut No evidence of timber harvesting
Water access dummy 0, 1 1 = a river intersects the OA or more than 1% of the OA is covered by a lake; 0 otherwise
OA is accessible by water.
Cabins 0 - 5 Number of cabins in or within 5 km of the OA
NA
No hunt constant NA 1 = stay at home instead of hunting Encounters 1, -1 NA 1 = Other people are encountered New access 1, 0 1 = access via new logging roads NA Old access 1, 0 1 = access via old logging roads NA
* Where income represents the average male income for each community reported in the census.

Table 4. Parameter estimates for the RP, SP and joint RP-SP models.
RP model SP model Joint model Variables Parameter t statistic Parameter t statistic Parameter t statistic
Travel cost -0.1753 -3.357 -0.6721 11.32 -0.6868 10.563 Moose probability 1.5336 7.872 0.8295 5.788 0.9821 6.536 New cut dummy 0.1703 2.031 -1.2783 11.05 -1.1131 8.113 Old cut dummy -0.0756 0.232 -0.5055 3.577 -0.4032 2.669 Water access dummy 0.2177 2.482 0.4703
3.449 0.5395 3.866
Cabins 0.3154 11.505 1.7535 3.798 No hunting dummy -2.0024 11.048 -1.7958 9.232 Encounters -0.2464 4.724 -0.2442 4.389 New Access 0.1159 0.84 0.1568 1.068 Old Access 0.0868 0.628 0.1089 0.741 Ln(µ) -1.5619 Log Likelihood -3124.5 -826.3 -3989.2 ρ2 0.04 0.23 0.08 LL Sum -3950.8

30
Table 5. The changes in economic values associated with two harvesting plans on hunting trips taken by aboriginal hunters in two communities in the NorSask FMA.
Per trip Values Total Values Harvest Plan Community 1 Community 2 Community 1 Community 2
Dispersed Harvesting $0.06
$-1.18
$150.96 $-2791.88
Concentrated Harvesting $-0.01
$-0.108
$25.16 $-189.28
Table 6. The number of operating areas (OA) in which actions to improve moose abundance are required to compensate aboriginal hunters for the planned dispersed timber harvest.
Number of OAs required Intensity of Effort Community 1 Community 2
Low 0 13 High 0 1

31
Figure 1: Maps of Canada and of Alberta and Saskatchewan showing the locations of the NorSask FMA

32
Figure 2: A diagram summarizing the strategy used in modelling aboriginal hunting trips in the NorSask FMA.
Stated Preference Data
Revealed Preference Site ChoicesHunter
KnowledgeOf Moose
ForestAttributes(GIS)
Revealed Preference Model
JointModelMoose
PopulationEstimates
ForestAttributes(GIS)
ForestHarvesting
33
Figure 3. Predicted responses of Aboriginal Hunters in two communities in the NorSask FMA to two forest harvesting plans.
Community 1
-80.00
-60.00
-40.00
-20.00
0.00
20.00
40.00
60.00
1 2 3 4 5 6 7 8 9 10 11 12 13 14 15
Operation area
% c
han
ge
in t
rip
s
Dispersed harvest plan
Centrated harvest plan
Community 2
-80.00
-60.00
-40.00
-20.00
0.00
20.00
40.00
1 2 3 4 5 6 7 8 9 10 11 12 13 14 15 16 17 18 19 20
Operation area
% c
han
ge
in t
rip
s
Dispersed havest plan
concentrated harvest plan