mkc2130 sample notes
TRANSCRIPT

MKC2130 Market Decision Analysis Notes
Table of Contents
Week 1: Market Share Analysis 1 2 Week 2: Market Share Analysis 2 15 Week 3: Product Management 1 33 Week 4: Product Management 2 (Utilities and Consumer Preference) 53 Week 5: Product Management 3 (Forecasting new product sales) 68 Week 6: Communication 1 (Promotion) 81 Week 7: Communication 2 (Advertising media metrics) 91 Week 8: Communication 3 (Online advertising & social media metrics) 109 Week 9: Marketing and Finance 124 Week 10: Profitability and Pricing 1 (Customer Profitability) 139 Week 11: Profitability and Pricing 2 (Pricing Strategy) 154 Week 12: Profitability & Pricing 3 (Margins & Profits) 168
Page 1
Week 1: Market Share Analysis 1 What is a metric ?
! Metric is a measuring system that quantifies a trend, dynamic or characteristic
- Grades/marks: measure a student’s knowledge/comprehension of a subject
! Metrics are objective measures that facilitate comparison across regions, time
periods, entities
- Who among the students have a good understanding of marketing analytics?
! Metrics are vital in explaining phenomenon, diagnose causes, share findings and
project future
- Why do marks vary across students for a unit? What factors explain this
variation?
Hierarchy of Effects
1. Sequence of stages through which customers pass through in developing their brand association
2. Understanding AAU helps us to answer why certain users prefer a certain type of
brands
3. AAU are typically measured through survey of consumers. These measures are
most useful when compared against a benchmark.
Awareness, attitudes, and usage (AAU) metrics relate closely to what has been called
the Hierarchy of Effects, an assumption that customers progress through sequential
stages from lack of awareness, through initial purchase of a product, to brand loyalty.
Page 2

Stage 1: Awareness
1. Awareness: % of potential consumers who recognize the brand (aided or unaided)
✓ Top of mind brand recall within stated category = allows to determine what proportion
of people mention your brand
✓ Total unprompted brand recall = ask about all brands in a category (or ask for 5)
Top of Mind: The first brand that comes to mind when a customer is asked an
unprompted question about a category. The percentage of customers for whom a given
brand is top of mind can be measured.
Note: The metrics go in the order of their strictness
Applied: Unprompted brand recall is LESS STRINGENT THAN total unprompted brand
recall
Metric 1 from excel: Toyota = measure how many people said it comes to their mind
when asked = 40% or 4/10
Metric 2 from excel: 6/10 have mentioned Toyota that comes to mind
Metric Sample Questions
Top of mind brand recall within stated
category
“What brand first comes to mind when
you think of chocolate?”
Total unprompted brand recall “What brands come to mind when you
think of chocolate?” (record all mentions)
Unprompted brand recall Do you recall the brand name for the TV
ad which shows….?
Prompted brand recognition Have you heard of brand X?
Page 3
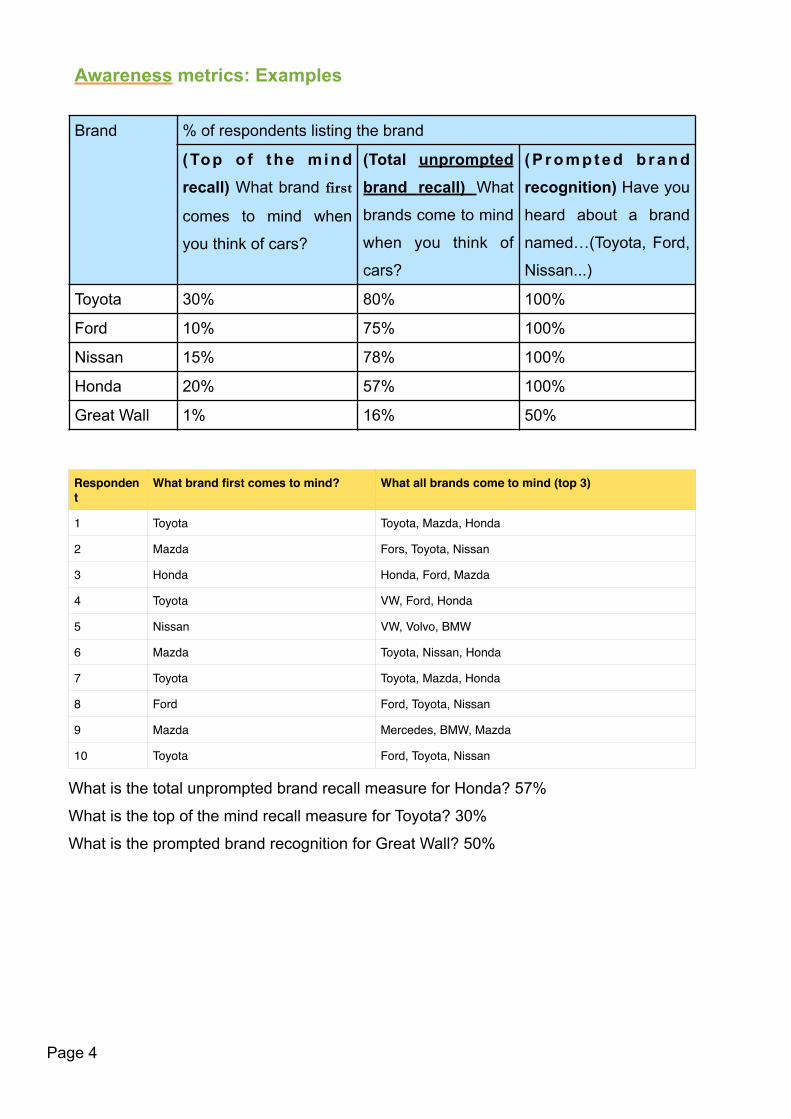
Awareness metrics: Examples
What is the total unprompted brand recall measure for Honda? 57%
What is the top of the mind recall measure for Toyota? 30%
What is the prompted brand recognition for Great Wall? 50%
Brand % of respondents listing the brand
(Top o f the mind recall) What brand first
comes to mind when
you think of cars?
(Total unprompted brand recall) What
brands come to mind
when you think of
cars?
( P r o m p t e d b r a n d recognition) Have you
heard about a brand
named…(Toyota, Ford,
Nissan...)
Toyota 30% 80% 100%
Ford 10% 75% 100%
Nissan 15% 78% 100%
Honda 20% 57% 100%
Great Wall 1% 16% 50%
Respondent
What brand first comes to mind? What all brands come to mind (top 3)
1 Toyota Toyota, Mazda, Honda
2 Mazda Fors, Toyota, Nissan
3 Honda Honda, Ford, Mazda
4 Toyota VW, Ford, Honda
5 Nissan VW, Volvo, BMW
6 Mazda Toyota, Nissan, Honda
7 Toyota Toyota, Mazda, Honda
8 Ford Ford, Toyota, Nissan
9 Mazda Mercedes, BMW, Mazda
10 Toyota Ford, Toyota, Nissan
Page 4
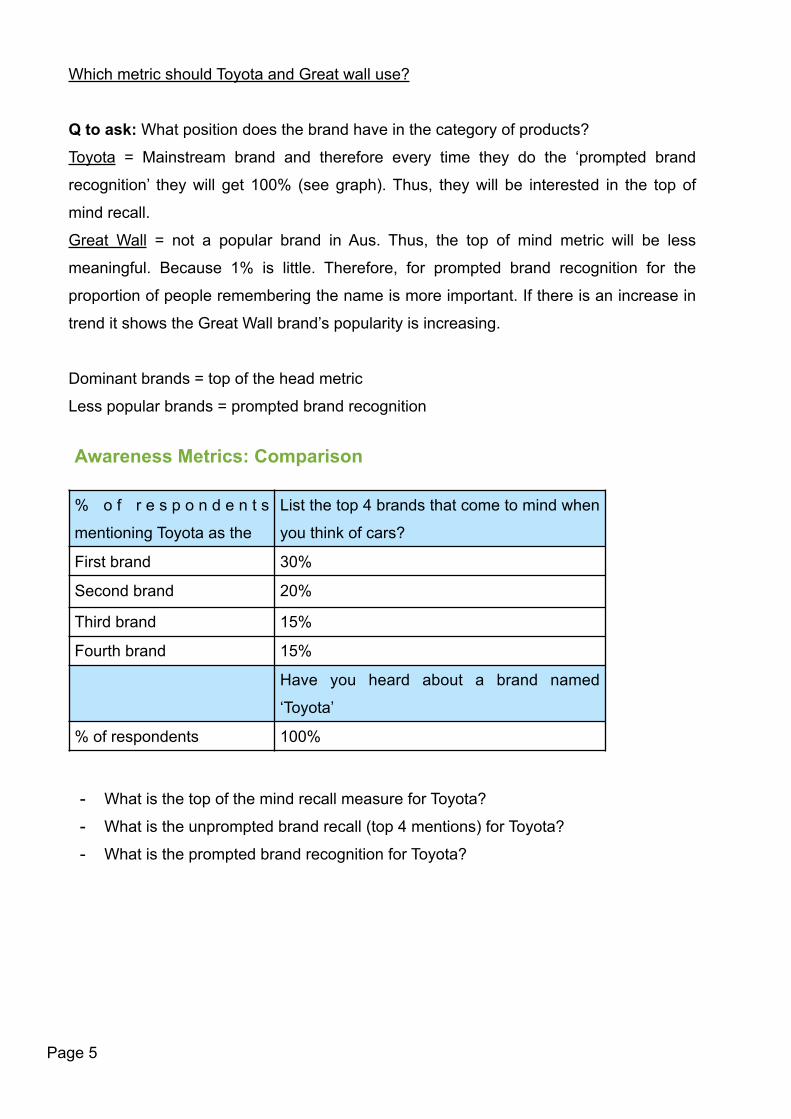
Which metric should Toyota and Great wall use?
Q to ask: What position does the brand have in the category of products?
Toyota = Mainstream brand and therefore every time they do the ‘prompted brand
recognition’ they will get 100% (see graph). Thus, they will be interested in the top of
mind recall.
Great Wall = not a popular brand in Aus. Thus, the top of mind metric will be less
meaningful. Because 1% is little. Therefore, for prompted brand recognition for the
proportion of people remembering the name is more important. If there is an increase in
trend it shows the Great Wall brand’s popularity is increasing.
Dominant brands = top of the head metric
Less popular brands = prompted brand recognition
Awareness Metrics: Comparison
- What is the top of the mind recall measure for Toyota?
- What is the unprompted brand recall (top 4 mentions) for Toyota?
- What is the prompted brand recognition for Toyota?
% o f r e s p o n d e n t s
mentioning Toyota as the
List the top 4 brands that come to mind when
you think of cars?
First brand 30%
Second brand 20%
Third brand 15%
Fourth brand 15%
Have you heard about a brand named
‘Toyota’
% of respondents 100%
Page 5
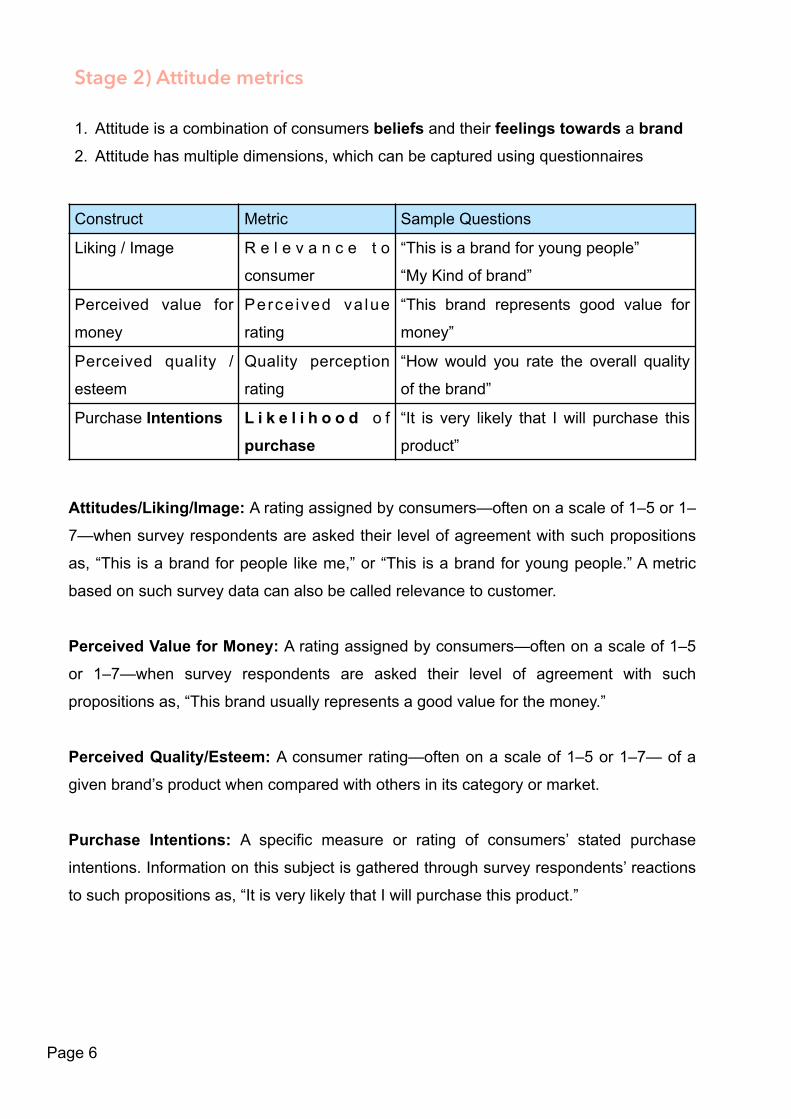
Stage 2) Attitude metrics
1. Attitude is a combination of consumers beliefs and their feelings towards a brand 2. Attitude has multiple dimensions, which can be captured using questionnaires
Attitudes/Liking/Image: A rating assigned by consumers—often on a scale of 1–5 or 1–
7—when survey respondents are asked their level of agreement with such propositions
as, “This is a brand for people like me,” or “This is a brand for young people.” A metric
based on such survey data can also be called relevance to customer.
Perceived Value for Money: A rating assigned by consumers—often on a scale of 1–5
or 1–7—when survey respondents are asked their level of agreement with such
propositions as, “This brand usually represents a good value for the money.”
Perceived Quality/Esteem: A consumer rating—often on a scale of 1–5 or 1–7— of a
given brand’s product when compared with others in its category or market.
Purchase Intentions: A specific measure or rating of consumers’ stated purchase
intentions. Information on this subject is gathered through survey respondents’ reactions
to such propositions as, “It is very likely that I will purchase this product.”
Construct Metric Sample Questions
Liking / Image R e l e v a n c e t o
consumer
“This is a brand for young people”
“My Kind of brand”
Perceived value for
money
Perce ived va lue
rating
“This brand represents good value for
money”
Perceived quality /
esteem
Quality perception
rating
“How would you rate the overall quality
of the brand”
Purchase Intentions L i k e l i h o o d o f
purchase“It is very likely that I will purchase this
product”
Page 6

Stage 3) Usage
Usage: A measure of customer’s self-reported purchase behaviour
3. What was purchased? How many units? When and where was it purchased? How
many tried and adopted the product?
What is the difference between “intention” (last slide) and “purchase frequency”?
Intention ≠ a behaviour (yes I intend to buy it but when you go to shop you may not buy
it). You may intend to buy something but whether you do or not may be different
Summary:
- Hierarchy of affects captures the sequence of stages that customers go through
when they have brand associations
- Through surveys we see how brand is performing in these stages
- Discussed summaries of metrics and Qs that can be used
- By doing this we can understand if something is changing in the mind of customers
before something shows top in sales
Metric Sample Questions
Purchase frequency “How often do you shop for…?”
Volume purchased on a shopping
occasion
“When you last purchased…,how much did you
buy?”
“Of your total purchase of…, how much was
brand X?”
Brands held Which brands do you now have at home?
Page 7
Net Promoter Score
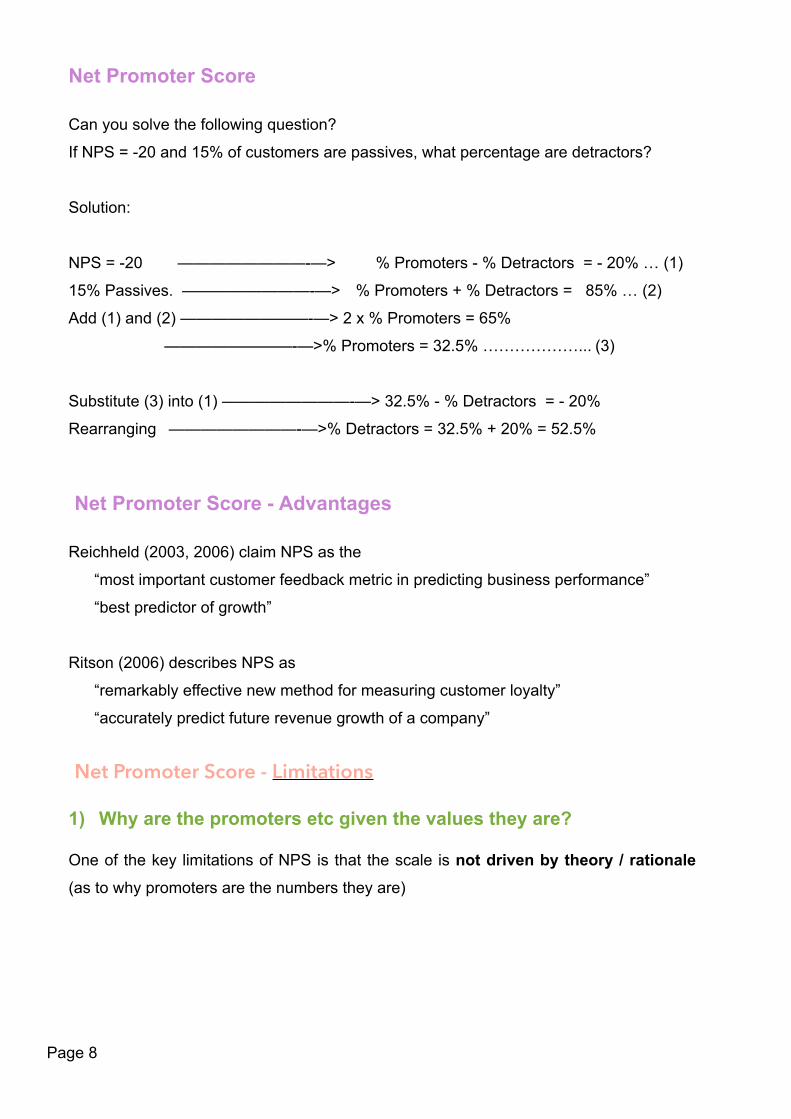
Can you solve the following question?
If NPS = -20 and 15% of customers are passives, what percentage are detractors?
Solution:
NPS = -20 ————————-—> % Promoters - % Detractors = - 20% … (1)
15% Passives. ————————-—> % Promoters + % Detractors = 85% … (2)
Add (1) and (2) ————————-—> 2 x % Promoters = 65%
————————-—>% Promoters = 32.5% ………………... (3)
Substitute (3) into (1) ————————-—> 32.5% - % Detractors = - 20%
Rearranging ————————-—>% Detractors = 32.5% + 20% = 52.5%
Net Promoter Score - Advantages
Reichheld (2003, 2006) claim NPS as the
“most important customer feedback metric in predicting business performance”
“best predictor of growth”
Ritson (2006) describes NPS as
“remarkably effective new method for measuring customer loyalty”
“accurately predict future revenue growth of a company”
Net Promoter Score - Limitations
1) Why are the promoters etc given the values they are?
One of the key limitations of NPS is that the scale is not driven by theory / rationale (as to why promoters are the numbers they are)
Page 8

2) The same NPS score can indicate different business circumstances.
For instance, a Net Promoter Score of zero can indicate highly polarized customers,
50% promoters, 50% detractors, or a totally ambivalent customer base, 100% passives
If NPS =0, then
- Are there 50% promoters and 50% detractors? or
- Is everyone passive?
- These are different scenarios ^^
Suppose a firm has 100 customers
- Promoters = 30 (30%) Passives= 40 (40%) and Detractors = 30 (30%), NPS = 0
Suppose half of detractors leave the firm (85 customers), then,
- Promoters = 30 (35%), Passives = 40 (47%) and Detractors = 15 (18%).
- What is the new NPS? 35%-18%=17% (compared to 0 before). You could wrongly
conclude that NPS has satisfaction has improved but really you have the same
number of promoters and those who are not satisfied have left your firm Does an increase in NPS mean the company is growing?
Page 9

Week 2: Market Share Analysis 2 Business problems:
• How to measure the performance of a brand/product/firm? • How to identify the reasons behind the performance and develop strategies to
improve the performance? (vid 2) (why it is increasing or decreasing and action to
address)
What will you learn:
1. What is market share? Is it a good measure of performance? 2. Is market share a good performance goal for a company? 3. What are the drivers of market share?
4. Managerial implications
Page 10
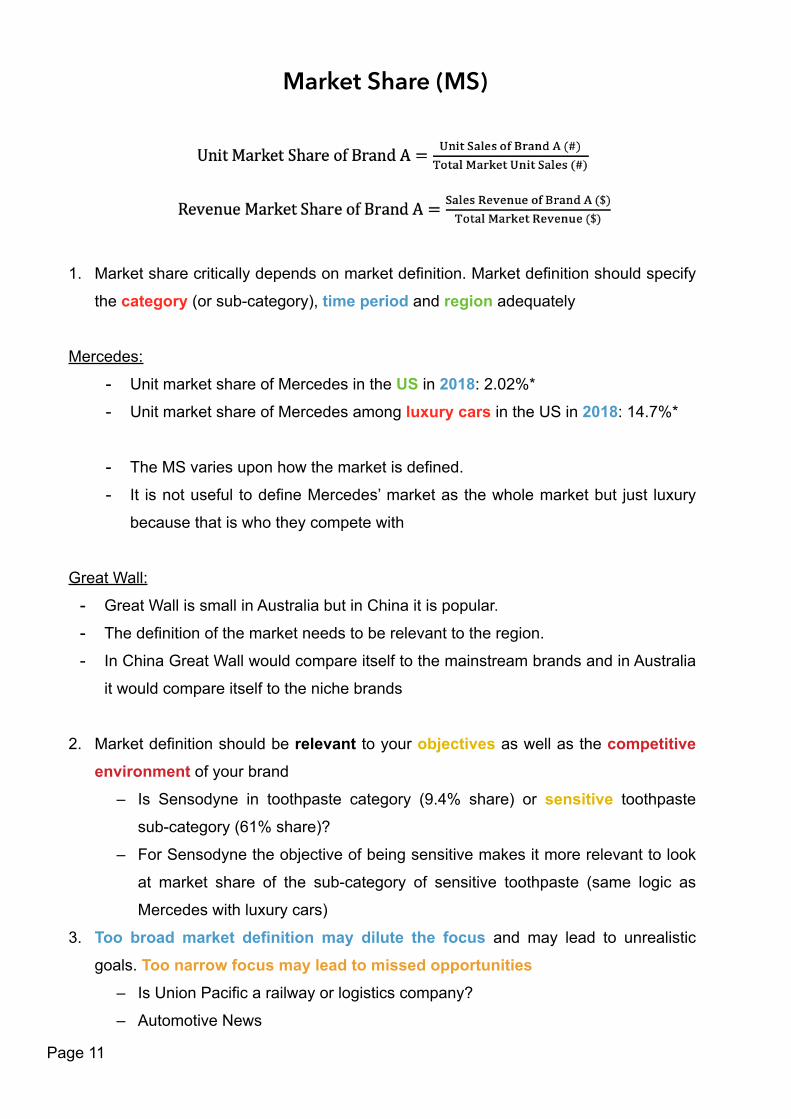
Market Share (MS)
1. Market share critically depends on market definition. Market definition should specify
the category (or sub-category), time period and region adequately
Mercedes:
- Unit market share of Mercedes in the US in 2018: 2.02%*
- Unit market share of Mercedes among luxury cars in the US in 2018: 14.7%*
- The MS varies upon how the market is defined.
- It is not useful to define Mercedes’ market as the whole market but just luxury
because that is who they compete with
Great Wall:
- Great Wall is small in Australia but in China it is popular.
- The definition of the market needs to be relevant to the region.
- In China Great Wall would compare itself to the mainstream brands and in Australia
it would compare itself to the niche brands
2. Market definition should be relevant to your objectives as well as the competitive environment of your brand
– Is Sensodyne in toothpaste category (9.4% share) or sensitive toothpaste
sub-category (61% share)?
– For Sensodyne the objective of being sensitive makes it more relevant to look
at market share of the sub-category of sensitive toothpaste (same logic as
Mercedes with luxury cars)
3. Too broad market definition may dilute the focus and may lead to unrealistic
goals. Too narrow focus may lead to missed opportunities – Is Union Pacific a railway or logistics company?
– Automotive News
Page 11
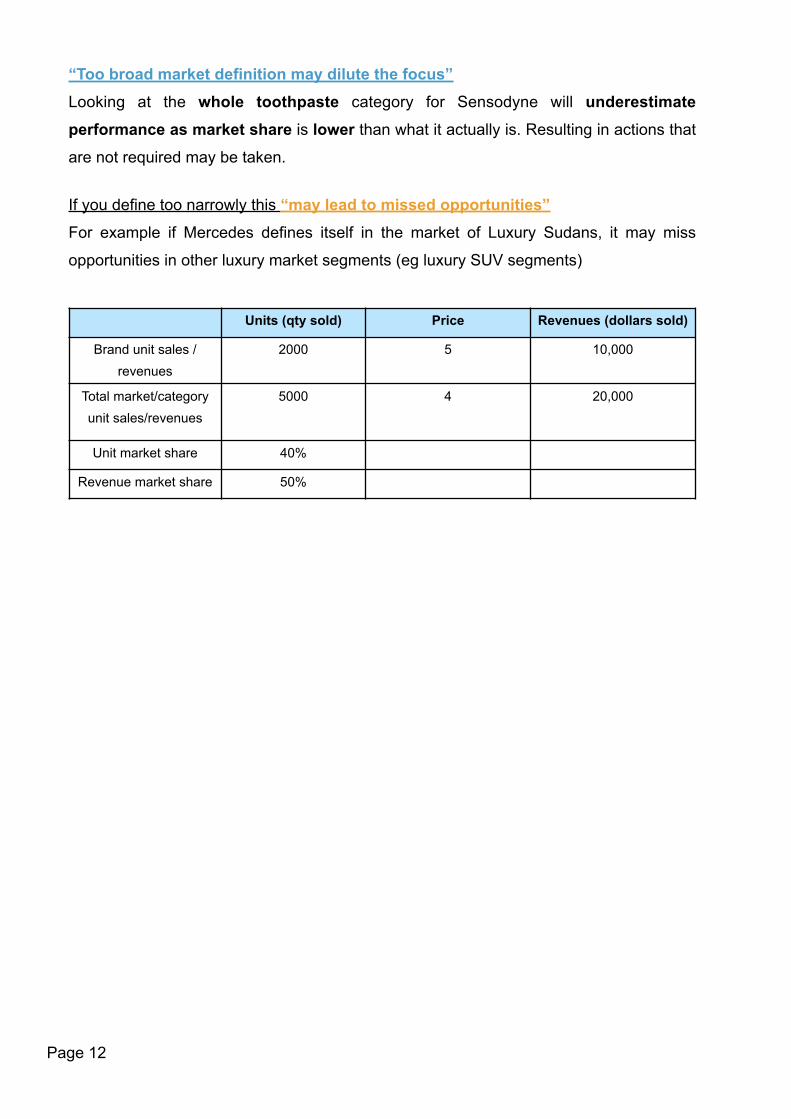
“Too broad market definition may dilute the focus” Looking at the whole toothpaste category for Sensodyne will underestimate performance as market share is lower than what it actually is. Resulting in actions that
are not required may be taken.
If you define too narrowly this “may lead to missed opportunities” For example if Mercedes defines itself in the market of Luxury Sudans, it may miss
opportunities in other luxury market segments (eg luxury SUV segments)
Units (qty sold) Price Revenues (dollars sold)
Brand unit sales / revenues
2000 5 10,000
Total market/category unit sales/revenues
5000 4 20,000
Unit market share 40%
Revenue market share 50%
Page 12
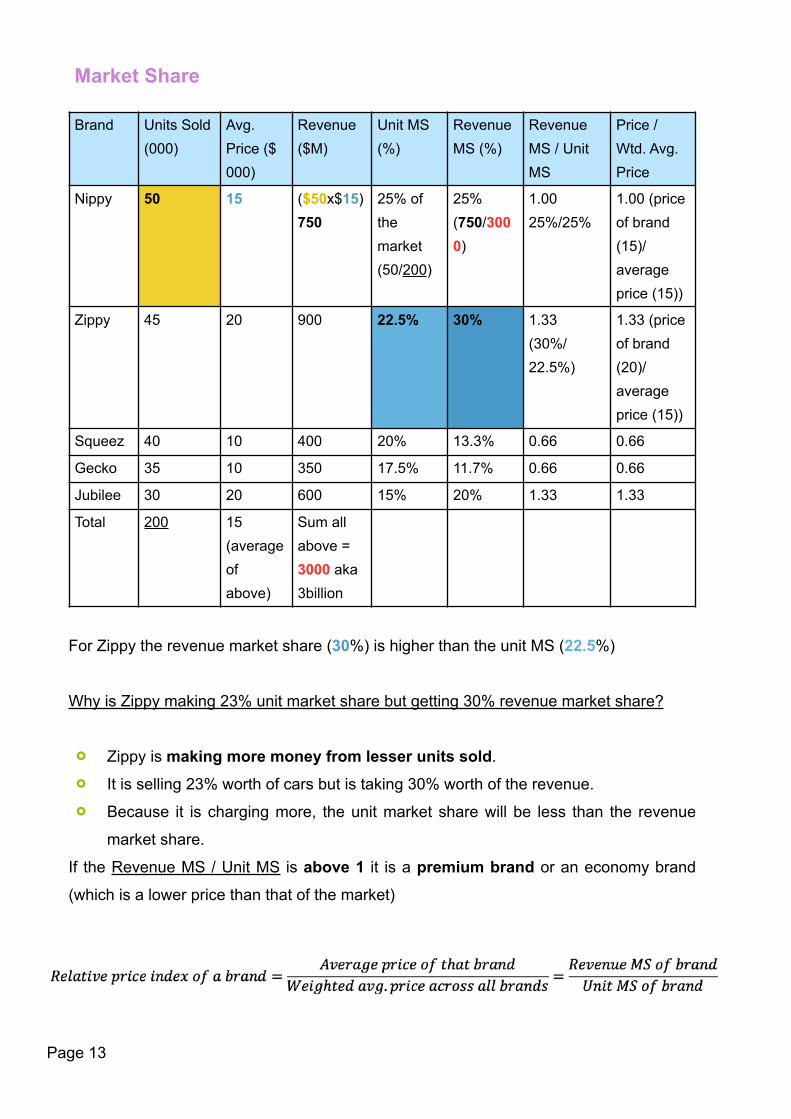
Market Share
For Zippy the revenue market share (30%) is higher than the unit MS (22.5%)
Why is Zippy making 23% unit market share but getting 30% revenue market share?
! Zippy is making more money from lesser units sold. ! It is selling 23% worth of cars but is taking 30% worth of the revenue. ! Because it is charging more, the unit market share will be less than the revenue
market share.
If the Revenue MS / Unit MS is above 1 it is a premium brand or an economy brand
(which is a lower price than that of the market)
Brand Units Sold (000)
Avg. Price ($ 000)
Revenue ($M)
Unit MS (%)
Revenue MS (%)
Revenue MS / Unit MS
Price / Wtd. Avg. Price
Nippy 50 15 ($50x$15) 750
25% of the market (50/200)
25% (750/3000)
1.00 25%/25%
1.00 (price of brand (15)/average price (15))
Zippy 45 20 900 22.5% 30% 1.33 (30%/22.5%)
1.33 (price of brand (20)/average price (15))
Squeez 40 10 400 20% 13.3% 0.66 0.66
Gecko 35 10 350 17.5% 11.7% 0.66 0.66
Jubilee 30 20 600 15% 20% 1.33 1.33
Total 200 15 (average of above)
Sum all above = 3000 aka 3billion
Page 13

How to measure a brand’s relative position in a category?
Relative Market Share Practice Question
A firm has two brands in two different categories (say 1 and 2).
In category 1, it has a market share of 20% and a relative market share of 1.1. In category 2, it has a market share of 25% and a relative market share of .33.
Which of the following statements are true?
a. The firm's brand is the dominant brand in category 1, and the category is likely to be
competitive.
b. The firm's brand is a minor brand in category 2, and this category is likely to be less
competitive.
The correct answer is: Both a and b are true
In category 1, the MS of brand is 20%. As the relative MS is 1.1, it shows that the major competitior has a MS of 18.18% (20%/1.1) . So, the focal firms' brand dominates the
market and the market is likely to be competitive as the top 2 brands account for only
38.18% of the market.
In category 2, the firms market share is 25%. But the relative market share (.333) shows
that the major competitor's MS is 75% (25%/.333). So, the firm's brand is a minor brand
in this category and the category is likely to be less competitive (as it is dominated by
one major brand).
Therefore, both the statements (a and b) are true.
Page 14
Week 6: Communication 1: Promotion Business problems:
- How to evaluate the outcome of a price promotion?
What you will learn this week:
1. Objectives of short term price promotions
2. Evaluating incremental sales
3. Evaluating the profitability of price promotions
4. Long term effects of price promotions
5. Evaluating price promotions in practice
Price promotions
What is a price promotion?
- Discounts
Page 15

Baseline vs. incremental Sales
Baseline sales
! Expected sales in the absence of marketing programs (e.g. promotion)! Baseline sales can be determined from historical data or using control groups
Example (control groups): We take 2 stores, one we run a price promotion, the
other we do not, the sales of the control store is used to determine if the sales
promotion was successful
Incremental sales or Promotional lift
! Lift/gain or increase in sales in response to promotion! Total sales - baseline sales = gain
Price promotion scenario
Brand sales = Unit market share x Category sales (units) = 6% x 1,000,000 = 60,000
units
Note: All periods are of same duration (e.g. 1 week)
Pre-promotion period Promotion period
Brand’s unit market share 6% 10%
Category sales (#) 1,000,000 1,000,000
Brand sales (#) 60,000 100,000
Baseline sales (#) 60,000
Incremental sales (#) 100,000 – 60,000 = 40,000
Lift from promotion (%) 40,000 / 60,000 = 66.67%
Page 16

Evaluating the outcome of a price promotion
Profit contribution due to promotion
Contribution from Incremental sales results in an:
1. Increase in sales during the promotion period
2. Any increase in sales during the post promotion period
- Higher sales can happen beyond the promotion period because some new
customer may become regular customers
Contribution foregone from baseline sales results in a
What is the forgone contribution?
From the baseline sales (existing customers) who will purchase irrespective of promotion
you are now losing some contribution by decreasing price from $5 to $4 for example (the
forgone contribution)
Result of:
- Reduced contribution from baseline sales during the promotion period
- Any sales shortfall during the post-promotion period
The relationship between Contribution from Incremental sales and Contribution foregone from baseline
If ‘Contribution from Incremental sales’ > ‘Contribution foregone from baseline sales’ then
the net effect is positive and vice versa
Page 17

Case 1: Price promotion scenario with no post-promotion effect
Note: All periods are of same duration (e.g. 1 week)
Note 2: We assume after this promotion period finishes everything goes back to normal
Contribution foregone from baseline sales ($) explanation:
We lose $30 ($70 - $100) on the price reduction for all the units sold (60 000)
Pre-promotion period Promotion period
Brand unit market share 6% 10%
Category sales (#) 1,000,000 1,000,000
Brand sales (#) 60,000 100,000
Variable cost per unit ($) $50 $50
Selling price per unit ($) $150 $120
Contribution per unit ($) $150 - $50 = $100 $120 - $50 = $70
Baseline sales ($) 60,000
Incremental sales ($) 100,000 – 60,000 = 40,000
C o n t r i b u t i o n f r o m Incremental sales ($)
40,000 * $70 = 2,800,000
Contribution foregone from baseline sales ($)
60,000 * ($70 - $100) = 60,000 * -$30 = -1,800,000
Net contribution to profit ($)
$2,800,000 - $1,800,000 = 1,000,000
Page 18

Case 2: Price promotion scenario with post-promotion effect
Note: that all periods are of same duration (e.g. 1 week)
Note re selling price per unit: Decrease the price from $150 to $120 in the promotion
period and in the post promotion period it goes back to $150
Conclusion: The sales of unit increases by 30 000 units but at no benefit In terms of
profits
Pre-promotion period
Promotion period Immediate post-promotion period
Brand unit market share
6% 10% 5%
Category sales (#) 1,000,000 1,000,000 1,000,000
Brand sales (#) 60,000 100,000 50,000
Variable cost per unit ($)
$50 $50 $50
Selling price per unit ($)
$150 $120 $150
Contr ibut ion per unit ($)
$150-$50 =
$100
$120-$50 = $70 $150-$50 = $100
Baseline sales (#) 60,000
Incremental sales (#)
100,000 - 60,000 = 40,000
Sales shortfall (#) 50,000-60,000 = - 10,000
Contribution from incremental sales ($)
40,000 x $70 =
$2,800,000
C o n t r i b u t i o n f o r e g o n e f r o m baseline sales ($)
60,000 * (70 -100) =
- $1,800,000
-10,000 * $100
= -$1,000,000
Net contribution to profit ($)
$2.8 mil + (-$1.8 mil) + (-$1 mil) = $0
Net unit impact (#) 40,000 – 10,000 = 30,000
Page 19
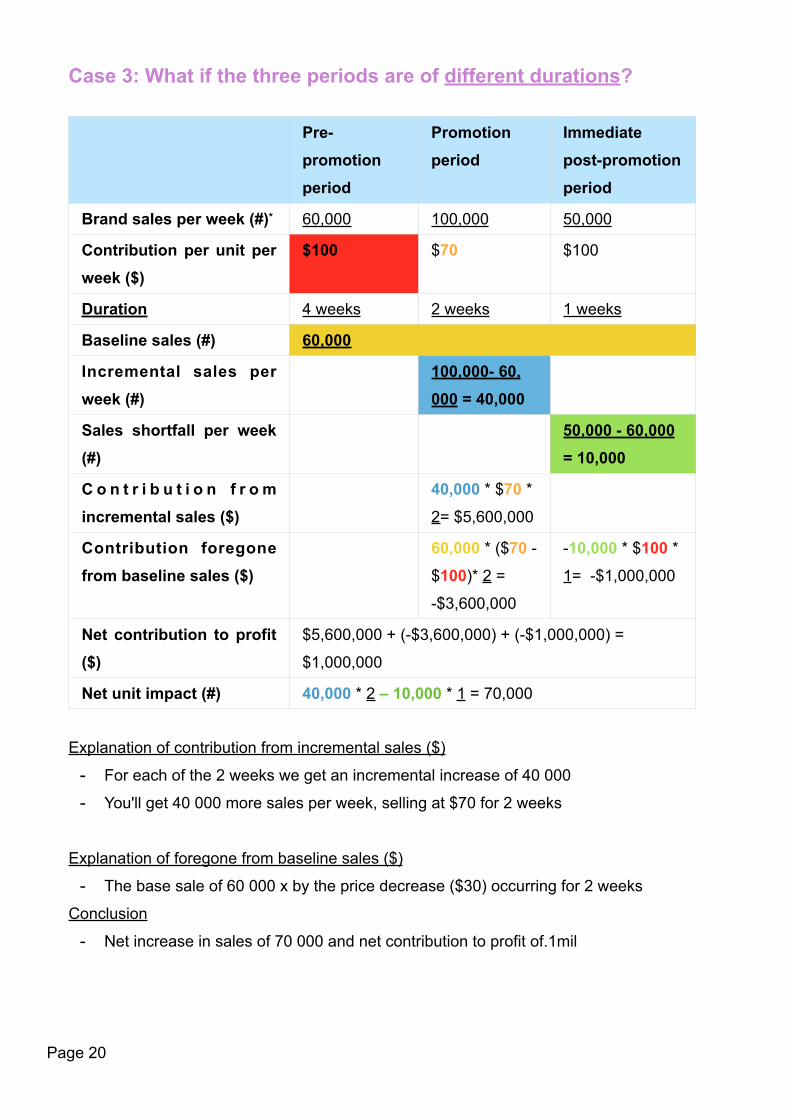
Case 3: What if the three periods are of different durations?
Explanation of contribution from incremental sales ($)
- For each of the 2 weeks we get an incremental increase of 40 000
- You'll get 40 000 more sales per week, selling at $70 for 2 weeks
Explanation of foregone from baseline sales ($)
- The base sale of 60 000 x by the price decrease ($30) occurring for 2 weeks
Conclusion
- Net increase in sales of 70 000 and net contribution to profit of.1mil
Pre-promotion period
Promotion period
Immediate post-promotion period
Brand sales per week (#)* 60,000 100,000 50,000
Contribution per unit per week ($)
$100 $70 $100
Duration 4 weeks 2 weeks 1 weeks
Baseline sales (#) 60,000
Incremental sales per week (#)
100,000- 60, 000 = 40,000
Sales shortfall per week (#)
50,000 - 60,000 = 10,000
C o n t r i b u t i o n f r o m incremental sales ($)
40,000 * $70 *
2= $5,600,000
Contribution foregone from baseline sales ($)
60,000 * ($70 -
$100)* 2 =
-$3,600,000
-10,000 * $100 *
1= -$1,000,000
Net contribution to profit ($)
$5,600,000 + (-$3,600,000) + (-$1,000,000) =
$1,000,000
Net unit impact (#) 40,000 * 2 – 10,000 * 1 = 70,000
Page 20