mmic investigation by policies 2006 08 individual assurance plans summary 2010/s1_kp_sarma.pdf ·...
TRANSCRIPT

MMIC Mortality Investigation by policies 2006‐08
Individual assurance plans Summary
CILA 22nd Nov 2010 K P Sarma
Advisory group on research and publications
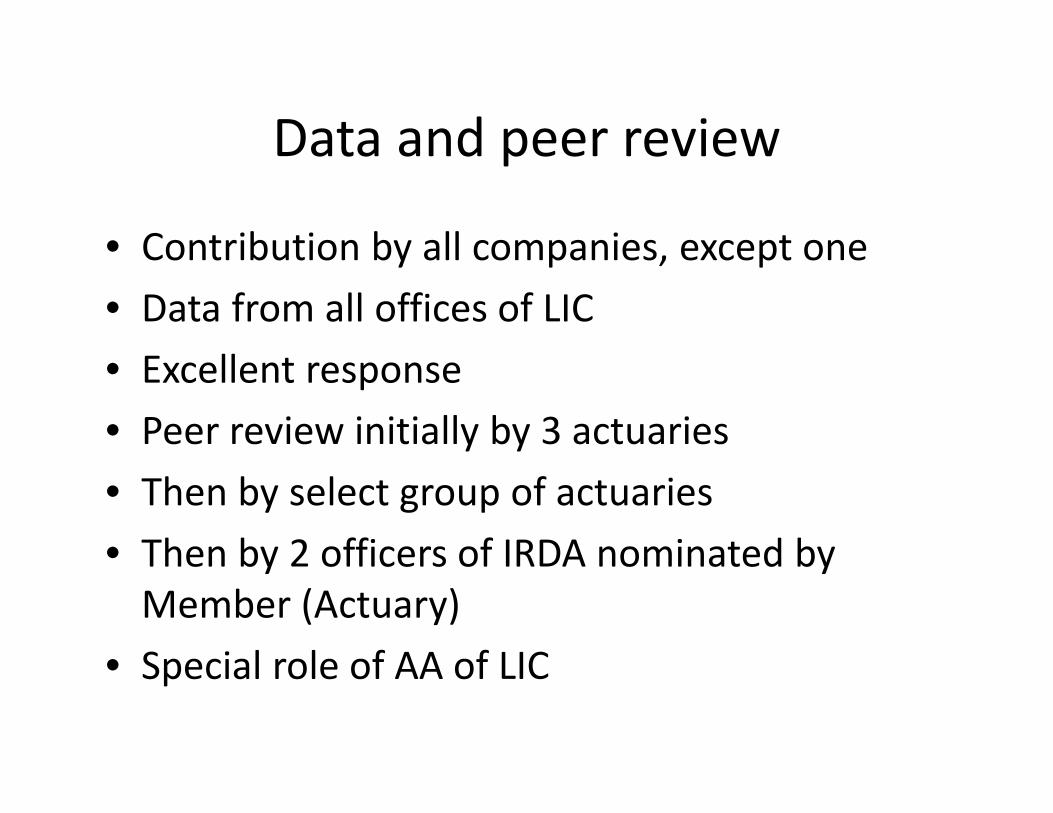
Data and peer review
• Contribution by all companies, except one • Data from all offices of LIC • Excellent response • Peer review initially by 3 actuaries • Then by select group of actuaries • Then by 2 officers of IRDA nominated by Member (Actuary)
• Special role of AA of LIC
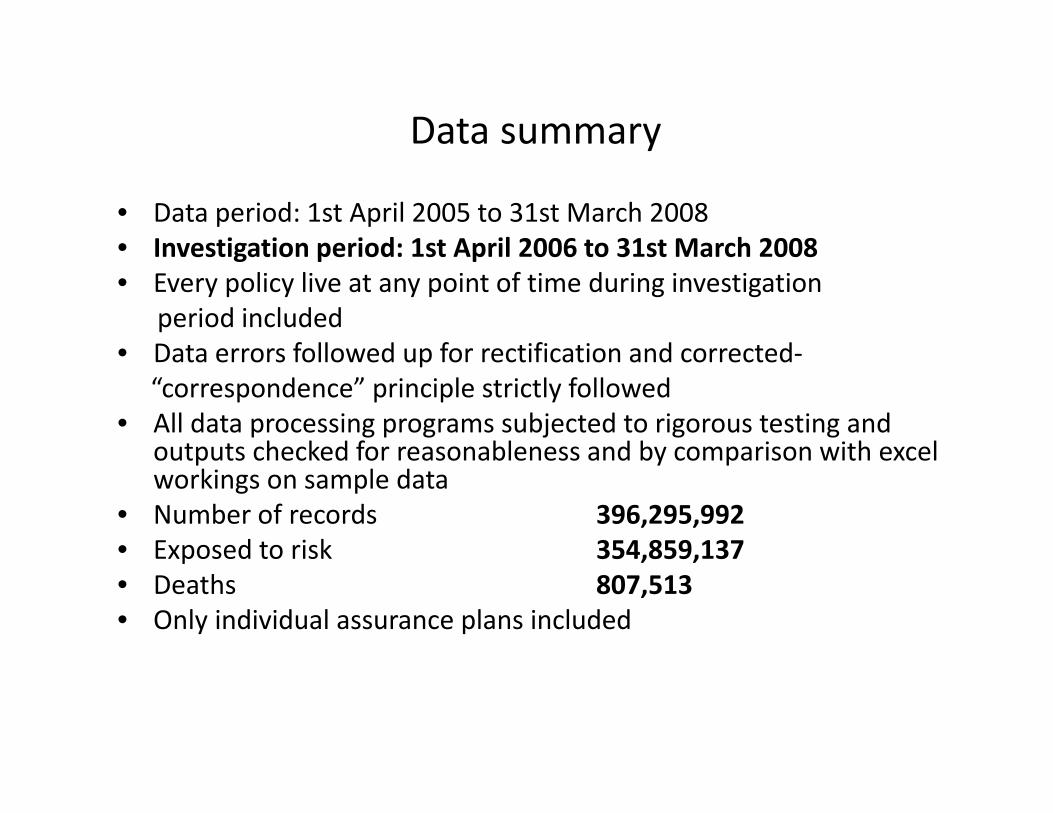
Data summary
• Data period: 1st April 2005 to 31st March 2008 • Investigation period: 1st April 2006 to 31st March 2008 • Every policy live at any point of time during investigation period included • Data errors followed up for rectification and corrected‐ “correspondence” principle strictly followed • All data processing programs subjected to rigorous testing and
outputs checked for reasonableness and by comparison with excel workings on sample data
• Number of records 396,295,992 • Exposed to risk 354,859,137 • Deaths 807,513 • Only individual assurance plans included
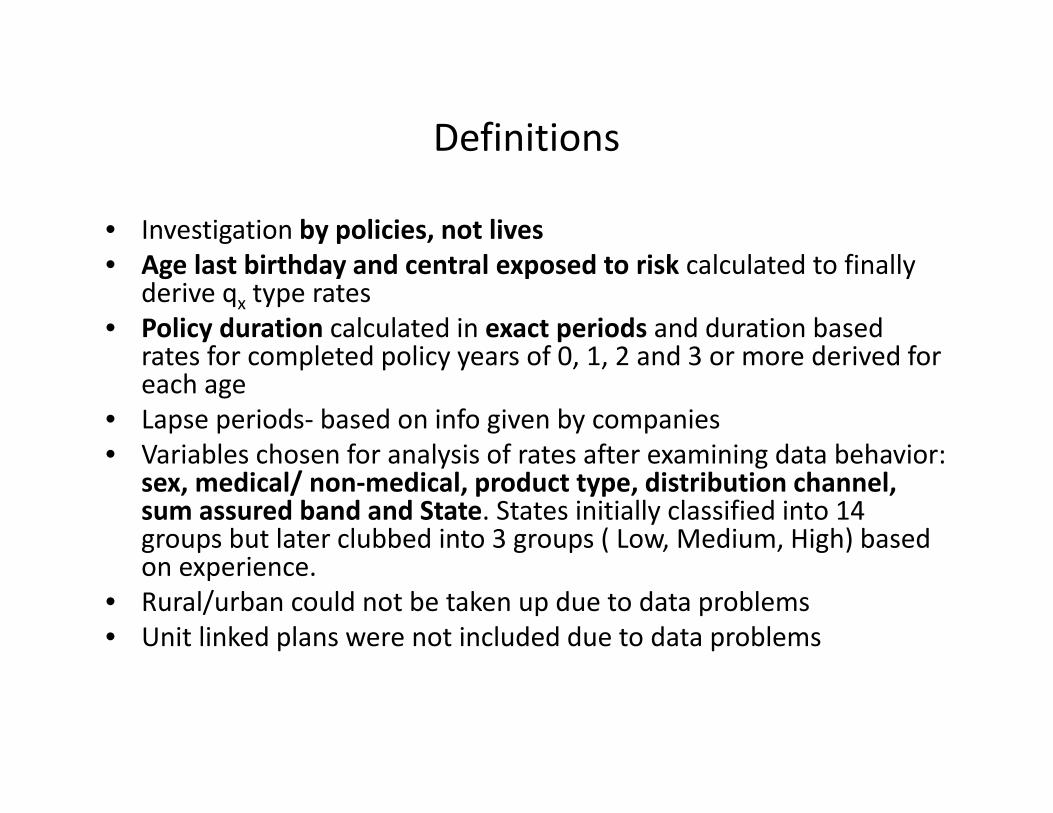
Definitions
• Investigation by policies, not lives • Age last birthday and central exposed to risk calculated to finally
derive qx type rates • Policy duration calculated in exact periods and duration based
rates for completed policy years of 0, 1, 2 and 3 or more derived for each age
• Lapse periods‐ based on info given by companies • Variables chosen for analysis of rates after examining data behavior:
sex, medical/ non‐medical, product type, distribution channel, sum assured band and State. States initially classified into 14 groups but later clubbed into 3 groups ( Low, Medium, High) based on experience.
• Rural/urban could not be taken up due to data problems • Unit linked plans were not included due to data problems
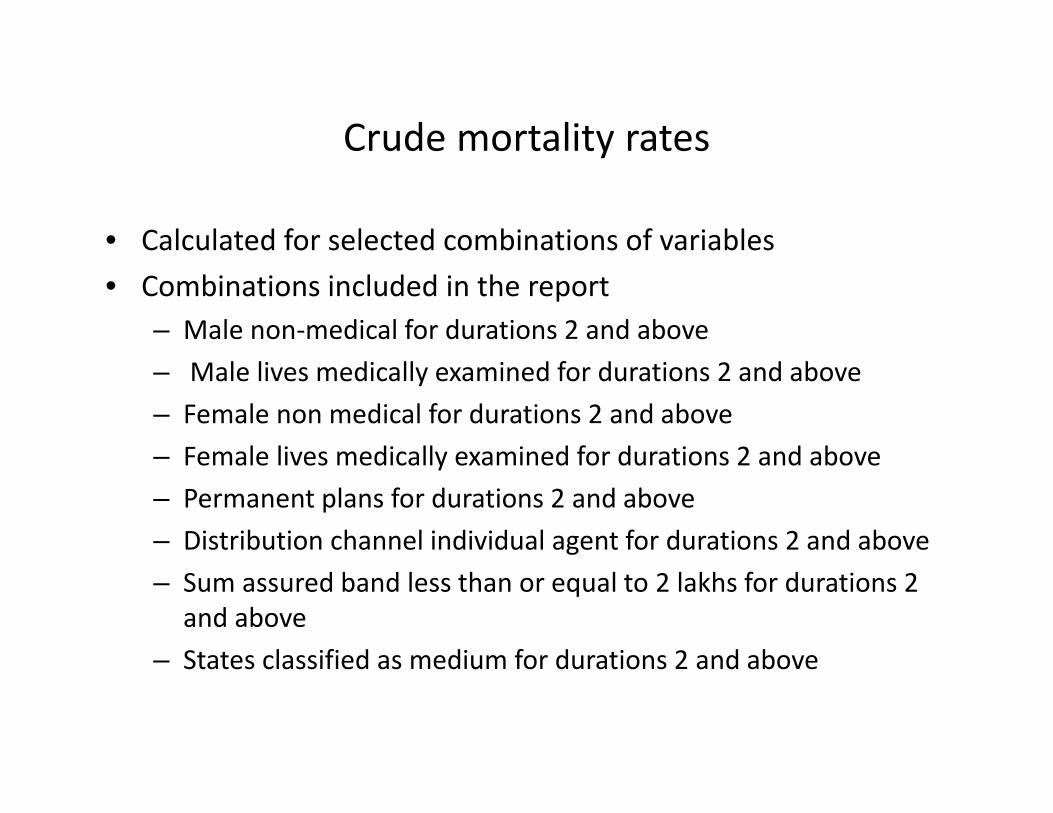
Crude mortality rates
• Calculated for selected combinations of variables • Combinations included in the report
– Male non‐medical for durations 2 and above – Male lives medically examined for durations 2 and above – Female non medical for durations 2 and above – Female lives medically examined for durations 2 and above – Permanent plans for durations 2 and above – Distribution channel individual agent for durations 2 and above – Sum assured band less than or equal to 2 lakhs for durations 2
and above – States classified as medium for durations 2 and above
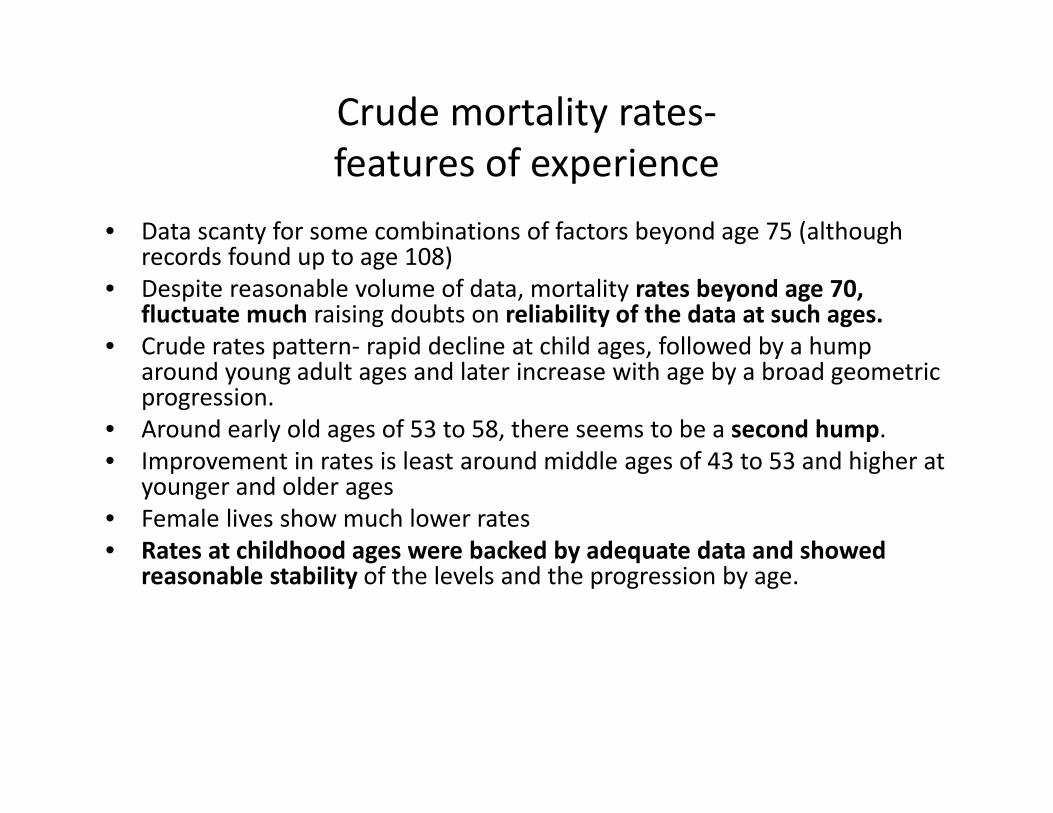
Crude mortality rates‐ features of experience
• Data scanty for some combinations of factors beyond age 75 (although records found up to age 108)
• Despite reasonable volume of data, mortality rates beyond age 70, fluctuate much raising doubts on reliability of the data at such ages.
• Crude rates pattern‐ rapid decline at child ages, followed by a hump around young adult ages and later increase with age by a broad geometric progression.
• Around early old ages of 53 to 58, there seems to be a second hump. • Improvement in rates is least around middle ages of 43 to 53 and higher at
younger and older ages • Female lives show much lower rates • Rates at childhood ages were backed by adequate data and showed
reasonable stability of the levels and the progression by age.

Impact of selection
• Investigated with reference to sample data for durations 0 to 5 and 6 or more
• Also investigated with reference to full data using crude rates and graduated rates for durations 0 to 2, 3 and more and also 2 and more
• Finding: Selection lasts for 2 years . Also some (not robust) evidence of selection up to 3 years. Some individual data units showed negative selection!
• Ultimate rates given for both select periods of 2 years and 3 years • No attempt made to link select rates with ultimate rates by formula.
Instead graduated rates derived for select and ultimate periods separately
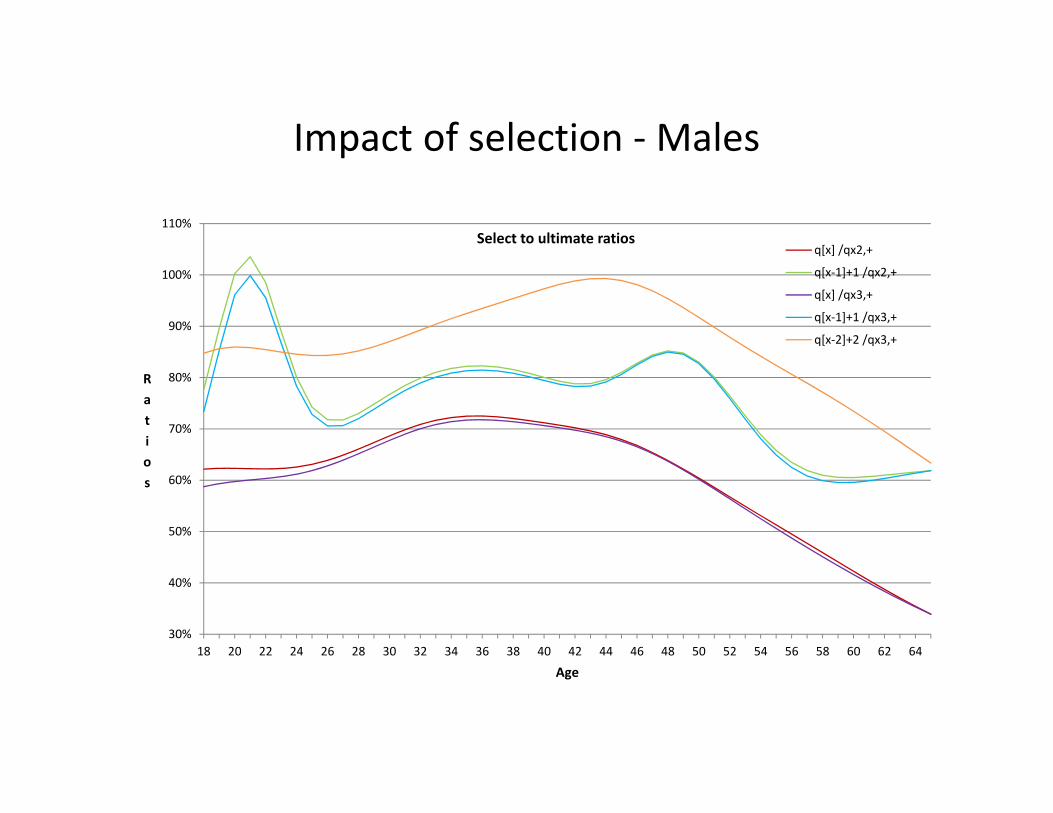
Impact of selection ‐ Males
30%
40%
50%
60%
70%
80%
90%
100%
110%
18 20 22 24 26 28 30 32 34 36 38 40 42 44 46 48 50 52 54 56 58 60 62 64
Ratios
Age
Select to ultimate ratios q[x] /qx2,+
q[x‐1]+1 /qx2,+
q[x] /qx3,+
q[x‐1]+1 /qx3,+
q[x‐2]+2 /qx3,+

Impact of selection ‐ Females
20%
40%
60%
80%
100%
120%
140%
160%
3 5 7 9 11 13 15 17 19 21 23 25 27 29 31 33 35 37 39 41 43 45 47 49 51 53 55 57 59 61 63 65 67 69 71 73 75
Select/ultimate rates %
Age
Female medical selection impact
q[x] / qx (ult :2,+)
q[x‐1]+1 / qx (ult :2,+)
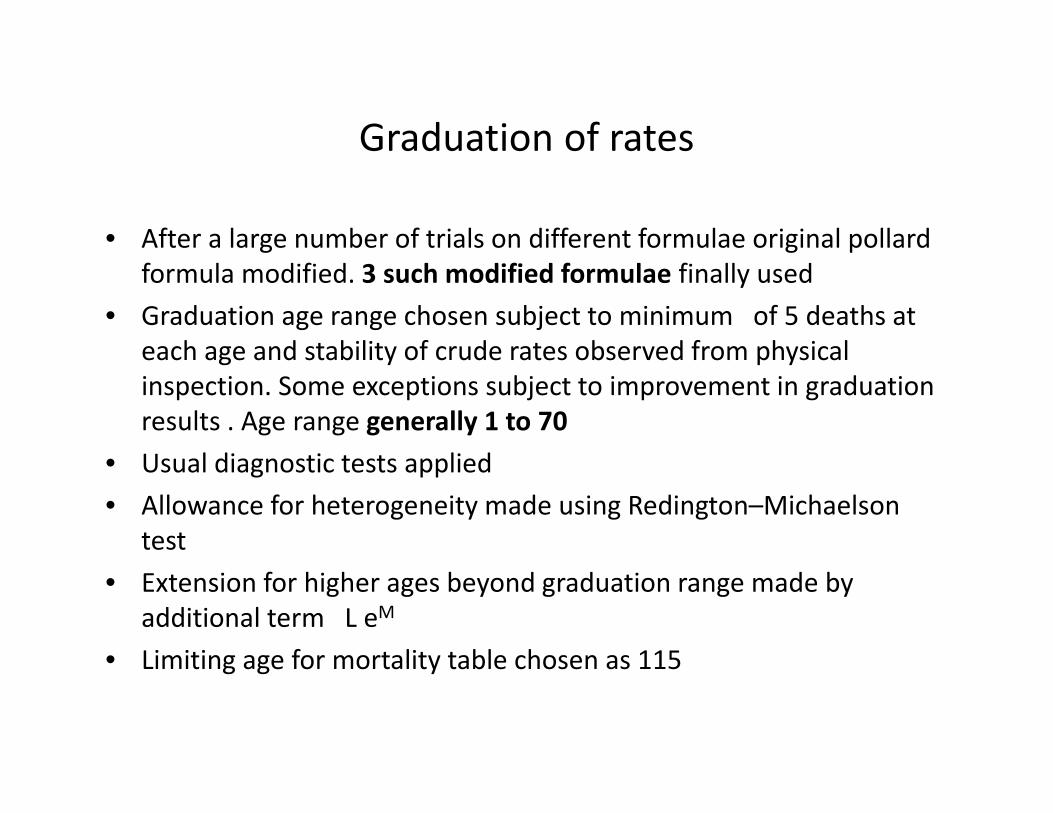
Graduation of rates
• After a large number of trials on different formulae original pollard formula modified. 3 such modified formulae finally used
• Graduation age range chosen subject to minimum of 5 deaths at each age and stability of crude rates observed from physical inspection. Some exceptions subject to improvement in graduation results . Age range generally 1 to 70
• Usual diagnostic tests applied • Allowance for heterogeneity made using Redington–Michaelson
test • Extension for higher ages beyond graduation range made by
additional term L eM • Limiting age for mortality table chosen as 115
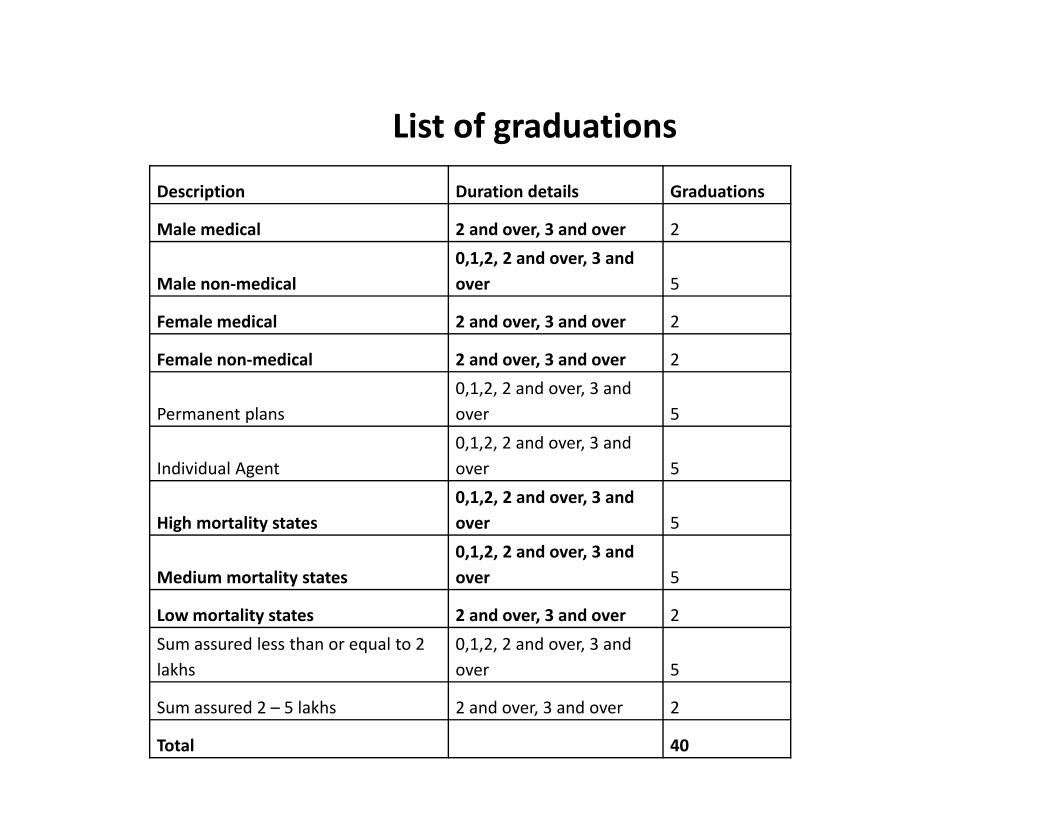
List of graduations
Description Duration details Graduations
Male medical 2 and over, 3 and over 2
Male non‐medical 0,1,2, 2 and over, 3 and over 5
Female medical 2 and over, 3 and over 2
Female non‐medical 2 and over, 3 and over 2
Permanent plans 0,1,2, 2 and over, 3 and over 5
Individual Agent 0,1,2, 2 and over, 3 and over 5
High mortality states 0,1,2, 2 and over, 3 and over 5
Medium mortality states 0,1,2, 2 and over, 3 and over 5
Low mortality states 2 and over, 3 and over 2 Sum assured less than or equal to 2 lakhs
0,1,2, 2 and over, 3 and over 5
Sum assured 2 – 5 lakhs 2 and over, 3 and over 2
Total 40
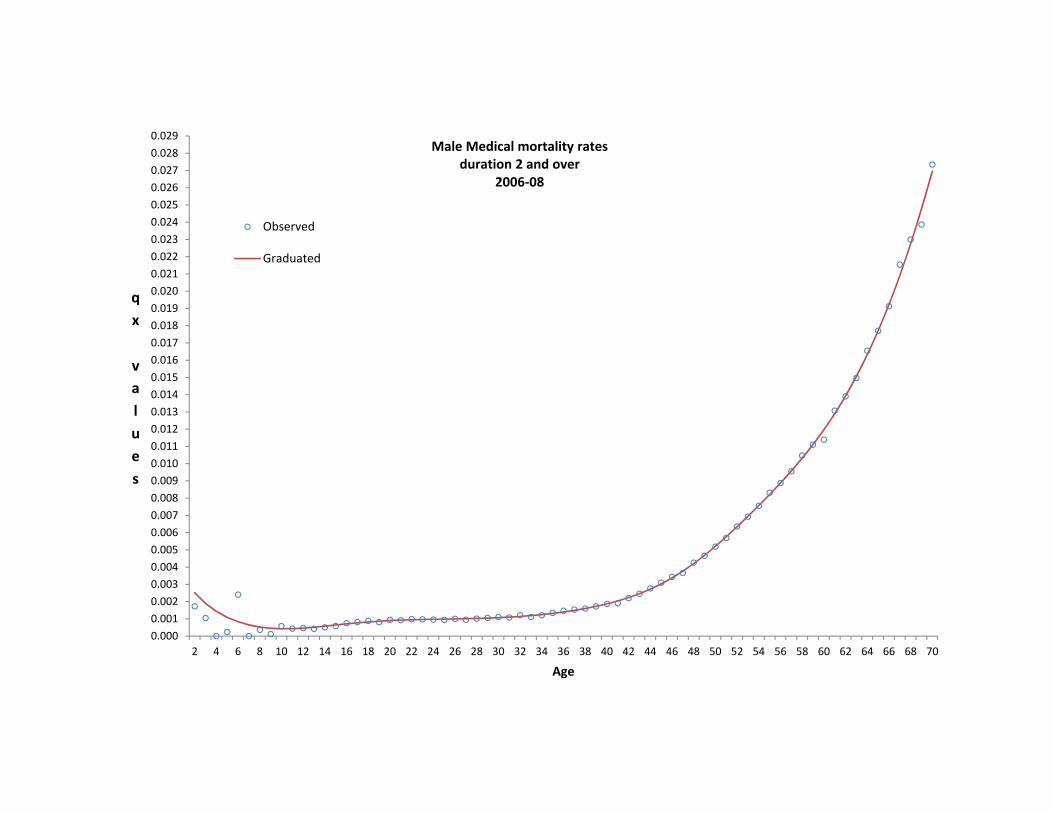
0.0000.0010.0020.0030.0040.0050.0060.0070.0080.0090.0100.0110.0120.0130.0140.0150.0160.0170.0180.0190.0200.0210.0220.0230.0240.0250.0260.0270.0280.029
2 4 6 8 10 12 14 16 18 20 22 24 26 28 30 32 34 36 38 40 42 44 46 48 50 52 54 56 58 60 62 64 66 68 70
qx values
Age
Male Medical mortality rates duration 2 and over
2006‐08
Observed
Graduated

0.000
0.001
0.002
0.003
0.004
0.005
0.006
0.007
0.008
0.009
0.010
0.011
0.012
0.013
0.014
0.015
0.016
0.017
0.018
0.019
0.020
0.021
0.022
2 4 6 8 10 12 14 16 18 20 22 24 26 28 30 32 34 36 38 40 42 44 46 48 50 52 54 56 58 60 62 64 66 68 70
qx values
Age
Male Non‐medical mortality rates duration 2 and over
2006‐08
Observed
Graduated

0.000
0.001
0.002
0.003
0.004
0.005
0.006
0.007
0.008
0.009
0.010
0.011
0.012
0.013
0.014
0.015
0.016
0.017
0.018
0.019
2 4 6 8 10 12 14 16 18 20 22 24 26 28 30 32 34 36 38 40 42 44 46 48 50 52 54 56 58 60 62 64 66 68 70
qx values
Age
Female Medical mortality rates duration 2 and over
2006‐08 Observed
Graduated

0.000
0.001
0.002
0.003
0.004
0.005
0.006
0.007
0.008
0.009
0.010
0.011
0.012
0.013
0.014
0.015
0.016
0.017
0.018
0.019
0.020
2 4 6 8 10 12 14 16 18 20 22 24 26 28 30 32 34 36 38 40 42 44 46 48 50 52 54 56 58 60 62 64 66 68 70
qx values
Age
Female Non‐medical mortality rates duration 2 and over
2006‐08 Observed
Graduated
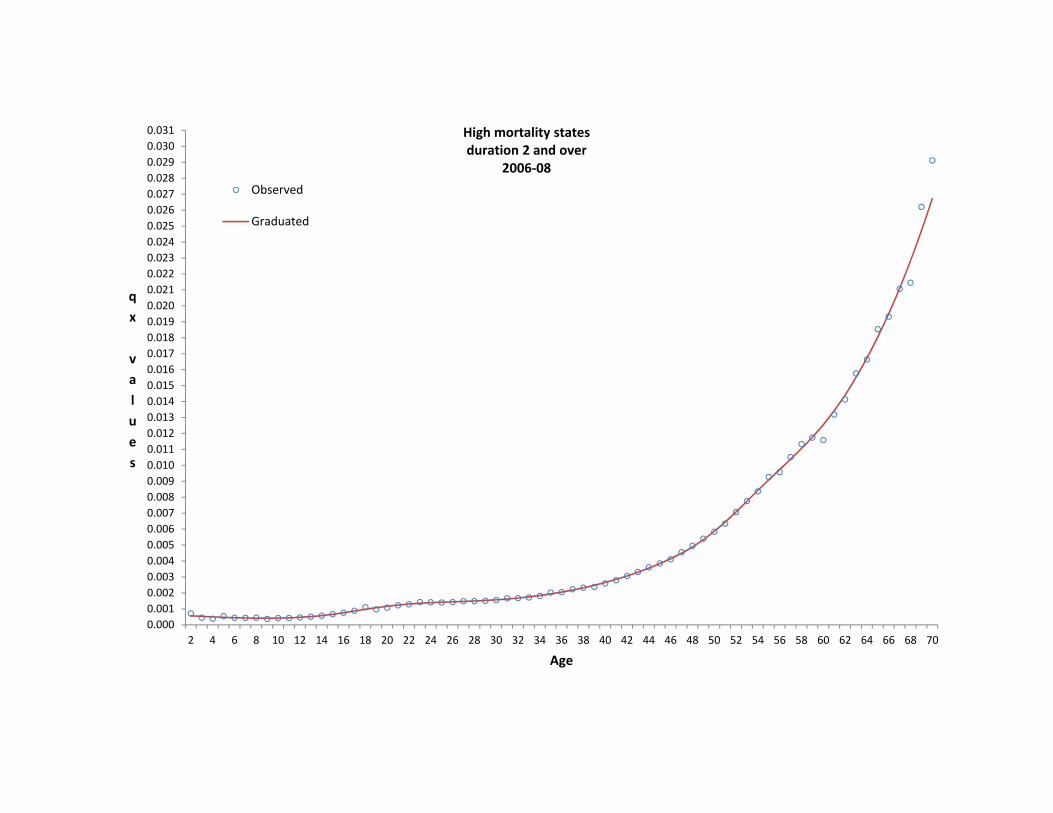
0.0000.0010.0020.0030.0040.0050.0060.0070.0080.0090.0100.0110.0120.0130.0140.0150.0160.0170.0180.0190.0200.0210.0220.0230.0240.0250.0260.0270.0280.0290.0300.031
2 4 6 8 10 12 14 16 18 20 22 24 26 28 30 32 34 36 38 40 42 44 46 48 50 52 54 56 58 60 62 64 66 68 70
qx values
Age
High mortality states duration 2 and over
2006‐08 Observed
Graduated

0.0000.0010.0020.0030.0040.0050.0060.0070.0080.0090.0100.0110.0120.0130.0140.0150.0160.0170.0180.0190.0200.0210.0220.0230.0240.0250.026
2 4 6 8 10 12 14 16 18 20 22 24 26 28 30 32 34 36 38 40 42 44 46 48 50 52 54 56 58 60 62 64 66 68 70
qx values
Age
Medium mortality states
duration 2 and over 2006‐08 observed
Graduated
0.000
0.001
0.002
0.003
0.004
0.005
0.006
0.007
0.008
0.009
0.010
0.011
0.012
0.013
0.014
0.015
0.016
0.017
0.018
0.019
0.020
0.021
0.022
0.023
0.024
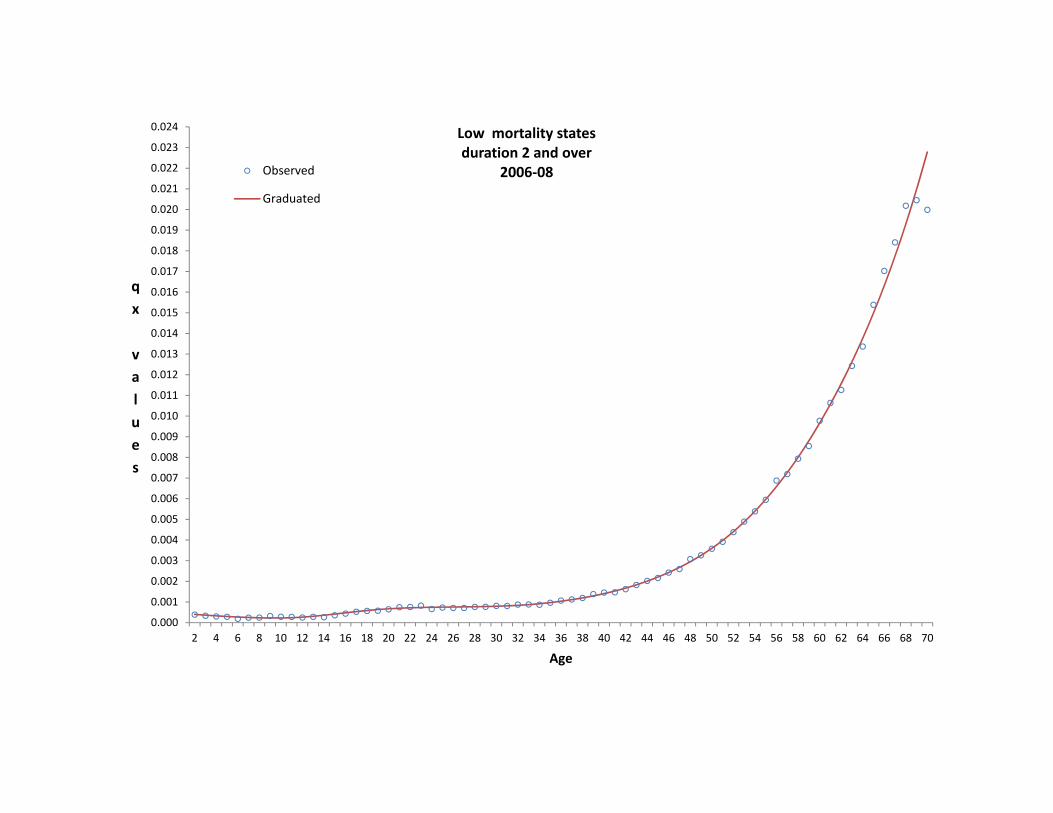
2 4 6 8 10 12 14 16 18 20 22 24 26 28 30 32 34 36 38 40 42 44 46 48 50 52 54 56 58 60 62 64 66 68 70
qx values
Age
Low mortality states duration 2 and over
2006‐08 Observed
Graduated
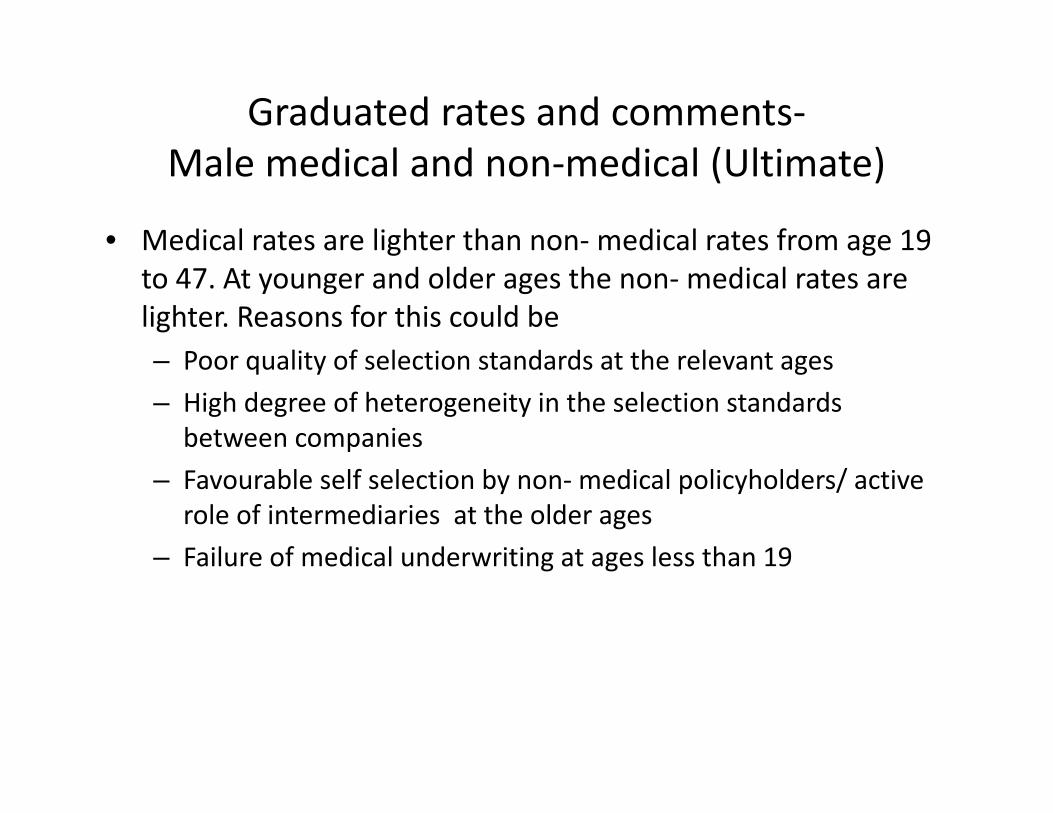
Graduated rates and comments‐ Male medical and non‐medical (Ultimate)
• Medical rates are lighter than non‐ medical rates from age 19 to 47. At younger and older ages the non‐ medical rates are lighter. Reasons for this could be – Poor quality of selection standards at the relevant ages – High degree of heterogeneity in the selection standards
between companies – Favourable self selection by non‐ medical policyholders/ active
role of intermediaries at the older ages – Failure of medical underwriting at ages less than 19

Graduated rates ‐ Male medical and non‐medical (Ultimate)
‐0.002
0.000
0.002
0.004
0.006
0.008
0.010
0.012
0.014
0.016
0.018
0.020
0.022
0.024
0.026
2 4 6 8 10 12 14 16 18 20 22 24 26 28 30 32 34 36 38 40 42 44 46 48 50 52 54 56 58 60 62 64 66 68 70
qx values
Age
Male Medical Vs Male Non‐Medical Ultimate (Duration 2 and above)
Male Non Medical
Male Medical

Graduated rates and comments‐ Female medical and non‐medical (Ultimate)
• Except over a short age range of 20 to 32, medical rates are heavier than non‐medical rates. Reasons could be‐ – Focus of medical underwriting on pregnancy related risks at the
younger ages and disregard of other aspects of risks on female lives
– Grant of non‐ medical to female lives to a highly select class of lives such as employees of government or reputed private sector organisations and placing other restrictions such as on sum assured and plan of assurance resulting in better quality lives
– Favourable self selection by non‐ medical policyholders/ active role of intermediaries at the older ages
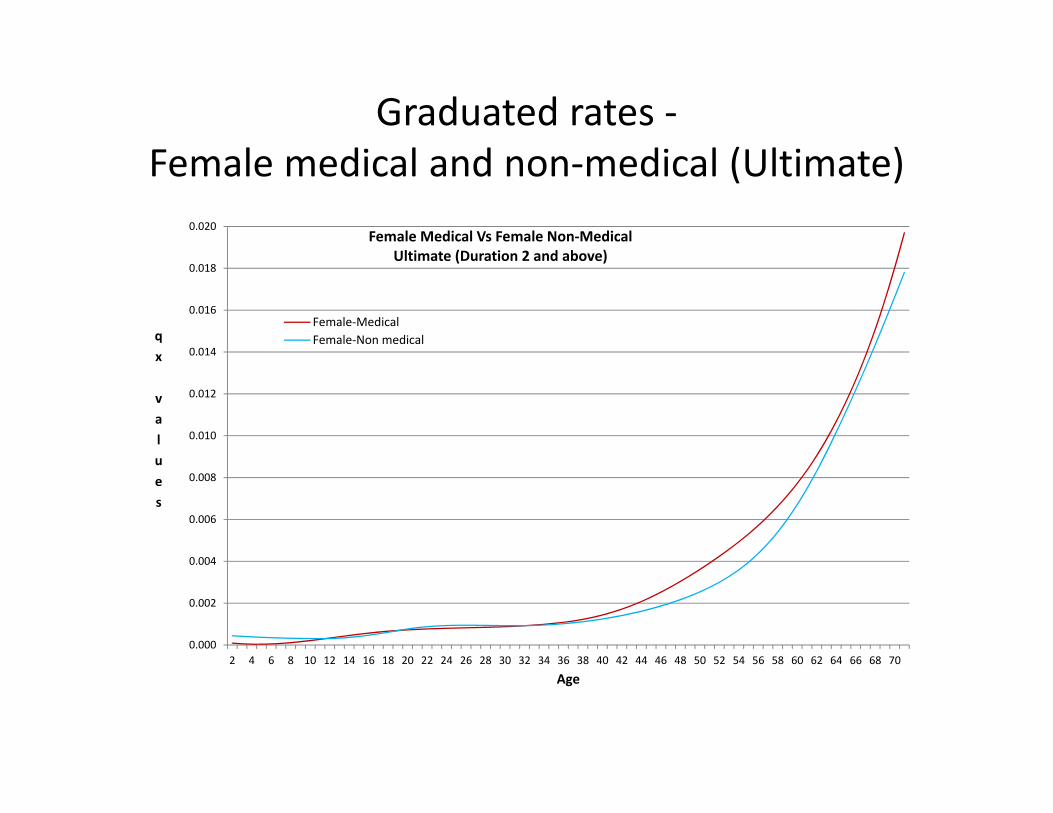
Graduated rates ‐ Female medical and non‐medical (Ultimate)
0.000
0.002
0.004
0.006
0.008
0.010
0.012
0.014
0.016
0.018
0.020
2 4 6 8 10 12 14 16 18 20 22 24 26 28 30 32 34 36 38 40 42 44 46 48 50 52 54 56 58 60 62 64 66 68 70
qx values
Age
Female Medical Vs Female Non‐Medical Ultimate (Duration 2 and above)
Female‐MedicalFemale‐Non medical

Graduated rates and comments‐ Male medical and Female medical (Ultimate)
• Female rates (ultimate) are lighter by about 20% at age 15. Deteriorates very slightly up to age 28 followed by slow improvement up to around age 39. From around age 44, improvement is gradual and reaches 35.8% by age 57. At later ages there is again a slow deterioration.
• Pattern reflects slow improvement over male rates during the working ages of 20 to 60 with small deteriorations around child bearing ages and a short lull over the ages 38 to 44.
• At all ages female rates(ultimate) are lighter than male rates (ultimate).

Graduated rates ‐ Male medical and Female medical (Ultimate)
40.0%
50.0%
60.0%
70.0%
80.0%
90.0%
100.0%
110.0%
120.0%
130.0%
2 4 6 8 10 12 14 16 18 20 22 24 26 28 30 32 34 36 38 40 42 44 46 48 50 52 54 56 58 60 62 64 66 68 70
ratio
s of fe
male to m
ale rates
Age
Female medical vs Male medical
qx (ult :2,+)
q[x]
q[x‐1]+1

Graduated rates and comments‐ Male non‐medical and Female non‐medical (Ultimate)
• Female rates are lighter by 26.8% at age 13 but deteriorate up to age 23 to reach 17.2%. Rapid improvement follows up to age 45 to reach 48.5% lighter than males. Again there is a fast rate of deterioration to reach 32.4% at age 60.
• Pattern of comparison to male non medical rates is similar to comparison between medical females to medical males but the extent of variation and hence the rate of change is higher.

Graduated rates ‐ Male non‐medical and Female non‐medical (Ultimate)
0.5
0.6
0.6
0.7
0.7
0.8
0.8
0.9
0.9
1.0
1.0
1.1
2 4 6 8 10 12 14 16 18 20 22 24 26 28 30 32 34 36 38 40 42 44 46 48 50 52 54 56 58 60 62 64 66 68 70
ratio
s of fe
male to m
ale rates
Age
Female non medical vs Male non medical
qx (ult :2,+)
q[x]
q[x‐1]+1

Graduated rates ‐ Male and Female (Ultimate)‐ comparison by age difference
Female age Corresponding male age with equivalent rate (medical)
Age difference‐ medical
Age difference‐ non medical
20 16 + 3+ 2+
25
17+ 7+ 5+
30 19+ 10+ 10
35 28+ 6+ 14+
40 36+ 13+ 12+
45 42 3 9+
50 46+ 3+ 9
55 50+ 4+ 7+
60 54+ 5+ 5+

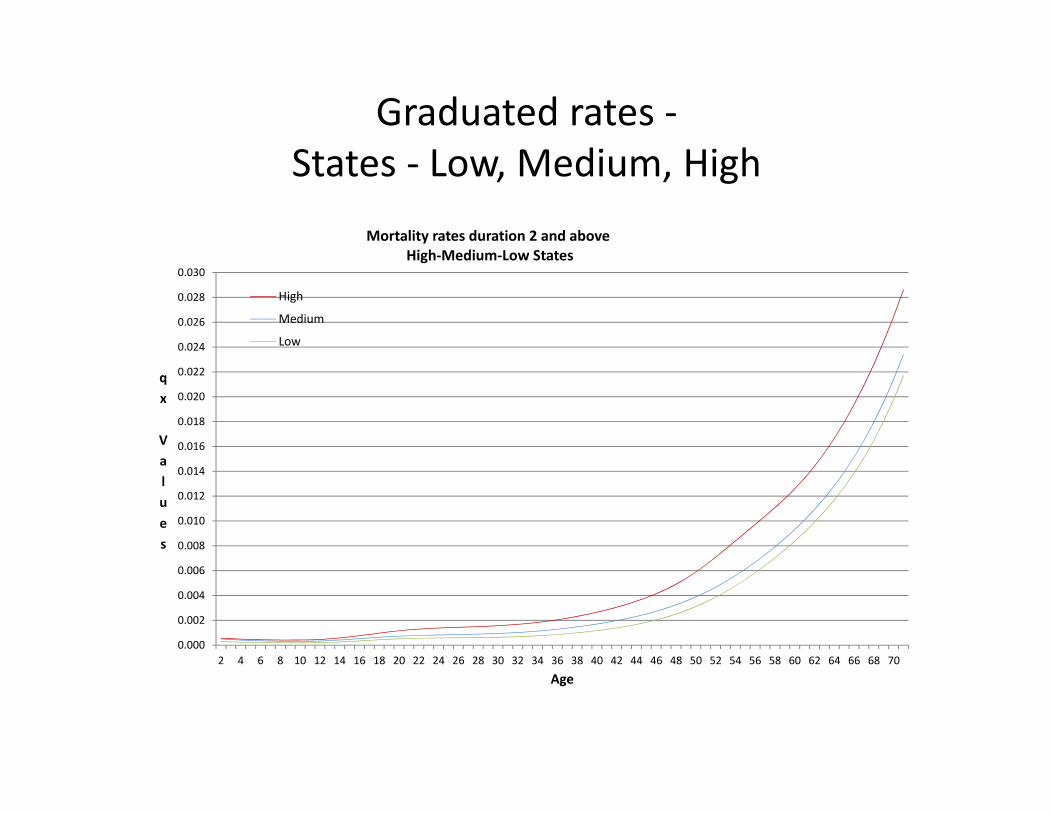
Graduated rates and comments‐ States ‐ Low, Medium, High
• Medium states show about 21% lower rates at age 6 compared to High states but this goes up to 41% at age 26 and again moves down to 20% at age 70.
• Low states show about 56% lower rates at age 13 compared to the High states but this goes slightly down to 54.8% at age 18 and thereafter keeps moving up to reach 59.6% at age 30; at age 47 it reaches 50% and at age 70 it is 26%.
• Accident hump at young ages and the second hump at older ages are most noticeable for the High states. For Medium states the two humps are more than for the light states.
• Low states show low mortality at all ages and similarly, Medium and High classifications apply at all ages; at no age there is an intersection of the 3 curves.
Graduated rates ‐ States ‐ Low, Medium, High
0.000
0.002
0.004
0.006
0.008
0.010
0.012
0.014
0.016
0.018
0.020
0.022
0.024
0.026
0.028
0.030
2 4 6 8 10 12 14 16 18 20 22 24 26 28 30 32 34 36 38 40 42 44 46 48 50 52 54 56 58 60 62 64 66 68 70
qx Values
Age
Mortality rates duration 2 and above High‐Medium‐Low States
High
Medium
Low

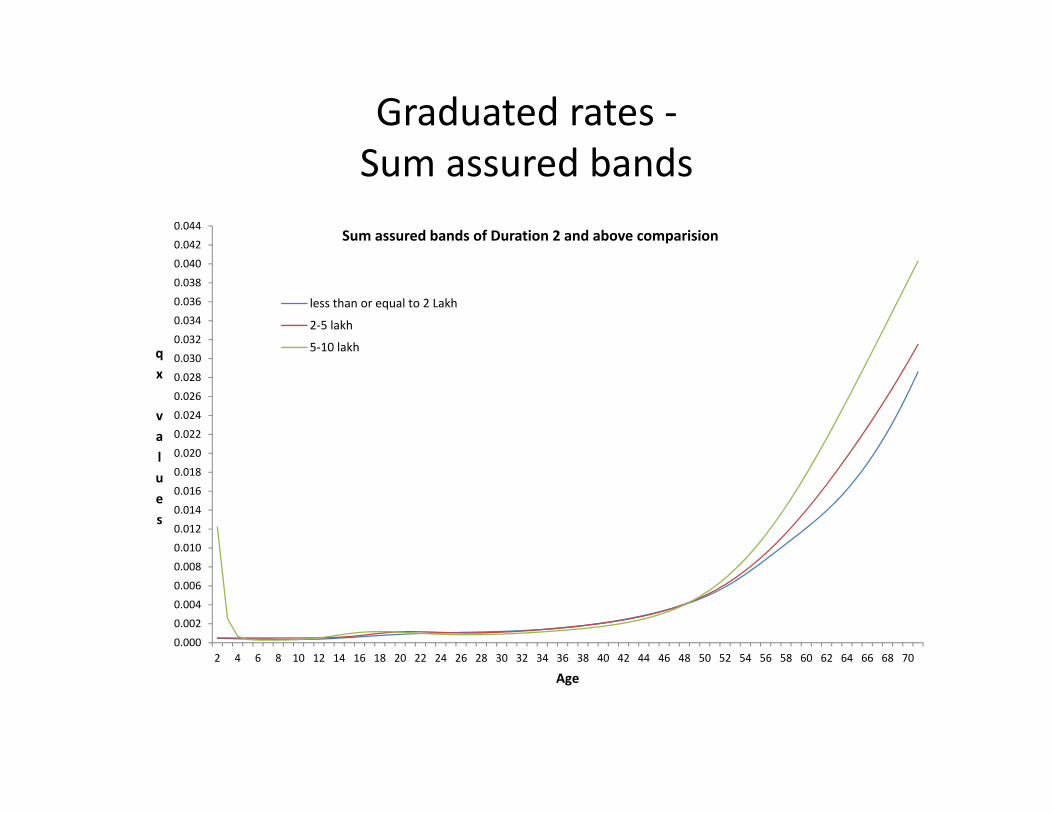
Graduated rates and comments‐ Sum assured bands
• SA band 5 to 10 lakhs: – Experience for the SA band 5 to 10 lakhs at the initial ages up to age 24 is heavier than for the SA band less than 2 lakhs. This could be a pointer towards a need for better selection methods for this age group for the higher SA bands.
– However, the experience improves for this SA band steadily up to age 48. Thereafter it again deteriorates to reach 118% at age 70.
• SA band 2 to 5 lakhs: – Experience compared to experience of SA band less than 2 lakhs is heavier up to age 24. Thereafter up to age 46 it is marginally lower. Thereafter there is a gradual deterioration to reach 120% at age 64.
Graduated rates ‐ Sum assured bands
0.000
0.002
0.004
0.006
0.008
0.010
0.012
0.014
0.016
0.018
0.020
0.022
0.024
0.026
0.028
0.030
0.032
0.034
0.036
0.038
0.040
0.042
0.044
2 4 6 8 10 12 14 16 18 20 22 24 26 28 30 32 34 36 38 40 42 44 46 48 50 52 54 56 58 60 62 64 66 68 70
qx values
Age
Sum assured bands of Duration 2 and above comparision
less than or equal to 2 Lakh
2‐5 lakh
5‐10 lakh

Graduated rates‐ Male medical
0.000
0.002
0.004
0.006
0.008
0.010
0.012
0.014
0.016
0.018
0.020
0.022
0.024
0.026
0.028
0.030
1 4 7 10 13 16 19 22 25 28 31 34 37 40 43 46 49 52 55 58 61 64 67 70
qx values
Age
Male medical ‐ 2006‐08 Durations 0, 1, 2, 2,+ and 3,+
q[x]
q[x‐1]+1
q[x‐2]+2
qx (ult :2,+)
qx (ult :3,+)
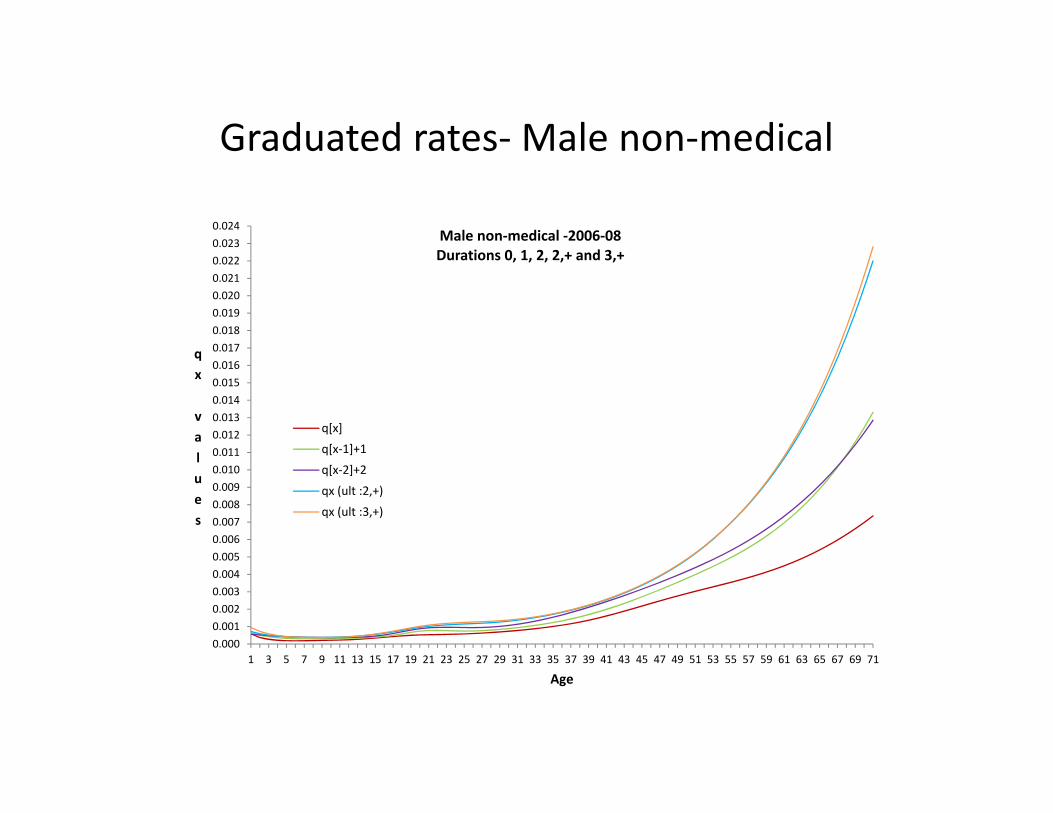
Graduated rates‐ Male non‐medical
0.0000.0010.0020.0030.0040.0050.0060.0070.0080.0090.0100.0110.0120.0130.0140.0150.0160.0170.0180.0190.0200.0210.0220.0230.024
1 3 5 7 9 11 13 15 17 19 21 23 25 27 29 31 33 35 37 39 41 43 45 47 49 51 53 55 57 59 61 63 65 67 69 71
qx values
Age
Male non‐medical ‐2006‐08 Durations 0, 1, 2, 2,+ and 3,+
q[x]
q[x‐1]+1
q[x‐2]+2
qx (ult :2,+)
qx (ult :3,+)

Graduated rates‐ Female medical
0.0000
0.0010
0.0020
0.0030
0.0040
0.0050
0.0060
0.0070
0.0080
0.0090
0.0100
0.0110
0.0120
0.0130
0.0140
0.0150
0.0160
0.0170
0.0180
0.0190
0.0200
1 3 5 7 9 11 13 15 17 19 21 23 25 27 29 31 33 35 37 39 41 43 45 47 49 51 53 55 57 59 61 63 65 67 69 71
qx values
Age
Female medical ‐ 2006‐08 Durations 0, 1, 2, 2,+ and 3,+
q[x]
q[x‐1]+1
q[x‐2]+2
qx (ult :2,+)
qx (ult :3,+)

Graduated rates‐ Female non‐medical
0.000
0.001
0.002
0.003
0.004
0.005
0.006
0.007
0.008
0.009
0.010
0.011
0.012
0.013
0.014
0.015
0.016
1 4 7 10 13 16 19 22 25 28 31 34 37 40 43 46 49 52 55 58 61 64 67 70
qx Values
Age
Female Non‐medical ‐ 2006‐08 Durations 0, 1, 2, 2,+ and 3,+
q[x]
q[x‐1]+1
q[x‐2]+2
qx (ult :2,+)
qx (ult :3,+)
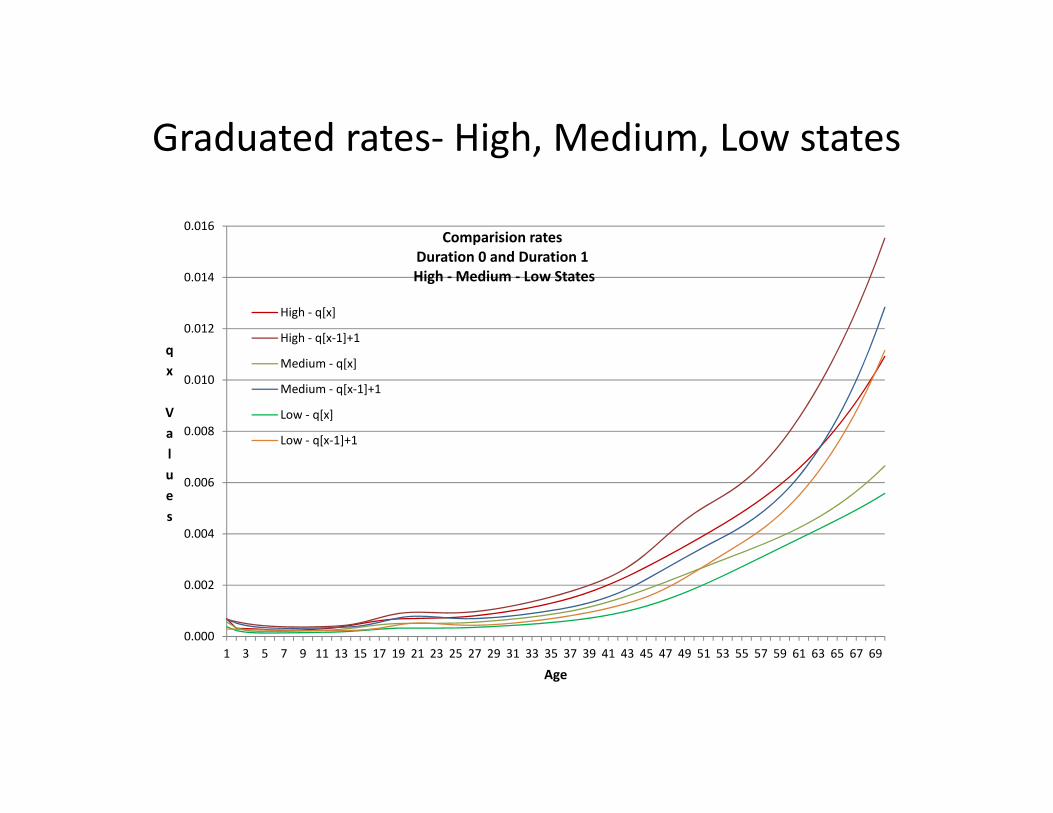
Graduated rates‐ High, Medium, Low states
0.000
0.002
0.004
0.006
0.008
0.010
0.012
0.014
0.016
1 3 5 7 9 11 13 15 17 19 21 23 25 27 29 31 33 35 37 39 41 43 45 47 49 51 53 55 57 59 61 63 65 67 69
qx Values
Age
Comparision rates Duration 0 and Duration 1 High ‐ Medium ‐ Low States
High ‐ q[x]
High ‐ q[x‐1]+1
Medium ‐ q[x]
Medium ‐ q[x‐1]+1
Low ‐ q[x]
Low ‐ q[x‐1]+1
Graduated rates‐ Permanent Plans
0.0000.0010.0020.0030.0040.0050.0060.0070.0080.0090.0100.0110.0120.0130.0140.0150.0160.0170.0180.0190.020
1 3 5 7 9 11 13 15 17 19 21 23 25 27 29 31 33 35 37 39 41 43 45 47 49 51 53 55 57 59 61 63 65 67 69 71
qx Values
Age
Permanent Plans ‐2006‐08 Durations 0, 1, 2, 2,+ and 3,+
q[x]
q[x‐1]+1
q[x‐2]+2
qx (ult :2,+)
qx (ult :3,+)
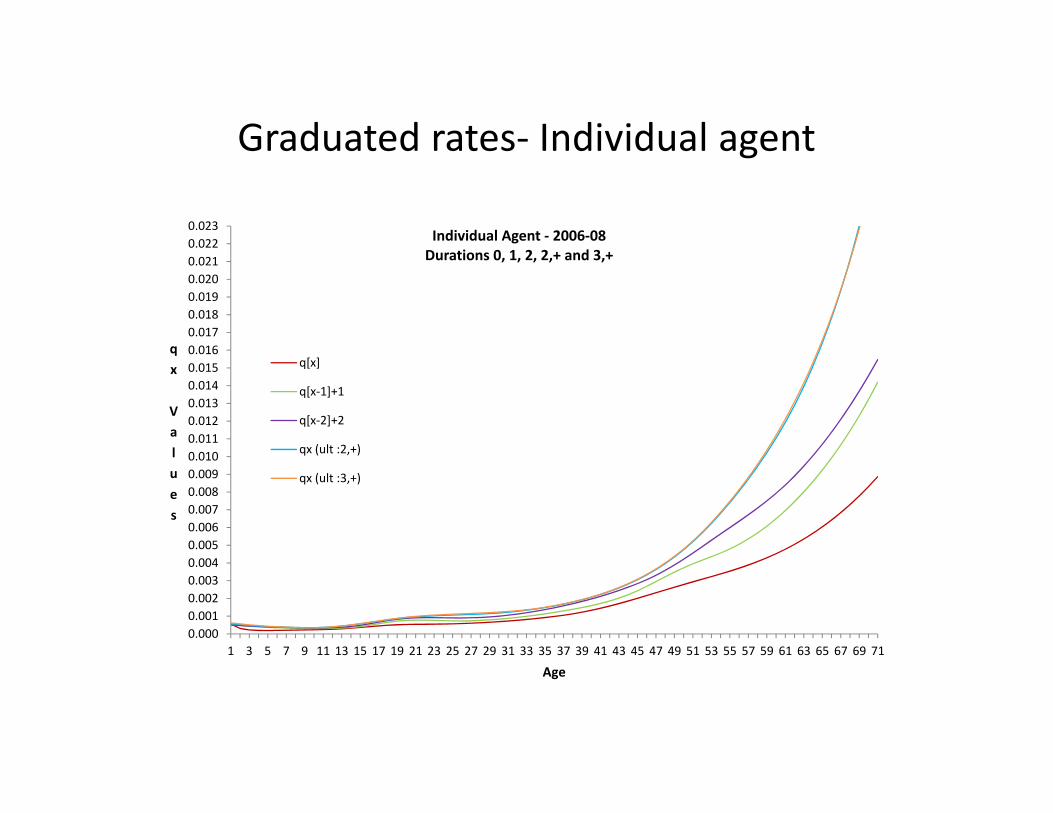
Graduated rates‐ Individual agent
0.0000.0010.0020.0030.0040.0050.0060.0070.0080.0090.0100.0110.0120.0130.0140.0150.0160.0170.0180.0190.0200.0210.0220.023
1 3 5 7 9 11 13 15 17 19 21 23 25 27 29 31 33 35 37 39 41 43 45 47 49 51 53 55 57 59 61 63 65 67 69 71
qx Values
Age
Individual Agent ‐ 2006‐08 Durations 0, 1, 2, 2,+ and 3,+
q[x]
q[x‐1]+1
q[x‐2]+2
qx (ult :2,+)
qx (ult :3,+)

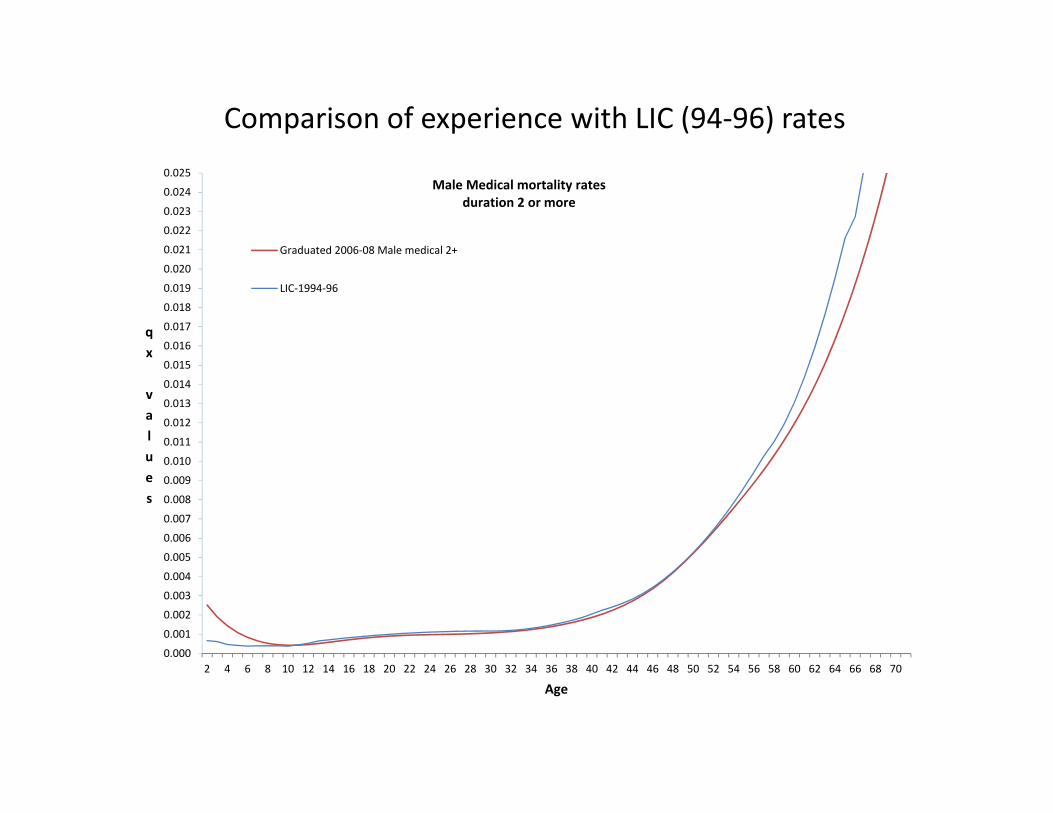
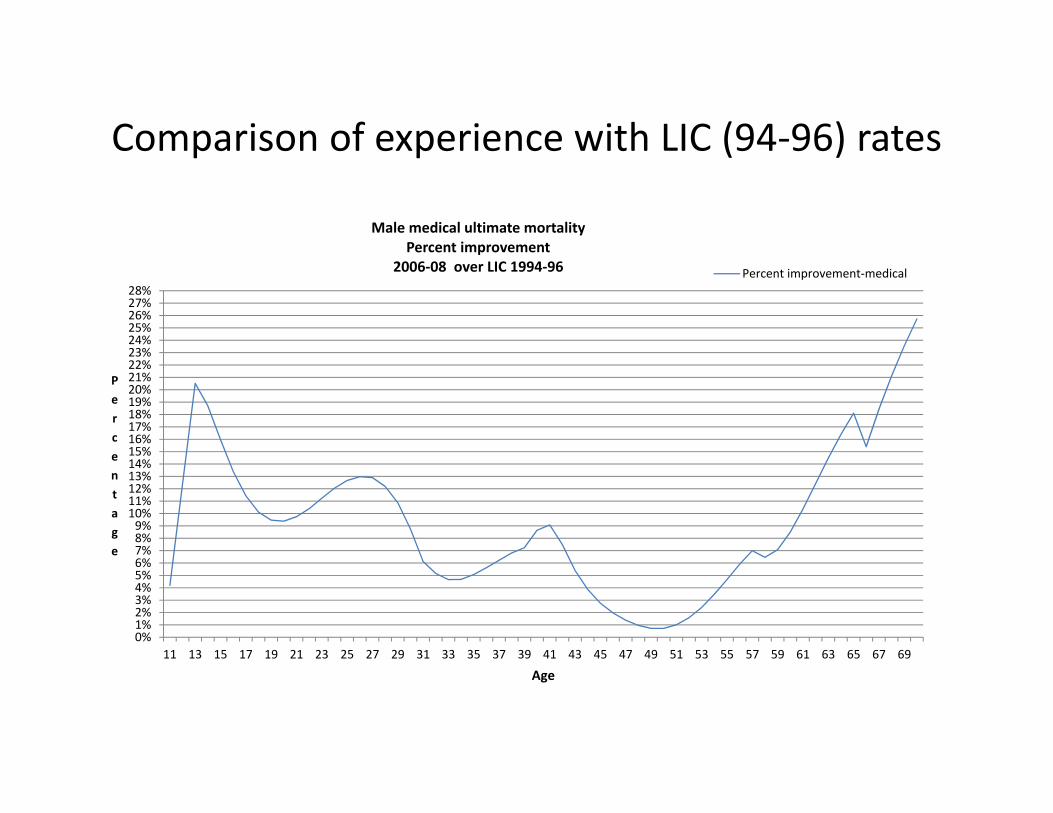
Comparison of experience with LIC (94‐96) rates • Male medical durations 2 and over‐ Comparison of the rates indicates improvement in rates
varies from 5% to 10% at many ages and is very low at around 1% in the age range 47 to 51. The highest rate of improvement is 13% at age 26.
• Rates of improvement could be seen by many as lower than expected on an a priori basis over a 12 year period.
• Male medical experience has improved at all ages. • Some related observations: ‐ Selection procedures and medical examination standards may have changed significantly,
particularly in an environment of competition, which was absent at the time of 94‐96 investigation.
‐ Experience may be construed as spread of life insurance to social classes not covered earlier and with possibly heavier mortality‐ thus moving somewhat towards census mortality
‐Inclusion of UL plans could show slightly higher improvement rates ‐The 1994‐96 investigation covers a much smaller population compared to the current
investigation. Moreover, data is drawn from all parts of the country now against only some parts earlier. Also differences in age and duration definitions may add 3 to 8% in improvement
‐Changes in life style with improved living standards and changes in socio cultural background lead to stress particularly in the middle ages. This could be a cause for low percentage of improvement in the age range 34 to 50

Comparison of experience with LIC (94‐96) rates
Independent study on census mortality referred to: ‐Improvements in longevity have been “spectacular” in 1970s and 1980s, but very much slower in 1990s and 2000s. ‐Increases in temporary life expectancy up to age 60, in all states, were mostly due to improvement in mortality among infants and children. Mortality reductions at adult ages were generally smaller. Improvements at the young and adult ages have declined since the 1990s. ‐Newly “emerging health threats such as AIDS, returning infectious disease, and growing burden of chronic diseases and injuries” will need greater attention. ‐There can now be a difficult “epidemiologic transition” towards a “struggle with health problems of adulthood that are much more difficult to treat or prevent”

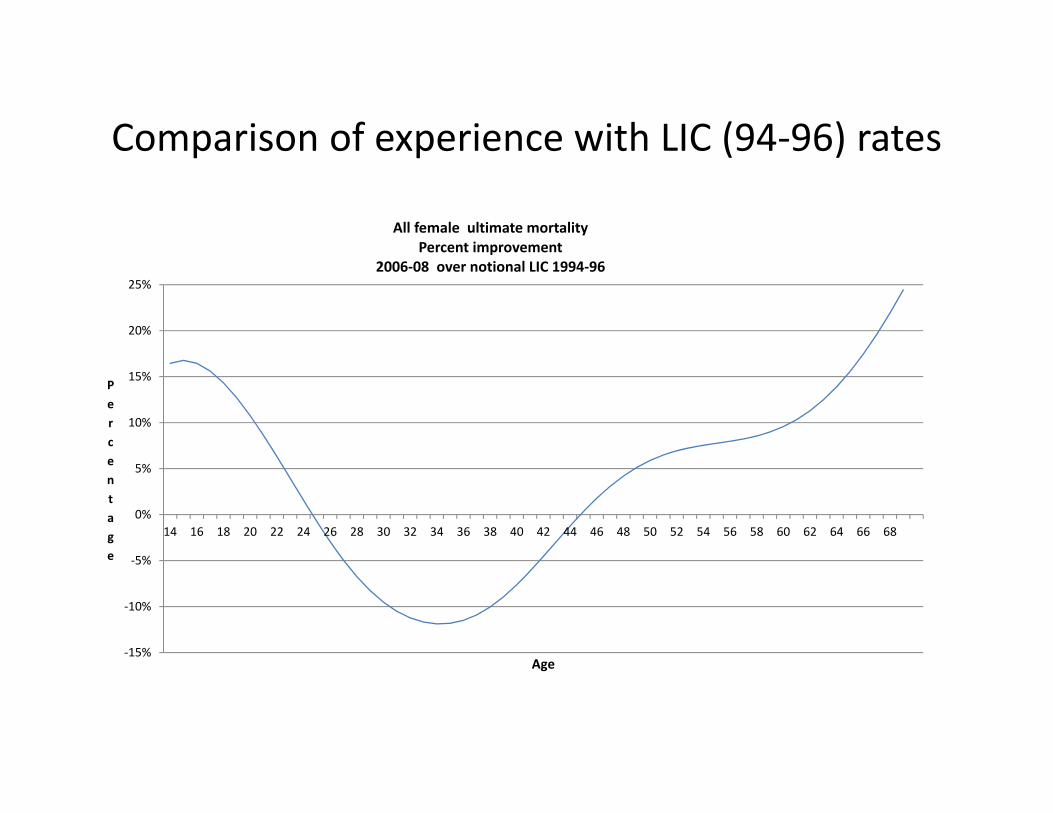
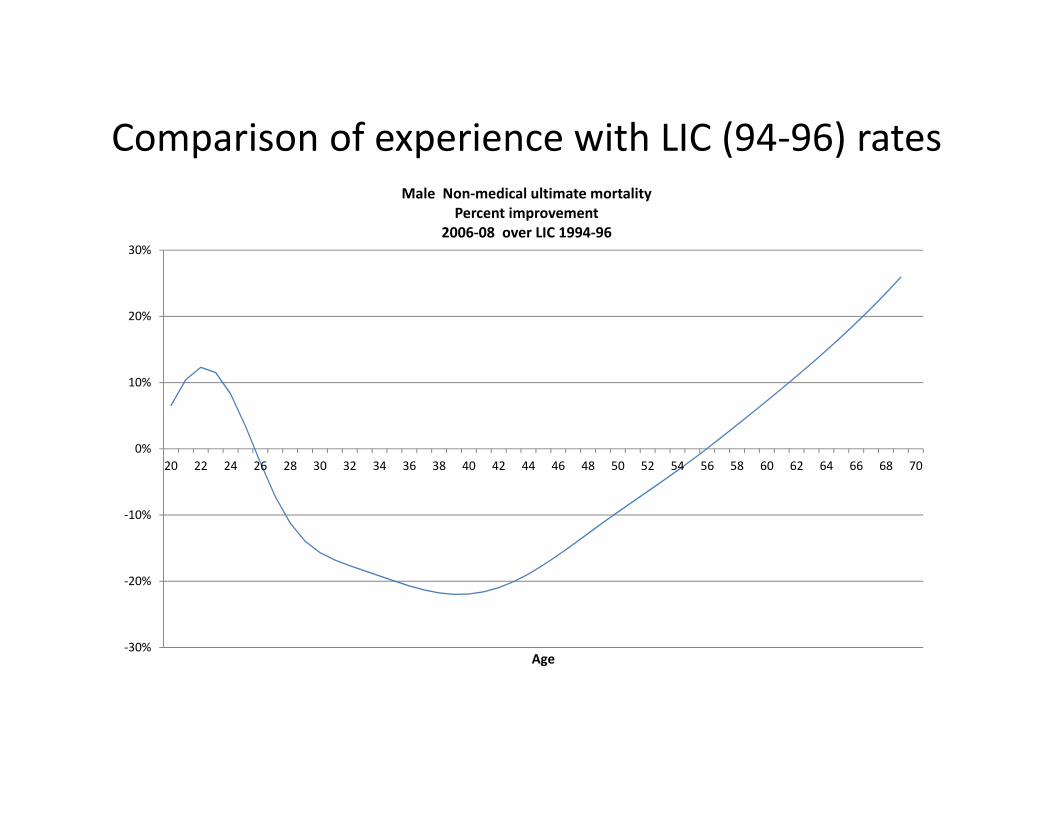
Comparison of experience with LIC (94‐96) rates Further comparisons:
All females for durations 2 or more All males for durations 2 or more Male non medical for durations 2 or more
Important features brought out by these comparisons are: • Experience of all females (medical and non medical) has improved below age 24 and above age 45, but between ages 25 to 44 experience has deteriorated. • Maximum deterioration for all females occurs at age 34, by 11.9% or at an annual rate of 1.05%. (This could be result of greater willingness to accept female lives, apart from other causes) • Improvements for all females at age 20 and age 50 are 10.8% and 5.9% respectively • Experience of all males (medical and non medical) has improved at ages 20 to 26 and above age 52, but between ages 14 to 19 and 27 to 52 experience has deteriorated. • Deterioration of all males experience is due to deterioration of male non medical experience between ages 26 to 55 • Maximum deterioration for male non medical is 22% at age 39. • For male non medical there is an improvement of 6.5% at age 20 but at age 50 the deterioration is 9.5%
Comparison of experience with LIC (94‐96) rates
0.000
0.001
0.002
0.003
0.004
0.005
0.006
0.007
0.008
0.009
0.010
0.011
0.012
0.013
0.014
0.015
0.016
0.017
0.018
0.019
0.020
0.021
0.022
0.023
0.024
0.025
2 4 6 8 10 12 14 16 18 20 22 24 26 28 30 32 34 36 38 40 42 44 46 48 50 52 54 56 58 60 62 64 66 68 70
qx values
Age
Male Medical mortality rates duration 2 or more
Graduated 2006‐08 Male medical 2+
LIC‐1994‐96
Comparison of experience with LIC (94‐96) rates
0%1%2%3%4%5%6%7%8%9%10%11%12%13%14%15%16%17%18%19%20%21%22%23%24%25%26%27%28%
11 13 15 17 19 21 23 25 27 29 31 33 35 37 39 41 43 45 47 49 51 53 55 57 59 61 63 65 67 69
Percentage
Age
Male medical ultimate mortality Percent improvement
2006‐08 over LIC 1994‐96 Percent improvement‐medical
Comparison of experience with LIC (94‐96) rates
‐15%
‐10%
‐5%
0%
5%
10%
15%
20%
25%
14 16 18 20 22 24 26 28 30 32 34 36 38 40 42 44 46 48 50 52 54 56 58 60 62 64 66 68
Percentage
Age
All female ultimate mortality Percent improvement
2006‐08 over notional LIC 1994‐96
Comparison of experience with LIC (94‐96) rates
‐30%
‐20%
‐10%
0%
10%
20%
30%
20 22 24 26 28 30 32 34 36 38 40 42 44 46 48 50 52 54 56 58 60 62 64 66 68 70
Age
Male Non‐medical ultimate mortality Percent improvement
2006‐08 over LIC 1994‐96

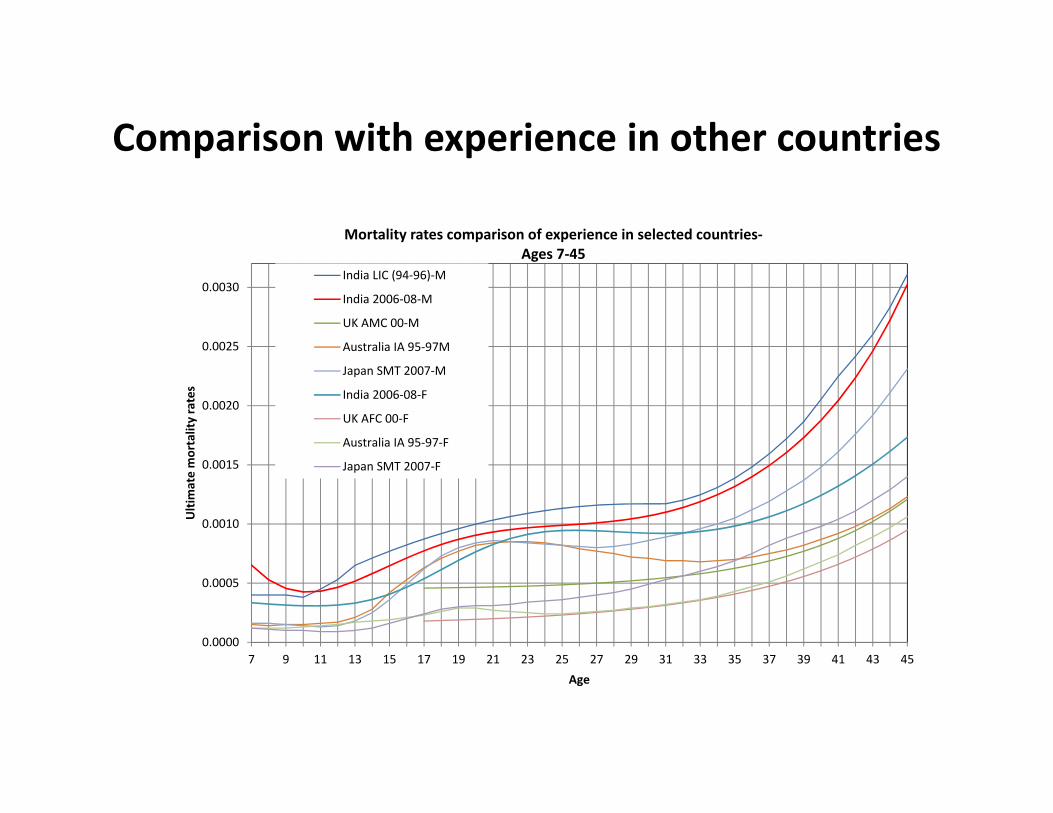
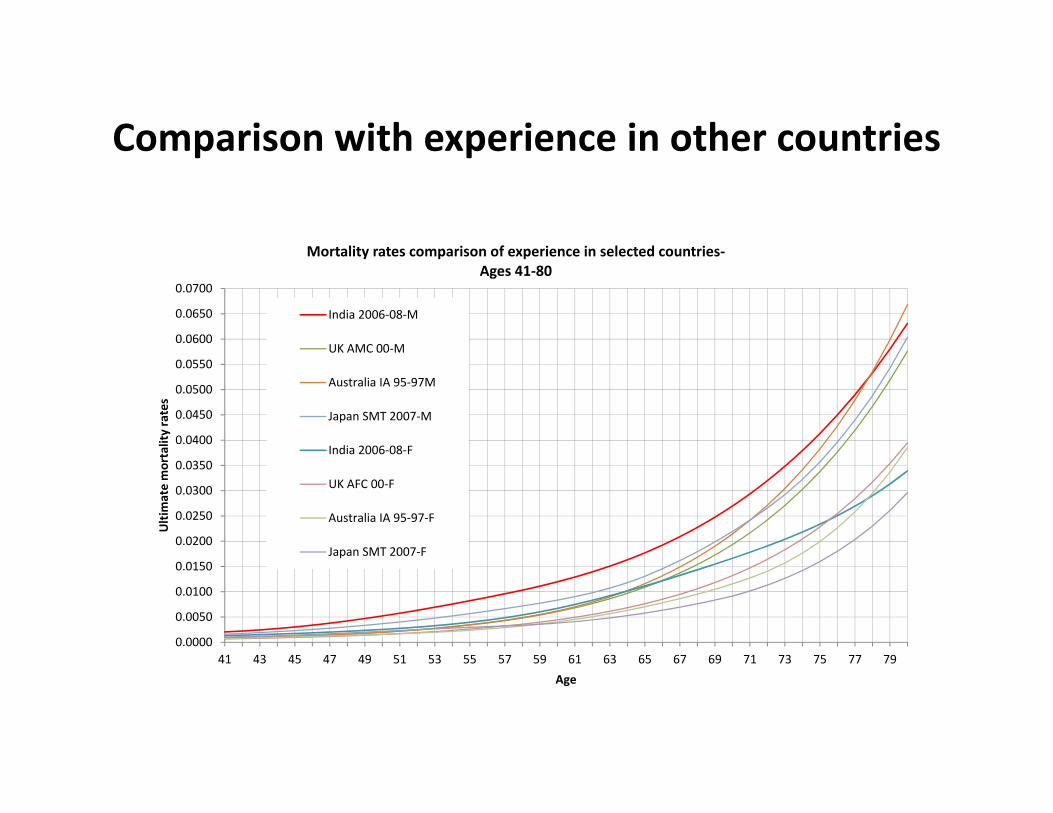
Comparison with experience in other countries
Comparisons difficult due to‐ ‐differences in products, medical examination standards, period of investigation, lives basis rather than policies basis, etc. Countries included‐ UK, Japan, Australia, Males ‐Shapes of the curves of the mortality rates are broadly similar, particularly from around age 35. ‐ Differences in levels of rates and differences in the progression of the rates above age 30 are significant ‐spread and height of the accident hump at young ages between 12 to 30 also differ significantly ‐ Indian mortality rates are the highest at all ages ‐ Differences between Indian and Japanese experience seem lowest Accident hump at young ages appear high for Japanese males and Australian males Females ‐Differences in the levels of the rates are less than in the case of males’ experience. ‐In the experience for Japan Females, there is a modest hump at older ages of around 50
Comparison with experience in other countries
0.0000
0.0005
0.0010
0.0015
0.0020
0.0025
0.0030
7 9 11 13 15 17 19 21 23 25 27 29 31 33 35 37 39 41 43 45
Ultimate mortality rates
Age
Mortality rates comparison of experience in selected countries‐ Ages 7‐45
India LIC (94‐96)‐M
India 2006‐08‐M
UK AMC 00‐M
Australia IA 95‐97M
Japan SMT 2007‐M
India 2006‐08‐F
UK AFC 00‐F
Australia IA 95‐97‐F
Japan SMT 2007‐F
Comparison with experience in other countries
0.0000
0.0050
0.0100
0.0150
0.0200
0.0250
0.0300
0.0350
0.0400
0.0450
0.0500
0.0550
0.0600
0.0650
0.0700
41 43 45 47 49 51 53 55 57 59 61 63 65 67 69 71 73 75 77 79
Ultimate mortality rates
Age
Mortality rates comparison of experience in selected countries‐ Ages 41‐80
India 2006‐08‐M
UK AMC 00‐M
Australia IA 95‐97M
Japan SMT 2007‐M
India 2006‐08‐F
UK AFC 00‐F
Australia IA 95‐97‐F
Japan SMT 2007‐F

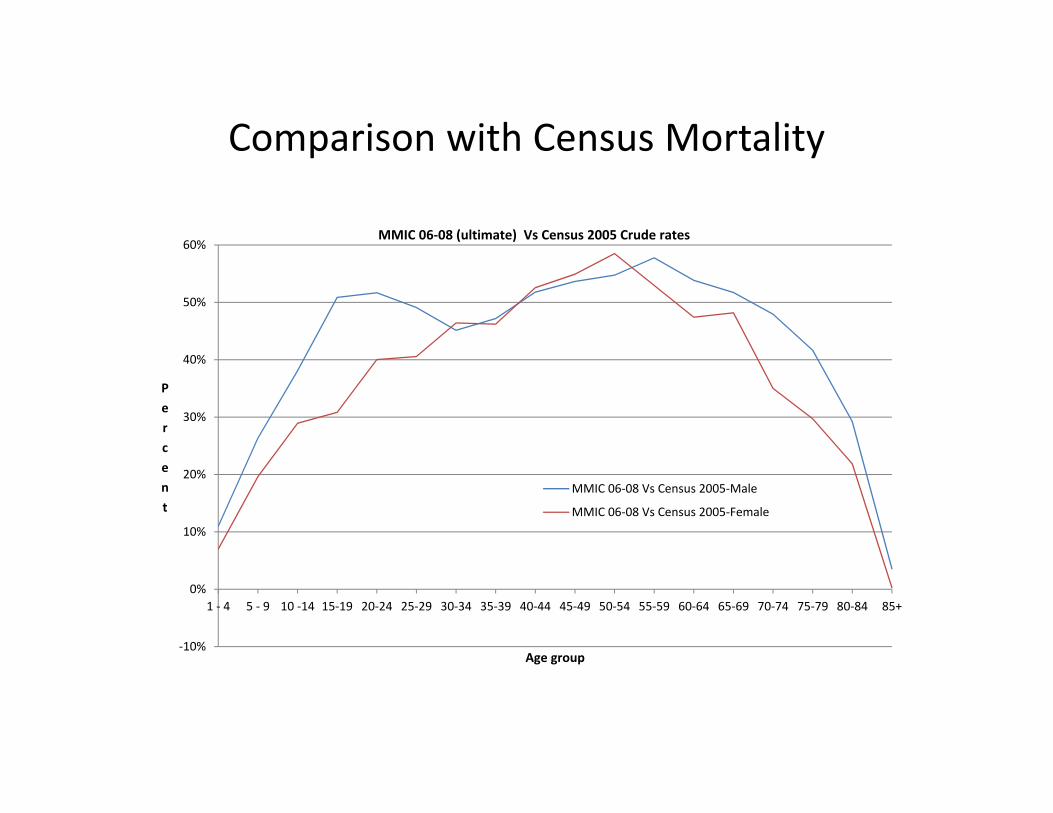
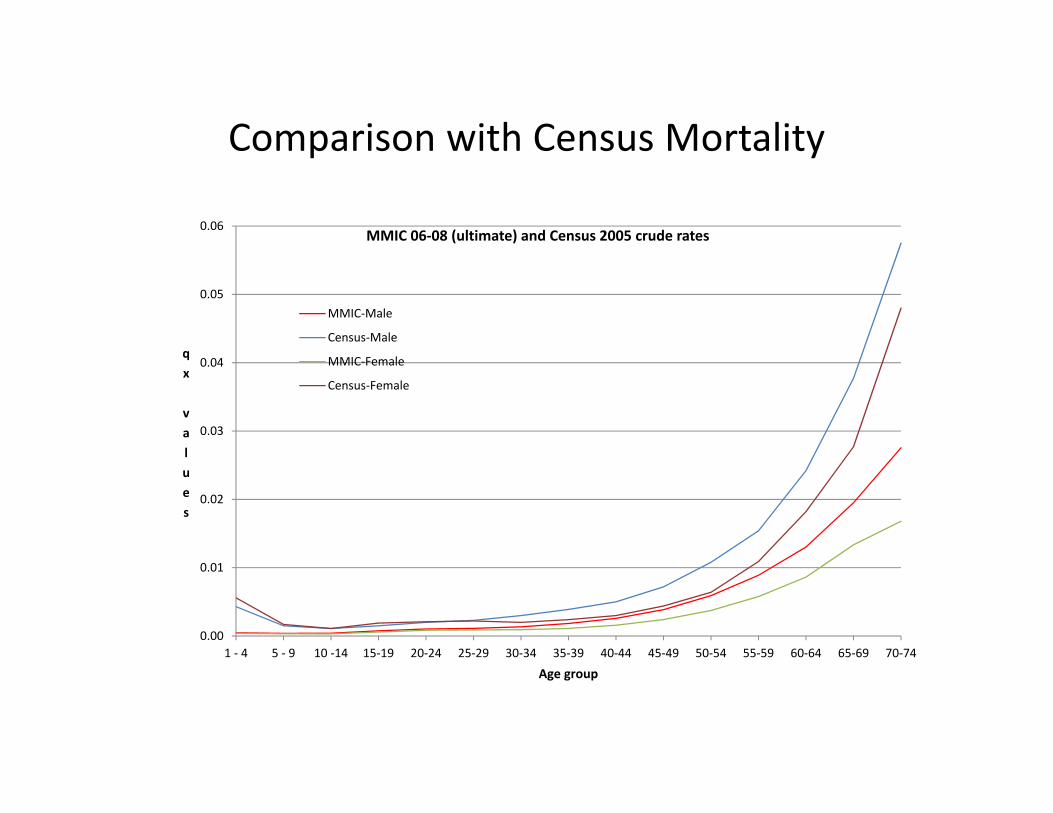
Comparison with Census Mortality
Census 2005 crude rates compared to assured lives rates 2006‐08 • MMIC’s male and female rates are lower than census male and female
rates at all age groups. • There is a hump in the age groups 10‐14 to 30‐34 in census male and
female rates. • Ratio of assured lives mortality to census mortality for female rates are
worse than corresponding ratios for male rates in the age group 30‐34 to 50‐54.
Comparison with Census Mortality
‐10%
0%
10%
20%
30%
40%
50%
60%
1 ‐ 4 5 ‐ 9 10 ‐14 15‐19 20‐24 25‐29 30‐34 35‐39 40‐44 45‐49 50‐54 55‐59 60‐64 65‐69 70‐74 75‐79 80‐84 85+
Percent
Age group
MMIC 06‐08 (ultimate) Vs Census 2005 Crude rates
MMIC 06‐08 Vs Census 2005‐Male
MMIC 06‐08 Vs Census 2005‐Female
Comparison with Census Mortality
0.00
0.01
0.02
0.03
0.04
0.05
0.06
1 ‐ 4 5 ‐ 9 10 ‐14 15‐19 20‐24 25‐29 30‐34 35‐39 40‐44 45‐49 50‐54 55‐59 60‐64 65‐69 70‐74
qx values
Age group
MMIC 06‐08 (ultimate) and Census 2005 crude rates
MMIC‐Male
Census‐Male
MMIC‐Female
Census‐Female

Comparison with Census Mortality
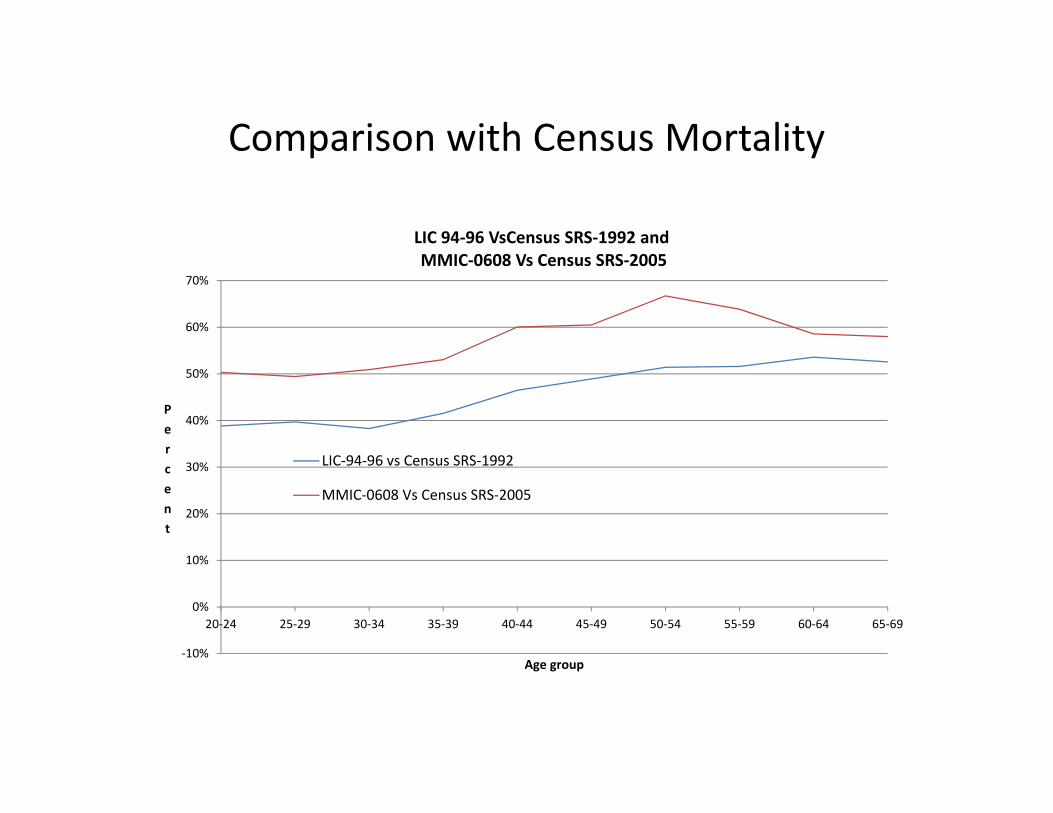
Comparison of LIC 1994‐96 rates with Census SRS1992 rates and MMIC 2006‐08 rates with Census SRS2005 rates:
• Recent experience is moving towards census rates, implying greater proportion of the lower social classes being covered under insurance.
• Comparative ratio between MMIC rates and Census 2005 rates are higher than comparative ratio between LIC 1994‐96 rates and Census 1992 rates.
• Difference between the two ratios is almost stable at all age groups except at age groups 60‐64 to 65 ‐69.
Comparison with Census Mortality
‐10%
0%
10%
20%
30%
40%
50%
60%
70%
20‐24 25‐29 30‐34 35‐39 40‐44 45‐49 50‐54 55‐59 60‐64 65‐69
Percent
Age group
LIC 94‐96 VsCensus SRS‐1992 and MMIC‐0608 Vs Census SRS‐2005
LIC‐94‐96 vs Census SRS‐1992
MMIC‐0608 Vs Census SRS‐2005

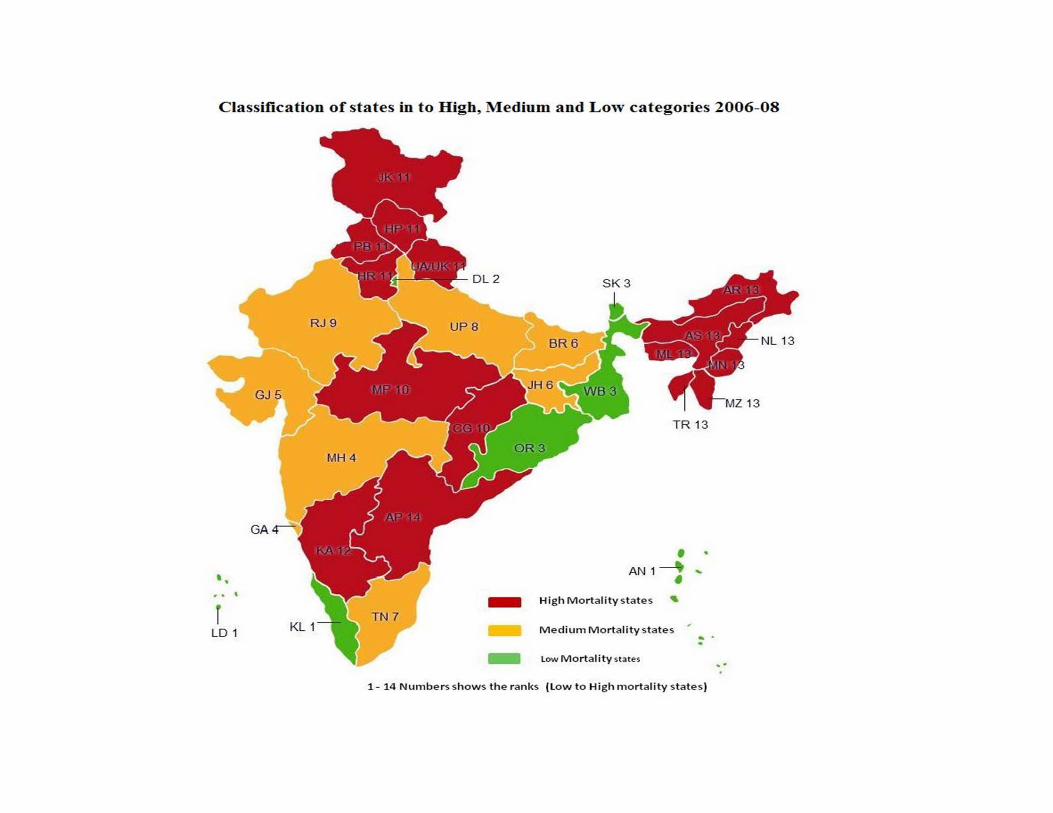
Classification of states in to High, Medium and Low
Ranks (in ascending order of level of crude mortality) used are shown in brackets: • High:
– Group (i) Andhra Pradesh(14), – Group (viii) Arunachal Pradesh, Assam, Manipur, Meghalaya, Mizoram, Nagaland, Tripura (13) – Group (iii) Karnataka (12) – Group (xi) Haryana, Himachal Pradesh, Jammu& Kashmir, Punjab, Uttarakhand, Chandigarh
(11) – Group (x) Madhya Pradesh, Chattisgarh (10)
• Medium: – Group (xiii) Rajasthan (9) – Group (vi) Uttar Pradesh (8) – Group (v) Tamil Nadu, Pondicherry (7) – Group (ix) Bihar, Jharkhand (6) – Group (ii) Gujarat (5) – Group (iv) Maharashtra, Goa, Dadra and Nagar Haveli, Daman&Diu (4)
• Low: – Group (vii) Orissa, West Bengal, Sikkim (3) – Group (xiv) Delhi (2) – Group (xii) Kerala, Andaman & Nicobar, Lakshadweep (1)

Ranks of 14 states in descending order of life expectancy up to age 60‐ five categories.

Cause of deaths analysis Groups of causes adopted are:
• Accidents: only accidents • Heart related causes: Hypertension, Ischemic heart diseases, cerebrovascular
disorders and respiratory disorders • Nervous and kidney related causes: nervous disorders, disseminated sclerosis,
intestinal disorders, epilepsy, diabetes mellitus, urinary disorders and tumours • Other causes: other causes Findings are: • Substantial number of records under other causes‐ reflecting poor data quality • Accidents represent around 15% to 19% of the deaths at childhood ages and peak
to around 27% at age around 20, with a hump between ages 16 to 27. There is a gradual fall in the proportions to 6% by around age 50 and to 2% by ages 70‐74.
• Heart and related diseases become prominent from around age 49 and are a major cause from around ages 55 onwards.
• Deaths due to nervous disorders and kidney related impairments are less important causes but show an increasing rate by age.

Cause of deaths analysis
Accidents (AC)
Hypertension and related causes (HT+IH+CV+RS)
Other Causes (OC)
0.0000
0.0002
0.0004
0.0006
0.0008
0.0010
0.0012
0.0014
0.0016
0.0018
0.0020
0.0022
0.0024
0.0026
0.0028
0.0030
0.0032
0.0034
1 3 5 7 9 11 13 15 17 19 21 23 25 27 29 31 33 35 37 39 41 43 45 47 49 51 53 55 57 59 61 63 65 67 69 71 73
qx values
Age
Cause of death wise rates crude rates 2006‐08
Other Causes (OC)
Nervous and Kidney disorders(NV+DS+IN+EP+DM+UR+TM)
Hypertension and related causes(HT+IH+CV+RS)
Accidents (AC)
Total deaths 807,513

Cause of deaths analysis‐ accident rates by duration
Age group 15 to 35 • There are differences in the levels of the accident death rates at
different durations in the age group 15 to 35. • Rates at duration 0 seem to be slightly higher than rates at
duration1 at some ages. • Shape of the crude rates seems broadly similar for all durations,
although the hump for duration 3, + seems steeper than for other durations.
Age group 36 to 55 • Rates at duration 0 are slightly more or slightly less than rates at
duration 1. • Rates for durations 2 and over experience higher rates at all ages. • Shape of the crude rates seems broadly similar for all durations,
with a gradual increase with age.

Cause of deaths analysis‐ accident rates
0.00000
0.00005
0.00010
0.00015
0.00020
0.00025
0.00030
0.00035
15 16 17 18 19 20 21 22 23 24 25 26 27 28 29 30 31 32 33 34 35
qx Values
Age
Duration wise Accident deaths Crude mortality rates
q[x]
q[x‐1]+1
q[x‐2]+2
qx (Ult: 3, +)

Cause of deaths analysis‐ accident rates
0.00010
0.00015
0.00020
0.00025
0.00030
0.00035
0.00040
0.00045
41 42 43 44 45 46 47 48 49 50 51 52 53 54 55
qx Values
Age
Duration wise Accident deaths Crude mortality rates
q[x]
q[x‐1]+1
qx (Ult: 2, +)

Cause of deaths analysis‐ graduated accident death rates by duration
0.00000
0.000020.000040.00006
0.000080.000100.00012
0.000140.000160.00018
0.000200.000220.00024
0.000260.000280.00030
0.000320.000340.000360.00038
0.00040
15 17 19 21 23 25 27 29 31 33 35 37 39 41 43 45 47 49 51 53 55 57 59
qx Values
Age
Duration wise Accident deaths Graduated rates q[x]
q[x‐1]+1qx (Ult: 2, +)

0.3
0.4
0.5
0.6
0.7
0.8
0.9
1
1.1
1.2
1.3
SMR values
Comparison of SMRs Duration wise classification
Select Duration‐0
Select Duration‐1
Ultimate Duration‐ 2,+

0.3
0.4
0.5
0.6
0.7
0.8
0.9
1
1.1
1.2
1.3
SMR values
Comparison of SMRs Variable wise classification
Male medical
Male non‐medical
Female Medical
Female non‐medical
Permanent plans
Term assurance
Individual agent
Banc assurance
Distribution channel‐OthersSA ‐ Less than 2 lakh
SA‐ 2 to 5 lakh
SA ‐ 5 to 10 lakh
SA ‐ more than 10lakhHigh mortality states
Medium mortalitystatesLow mortality states

Male medical duration 2 or more
0.000
0.003
0.006
0.009
0.012
0.015
0.018
0.021
0.024
0.027
2 4 6 8 10 12 14 16 18 20 22 24 26 28 30 32 34 36 38 40 42 44 46 48 50 52 54 56 58 60 62 64 66 68 70
qx Values
Age
Graduated part1
Hump 1
Graduated part3
Hump 2
Sum of 4 Components

High mortality states duration 2 or more
0.000
0.003
0.006
0.009
0.012
0.015
0.018
0.021
0.024
0.027
2 4 6 8 10 12 14 16 18 20 22 24 26 28 30 32 34 36 38 40 42 44 46 48 50 52 54 56 58 60 62 64 66 68 70
qx Values
Age
Graduated part1
Hump 1
Graduated part3
Hump 2
Sum of 4 Components

Further comments Facilitators: • Use of separate tables for male and females • Further subdivide by medical and non medical • Consider use of select rates, especially for ULIPs (using
ultimate 3,+ ?) • Based on business mix and focus, weight rates by State
classifications • Review underwriting policy Constrictions: • Adverse experience in non medical

Further comments
ULIPs data: ‐ Expected shortly ‐ May be about 15% of total in force ‐ Even if experience lower by, say 30%, overall rates may reduce
by only 4.5% ‐ Better have separate tables for ULIPs ‐ Rate differentials by risk factors an important tool

Further steps
• Complete process for ULIP data submissions • Plan for next period investigation of all plans including data formats
and investigation by lives rather than policies to reduce effect of heterogeneity) Traditional Assurance plans ULIPs Annuities Group business Critical illness benefits
• Align/ reconcile methods of individual companies with MMIC methods
• Additional investigations and relevant research

THANK YOU ALL

THANK YOU ALL