mobile communication systems -...
TRANSCRIPT
Z. Ghassemlooy
Mobile Communication Systems
Professor Z Ghassemlooy
Faculty of Engineering and
Environment
University of Northumbria
U.K.
http://soe.unn.ac.uk/ocr
Professor Z Ghassemlooy
Faculty of Engineering and
Environment
University of Northumbria
U.K.
http://soe.unn.ac.uk/ocr
Part III- Traffic Engineering
Z. Ghassemlooy
Contents
Problems + Design Considerations
Grade of Services (GOS)
Traffic Intensity
Efficiency Measure
Cellular Transcceiver
Propagation - See Part 4
Modulation - See Part 5
Performance- See Part 6
Z. Ghassemlooy
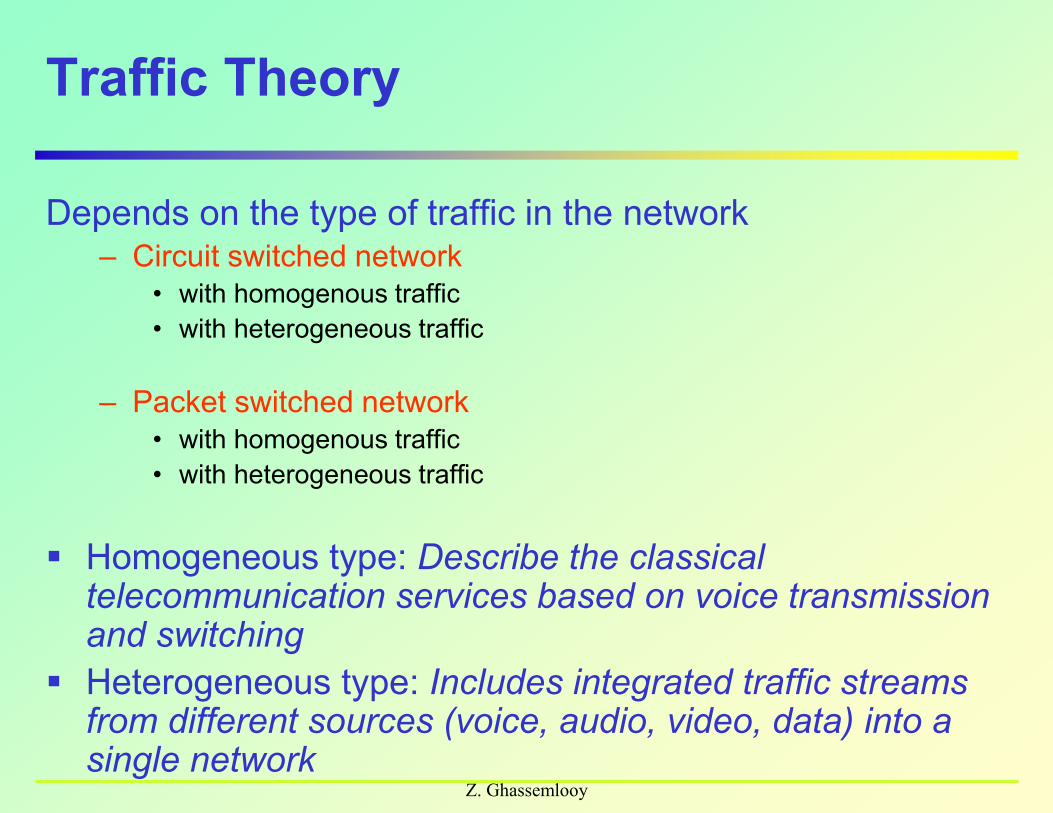
Traffic Theory
Depends on the type of traffic in the network– Circuit switched network
• with homogenous traffic
• with heterogeneous traffic
– Packet switched network
• with homogenous traffic
• with heterogeneous traffic
Homogeneous type: Describe the classical telecommunication services based on voice transmission and switching
Heterogeneous type: Includes integrated traffic streams from different sources (voice, audio, video, data) into a single network
Z. Ghassemlooy
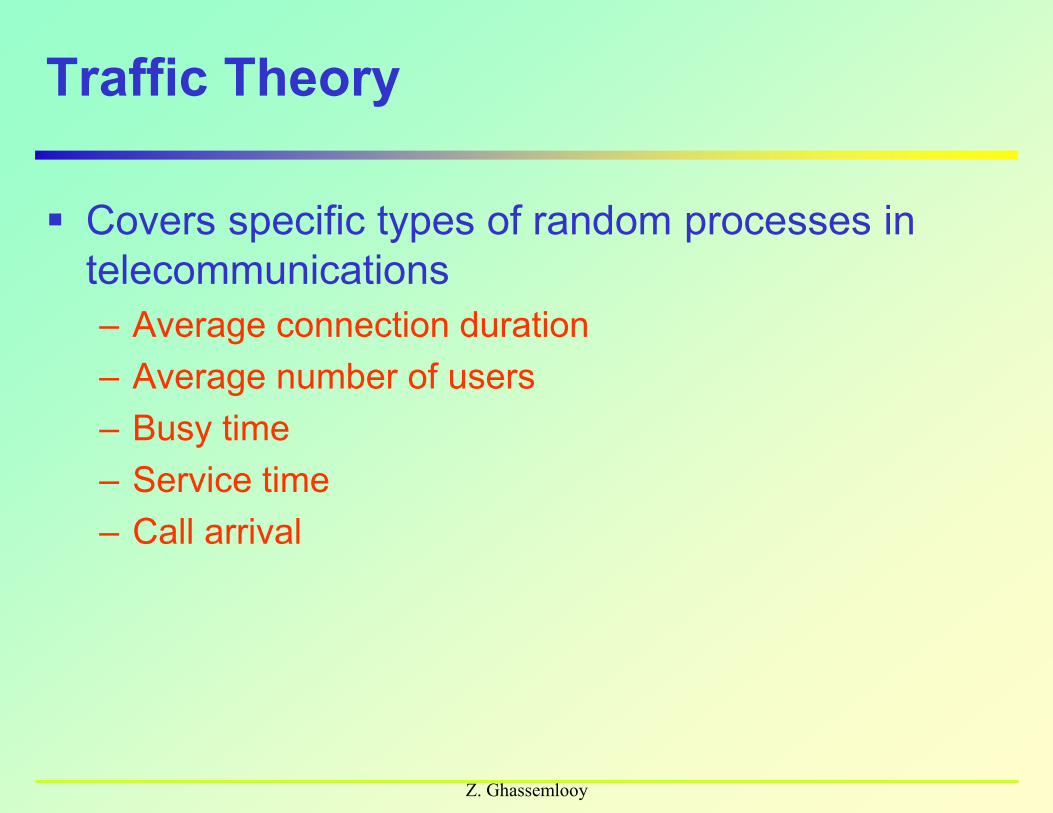
Traffic Theory
Covers specific types of random processes in
telecommunications
– Average connection duration
– Average number of users
– Busy time
– Service time
– Call arrival
Z. Ghassemlooy
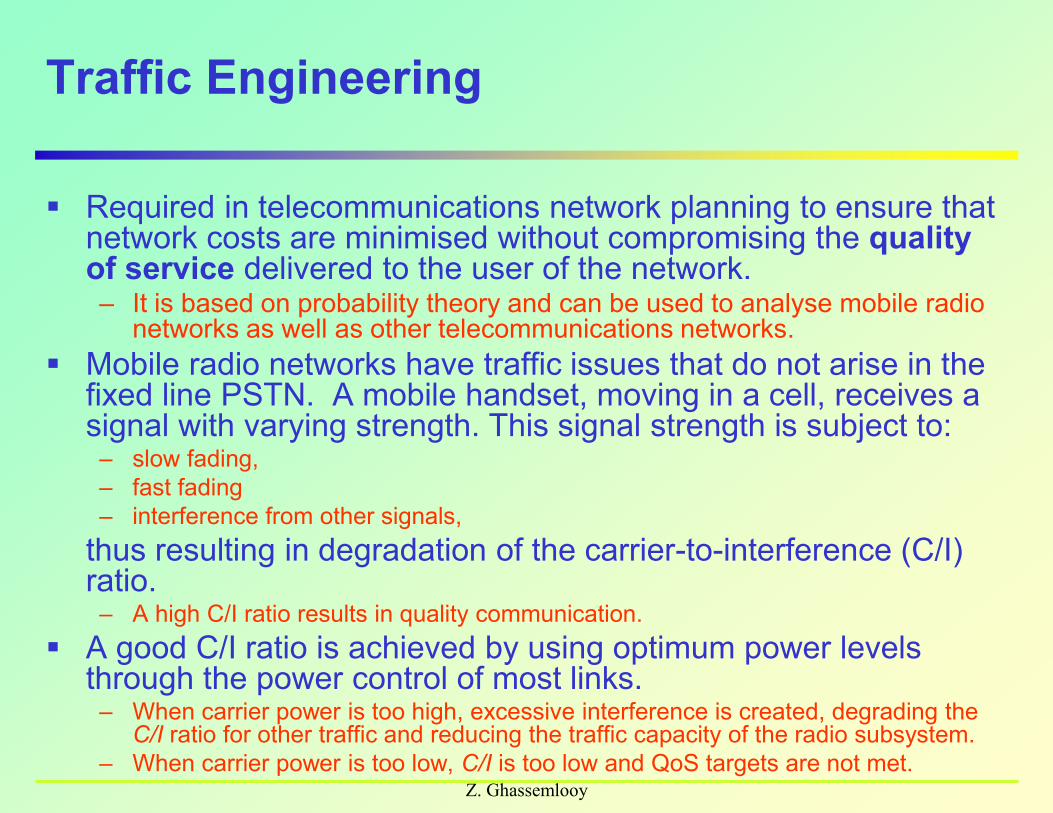
Traffic Engineering
Required in telecommunications network planning to ensure that network costs are minimised without compromising the quality of service delivered to the user of the network.– It is based on probability theory and can be used to analyse mobile radio
networks as well as other telecommunications networks.
Mobile radio networks have traffic issues that do not arise in the fixed line PSTN. A mobile handset, moving in a cell, receives a signal with varying strength. This signal strength is subject to:
– slow fading,
– fast fading
– interference from other signals,
thus resulting in degradation of the carrier-to-interference (C/I) ratio.
– A high C/I ratio results in quality communication.
A good C/I ratio is achieved by using optimum power levels through the power control of most links.
– When carrier power is too high, excessive interference is created, degrading the C/I ratio for other traffic and reducing the traffic capacity of the radio subsystem.
– When carrier power is too low, C/I is too low and QoS targets are not met.
Z. Ghassemlooy
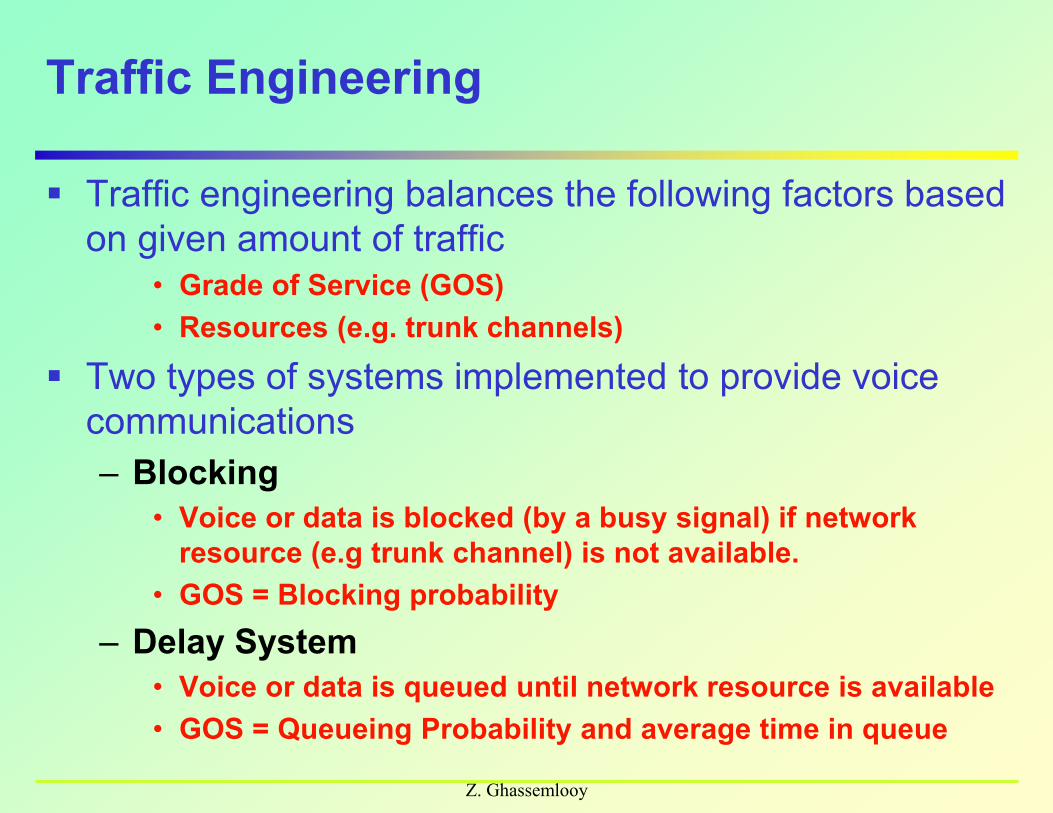
Traffic Engineering
Traffic engineering balances the following factors based
on given amount of traffic
• Grade of Service (GOS)
• Resources (e.g. trunk channels)
Two types of systems implemented to provide voice
communications
– Blocking
• Voice or data is blocked (by a busy signal) if network
resource (e.g trunk channel) is not available.
• GOS = Blocking probability
– Delay System
• Voice or data is queued until network resource is available
• GOS = Queueing Probability and average time in queue
Z. Ghassemlooy
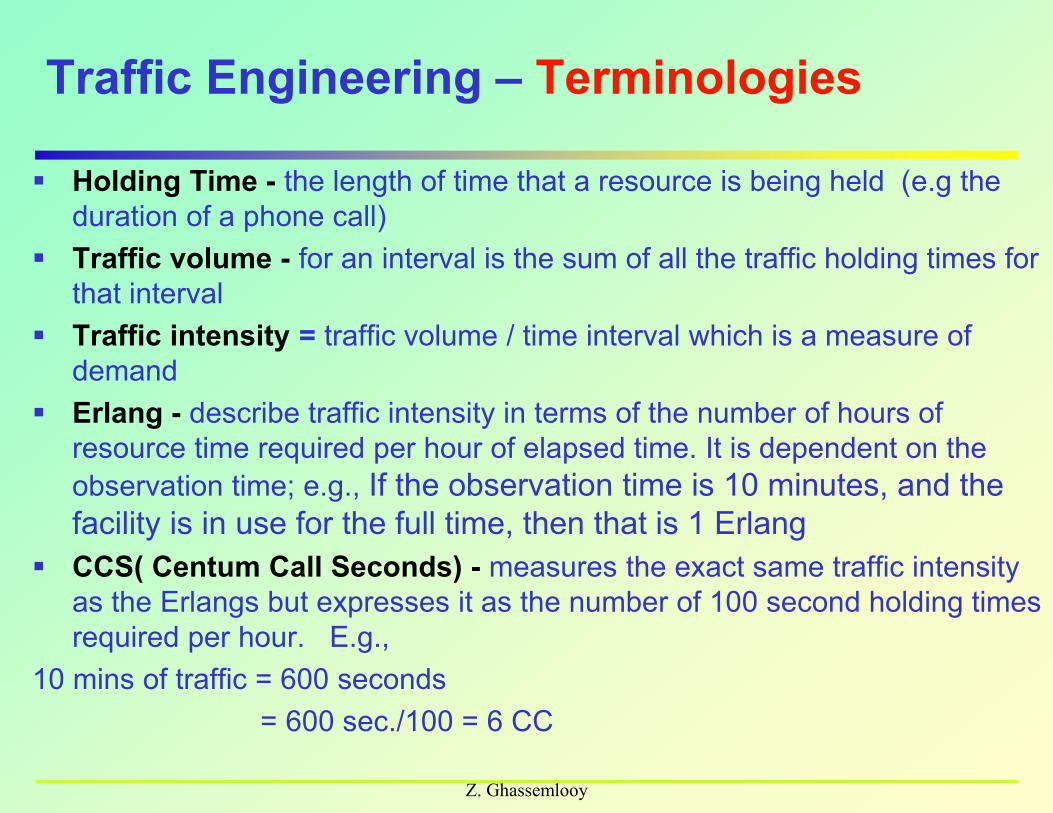
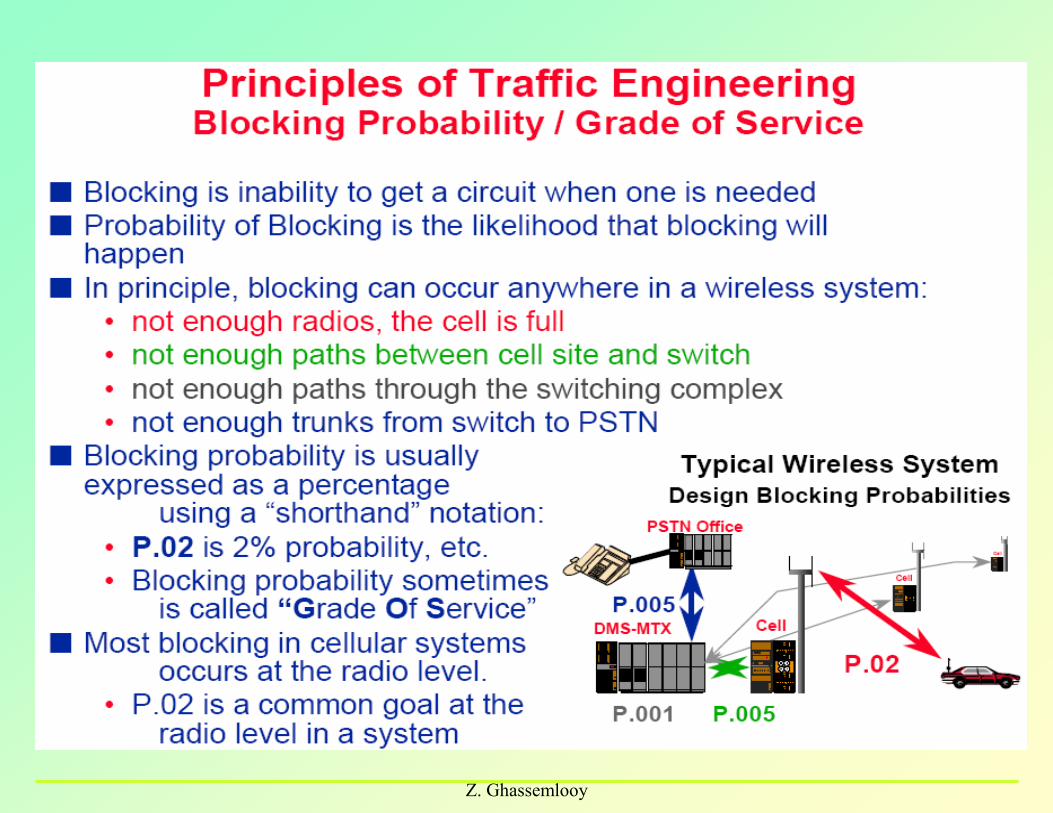
Traffic Engineering – Terminologies
Holding Time - the length of time that a resource is being held (e.g the
duration of a phone call)
Traffic volume - for an interval is the sum of all the traffic holding times for
that interval
Traffic intensity = traffic volume / time interval which is a measure of
demand
Erlang - describe traffic intensity in terms of the number of hours of
resource time required per hour of elapsed time. It is dependent on the
observation time; e.g., If the observation time is 10 minutes, and the
facility is in use for the full time, then that is 1 Erlang
CCS( Centum Call Seconds) - measures the exact same traffic intensity
as the Erlangs but expresses it as the number of 100 second holding times
required per hour. E.g.,
10 mins of traffic = 600 seconds
= 600 sec./100 = 6 CC
Z. Ghassemlooy
Traffic Engineering – Terminologies
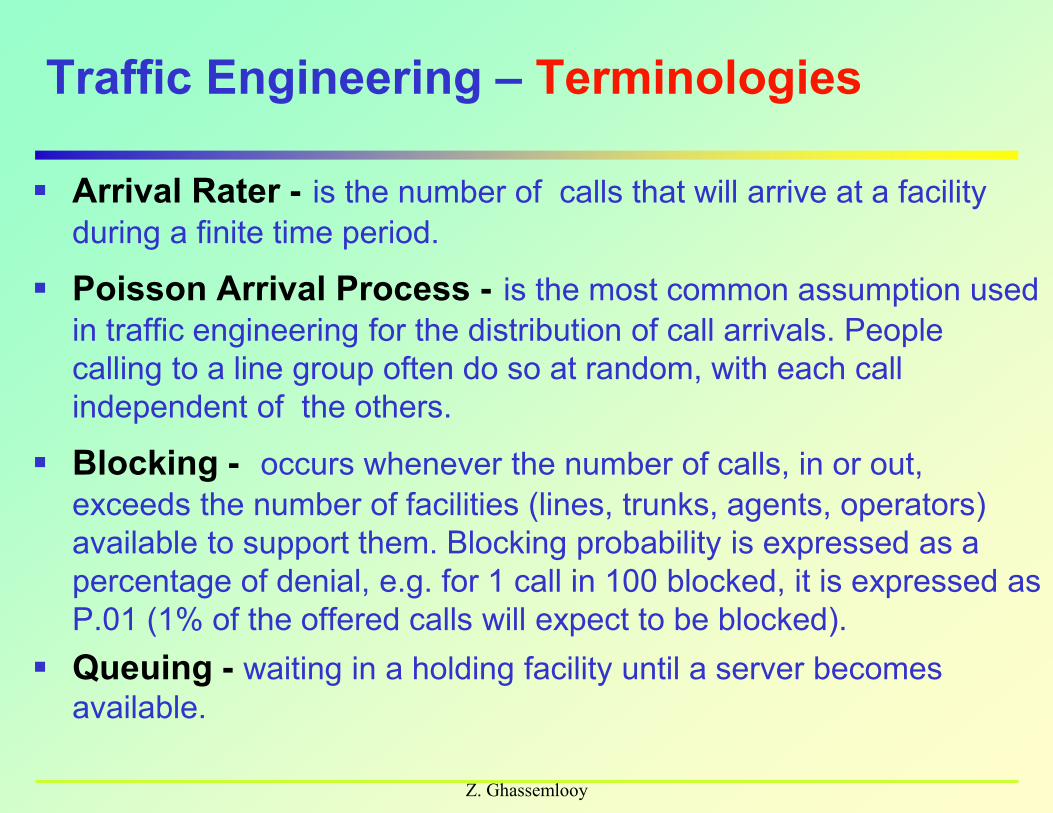
Arrival Rater - is the number of calls that will arrive at a facility
during a finite time period.
Poisson Arrival Process - is the most common assumption used
in traffic engineering for the distribution of call arrivals. People
calling to a line group often do so at random, with each call
independent of the others.
Blocking - occurs whenever the number of calls, in or out,
exceeds the number of facilities (lines, trunks, agents, operators)
available to support them. Blocking probability is expressed as a
percentage of denial, e.g. for 1 call in 100 blocked, it is expressed as
P.01 (1% of the offered calls will expect to be blocked).
Queuing - waiting in a holding facility until a server becomes
available.
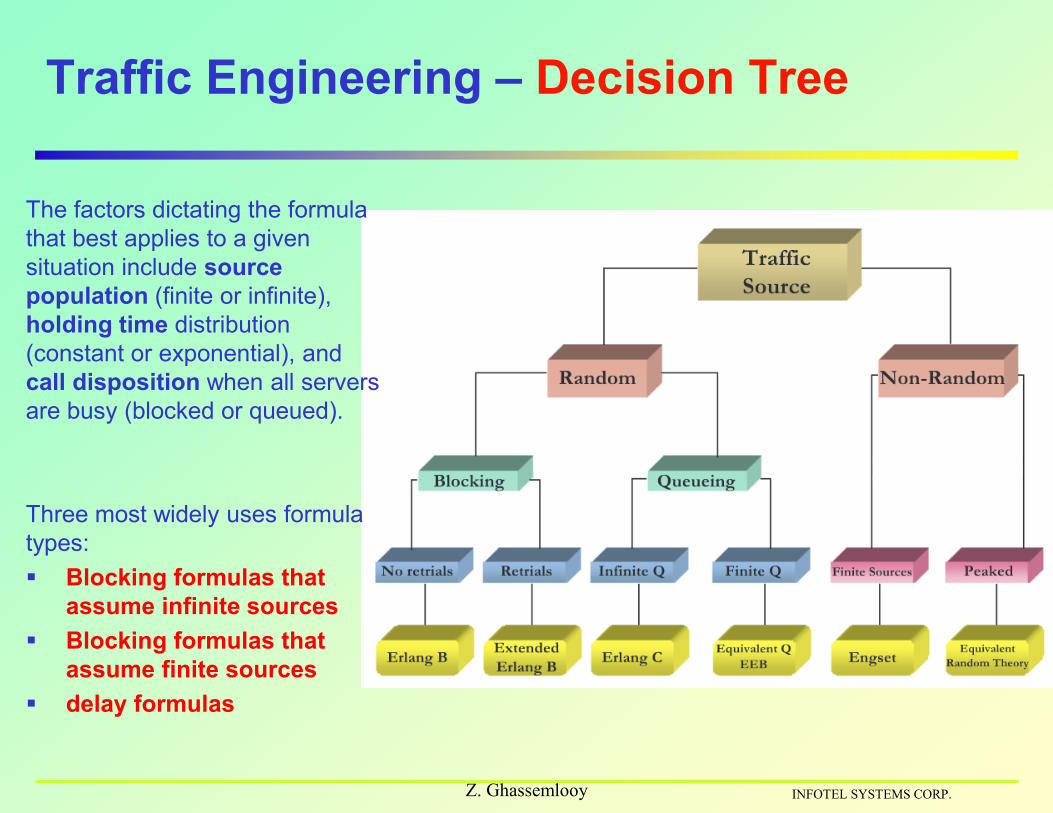
The factors dictating the formula
that best applies to a given
situation include source
population (finite or infinite),
holding time distribution
(constant or exponential), and
call disposition when all servers
are busy (blocked or queued).
Three most widely uses formula
types:
Blocking formulas that
assume infinite sources
Blocking formulas that
assume finite sources
delay formulas
Z. Ghassemlooy
Traffic Engineering – Decision Tree
INFOTEL SYSTEMS CORP.

Z. Ghassemlooy
Traffic Measurement Unites
Erlangs: Traffic intensity (named after of a Danish mathematician) is the
average number of calls simultaneously in progress over a certain time. It is a
dimensionless unit.
one hour of continuous use of one channel = 1
Erlang
• 1 Erlang = 1 hour (60 minutes) of traffic
– In data communications, an 1 E = 64 kbps of data
– In telephone, 1 Erlang = 60 mins = 1 x 3600 call seconds
% of Occupancy
A.K. Erlang, 1878-1929
Z. Ghassemlooy
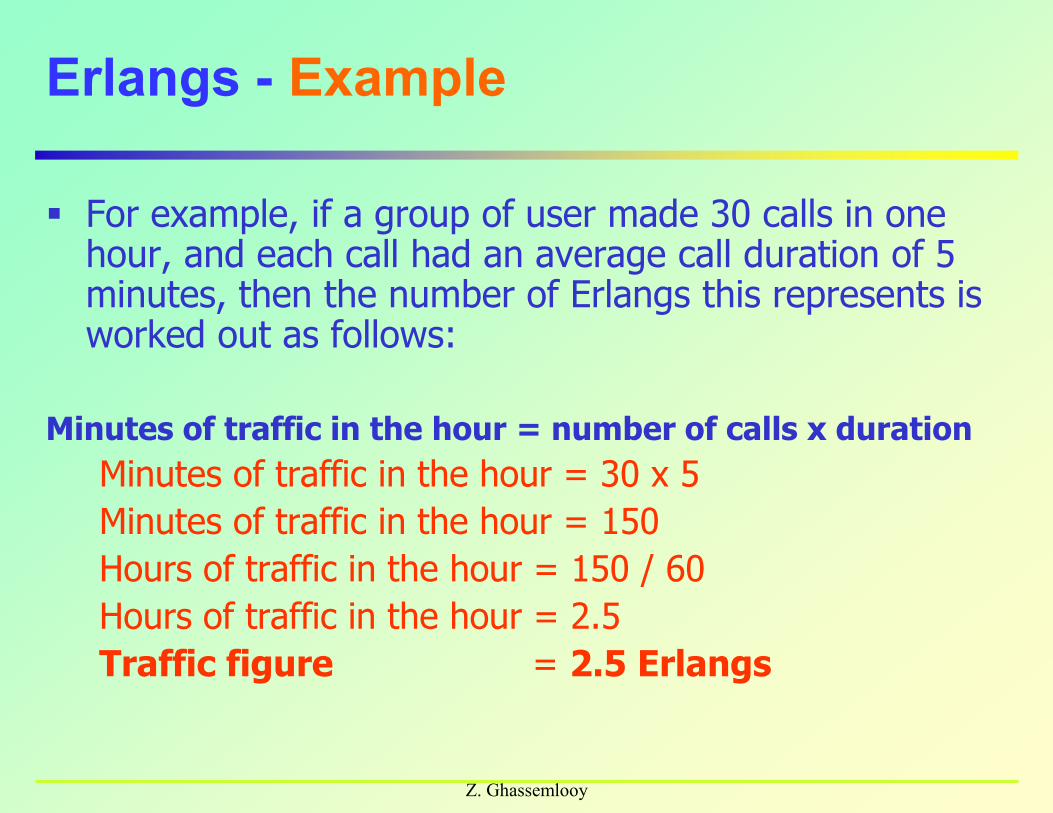
Erlangs - Example
For example, if a group of user made 30 calls in one hour, and each call had an average call duration of 5 minutes, then the number of Erlangs this represents is worked out as follows:
Minutes of traffic in the hour = number of calls x duration
Minutes of traffic in the hour = 30 x 5
Minutes of traffic in the hour = 150
Hours of traffic in the hour = 150 / 60
Hours of traffic in the hour = 2.5
Traffic figure = 2.5 Erlangs
Z. Ghassemlooy
Traffic Capacity
Quality of services provides by different service providers
Traffic congestion and blocking
Probability of waiting before a call is connected
Dominant coverage area
C/I
Dropped call rate
Handover failure rate,
Overall call success rate ...
All these can be explained by the Quality of Service (QOS)
Z. Ghassemlooy
Factors Affecting QoS
The standard metrics of QoS to the user that can be measured
to rate the QoS are:
– Coverage: the strength of the measured signal is used to estimate the
size of the cell.
– accessibility (includes Grade of Service (GOS): is about determining the
ability of the network to handle successful calls from mobile-to-fixed
networks and from mobile-to-mobile networks.
• Connection duration of call is in tens of seconds or minutes
• Packet transmission or serving measured in milliseconds or even
microseconds
• User movement measured in seconds, minutes or hours.
– audio quality: monitoring a successful call for a period of time for the
clarity of the communication channel.
Z. Ghassemlooy
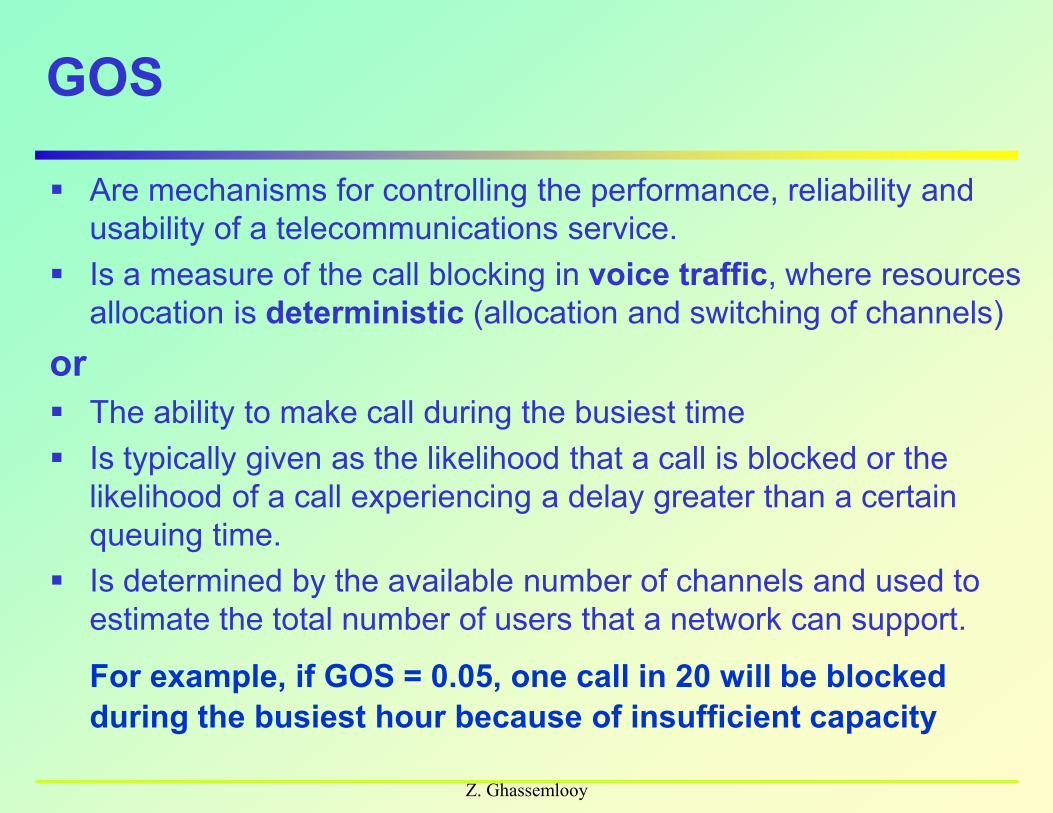
GOS
Are mechanisms for controlling the performance, reliability and
usability of a telecommunications service.
Is a measure of the call blocking in voice traffic, where resources
allocation is deterministic (allocation and switching of channels)
or
The ability to make call during the busiest time
Is typically given as the likelihood that a call is blocked or the
likelihood of a call experiencing a delay greater than a certain
queuing time.
Is determined by the available number of channels and used to
estimate the total number of users that a network can support.
For example, if GOS = 0.05, one call in 20 will be blocked
during the busiest hour because of insufficient capacity
Z. Ghassemlooy
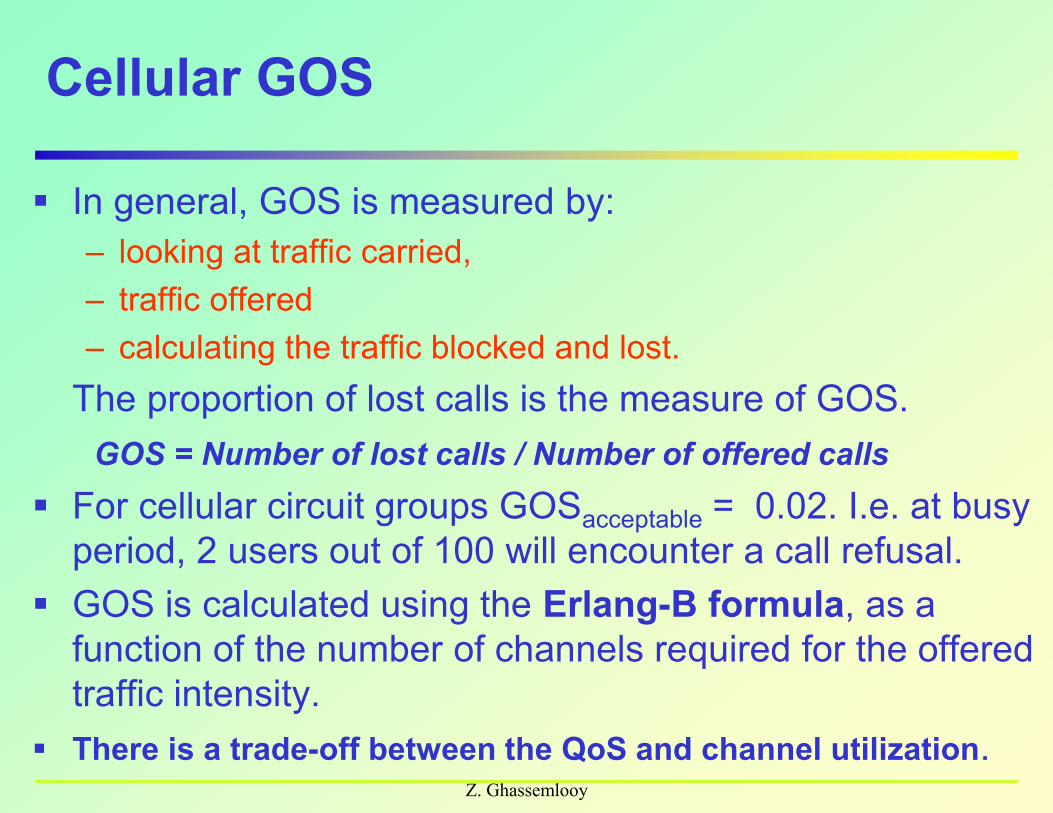
Cellular GOS
In general, GOS is measured by:
– looking at traffic carried,
– traffic offered
– calculating the traffic blocked and lost.
The proportion of lost calls is the measure of GOS.
GOS = Number of lost calls / Number of offered calls
For cellular circuit groups GOSacceptable = 0.02. I.e. at busy
period, 2 users out of 100 will encounter a call refusal.
GOS is calculated using the Erlang-B formula, as a
function of the number of channels required for the offered
traffic intensity.
There is a trade-off between the QoS and channel utilization.
Z. Ghassemlooy
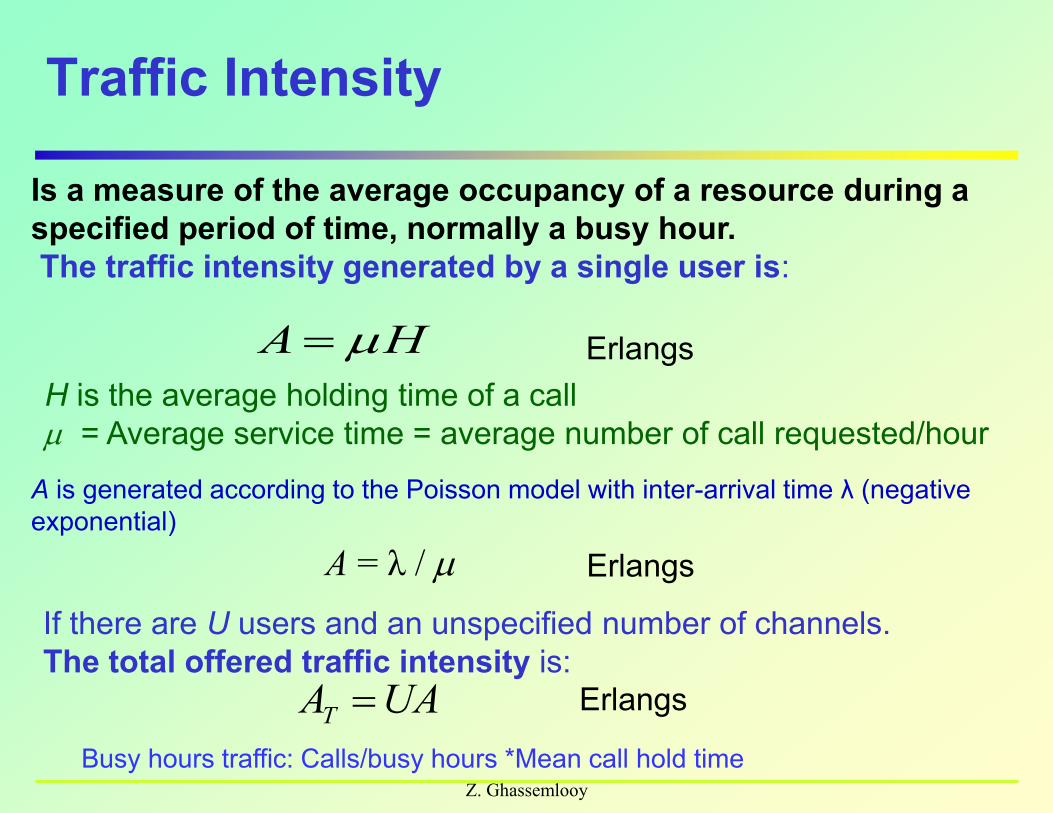
Traffic Intensity
Is a measure of the average occupancy of a resource during a
specified period of time, normally a busy hour.
The traffic intensity generated by a single user is:
ErlangsHA
H is the average holding time of a call
= Average service time = average number of call requested/hour
If there are U users and an unspecified number of channels.
The total offered traffic intensity is:
UAAT Erlangs
Busy hours traffic: Calls/busy hours *Mean call hold time
A is generated according to the Poisson model with inter-arrival time λ (negative
exponential)
ErlangsA = λ /
Z. Ghassemlooy
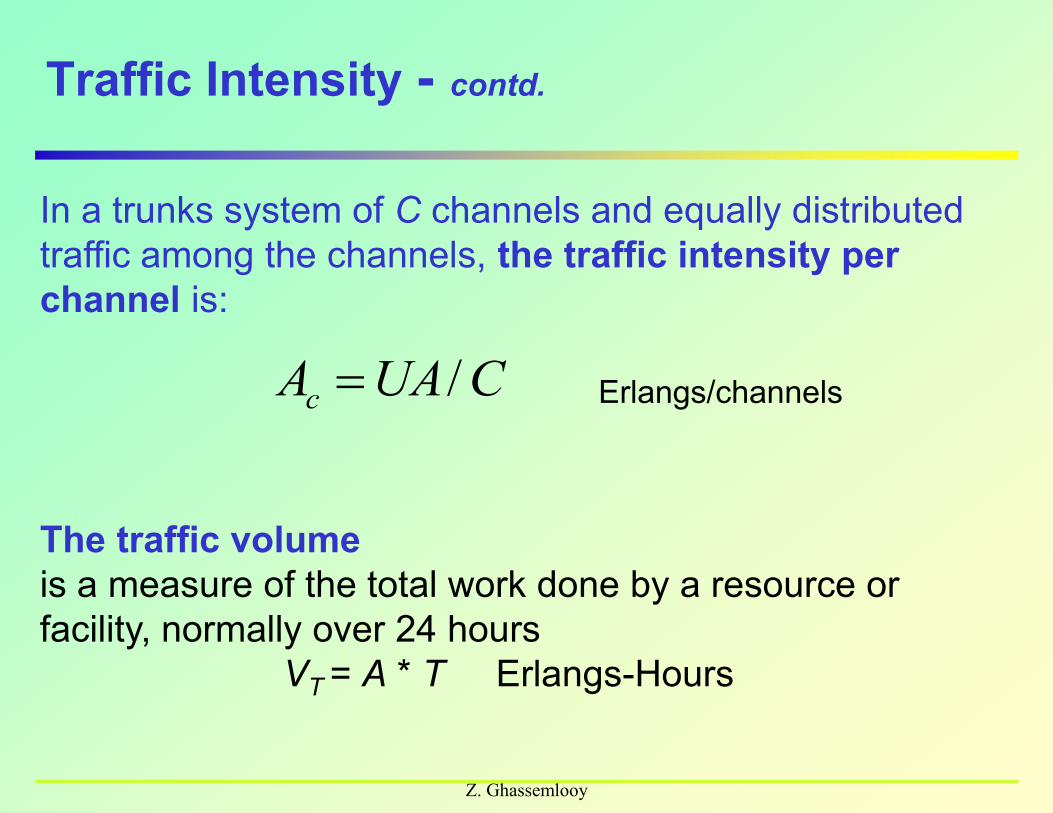
Traffic Intensity - contd.
In a trunks system of C channels and equally distributed
traffic among the channels, the traffic intensity per
channel is:
CUAAc / Erlangs/channels
The traffic volume
is a measure of the total work done by a resource or
facility, normally over 24 hours
VT = A * T Erlangs-Hours

Z. Ghassemlooy
Example I
A call established at 1am between a mobile and MSC. Assuming a
continuous connection and data transfer rate at 30 kbit/s, determine
the traffic intensity if the call is terminated at 1.50am.
Solution:
Traffic intensity = (1 call)*(50 mins)*(1 hour/60 min) = 0.833 Er
Note, traffic intensity has nothing to do with the data rate, only the
holding time is taken into account.
Note:
• If the traffic intensity > 1 Erlang: The incoming call rate exceeds the
outgoing calls, thus resulting in queuing delay which will grow without bound
(if the traffic intensity stays the same).
• If the traffic intensity is < 1 Erlang, then the network can handle more
average traffic.
Z. Ghassemlooy
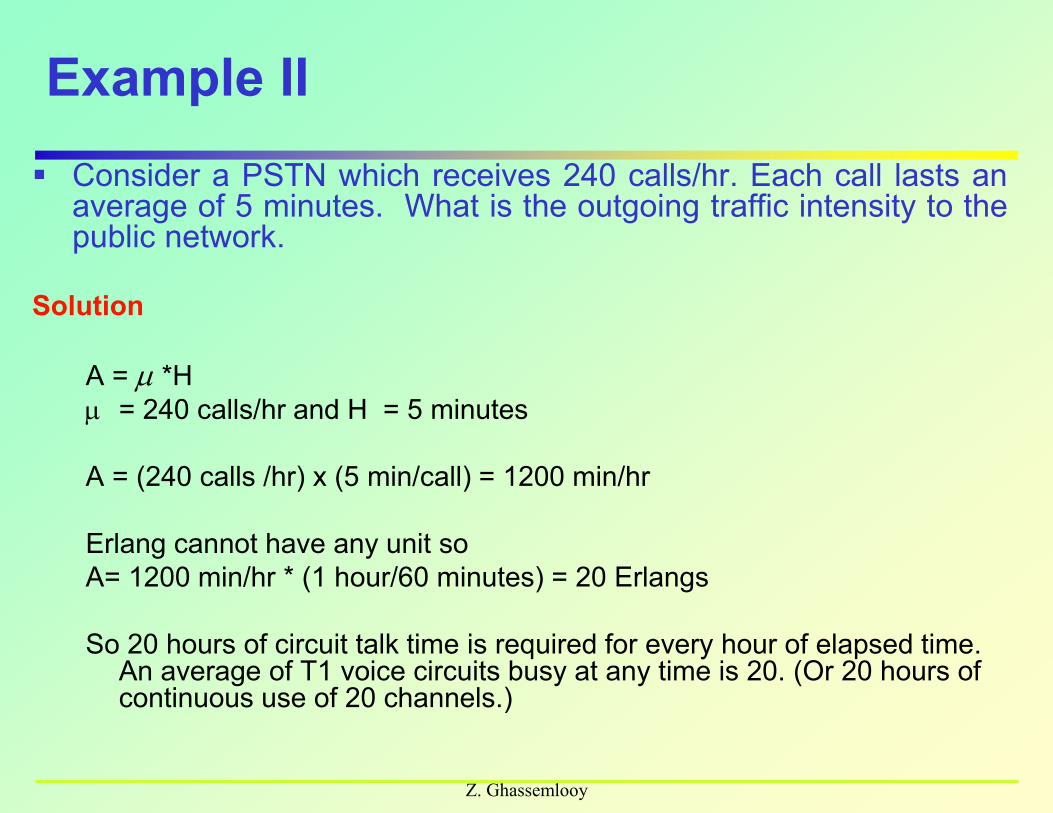
Example II
Consider a PSTN which receives 240 calls/hr. Each call lasts anaverage of 5 minutes. What is the outgoing traffic intensity to thepublic network.
Solution
A = *H
= 240 calls/hr and H = 5 minutes
A = (240 calls /hr) x (5 min/call) = 1200 min/hr
Erlang cannot have any unit so
A= 1200 min/hr * (1 hour/60 minutes) = 20 Erlangs
So 20 hours of circuit talk time is required for every hour of elapsed time. An average of T1 voice circuits busy at any time is 20. (Or 20 hours of continuous use of 20 channels.)
Z. Ghassemlooy
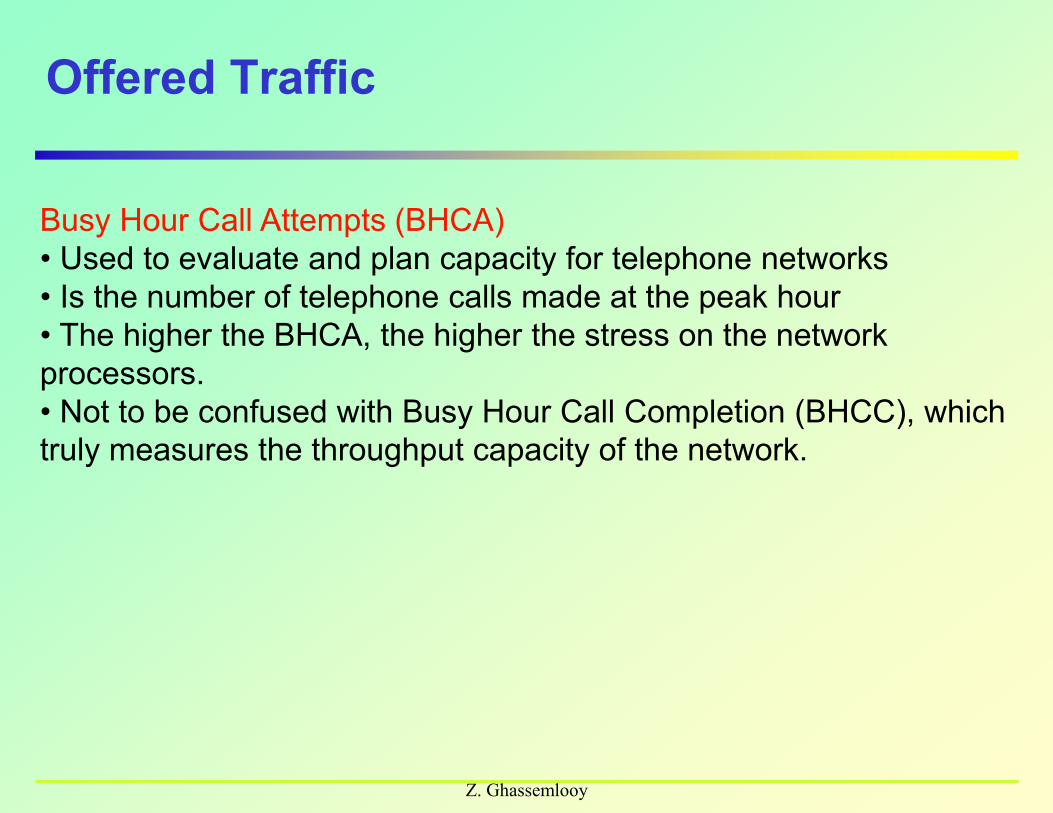
Offered Traffic
Busy Hour Call Attempts (BHCA)
• Used to evaluate and plan capacity for telephone networks
• Is the number of telephone calls made at the peak hour
• The higher the BHCA, the higher the stress on the network
processors.
• Not to be confused with Busy Hour Call Completion (BHCC), which
truly measures the throughput capacity of the network.
Z. Ghassemlooy
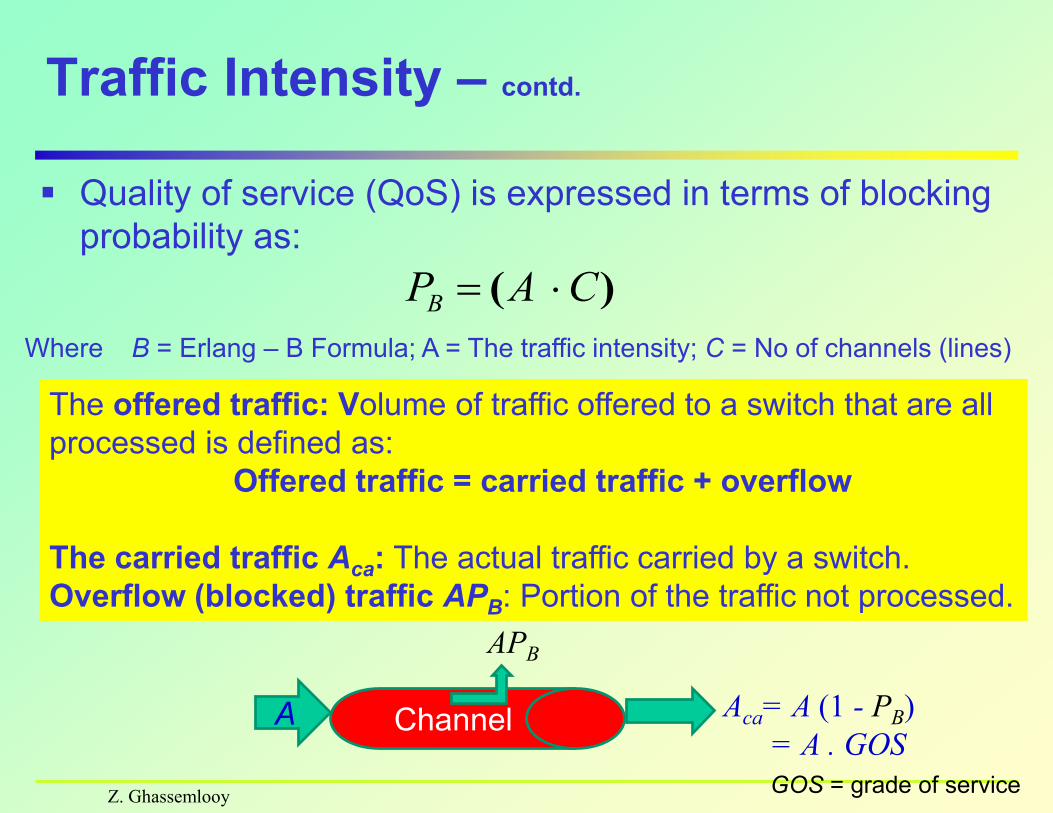
Traffic Intensity – contd.
Quality of service (QoS) is expressed in terms of blocking
probability as:
)( CAPB
Where B = Erlang – B Formula; A = The traffic intensity; C = No of channels (lines)
The offered traffic: Volume of traffic offered to a switch that are all
processed is defined as:
Offered traffic = carried traffic + overflow
The carried traffic Aca: The actual traffic carried by a switch.
Overflow (blocked) traffic APB: Portion of the traffic not processed.
ChannelA
APB
Aca= A (1 - PB)
= A . GOS
GOS = grade of service
Z. Ghassemlooy
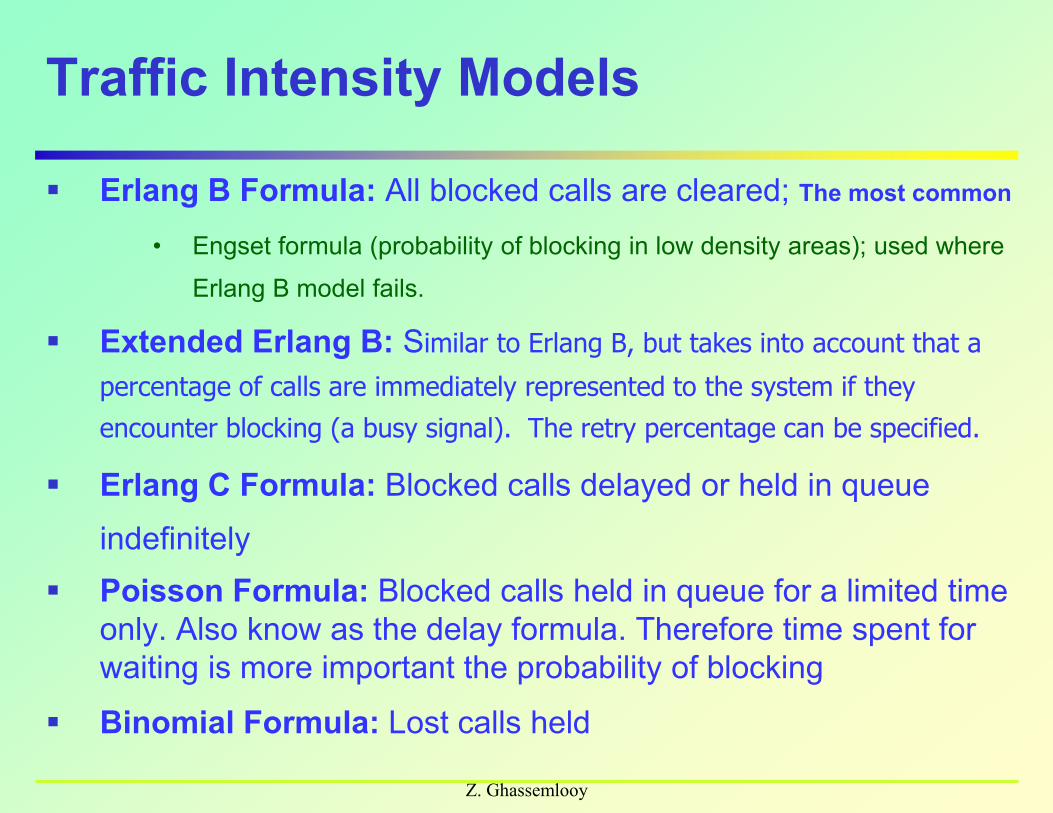
Traffic Intensity Models
Erlang B Formula: All blocked calls are cleared; The most common
• Engset formula (probability of blocking in low density areas); used where
Erlang B model fails.
Extended Erlang B: Similar to Erlang B, but takes into account that a
percentage of calls are immediately represented to the system if they
encounter blocking (a busy signal). The retry percentage can be specified.
Erlang C Formula: Blocked calls delayed or held in queue
indefinitely
Poisson Formula: Blocked calls held in queue for a limited time
only. Also know as the delay formula. Therefore time spent for
waiting is more important the probability of blocking
Binomial Formula: Lost calls held
Z. Ghassemlooy
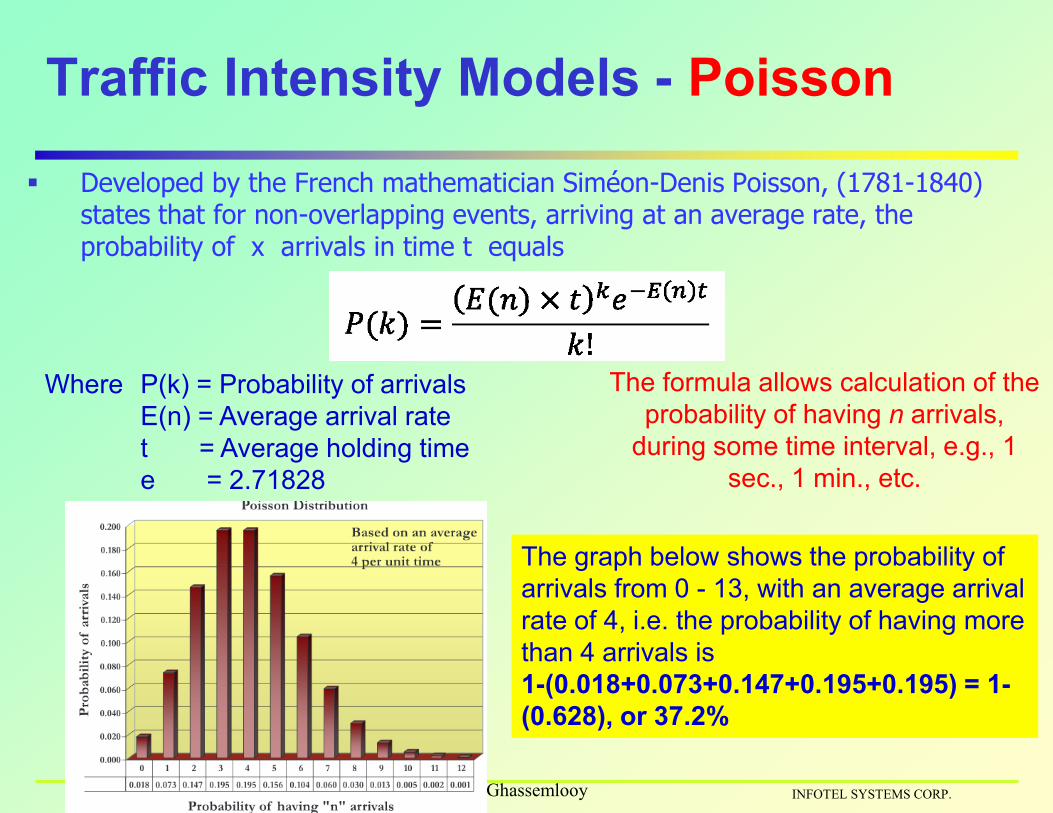
Traffic Intensity Models - Poisson
Developed by the French mathematician Siméon-Denis Poisson, (1781-1840) states that for non-overlapping events, arriving at an average rate, the probability of x arrivals in time t equals
Where P(k) = Probability of arrivals
E(n) = Average arrival rate
t = Average holding time
e = 2.71828
The formula allows calculation of the
probability of having n arrivals,
during some time interval, e.g., 1
sec., 1 min., etc.
INFOTEL SYSTEMS CORP.
The graph below shows the probability of
arrivals from 0 - 13, with an average arrival
rate of 4, i.e. the probability of having more
than 4 arrivals is
1-(0.018+0.073+0.147+0.195+0.195) = 1-
(0.628), or 37.2%

Z. Ghassemlooy
Erlang B Model - Characteristics
Provides the probability of blockage at the switch
due to congestion. Assumptions:
No waiting is allowed (lost calls are cleared) (I.e. they disappear from the
system. This assumption is valid for systems that can overflow blocked calls onto another trunk
(e.g. a high usage trunk)
A number of identical servers process customers in parallel
Limited No. of trunk (or serving channels)
Memory-less, channel requests at any time
The probability of a user occupying a channel is based on exponential
distribution
Calls arrival rate at the network = Poisson process (the holding time or
duration of the call has exponentially distribution)
Analyze using Markov Process of n(t) – number of customers in the
system at time t
Z. Ghassemlooy
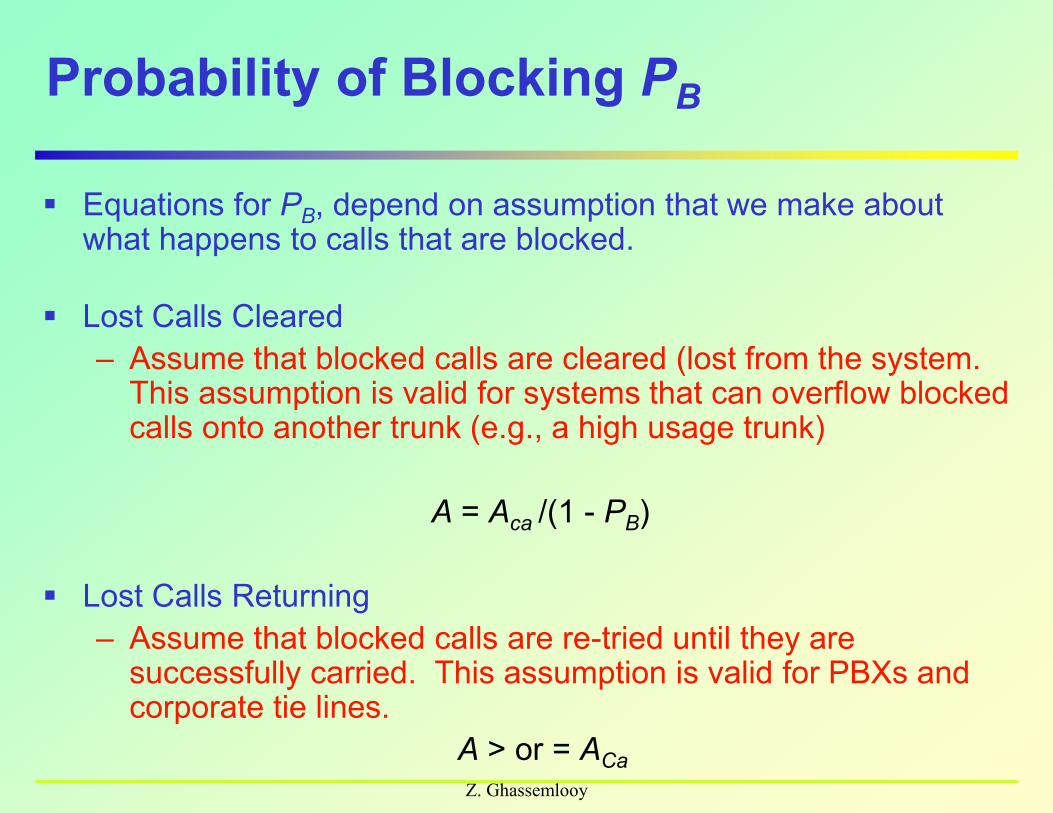
Probability of Blocking PB
Equations for PB, depend on assumption that we make about what happens to calls that are blocked.
Lost Calls Cleared
– Assume that blocked calls are cleared (lost from the system. This assumption is valid for systems that can overflow blocked calls onto another trunk (e.g., a high usage trunk)
A = Aca /(1 - PB)
Lost Calls Returning
– Assume that blocked calls are re-tried until they are successfully carried. This assumption is valid for PBXs and corporate tie lines.
A > or = ACa
Z. Ghassemlooy
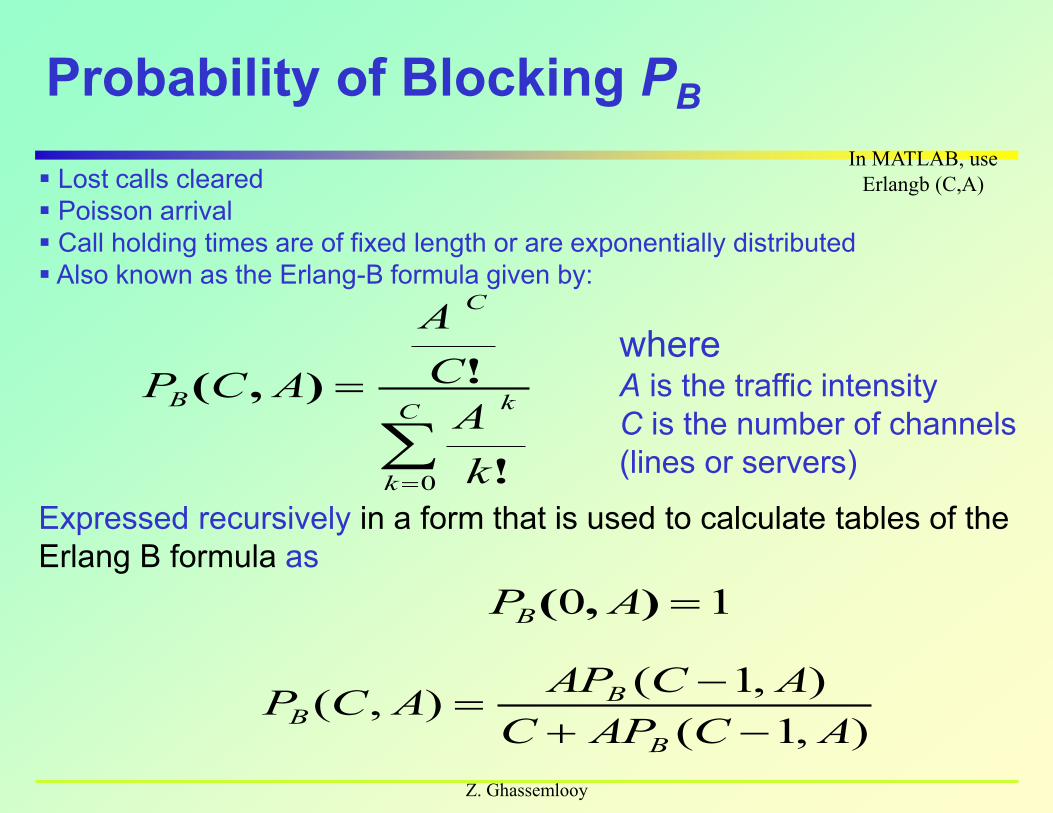
Probability of Blocking PB
Lost calls cleared
Poisson arrival
Call holding times are of fixed length or are exponentially distributed
Also known as the Erlang-B formula given by:
C
k
k
C
B
k
A
C
A
ACP
0 !
!),(where A is the traffic intensity
C is the number of channels
(lines or servers)
Expressed recursively in a form that is used to calculate tables of the
Erlang B formula as
10 ),( APB
),1(
),1(),(
ACAPC
ACAPACP
B
BB
In MATLAB, use
Erlangb (C,A)
Z. Ghassemlooy
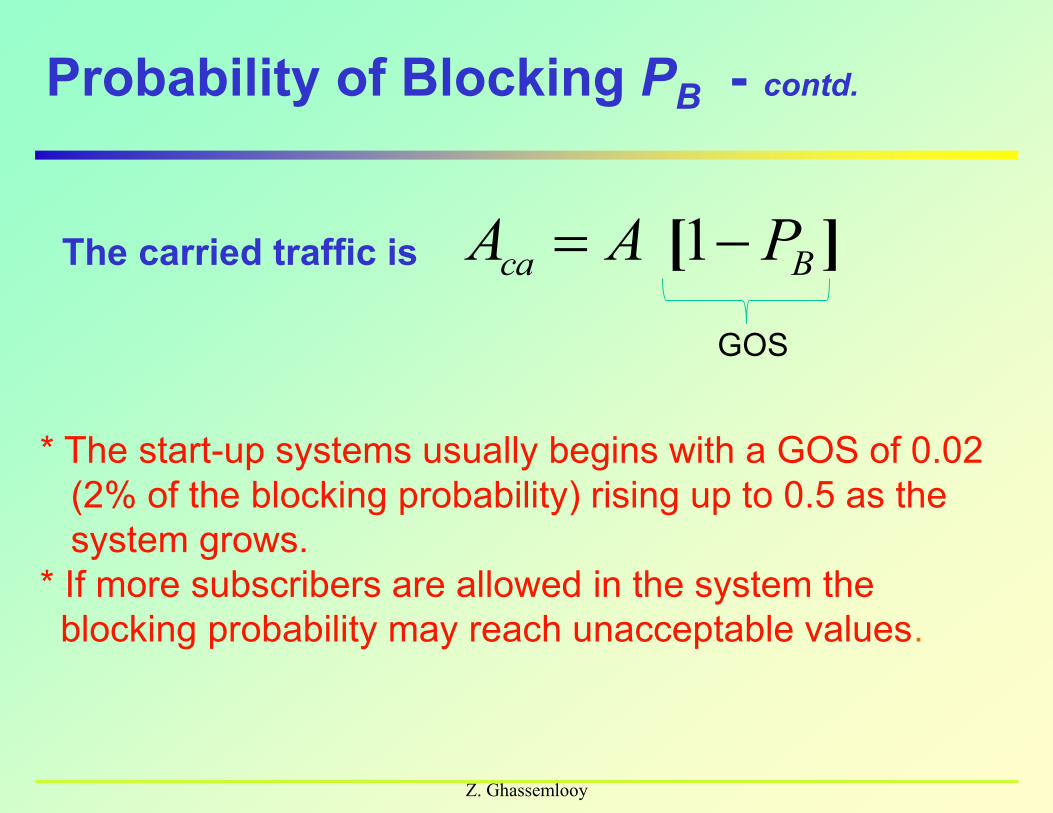
Probability of Blocking PB - contd.
The carried traffic is ][ Bca PAA 1
* The start-up systems usually begins with a GOS of 0.02
(2% of the blocking probability) rising up to 0.5 as the
system grows.
* If more subscribers are allowed in the system the
blocking probability may reach unacceptable values.
GOS

Z. Ghassemlooy
Traffic Efficiency
Saleh Faruque. Cellular Mobile Systems Engineering. Mobile Communication Series. Artech House Publishers. ISBN 0-89006-518-7.1996.
The efficiency of
the channel usage
is
C
Aca
Z. Ghassemlooy
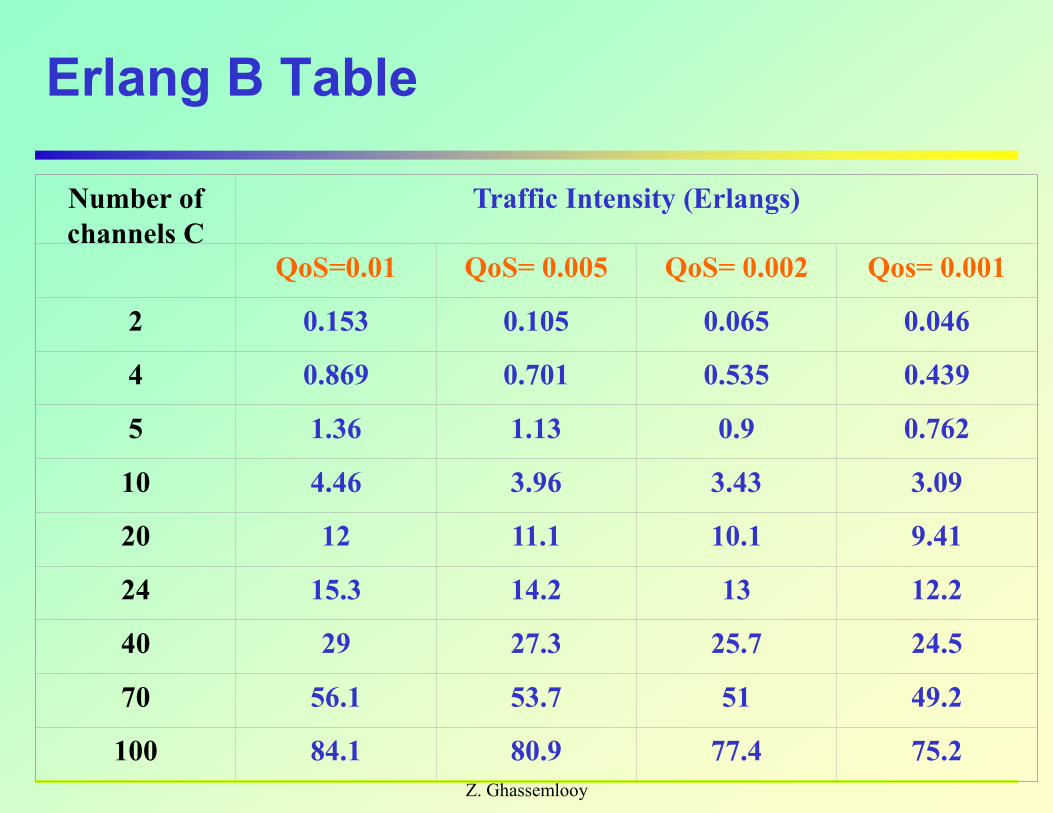
Erlang B Table
Number of
channels C
Traffic Intensity (Erlangs)
QoS=0.01 QoS= 0.005 QoS= 0.002 Qos= 0.001
2 0.153 0.105 0.065 0.046
4 0.869 0.701 0.535 0.439
5 1.36 1.13 0.9 0.762
10 4.46 3.96 3.43 3.09
20 12 11.1 10.1 9.41
24 15.3 14.2 13 12.2
40 29 27.3 25.7 24.5
70 56.1 53.7 51 49.2
100 84.1 80.9 77.4 75.2
Z. Ghassemlooy
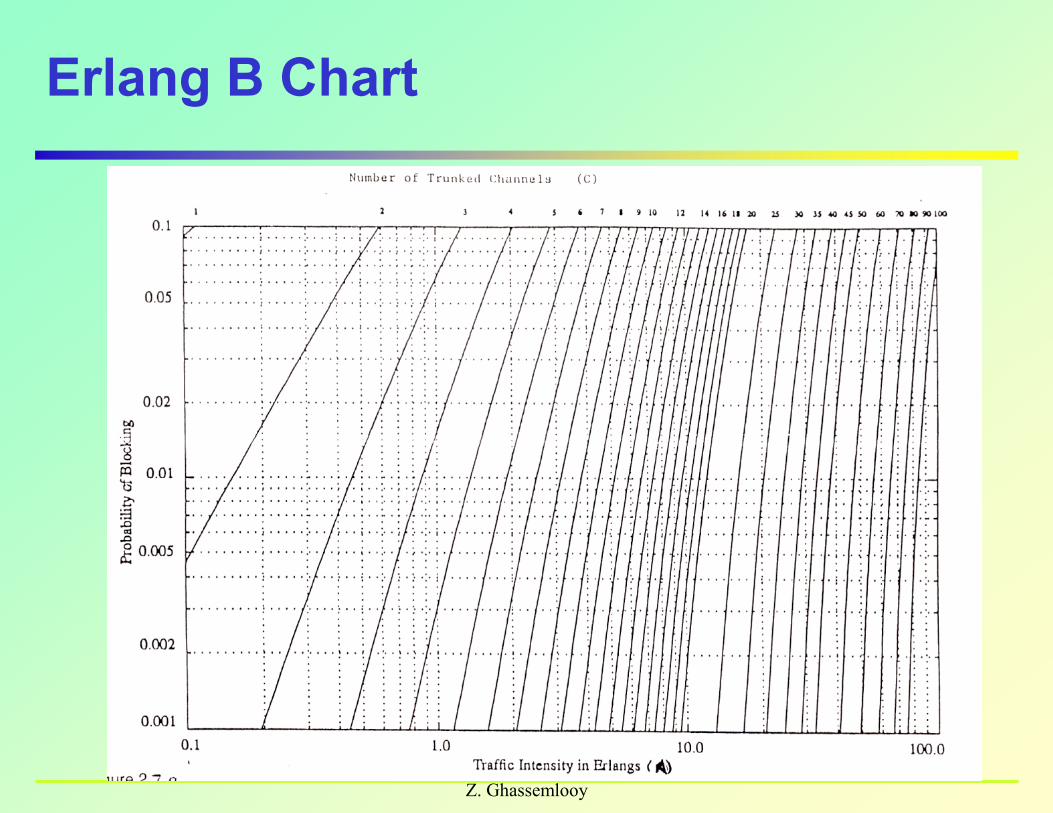
Erlang B Chart
Z. Ghassemlooy
Example III
A single GSM service provider support 10 digital speech
channels. Assume the probability of blocking is 1.0%. From the
Erlang B chart find the traffic intensity. How many 3 minutes of
calls does this represent?
Solution:
From the Erlang B Chart the traffic intensity = ~5 Erlangs
AI = H
= AI /H = 5/(3 mins/60) = 100 calls
Z. Ghassemlooy
Example IV
A telephone switching board at the UNN can handle 120 phones.
Assuming the followings, determine the outgoing traffic intensity and
The number of channels.
- On average 5 calls/hour per phone,
- Average call duration time = 4 minutes,
- 60% of all calls made are external.
- QoS = 0.9%
Solution:
AT = U..H
*U = (120 call*5 calls/hour)*60% =360 call/hour
H = 4 mins/call
Therefore AI =360 * 4 * (1 hour/60 mins) = 24 Erlangs.
Thus 24 hours of circuit talk time is required for every hour of elapsed
time
-No. of channels C from Erlang B chart = ~ 34
Z. Ghassemlooy
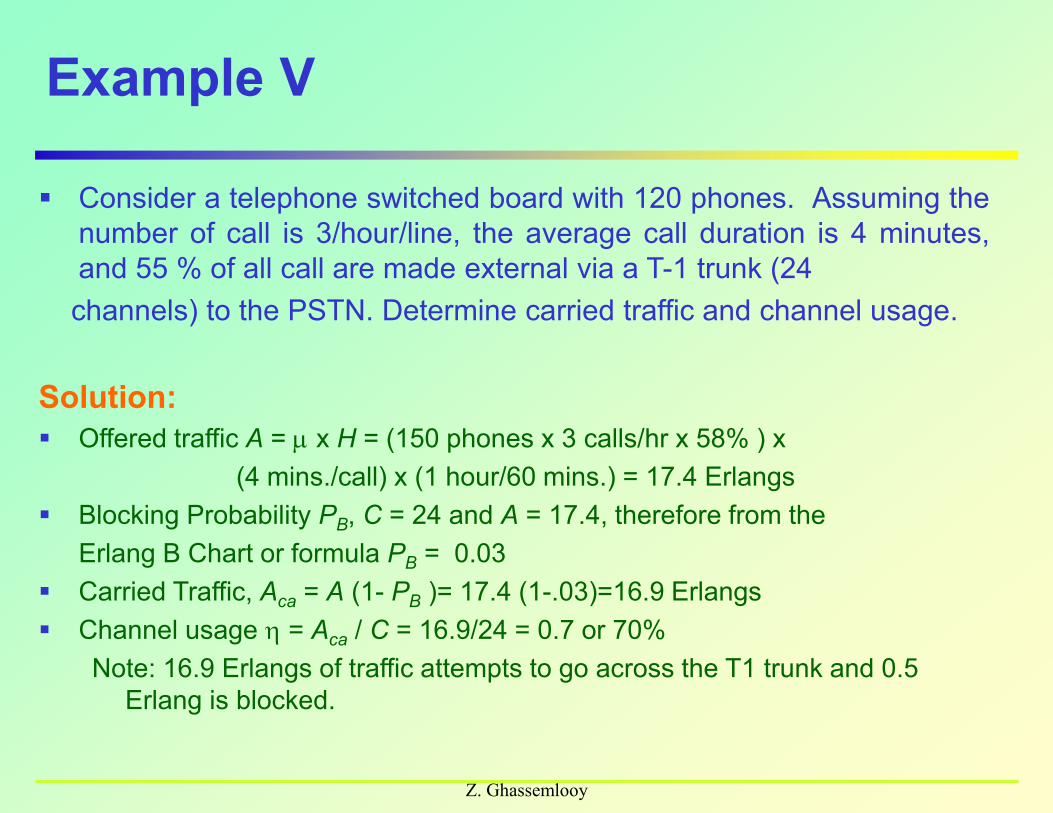
Example V
Consider a telephone switched board with 120 phones. Assuming the
number of call is 3/hour/line, the average call duration is 4 minutes,
and 55 % of all call are made external via a T-1 trunk (24
channels) to the PSTN. Determine carried traffic and channel usage.
Solution:
Offered traffic A = x H = (150 phones x 3 calls/hr x 58% ) x
(4 mins./call) x (1 hour/60 mins.) = 17.4 Erlangs
Blocking Probability PB, C = 24 and A = 17.4, therefore from the
Erlang B Chart or formula PB = 0.03
Carried Traffic, Aca = A (1- PB )= 17.4 (1-.03)=16.9 Erlangs
Channel usage = Aca / C = 16.9/24 = 0.7 or 70%
Note: 16.9 Erlangs of traffic attempts to go across the T1 trunk and 0.5
Erlang is blocked.
Z. Ghassemlooy
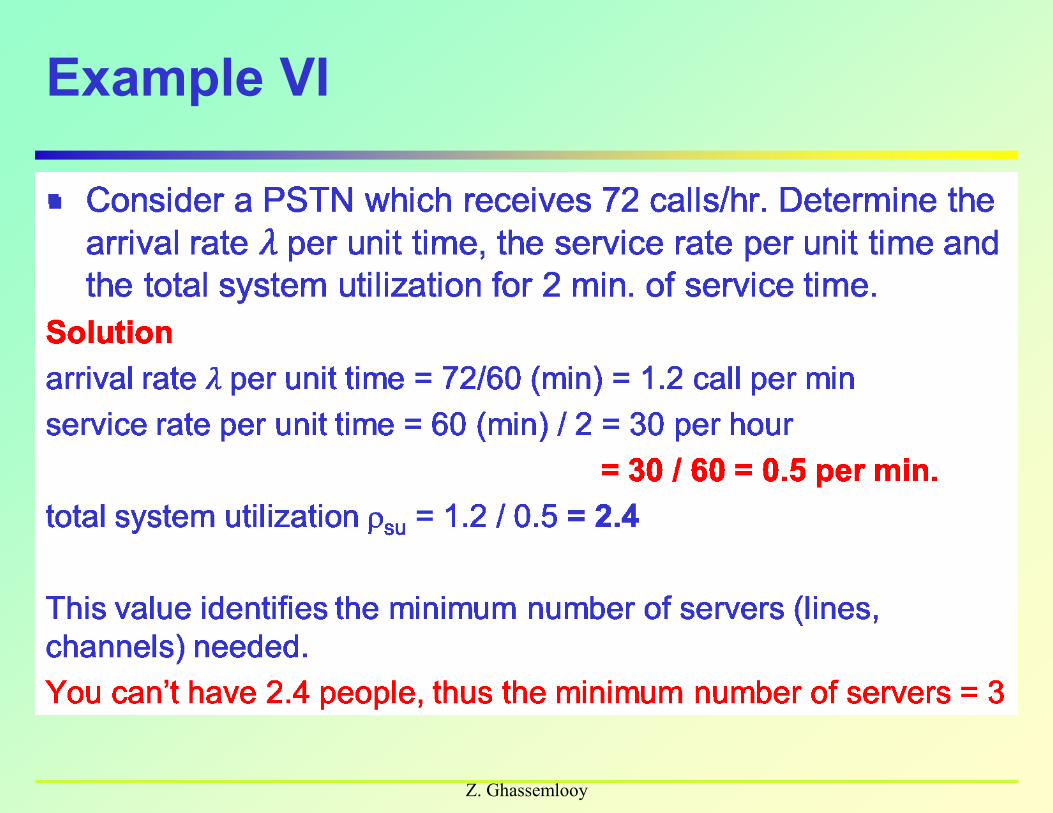
Example VI
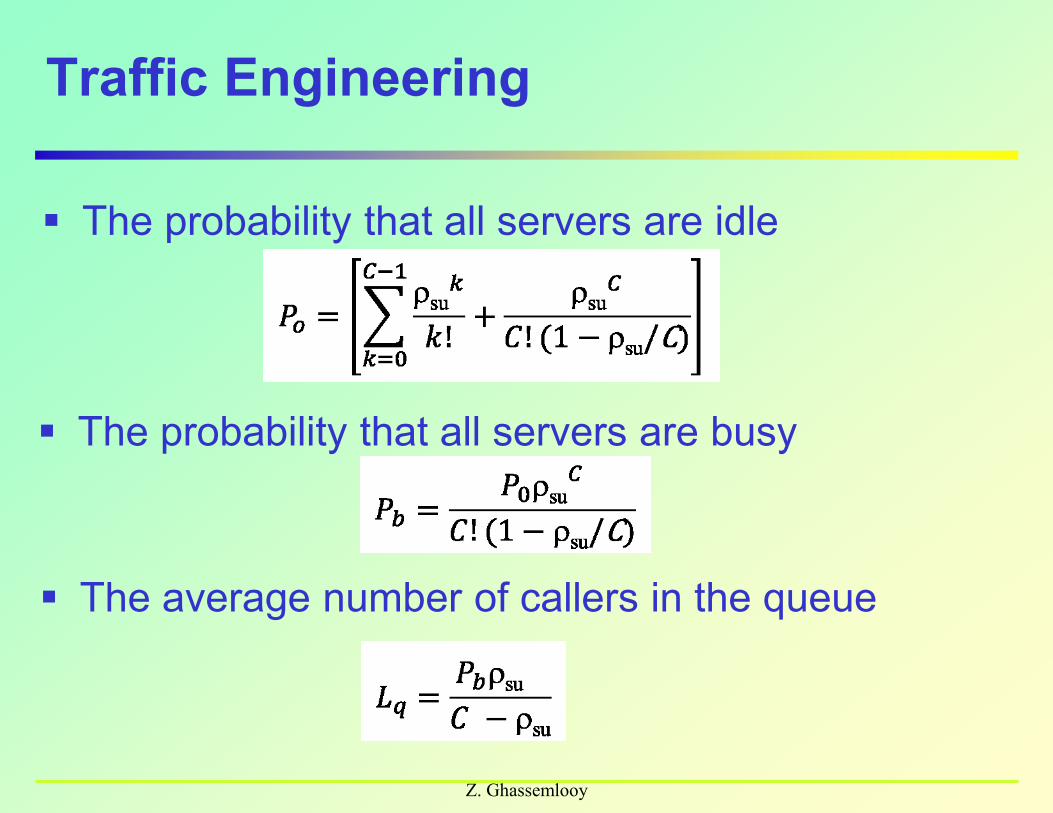
Traffic Engineering
The probability that all servers are idle
Z. Ghassemlooy
The probability that all servers are busy
The average number of callers in the queue
Traffic Engineering
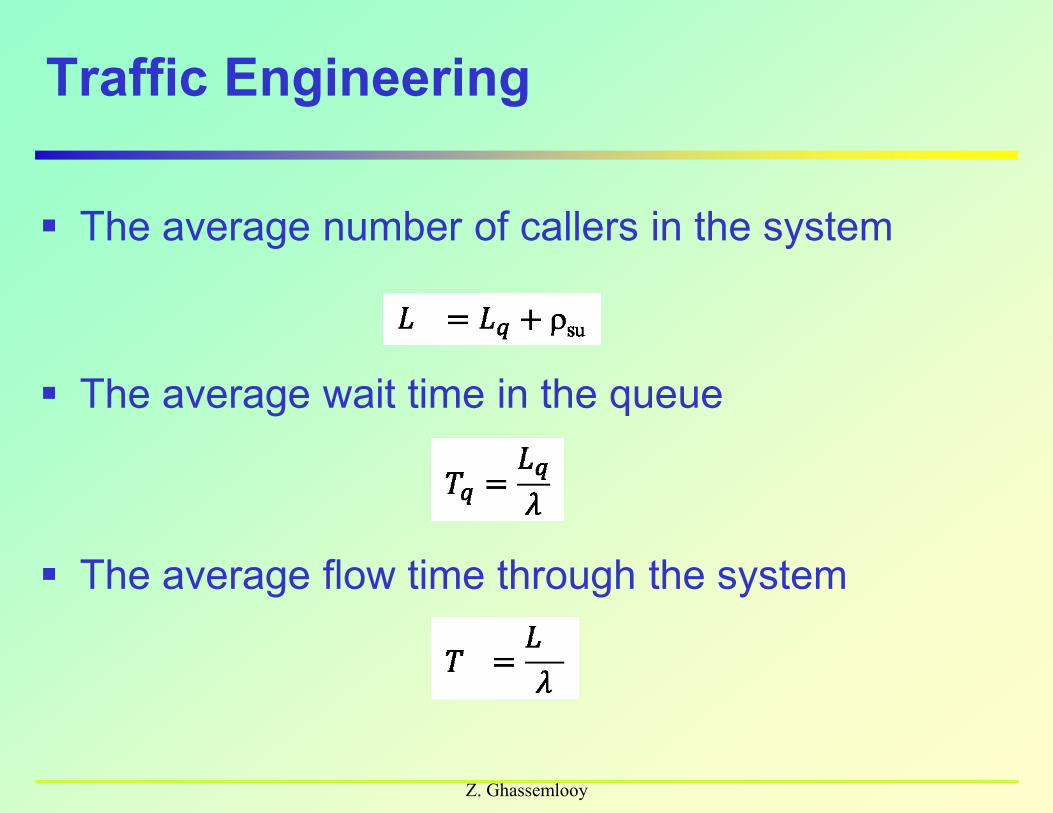
Z. Ghassemlooy
The average number of callers in the system
The average wait time in the queue
The average flow time through the system
Z. Ghassemlooy
Z. Ghassemlooy
Z. Ghassemlooy

Z. Ghassemlooy
Example VII
As a manger of a growing call center, you are looking atobtaining additional phones for the PBX since customers havecomplained about long hold times. On average, there are 4incoming calls per hour on each phone. The traffic study yourequested from the Ameritech CO shows that on average, yourcompany receives 480 calls/hour. How many phones do youneed to order? Currently there are 100 phones connected to thePBX for the customer service agents
Solution
is the average call arrival rate= 480calls/hour (from traffic study)
• = phones x calls/hr
• 480 = N x 4 calls/hour
• N = 480/4 = 120 phones
• So the manager needs to order 120-100 = 20 more phones and hire new customer service reps as well
Z. Ghassemlooy
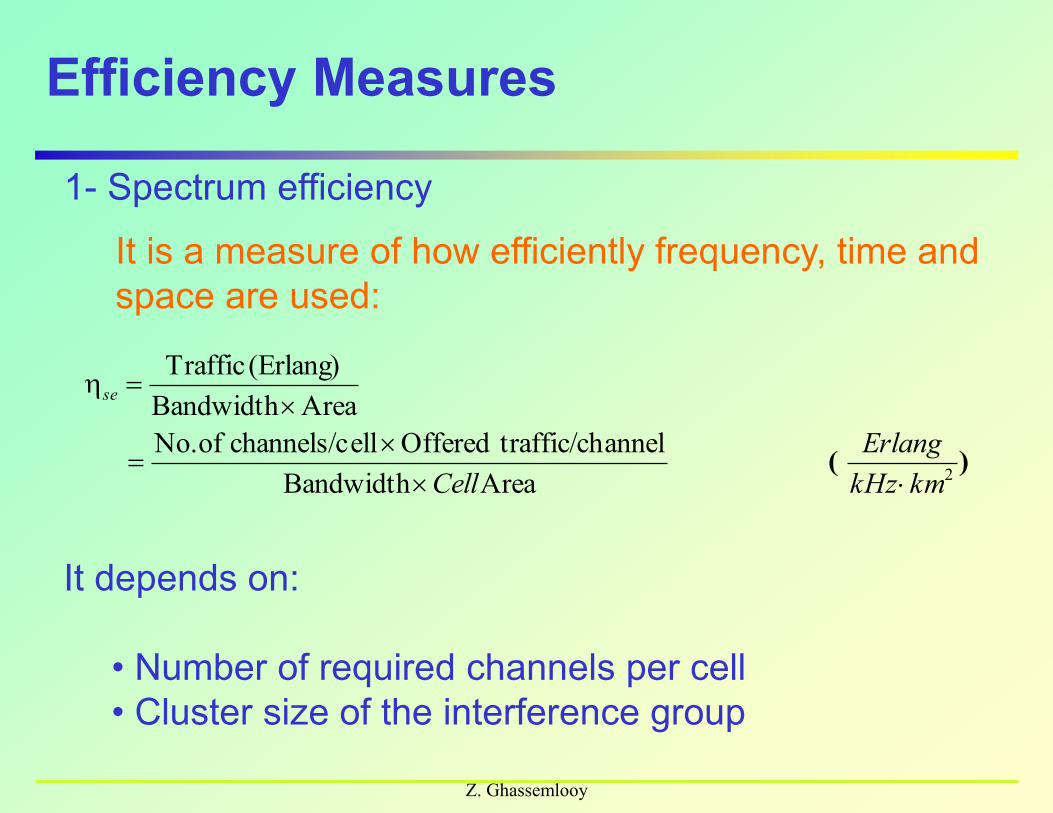
Efficiency Measures
1- Spectrum efficiency
It is a measure of how efficiently frequency, time and
space are used:
It depends on:
• Number of required channels per cell
• Cluster size of the interference group
)(2AreaBandwidth
anneltraffic/chOfferedellchannels/cofNo.
AreaBandwidth
(Erlang)Traffic
kmkHz
Erlang
Cell
se
Z. Ghassemlooy
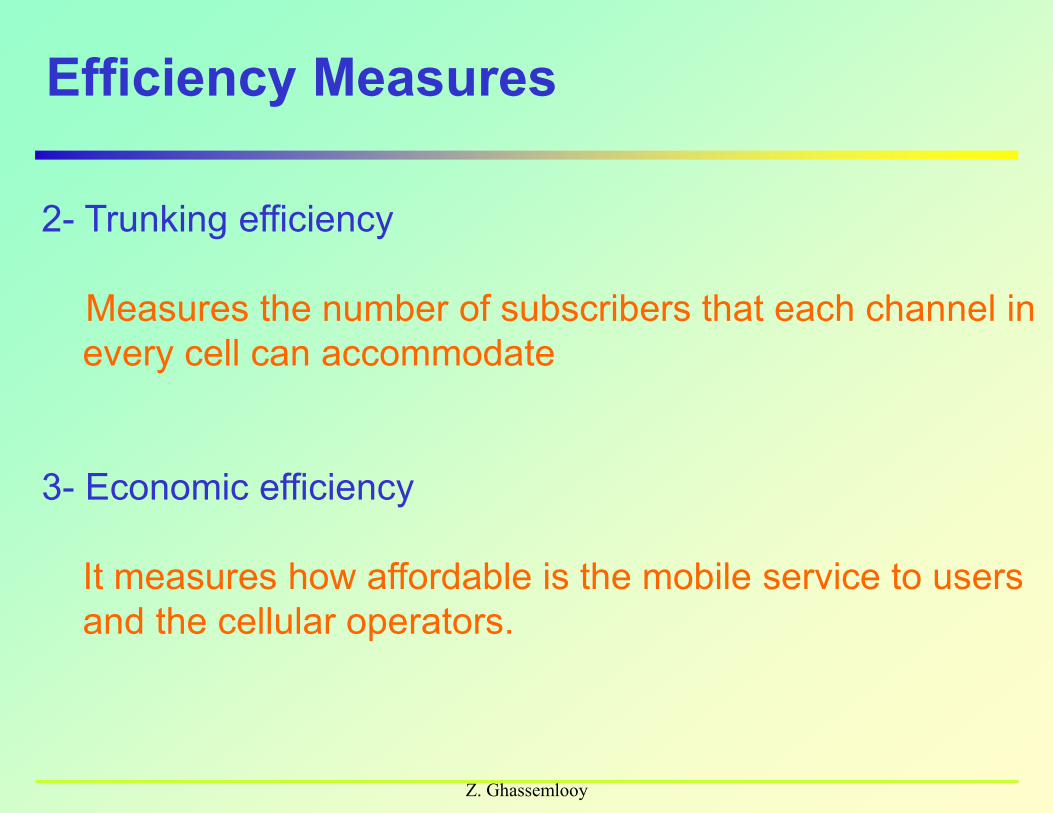
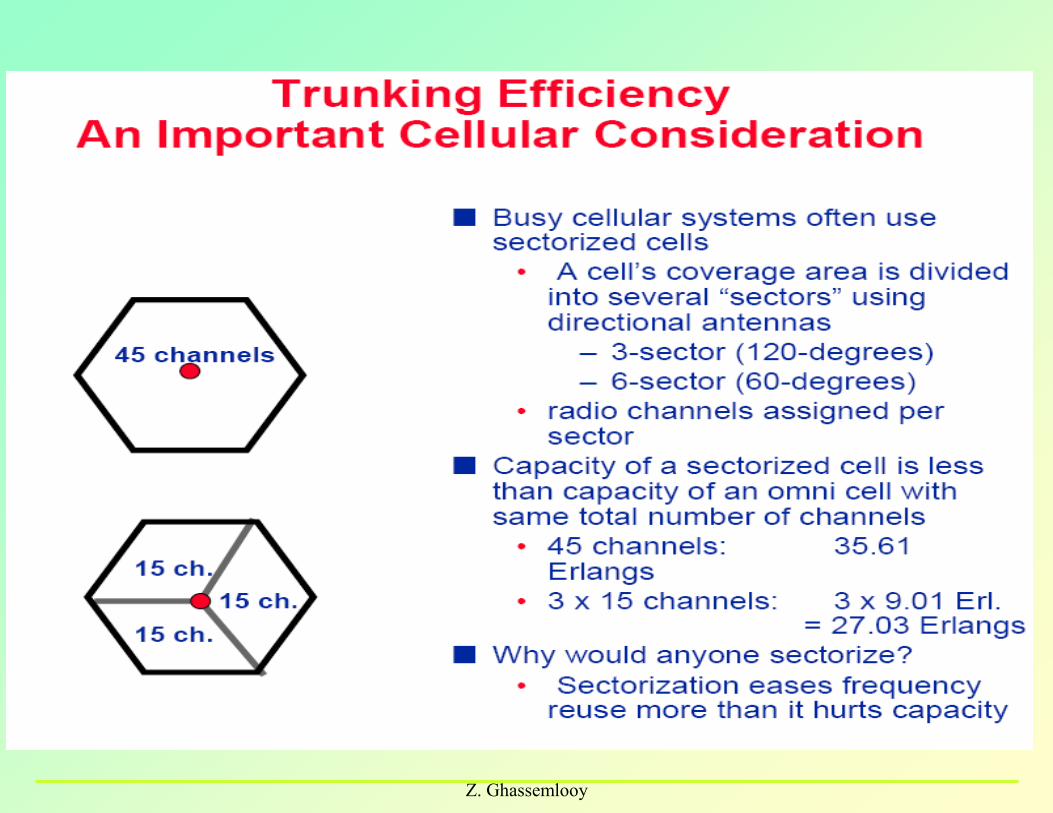
Efficiency Measures
2- Trunking efficiency
Measures the number of subscribers that each channel in
every cell can accommodate
3- Economic efficiency
It measures how affordable is the mobile service to users
and the cellular operators.

Z. Ghassemlooy
No. of Trunk Vs. Utilization Efficiency
Z. Ghassemlooy
Z. Ghassemlooy
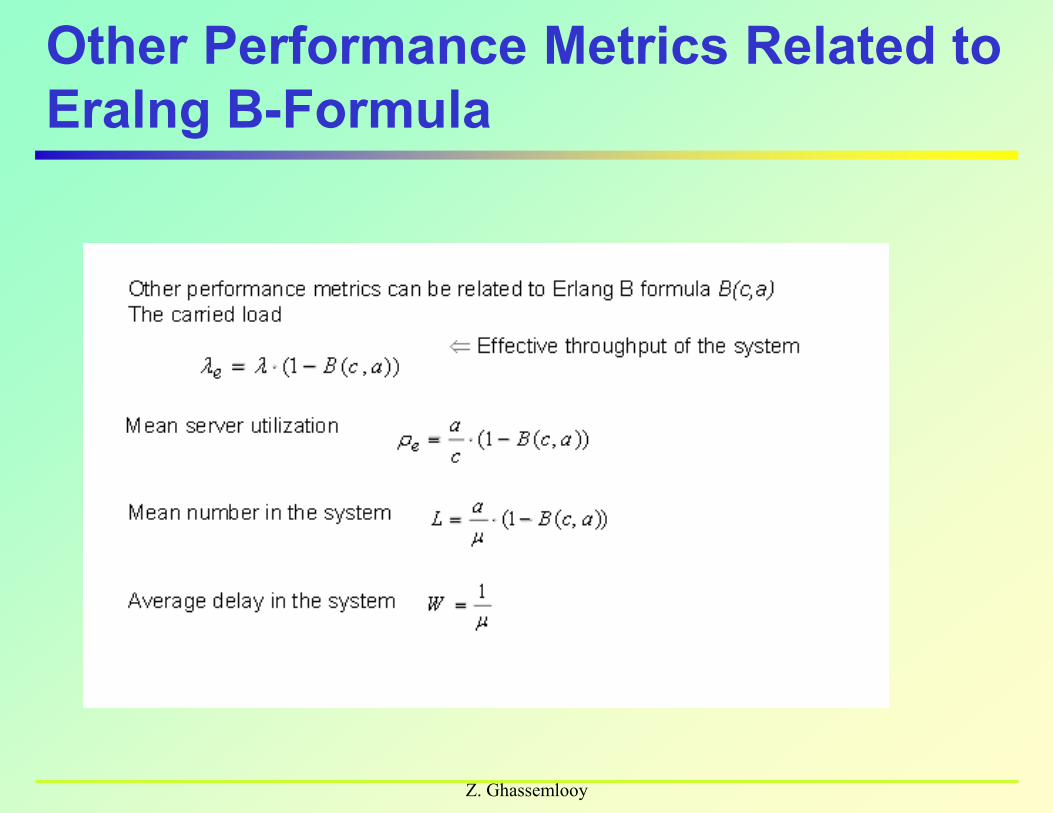
Other Performance Metrics Related to
Eralng B-Formula
Z. Ghassemlooy
Z. Ghassemlooy
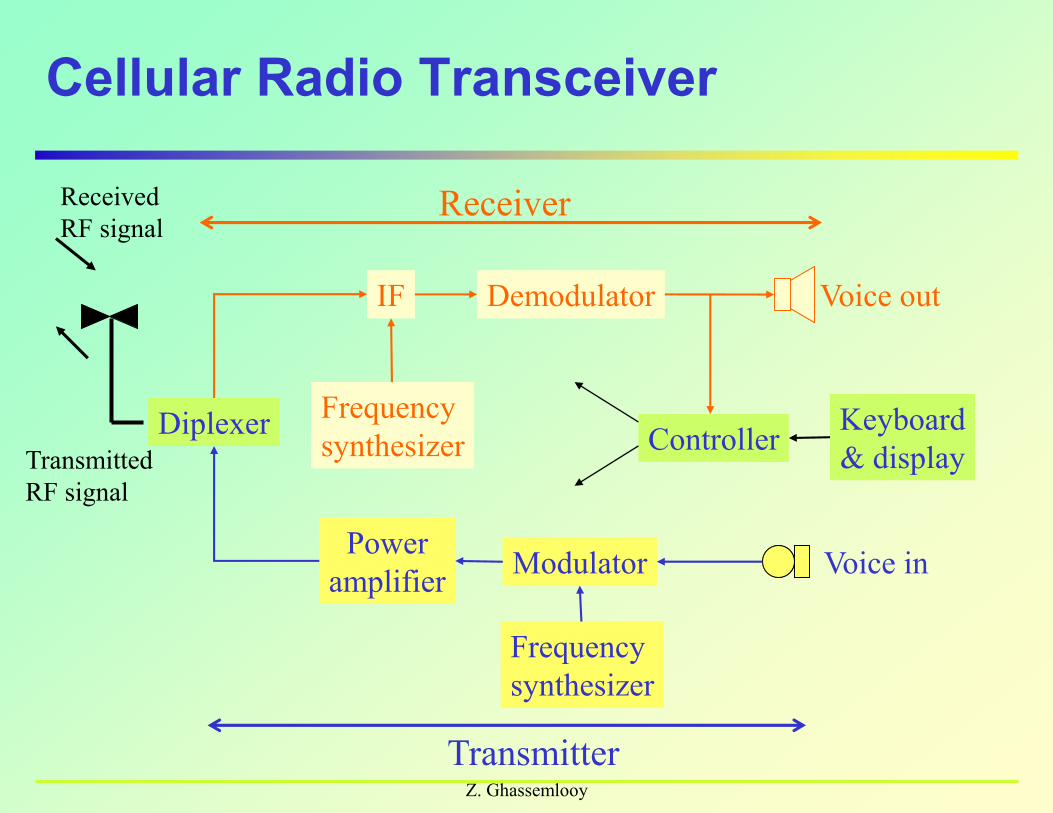
Cellular Radio Transceiver
DiplexerDiplexer
IFIF
Frequency
synthesizer
Frequency
synthesizer
DemodulatorDemodulator
Power
amplifier
Power
amplifierModulatorModulator
Controller
Voice out
Keyboard
& display
Voice in
Frequency
synthesizer
Frequency
synthesizer
Receiver
Transmitter
Received
RF signal
Transmitted
RF signal
Z. Ghassemlooy
Cellular Radio Transceiver - Receiving Path
Antenna
Diplexe– Is a high performance selective filter for the receiving and the
transmitting signals.
– Receiving and transmitting signals are in separate frequency bands.The pass-bands of the filters are designed to minimise the level of transmitting signal coupling into the receiver, see the Fig.
IF and frequency synthesiser– To down convert the received signal. (Multi-stage IFs are also
used).
Demodulator– To recovers the original signal (data, voice etc.)
Z. Ghassemlooy
Cellular Radio Transceiver - Transmitting Path
Modulator
– To up convert the information to a much higher frequency band.
Power Amplifier
– To boost the signal strength
Antenna
Frequency synthesisers
– Are used since transmitting and receiving paths are need
simultaneously. Single synthesiser may be used if the IF is
chosen to be the same as the spacing between the transmitting
and receiving frequency bands (typically 45 MHz).
References
Saleh Faruque. Cellular Mobile Systems Engineering. Mobile Communication Series.
Artech House Publishers. ISBN 0-89006-518-7.1996.
William C. Y. Lee. Mobile Cellular Telecommunications: Analog and Digital Systems.
Second Edition. McGraw-Hill, Inc. ISBN 0-07-038089-9. 1995.
Kaveh Pahlavan and Prashant Krishnamurthy. Principles of Wireless Networks.
Prentice Hall. ISBN 0-13-093003-2, 2002.
Jonathan M. Pitts and John A. Schormans. Introduction to ATM Design and
Performance. John Wiley & Sons. ISBN 0-471-96340-2. 1996.
William Stallings. Wireless Communications and Networks. Prentice Hall. ISBN 0-13-
040864-6, 2002.
Z. Ghassemlooy
Z. Ghassemlooy
Questions and Answers
Next lecture: Propagation Characteristics