modeling biogas technology adoption in pakistan: a way
TRANSCRIPT
Modeling biogas technology adoption in Pakistan: Away forward for sustainable research of energyShahid Ali
North China Electric Power UniversityQingyou Yan
North China Electric Power UniversityRajvikram Madurai Elavarasan
Texas A&M UniversityMuhammad Irfan ( [email protected] )
Beijing Institute of Technology https://orcid.org/0000-0003-1446-583XKashif Raza Abbasi
Shanghai UniversityCem Işik
Anadolu University
Research Article
Keywords: Renewable energy, biogas resources, trade using biogas technology, potential, barriers,Pakistan
Posted Date: October 19th, 2021
DOI: https://doi.org/10.21203/rs.3.rs-994158/v1
License: This work is licensed under a Creative Commons Attribution 4.0 International License. Read Full License
Modeling biogas technology adoption in Pakistan: A way forward for 1
sustainable research of energy 2
Shahid Ali a, Qingyou Yan a,b, Rajvikram Madurai Elavarasan c, Muhammad Irfan d,e,, Kashif Raza Abbasi f, Cem Işik g 3
a School of Economics and Management, North China Electric Power University, Beijing, 102206, China 4
b Beijing Key Laboratory of New Energy and Low-Carbon Development, North China Electric Power University, Beijing, 5
102206, China 6
c Clean and Resilient Energy Systems Laboratory, Texas A&M University, Galveston, TX, 77553, USA 7
d School of Management and Economics, Beijing Institute of Technology, Beijing 100081, China 8
e Centre for Energy and Environmental Policy Research, Beijing Institute of Technology, Beijing, 100081, China 9
f School of Economics, Shanghai University, Shanghai 200444, China 10
g Faculty of Tourism, Anadolu University, Eskişehir, Turkey 11
Abstract 12
The extensive need for energy has become a global issue due to the enormous population growth and demand for electricity-13
based products. Energy crises are rapidly increasing, which have destructive impacts on the industry in Pakistan. Biogas 14
technology adoption is a challenge in a developing country like Pakistan. The government sector has taken initial steps to 15
eliminate the energy crisis and promoted biogas plants. The primary objective of this study is to explore the satisfied and 16
unsatisfied ratio of farmers who have adopted biogas plants in the country. The sample size was identified through the 17
snowball sampling method. A total of 51 biogas adopters participated in this study. The structured questionnaires were used 18
to collect data through online interviews. The results indicate that 34% of biogas plant respondents were satisfied with their 19
plant feedback. The partially satisfied respondents were 24%, whereas 42% showed unsatisfaction. More than half (58%) of 20
the respondents expressed that biogas plants are in good working conditions; however, 42% of biogas users were unrestrained 21
for several causes. The findings of this study indicate that major maintenance and day-to-day operations of biogas plants are 22
expensive due to lack of skilled operators, untrained or partially trained owners, and unavailability of technicians. The results 23
suggest that the government needs to plan a clear policy, technical support with skilled technicians to biogas plant owners, all 24
through an integrated and coherent way. 25
Keywords: Renewable energy; biogas resources; trade using biogas technology; potential; barriers; Pakistan 26
Crresponding author Email addresses: [email protected] (S. Ali), [email protected] (Q.Yan), [email protected] (R.M.Elavarasan), [email protected] (M. Irfan), [email protected] (K.R. Abbasi), [email protected] (C. Isik)
1. Introduction 27
Current lifestyle and economic growth are impossible without a continued supply of energy. Consistent availability of energy 28
is highly required for modern life. The economic growth and success of the nation are greatly dependent on the proper use of 29
energy resources (Ikram et al., 2020). Energy plays a fundamental role in improving the standard of living and economic 30
development of any country or nation. Energy worked as a vital building block for developing country's economic and social 31
development (Carmona et al., 2021). The energy demand and supply gap create issues in almost all country sectors, including 32
sustainable development, prosperity, development of other sectors, and economic growth. These issues are considered 33
harmful for human health, water resources, agricultural productivity, and environmental activities(Arshad et al., 2018). But at 34
present, energy generation is a challenging job with the use of modern technology. The increasing population and current 35
economic development are the reasons for the country's extreme demand for energy. Most portion of the power is generated 36
from fossil fuels in Pakistan. Conversely, these sources of energy generation have opposing environmental impacts and are 37
also high priced. The government of Pakistan has decided to eliminate the major energy crisis by using alternative, clean, and 38
cost-effective energy sources. Modern RE methods address environmental problems and provide solutions for all energy 39
issues (Yasmin and Grundmann, 2019) justifiably. Renewable energy (RE) has contributed 2.4% to the total energy mix of 40
the country. However, the government of Pakistan has decided to enhance the share of RE by 5% until 2030, but biomass 41
energy is playing a vital role in achieving this target(Irfan et al., 2020). Biogas adoption negatively impacts the collection of 42
time and fuel-wood expenditures, but it has a positive and significant impact on crop revenues and income (Yasmin & 43
Grundmann, 2019). 44
The current shortfall of energy in the country can be overcome by the effective and efficient use of biogas as an 45
alternative energy source. Biogas provides practically 14 percent of primary energy because it is the fourth important energy 46
source worldwide (Amir et al., 2019). Pakistan has prodigious potential to produce energy from biogas because it has the 47
sixth-largest livestock-based economy globally (I. Jan & Akram, 2018). Conversely, biogas adoption is financially feasible 48
and also environmental-friendly (T. Abbas et al., 2017). Biogas energy contemplates as a trustworthy and favourable 49
alternative energy source from several available RE technologies. Agriculture is the primary profession in Pakistan and 50
contributes 18.5% of gross domestic product (GDP) by providing 38.5% of employment opportunities to its whole 51
population. Biomass has massive potential to produce energy in Pakistan and reduce the gap between demand and supply 52
(Uddin et al., 2016). The biogas plant is economical due to installation cost and also beneficial to minimize eye 53
contaminations and respiratory. Pakistan Council of RE Technologies has installed 4109 biogas plants throughout the 54
country. It saves an average of Rs, 37.925 million per month in different terms such as liquefied petroleum gas, wood, 55
kerosene oil, and biofertilizer (Javed et al., 2016). Energy has a critical importance for sustainable development in the 56
country. Developing countries are facing a severe economic burden to import gas and oil. Pakistan is consuming a sizeable 57
national treasury to import gas and oil to reduce the temporary energy shortage. Pakistan has saved $8- $9 billion from 58
energy import bills in 2019-2020 (GoP, 2020). It is an admitted fact that economic development and energy are incredibly 59
interdependent (Oyeleke & Akinlo, 2019). 60
Many countries worldwide, including low-middle income, have invested in different RE technologies such as solar 61
thermal, biomass, and hydro to generate reliable, indigenous, and affordable energy (Marion et al., 2017). Biogas generation 62
through anaerobic digestion from organic waste has been acknowledged as a sustainable energy source (Ur et al., 2019). 63
Many research studies have discussed in the literature that biogas provides energy to specific rural areas and fills the different 64
types of gap, such as reducing poverty, creating local jobs, and improving health for economic growth (Bates et al., 2019; 65
Mikhail et al., 2020). Biogas production provides several environmental benefits such as power generation & sustainable 66
energy, waste treatment, and bio-slurry as organic fertilizer to improve stamina in crops. Many reasons for deforestation are 67
explored in rural areas of low-middle-income countries, such as energy shortage, sluggish growth, and lack of biogas 68
production. So, women of rural areas tolerate the burden of burning and woodcutting for cooking and heating (Rosenthal et 69
al., 2018). The agriculture sector is a supplement as nourishment for the economy of Pakistan. Agriculture is the primary 70
source of revenue for a big portion of the population in the country. Consequently, the well-promoted biogas slurry use in 71
agriculture can improve the soil health & production of crops and curtail the cost of fertilizers ultimately (Afridi & Qammar, 72
2020). 73
Biogas production and bio-slurry collection were effectively supported through biogas users for soil fertility (Ashraf 74
et al., 2019). Livestock products encompassed with milk such as milk products or other products consumed at the domestic 75
level. Milk is the main component of livestock products that are domestically consumed by the milk products. The cost of 76
livestock products was high at 64 percent, consumed domestically, but other sold products are 34 percent due to market 77
absence. Household women were participated in 73 present significant shares in livestock income and showed their best 78
contribution in livestock nature (Naz & Khan, 2018). The output of these items, such as mutton, eggs, bones, and fat, have a 79
significant and positive relationship with agriculture GDP in Pakistan. In contrast, the output of some specific items such as 80
hair, wool, skins, beef, poultry, and hides have an insignificant or negative relationship with agriculture GDP in Pakistan 81
(Rehman et al., 2017). The sub-sectors of agriculture were contributed significantly and positively to the agricultural GDP of 82
Pakistan. In agriculture, the government paid less attention to the forestry sub-sector and was considered very poor compared 83
to other sub-sectors (Chandio et al., 2017). Livestock contributes significantly to the development of livelihoods and the 84
economy because it is an essential part of agriculture in Pakistan. The country has produced 650 million kg/day of animal 85
dung, with an estimated livestock population is 207.4 million. It can also provide biogas 16.25 million m3/day to the 86
consumers if 50% of animal dung is collected and processed with the country. This estimated amount of biogas can assist in 87
energy poverty eradication and support rural areas in Pakistan. Agriculture contributes 19.3%, but the livestock sector 88
contributes 11.7% to Pakistan's Gross Domestic Product (GDP). More than 8 million families are linked with farmhouse 89
businesses directly engaged in producing livestock products and earned their total output around 35-40% from this sector 90
(GoP, 2020). However, some livestock items are associated with the significant growth of the economy, such as fat, bones, 91
milk, eggs, and mutton (Rehman et al., 2017). 92
Livestock is a sub-sector of agriculture in Pakistan, and most of the population is associated with this sector. The 93
prosperity and source of income can be increased with the development of the livestock sector and innovation to produce its 94
products (Alvi et al., 2015). Livestock is vital in generating biogas energy, a cost-effective alternative energy source, because 95
Pakistan meets 28.12% of energy needs through imported gas and oil (Duan & Chen, 2017). Biogas technology has a bright 96
future in Pakistan and can also support eliminating the energy deficit from the country (Ashraf et al., 2019). Pakistan has an 97
animal-based huge population and production of biogas potential by using animal dung (Y. Wang et al., 2020). Pakistan is 98
producing 129 ton/day animal dung collections that can make a possible quantity of biogas. The average amount of biogas 99
12-804 m3/ day can be produced through animal dung in the village area of Pakistan (Shah & Sahito, 2017). The government 100
of Pakistan has started a biogas project by using biogas technology for social benefit in 1974. The 4137 biogas plants were 101
installed in rural arrears till 1987. The per-day biogas plant capacities were 3,000 ft3 to 5,000 for cooking and lighting 102
(Kamran, 2018). In 2008-2009, Pakistan started its domestic biogas project program to provide biogas plants and replaced 103
conventional fuels such as leftover crops, liquefied petroleum gas, wood, and animal dung cake (M. I. Jan, 2017). The 104
primary purpose was to construct 12,000 biogas plants by this specific program. Unfortunately, only the estimated 3,000 105
biogas plants were connected, but desired goals were not accomplished. The program was offered subsidy by way of 106
incentives to up great and encouraged population of rural areas for social and technological adaptation. Still, biogas 107
technology acceptance has not received the required, favorable rate (Mushtaq et al., 2016). 108
The primary reason behind the installation and construction of biogas plants was the inspiration of energy, saving of 109
time, and subsidy. The 42.5% key motivational and subsidy influencing factors included subsidy, tax, and finance for the 110
cleaner fuel adoption (Puzzolo et al., 2016). social reputation and time-saving are also considered motivational factors and 111
accounting for 33.5% for each, respectively. The technology progress in low-middle income countries with social acceptance 112
is highly linked. The fact about social niche starts with the behaviour of individuals, and existing social practices are linked 113
with it. For the health advantage, the lowest case in percentage was 13.7% that is a trait of an awareness level of adopters 114
(Pilloni et al., 2020). Table 1. Indicates the reasons of inspiration to adopt biogas plant from plant users. 115
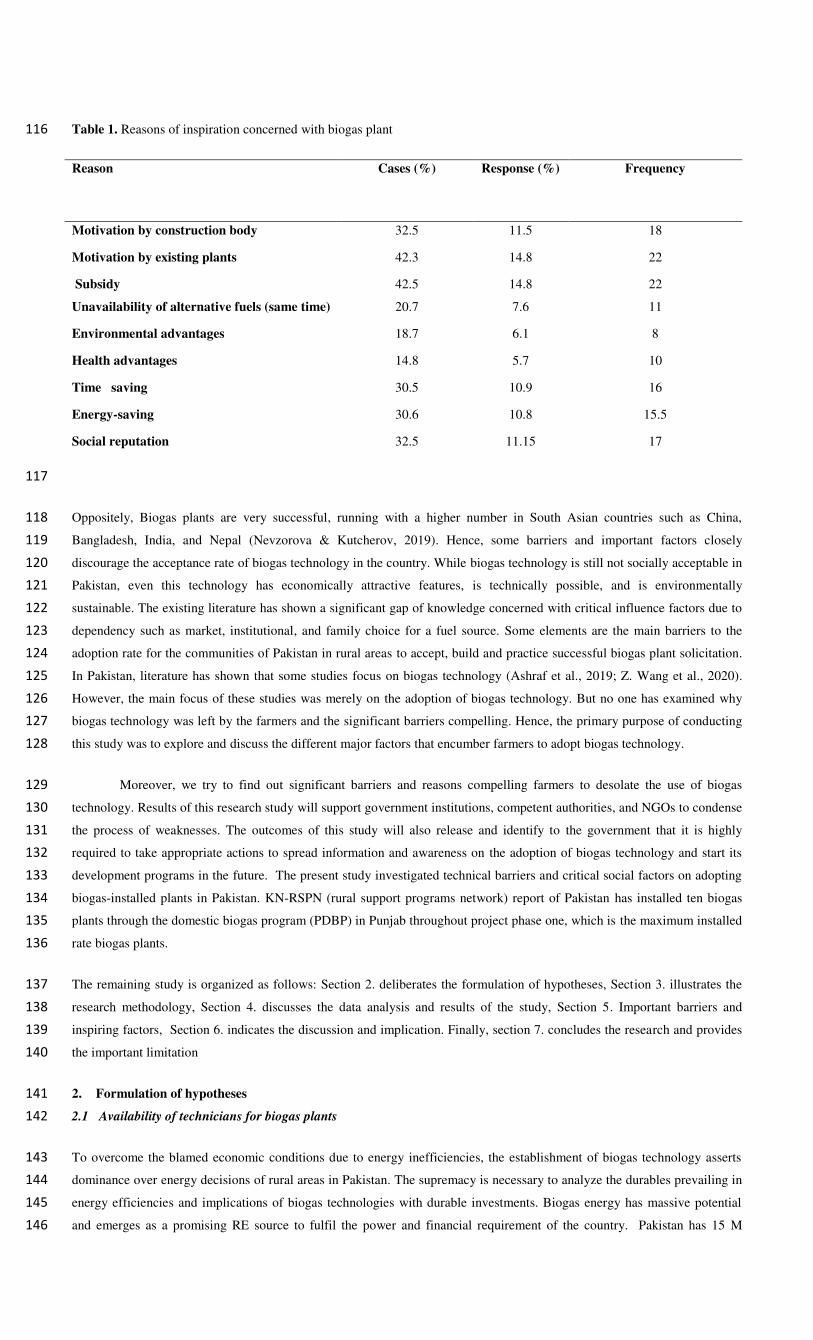
Table 1. Reasons of inspiration concerned with biogas plant 116
117
Oppositely, Biogas plants are very successful, running with a higher number in South Asian countries such as China, 118
Bangladesh, India, and Nepal (Nevzorova & Kutcherov, 2019). Hence, some barriers and important factors closely 119
discourage the acceptance rate of biogas technology in the country. While biogas technology is still not socially acceptable in 120
Pakistan, even this technology has economically attractive features, is technically possible, and is environmentally 121
sustainable. The existing literature has shown a significant gap of knowledge concerned with critical influence factors due to 122
dependency such as market, institutional, and family choice for a fuel source. Some elements are the main barriers to the 123
adoption rate for the communities of Pakistan in rural areas to accept, build and practice successful biogas plant solicitation. 124
In Pakistan, literature has shown that some studies focus on biogas technology (Ashraf et al., 2019; Z. Wang et al., 2020). 125
However, the main focus of these studies was merely on the adoption of biogas technology. But no one has examined why 126
biogas technology was left by the farmers and the significant barriers compelling. Hence, the primary purpose of conducting 127
this study was to explore and discuss the different major factors that encumber farmers to adopt biogas technology. 128
Moreover, we try to find out significant barriers and reasons compelling farmers to desolate the use of biogas 129
technology. Results of this research study will support government institutions, competent authorities, and NGOs to condense 130
the process of weaknesses. The outcomes of this study will also release and identify to the government that it is highly 131
required to take appropriate actions to spread information and awareness on the adoption of biogas technology and start its 132
development programs in the future. The present study investigated technical barriers and critical social factors on adopting 133
biogas-installed plants in Pakistan. KN-RSPN (rural support programs network) report of Pakistan has installed ten biogas 134
plants through the domestic biogas program (PDBP) in Punjab throughout project phase one, which is the maximum installed 135
rate biogas plants. 136
The remaining study is organized as follows: Section 2. deliberates the formulation of hypotheses, Section 3. illustrates the 137
research methodology, Section 4. discusses the data analysis and results of the study, Section 5. Important barriers and 138
inspiring factors, Section 6. indicates the discussion and implication. Finally, section 7. concludes the research and provides 139
the important limitation 140
2. Formulation of hypotheses 141
2.1 Availability of technicians for biogas plants 142
To overcome the blamed economic conditions due to energy inefficiencies, the establishment of biogas technology asserts 143
dominance over energy decisions of rural areas in Pakistan. The supremacy is necessary to analyze the durables prevailing in 144
energy efficiencies and implications of biogas technologies with durable investments. Biogas energy has massive potential 145
and emerges as a promising RE source to fulfil the power and financial requirement of the country. Pakistan has 15 M 146
Reason
Cases (%) Response (%) Frequency
Motivation by construction body 32.5 11.5 18
Motivation by existing plants 42.3 14.8 22
Subsidy 42.5 14.8 22
Unavailability of alternative fuels (same time) 20.7 7.6 11
Environmental advantages 18.7 6.1 8
Health advantages 14.8 5.7 10
Time saving 30.5 10.9 16
Energy-saving 30.6 10.8 15.5
Social reputation 32.5 11.15 17
potential of biogas power plants to run successfully, which can play a vital role in the country's economic development (Iqbal 147
et al., 2018). The country has required experienced technicians for the biogas plants. The government has rich biogas 148
resources, including agricultural residues, fuel-wood, municipal solid waste, and animal dung. Domestic energy needs are 149
fulfilled by using 48% fuel-wood and 32% using animal residues and crops. Pakistan has 4800-5600 MW power potential 150
from animal dung. Correspondingly, the potential of municipal solid waste for electricity generation through biochemical and 151
thermochemical conversion is 220 kWh/t and 560 kWh/t, respectively (Irfan et al., 2020). Due to agricultural country, 152
Pakistan has a considerable quantity of animal base biogas resources. The functional implementation of these biogas 153
resources can return the fruitful outcome to the country's rural areas. The proper use of manure and straw biogas resources 154
can play a vital role in the emission reduction effect and increase economic advantages (Gao et al., 2019). The biogas plants 155
contribute to producing electricity, reduce the emissions level, increase economic development by increasing profit, and its 156
upgrading can increase environmental performance (Cucchiella et al., 2019). Biogas technology adoption in rural areas can 157
play a vital role in the economic development of the country. Its parallel situation positively depicts the biogas adoption of 158
sites and projections that could increase economic growth. We formulated the first hypothesis in the light of these findings as 159
follows: 160
H1: There is a positive association between the availability of technicians for biogas plants and the adoption of biogas social 161
projects in Pakistan. 162
2.2 Low-cost and clear policy 163
The population of Pakistan is approximately 60% living in rural areas and demands energy sources for commercial and 164
domestic use. The established portable biogas plants are advantageous due to abundant production of methane gas, low cost, 165
clear policy and lightweight. This type of biogas plant can produce for the prosperity of rural areas and fulfill domestic 166
requirements (I. Abbas et al., 2020). The prosperity of the rural areas has co-related with the adoption of biogas plants. The 167
prosperity and biogas development are included household biogas digesters, biomethane plants, biogas grid plants for 168
electricity generation, the development of large-scale biogas plants, and small-scale biogas digesters in rocky areas: the 169
incentives, digested biogas integration, various capital investment mechanism construction, and improvement for the biogas 170
sector (Haile et al., 2019). These findings are much consistent with the development of biogas plants initiated in Pakistan. 171
This importance elaborates the significance of the biogas for individual investment and its association with economic 172
prosperity. The proper utilization of biogas plants in rural areas can bring economic prosperity beyond the limits of biogas 173
adoption. Biogas is the best RE option for the region's development and prosperity regarding a professional management unit. 174
Finally, commercial biogas is considered the direction of revolution in rural areas and provides social benefits, economic and 175
environmental (Zambon, 2017). Overall, biogas technology model adoption is a well-matched condition for the prosperity of 176
rural people in Pakistan. These arguments lead us to the formulation of the third hypothesis as follows: 177
H2: There is a positive association between the low-cost and clear policy and adopting biogas plants in Pakistan. 178
2.3 User satisfaction and biogas plant-quality 179
Biogas generation is used in electricity production, and biogas waste is an eco-friendly and sustainable RE source. Electricity 180
generation from biogas can remove power crises, waste management, and environmental issues in Pakistan. Biogas waste is 181
one of the best energy sources become an essential component for sustainability transition and concerning emissions and 182
economy lavishly available in Pakistan, including kitchen waste, sugarcane bagasse, poultry waste, and animal manure. The 183
total biogas production potential is 226.8 M m3 d-1 in the country, while electricity generation is 59,536 GWh y-1 which is 184
49.4% of the total power production estimated for 2018 (Yaqoo et al., 2021). The satisfaction of the users regarding the 185
biogas plant is paramount, especially in Pakistan. The use of biogas can provide us 280MWh/day of electricity from poultry 186
waste (Gebreegziabher et al., 2018). It helps in upbringing the livelihood of people but could also denote positive impacts on 187
people's lives. The looking potential for biogas power projects has stated a positive share in RE. The present values of the 188
initial investment in solar power projects have enumerated significant coverage of the amount invested. 189
Biogas holds massive methane produced with anaerobic fermentation of the animal dung taken by organic material. 190
Pakistan has an excellent biogas production potential and is the sixth-largest livestock-based economy in the whole world. 191
The government of Pakistan (GoP) has taken initial steps to start the biogas support program (BSP) (I. Jan & Akram, 2018). 192
Benefits gains are more extensive in the coming years than benefits gains in the first year of the biogas plant due to the fixed 193
installation cost. In Pakistan, using rice husk, installing a biogas plant with poultry waste is feasible according to benefit-cost 194
analysis. We proposed the third hypothesis by keeping in view these findings as follows: 195
H3: There is a positive association between user satisfaction and plant quality and the adoption of biogas in Pakistan. 196
2.4 Operational and maintenance government support and adoption of biogas plant 197
The biogas sector of Pakistan has enormous potential and needs for appropriate utilization with relevant information to the 198
local formers. The issues of the biogas sector can be removed with the investment of foreign investors if operational and 199
maintenance government support is provided to the biogas plant users in Pakistan. Operational and maintenance costs vary 200
from installation scales. The adopted technical and operational design for the biogas plant should be considered for similar 201
projects. The government can play a primary role in promoting the biogas sector in the country by offering subsidies, 202
incentives, and current policies to attract stakeholders and investors (Jarrar et al., 2020). the fixed dome biogas plants are 203
excellent financial performance due to low capital costs ( installation and reaction), lower maintenance and operational costs, 204
and rapid payback. (Yasar et al., 2017). The thermal energy produced with biogas positively affect evaluation outcome. The 205
RE policy incentives can attract investors for biogas and improve biogas plants' viability if the policy is amended and 206
independent projects are allowed as a renewable plug-in (Govender et al., 2019). In Pakistan, the biogas power plant can be 207
benefited from the economic conditions. These conditions are potential impacts of some elements of operatonal and 208
maintenance and close associations of improvement towards biogas power projects. In the light of these arguments, we 209
proposed the following hypotheses as follows: 210
H4: There is a positive association between operational and maintenance government support and the adoption of biogas in 211
Pakistan. 212
2.5 The moderating role of awareness and understanding between the availability of technicians and biogas plant 213
Awareness and understanding about biogas technology to the farmers and the rural regions are associated with positive and 214
significant feedback toward the economy. Biogas production with the use of waste is an efficient technique. The contribution, 215
local experts' availability, and attractiveness of biogas technology's increasing RE market are the essential factors in 216
adaptation to climate change (Hasan et al., 2020). A clear picture is depicted in developing countries like Pakistan, where 217
biogas production can improve with biogas technology adoption. The failed ratio of productive biogas installation is 50% due 218
to technological and logical issues within two years after contracting. Due to the poor quality of digester feed, the lack of 219
awareness and understanding of the facilities failed to sustain biogas production. During the shortage of primary feedstock, 220
the local technical data to use alternatives also fails to maintain biogas production (Tumusiime et al., 2019). 221
The current position states the evaluation based on awareness and understanding of biogas plant, which describes the 222
broader geographical region view. These elements are linked significantly with biogas installation and production. Some 223
factors played a role in delaying specific biogas plants, but developing countries positively associated services with biogas 224
plants. Acknowledging responsibility, consumer effectiveness, environmental concern, and awareness of consequences 225
ultimately and significantly affect the farmer's norms. Subsequently, the intentions of the farmers affect through personal 226
criteria to adopt biogas technology in Pakistan. (Z. Wang et al., 2020). In the light of these arguments, we proposed the 227
following hypothesize as follows: 228
H5: The project's awareness and understanding positively moderate the association between the availability of technicians 229
and the adoption of biogas in Pakistan. 230
H6: The project's awareness and understanding positively moderate the association operational and maintenance 231
government support and adoption of biogas in Pakistan. 232
H7: The project's awareness and understanding positively moderate the association between the low-cost and clear policy 233
and the adoption of biogas in Pakistan. 234
H8: The project's awareness and understanding positively moderate the association between user satisfaction and plant 235
quality and adoption of biogas in Pakistan. 236
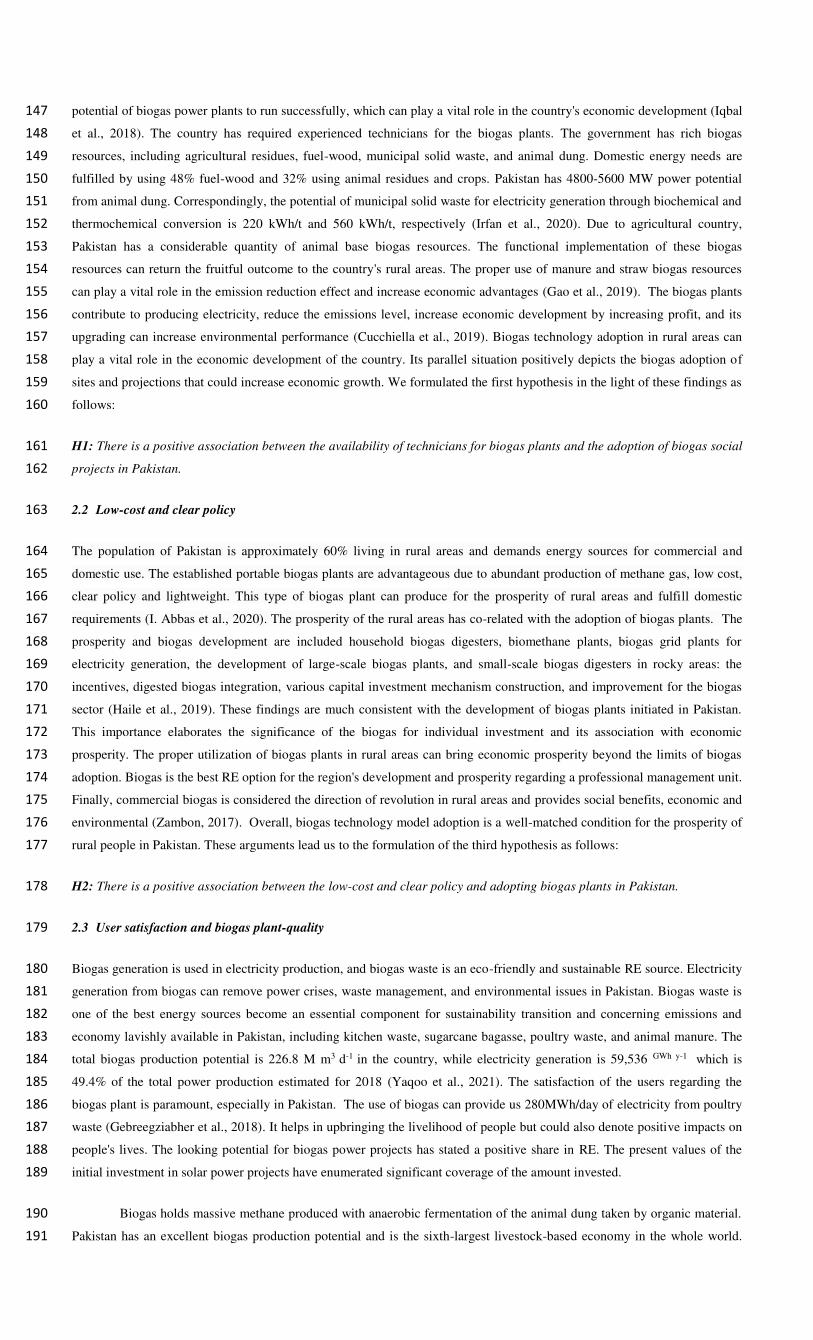
In this study, energy choice theory is on a theoretical basis. This study can apply the energy choice theory in a 237
specific area. Depending on gas connection availability, an investigation will be used where it has the potential to choose 238
between connecting with a Sui gas national or biogas from agriculture waste or other alternatives energies. The energy ladder 239
model defined that any household has the choice to choose a specific fuel. Different types of fuels can be changed with this 240
linear process. Traditional fuels dung cake, shrubs, and firewood on the bottom level but modern fuels such as electric stoves 241
and methane gas depend on the household's average income. This model explicitly highlights the individual pay for explained 242
energy choice (Gautam et al., 2020). Countries worldwide are facing challenges by using a conventional source of energy to 243
meet the clean energy demands of their people and trying to explore new RE sources. This theory has two main factors: 244
economic and wealth status (Ozoh et al., 2018). In Pakistan, this study was conducted based on the theoretical background to 245
find out the adopting factors for biogas energy plants. The assumed environmental, social, and technical factors could not be 246
excluded for the failure or success of the biogas energy plants through consumers or society. The reflection of consumer 247
perception can deliver through the theoretical framework figure 1 to the choice of energy source for living. 248
249
Figure 1: Conceptual Model 250
3. Research methodology 251
This research has used non-probability (snowball) sampling to improve biogas plants and to check the potential of biogas in 252
Pakistan. Currently working biogas plants were selected as a part of research to improve their service and quality. Specific 253
biogas plants were adopted when the snowball sampling technique was employed to present our sample from biogas plants 254
throughout the country. To fulfill this purpose, the researchers surveyed from march to September (2021); when the fourth 255
wave named delta variant virus, a type of coronavirus (COVID-19), was at its peak in Pakistan, it was a high risk to approach 256
relevant respondents. Moreover, all representatives have a heterogeneous background in using biogas plants as well as 257
demographic measures. Furthermore, snowball sampling was employed to select respondents in this research from Pakistan, 258
involving respondents with diverse behaviors. The ongoing research goal is to examine the potential and barriers to adopting 259
biogas technology and assess satisfied owners of biogas plants with their financial performance. Examine the moderating role 260
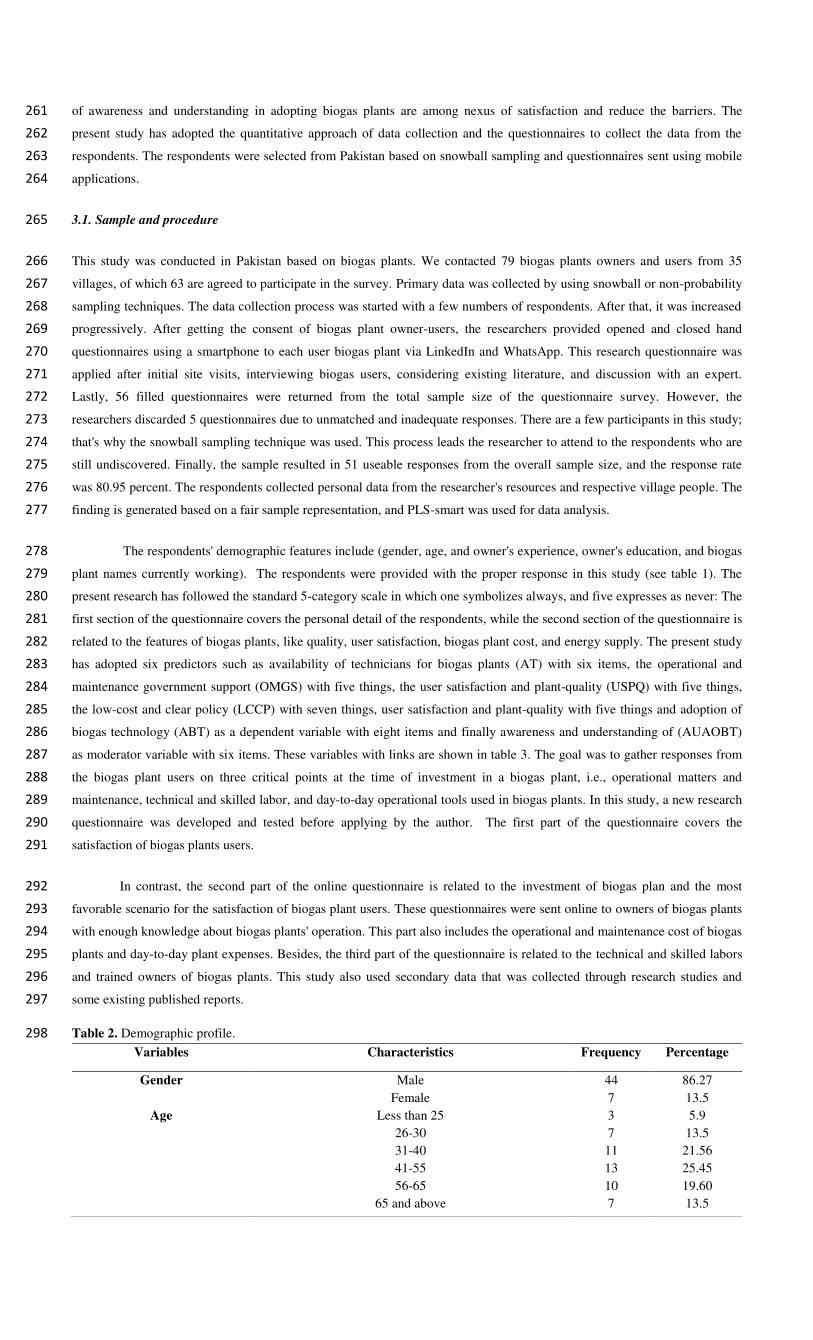
of awareness and understanding in adopting biogas plants are among nexus of satisfaction and reduce the barriers. The 261
present study has adopted the quantitative approach of data collection and the questionnaires to collect the data from the 262
respondents. The respondents were selected from Pakistan based on snowball sampling and questionnaires sent using mobile 263
applications. 264
3.1. Sample and procedure 265
This study was conducted in Pakistan based on biogas plants. We contacted 79 biogas plants owners and users from 35 266
villages, of which 63 are agreed to participate in the survey. Primary data was collected by using snowball or non-probability 267
sampling techniques. The data collection process was started with a few numbers of respondents. After that, it was increased 268
progressively. After getting the consent of biogas plant owner-users, the researchers provided opened and closed hand 269
questionnaires using a smartphone to each user biogas plant via LinkedIn and WhatsApp. This research questionnaire was 270
applied after initial site visits, interviewing biogas users, considering existing literature, and discussion with an expert. 271
Lastly, 56 filled questionnaires were returned from the total sample size of the questionnaire survey. However, the 272
researchers discarded 5 questionnaires due to unmatched and inadequate responses. There are a few participants in this study; 273
that's why the snowball sampling technique was used. This process leads the researcher to attend to the respondents who are 274
still undiscovered. Finally, the sample resulted in 51 useable responses from the overall sample size, and the response rate 275
was 80.95 percent. The respondents collected personal data from the researcher's resources and respective village people. The 276
finding is generated based on a fair sample representation, and PLS-smart was used for data analysis. 277
The respondents' demographic features include (gender, age, and owner's experience, owner's education, and biogas 278
plant names currently working). The respondents were provided with the proper response in this study (see table 1). The 279
present research has followed the standard 5-category scale in which one symbolizes always, and five expresses as never: The 280
first section of the questionnaire covers the personal detail of the respondents, while the second section of the questionnaire is 281
related to the features of biogas plants, like quality, user satisfaction, biogas plant cost, and energy supply. The present study 282
has adopted six predictors such as availability of technicians for biogas plants (AT) with six items, the operational and 283
maintenance government support (OMGS) with five things, the user satisfaction and plant-quality (USPQ) with five things, 284
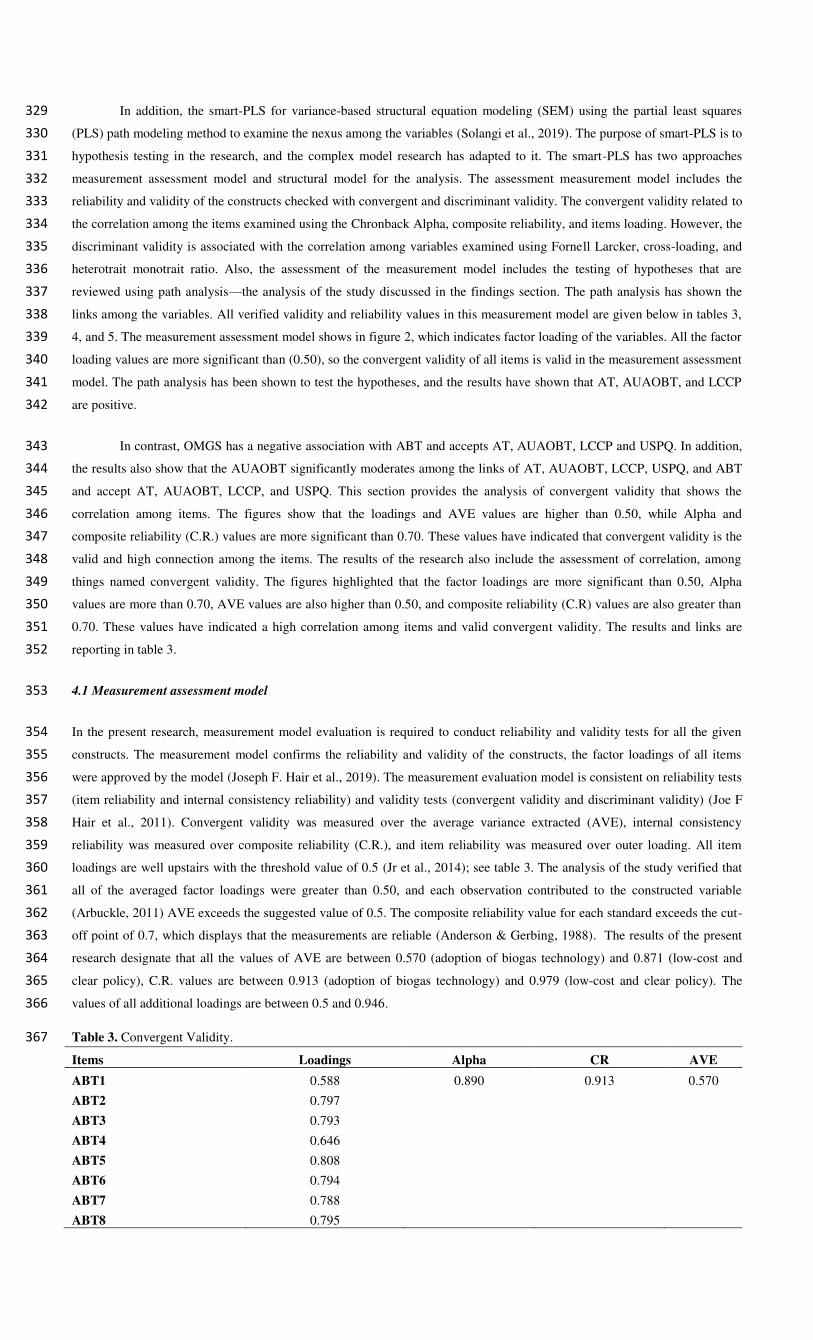
the low-cost and clear policy (LCCP) with seven things, user satisfaction and plant-quality with five things and adoption of 285
biogas technology (ABT) as a dependent variable with eight items and finally awareness and understanding of (AUAOBT) 286
as moderator variable with six items. These variables with links are shown in table 3. The goal was to gather responses from 287
the biogas plant users on three critical points at the time of investment in a biogas plant, i.e., operational matters and 288
maintenance, technical and skilled labor, and day-to-day operational tools used in biogas plants. In this study, a new research 289
questionnaire was developed and tested before applying by the author. The first part of the questionnaire covers the 290
satisfaction of biogas plants users. 291
In contrast, the second part of the online questionnaire is related to the investment of biogas plan and the most 292
favorable scenario for the satisfaction of biogas plant users. These questionnaires were sent online to owners of biogas plants 293
with enough knowledge about biogas plants' operation. This part also includes the operational and maintenance cost of biogas 294
plants and day-to-day plant expenses. Besides, the third part of the questionnaire is related to the technical and skilled labors 295
and trained owners of biogas plants. This study also used secondary data that was collected through research studies and 296
some existing published reports. 297
Table 2. Demographic profile. 298
Variables Characteristics Frequency Percentage
Gender Male
Female
44
7
86.27
13.5
Age Less than 25
26-30
31-40
41-55
56-65
65 and above
3
7
11
13
10
7
5.9
13.5
21.56
25.45
19.60
13.5
3.2 Instrument and variables measurement 299
Researchers have adopted all items from different previous literature in this research. Items based on the availability of 300
technicians for biogas plants were constructed from the study (Shahzad et al., 2020). Things regarding the operational and 301
maintenance government support were adopted from this research study (Afridi & Qammar, 2020). Items related to the low-302
cost and clear policy were assumed from (Słupek et al., 2020). Objects related to user satisfaction and plant quality were 303
constructed (Berhe et al., 2017). Items that belong to the awareness and understanding of AOBT were adopted (Z. Wang et 304
al., 2020). And finally, items related to the adoption of biogas technology were adopted from this study (Uhunamure et al., 305
2019). Two professional translators first translated all items adopted from the previous studies into the local language, i.e., 306
Urdu. After that, another translator converts these statements into English from the local language, given the suggestion of 307
(Brislin, 1970). There were no significant differences found in the translation, but a few grammatical mistakes ascended, 308
which were resolved. Finally, questionnaires for data collection were distributed in the home-grown language. 309
4. Data analysis and results 310
Our research employed the structural equation modelling (SEM) method for data analysis objectives (Irfan et al., 2021). The 311
study adopted this method to analyze the relational dimensions because it is a component-focused method (Sharma & Kim, 312
2010). PLS-SEM has frequent usage and appropriateness; that's why the author adopted it in this study; the subsequent 313
studies are evidence (Ying et al., 2020). Structural equation modelling (SEM) is more advantageous than other methods of 314
traditional statistical analysis. It is helpful for statistical analysis regarding efficiency, convenience, and accuracy (Franziska 315
et al., 2016). SEM covers the problems of first-generation analysis, but it is a second-generation technique. SEM can assist in 316
analyzing abundant variables at the same time because it is a multivariate analysis process. SEM is continuously popular in 317
business research because it can simultaneously deal with complex and multiple relationships (Chin & Newsted, 1999). 318
Variance-based SEM (VB-SBM) or partial least square (PLS)-SEM and covariance-based SEM (CB-SBM) are two well-319
known techniques of SEM (Henseler et al., 2009). The inappropriate adoption of analytical methods can cause inaccurate 320
conclusions; on the other hand, an appropriate statistical technique is most important for management and social science 321
research (Ramayah et al., 2010). Measurement and structural models are two-stage analysis approaches of PLS-SEM that 322
include measurement results in two steps (Osborne, 2010). Reliability and validity tests or the assessment of the inner model 323
is included in the measurement assessment model. Hypotheses/relationships testing or the evaluation of the outer model is 324
included, structural assessment model. The present research used PLS 3.0 software for primary data analysis and examined 325
the links among the understudy variables. Additionally, partial least square path modeling has higher statistical power than 326
covariance-based structural equation modeling. PLS-SEM is more advantageous to intercept relationships among the 327
variables. 328
Owner's education Under metric
Metric
Faculty of Arts
Bachelor
Master
18
9
11
7
6
35.29
17.64
21.56
13.5
11.76
Owner's experience 1-2 years
3-4 years
5-6 years
7-8 years
9-10 years
11- and above
21
11
7
5
3
4
41.17
21.56
13.5
9.8
5.9
7.8
Biogas plant names,
currently working
Floating drum
A mild-steel gas storage drum
inverted over the slurry
Fixed drum
Chinese fixed-dome plant
Janata model
Deenbandhu
Camartec model
9
8
7
12
9
6
17.64
15.68
13.5
23.52
17.64
11.76
In addition, the smart-PLS for variance-based structural equation modeling (SEM) using the partial least squares 329
(PLS) path modeling method to examine the nexus among the variables (Solangi et al., 2019). The purpose of smart-PLS is to 330
hypothesis testing in the research, and the complex model research has adapted to it. The smart-PLS has two approaches 331
measurement assessment model and structural model for the analysis. The assessment measurement model includes the 332
reliability and validity of the constructs checked with convergent and discriminant validity. The convergent validity related to 333
the correlation among the items examined using the Chronback Alpha, composite reliability, and items loading. However, the 334
discriminant validity is associated with the correlation among variables examined using Fornell Larcker, cross-loading, and 335
heterotrait monotrait ratio. Also, the assessment of the measurement model includes the testing of hypotheses that are 336
reviewed using path analysis—the analysis of the study discussed in the findings section. The path analysis has shown the 337
links among the variables. All verified validity and reliability values in this measurement model are given below in tables 3, 338
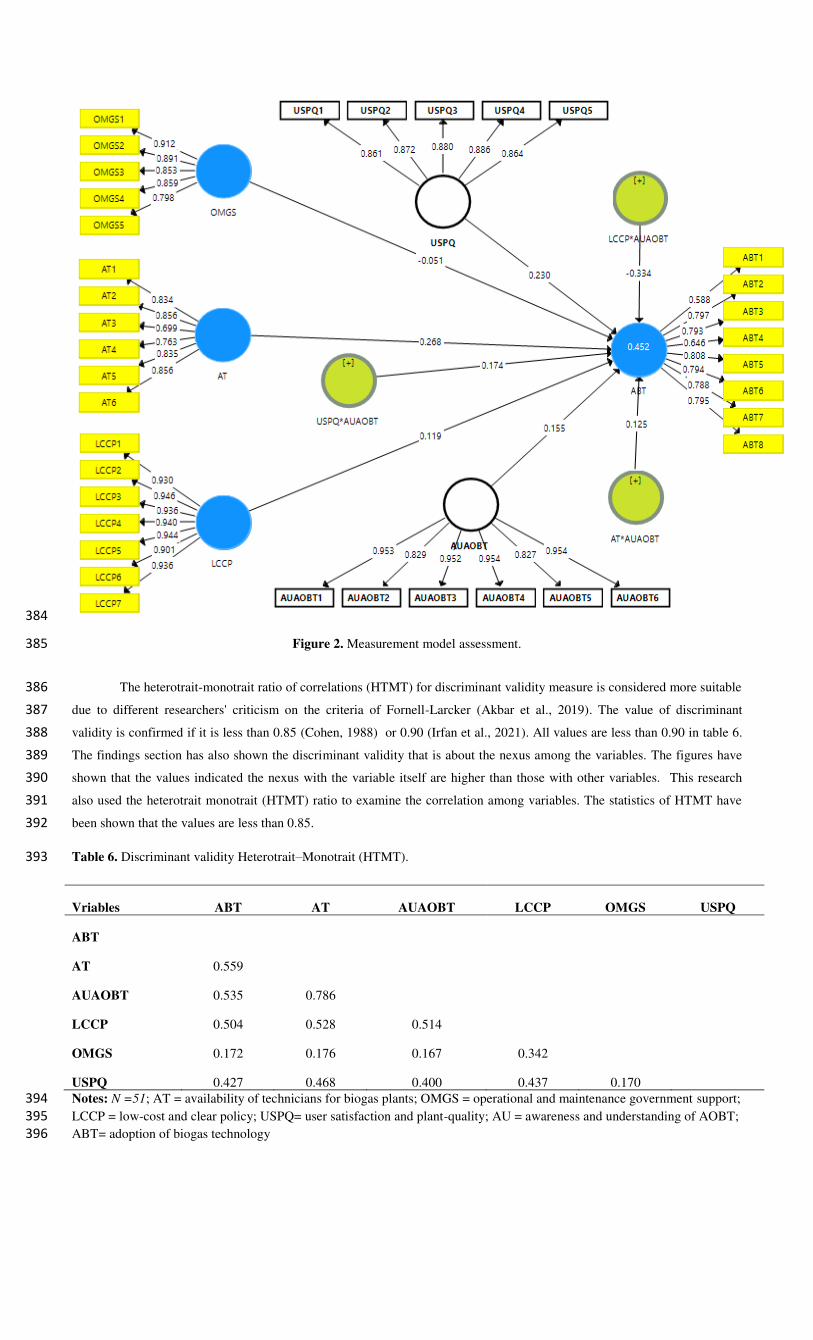
4, and 5. The measurement assessment model shows in figure 2, which indicates factor loading of the variables. All the factor 339
loading values are more significant than (0.50), so the convergent validity of all items is valid in the measurement assessment 340
model. The path analysis has been shown to test the hypotheses, and the results have shown that AT, AUAOBT, and LCCP 341
are positive. 342
In contrast, OMGS has a negative association with ABT and accepts AT, AUAOBT, LCCP and USPQ. In addition, 343
the results also show that the AUAOBT significantly moderates among the links of AT, AUAOBT, LCCP, USPQ, and ABT 344
and accept AT, AUAOBT, LCCP, and USPQ. This section provides the analysis of convergent validity that shows the 345
correlation among items. The figures show that the loadings and AVE values are higher than 0.50, while Alpha and 346
composite reliability (C.R.) values are more significant than 0.70. These values have indicated that convergent validity is the 347
valid and high connection among the items. The results of the research also include the assessment of correlation, among 348
things named convergent validity. The figures highlighted that the factor loadings are more significant than 0.50, Alpha 349
values are more than 0.70, AVE values are also higher than 0.50, and composite reliability (C.R) values are also greater than 350
0.70. These values have indicated a high correlation among items and valid convergent validity. The results and links are 351
reporting in table 3. 352
4.1 Measurement assessment model 353
In the present research, measurement model evaluation is required to conduct reliability and validity tests for all the given 354
constructs. The measurement model confirms the reliability and validity of the constructs, the factor loadings of all items 355
were approved by the model (Joseph F. Hair et al., 2019). The measurement evaluation model is consistent on reliability tests 356
(item reliability and internal consistency reliability) and validity tests (convergent validity and discriminant validity) (Joe F 357
Hair et al., 2011). Convergent validity was measured over the average variance extracted (AVE), internal consistency 358
reliability was measured over composite reliability (C.R.), and item reliability was measured over outer loading. All item 359
loadings are well upstairs with the threshold value of 0.5 (Jr et al., 2014); see table 3. The analysis of the study verified that 360
all of the averaged factor loadings were greater than 0.50, and each observation contributed to the constructed variable 361
(Arbuckle, 2011) AVE exceeds the suggested value of 0.5. The composite reliability value for each standard exceeds the cut-362
off point of 0.7, which displays that the measurements are reliable (Anderson & Gerbing, 1988). The results of the present 363
research designate that all the values of AVE are between 0.570 (adoption of biogas technology) and 0.871 (low-cost and 364
clear policy), C.R. values are between 0.913 (adoption of biogas technology) and 0.979 (low-cost and clear policy). The 365
values of all additional loadings are between 0.5 and 0.946. 366
Table 3. Convergent Validity. 367
Items Loadings Alpha CR AVE
ABT1 0.588 0.890 0.913 0.570
ABT2 0.797 ABT3 0.793 ABT4 0.646 ABT5 0.808 ABT6 0.794 ABT7 0.788 ABT8 0.795
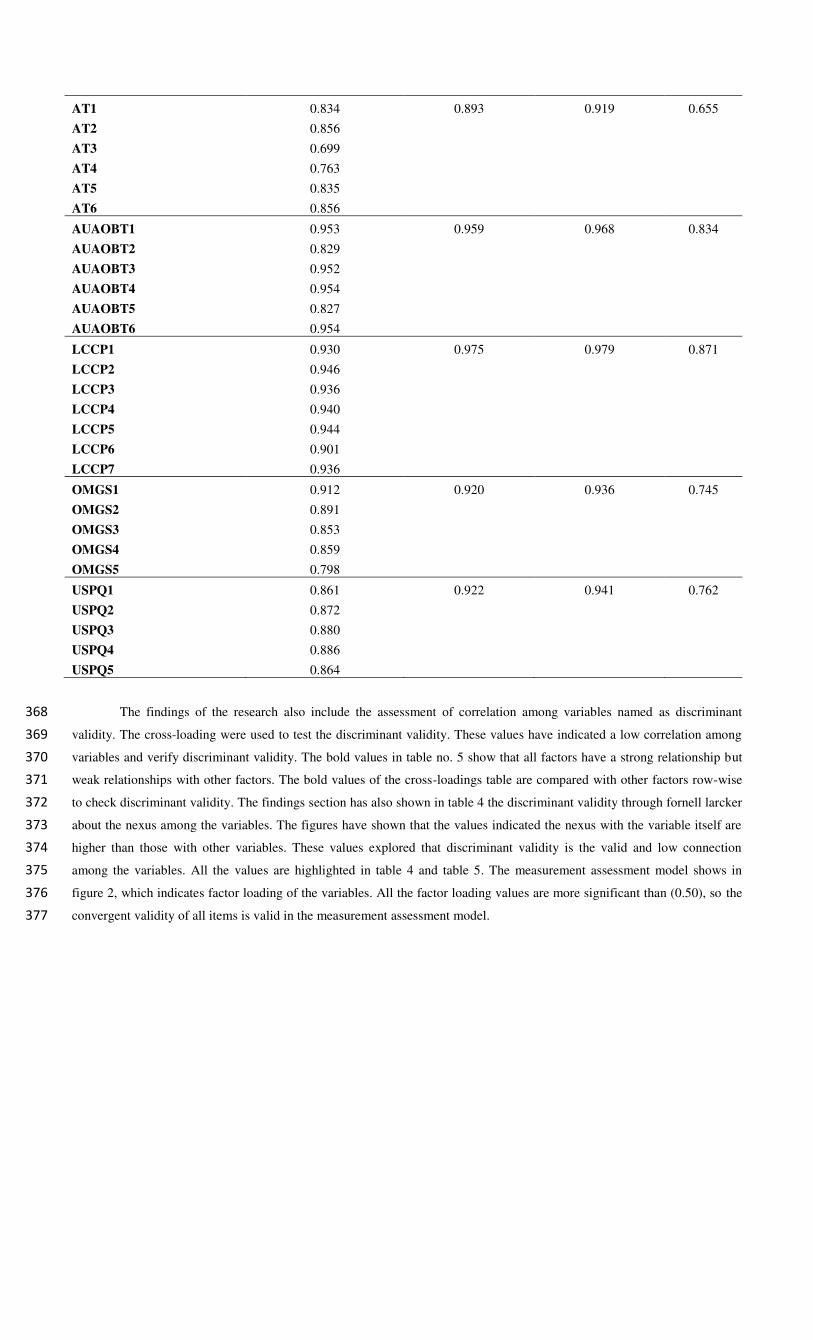
AT1 0.834 0.893 0.919 0.655
AT2 0.856 AT3 0.699 AT4 0.763 AT5 0.835 AT6 0.856
AUAOBT1 0.953 0.959 0.968 0.834
AUAOBT2 0.829 AUAOBT3 0.952 AUAOBT4 0.954 AUAOBT5 0.827 AUAOBT6 0.954
LCCP1 0.930 0.975 0.979 0.871
LCCP2 0.946 LCCP3 0.936 LCCP4 0.940 LCCP5 0.944 LCCP6 0.901 LCCP7 0.936
OMGS1 0.912 0.920 0.936 0.745
OMGS2 0.891 OMGS3 0.853 OMGS4 0.859 OMGS5 0.798
USPQ1 0.861 0.922 0.941 0.762
USPQ2 0.872 USPQ3 0.880 USPQ4 0.886 USPQ5 0.864
The findings of the research also include the assessment of correlation among variables named as discriminant 368
validity. The cross-loading were used to test the discriminant validity. These values have indicated a low correlation among 369
variables and verify discriminant validity. The bold values in table no. 5 show that all factors have a strong relationship but 370
weak relationships with other factors. The bold values of the cross-loadings table are compared with other factors row-wise 371
to check discriminant validity. The findings section has also shown in table 4 the discriminant validity through fornell larcker 372
about the nexus among the variables. The figures have shown that the values indicated the nexus with the variable itself are 373
higher than those with other variables. These values explored that discriminant validity is the valid and low connection 374
among the variables. All the values are highlighted in table 4 and table 5. The measurement assessment model shows in 375
figure 2, which indicates factor loading of the variables. All the factor loading values are more significant than (0.50), so the 376
convergent validity of all items is valid in the measurement assessment model. 377
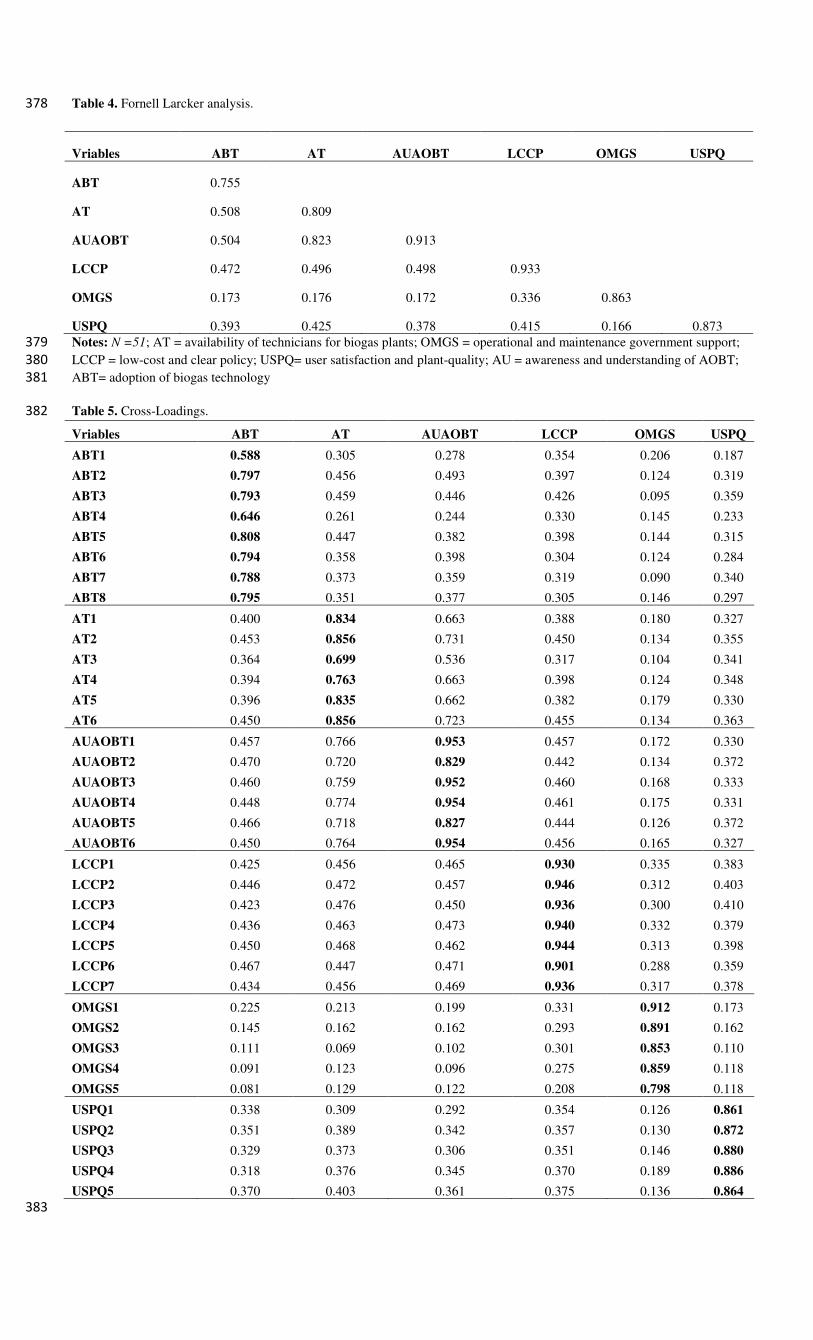
Table 4. Fornell Larcker analysis. 378
Vriables ABT AT AUAOBT LCCP OMGS USPQ
ABT 0.755
AT 0.508 0.809
AUAOBT 0.504 0.823 0.913
LCCP 0.472 0.496 0.498 0.933
OMGS 0.173 0.176 0.172 0.336 0.863
USPQ 0.393 0.425 0.378 0.415 0.166 0.873 Notes: N =51; AT = availability of technicians for biogas plants; OMGS = operational and maintenance government support; 379
LCCP = low-cost and clear policy; USPQ= user satisfaction and plant-quality; AU = awareness and understanding of AOBT; 380
ABT= adoption of biogas technology 381
Table 5. Cross-Loadings. 382
Vriables ABT AT AUAOBT LCCP OMGS USPQ
ABT1 0.588 0.305 0.278 0.354 0.206 0.187
ABT2 0.797 0.456 0.493 0.397 0.124 0.319
ABT3 0.793 0.459 0.446 0.426 0.095 0.359
ABT4 0.646 0.261 0.244 0.330 0.145 0.233
ABT5 0.808 0.447 0.382 0.398 0.144 0.315
ABT6 0.794 0.358 0.398 0.304 0.124 0.284
ABT7 0.788 0.373 0.359 0.319 0.090 0.340
ABT8 0.795 0.351 0.377 0.305 0.146 0.297
AT1 0.400 0.834 0.663 0.388 0.180 0.327
AT2 0.453 0.856 0.731 0.450 0.134 0.355
AT3 0.364 0.699 0.536 0.317 0.104 0.341
AT4 0.394 0.763 0.663 0.398 0.124 0.348
AT5 0.396 0.835 0.662 0.382 0.179 0.330
AT6 0.450 0.856 0.723 0.455 0.134 0.363
AUAOBT1 0.457 0.766 0.953 0.457 0.172 0.330
AUAOBT2 0.470 0.720 0.829 0.442 0.134 0.372
AUAOBT3 0.460 0.759 0.952 0.460 0.168 0.333
AUAOBT4 0.448 0.774 0.954 0.461 0.175 0.331
AUAOBT5 0.466 0.718 0.827 0.444 0.126 0.372
AUAOBT6 0.450 0.764 0.954 0.456 0.165 0.327
LCCP1 0.425 0.456 0.465 0.930 0.335 0.383
LCCP2 0.446 0.472 0.457 0.946 0.312 0.403
LCCP3 0.423 0.476 0.450 0.936 0.300 0.410
LCCP4 0.436 0.463 0.473 0.940 0.332 0.379
LCCP5 0.450 0.468 0.462 0.944 0.313 0.398
LCCP6 0.467 0.447 0.471 0.901 0.288 0.359
LCCP7 0.434 0.456 0.469 0.936 0.317 0.378
OMGS1 0.225 0.213 0.199 0.331 0.912 0.173
OMGS2 0.145 0.162 0.162 0.293 0.891 0.162
OMGS3 0.111 0.069 0.102 0.301 0.853 0.110
OMGS4 0.091 0.123 0.096 0.275 0.859 0.118
OMGS5 0.081 0.129 0.122 0.208 0.798 0.118
USPQ1 0.338 0.309 0.292 0.354 0.126 0.861
USPQ2 0.351 0.389 0.342 0.357 0.130 0.872
USPQ3 0.329 0.373 0.306 0.351 0.146 0.880
USPQ4 0.318 0.376 0.345 0.370 0.189 0.886
USPQ5 0.370 0.403 0.361 0.375 0.136 0.864
383
384
Figure 2. Measurement model assessment. 385
The heterotrait-monotrait ratio of correlations (HTMT) for discriminant validity measure is considered more suitable 386
due to different researchers' criticism on the criteria of Fornell-Larcker (Akbar et al., 2019). The value of discriminant 387
validity is confirmed if it is less than 0.85 (Cohen, 1988) or 0.90 (Irfan et al., 2021). All values are less than 0.90 in table 6. 388
The findings section has also shown the discriminant validity that is about the nexus among the variables. The figures have 389
shown that the values indicated the nexus with the variable itself are higher than those with other variables. This research 390
also used the heterotrait monotrait (HTMT) ratio to examine the correlation among variables. The statistics of HTMT have 391
been shown that the values are less than 0.85. 392
Table 6. Discriminant validity Heterotrait–Monotrait (HTMT). 393
Vriables ABT AT AUAOBT LCCP OMGS USPQ
ABT
AT 0.559
AUAOBT 0.535 0.786
LCCP 0.504 0.528 0.514
OMGS 0.172 0.176 0.167 0.342
USPQ 0.427 0.468 0.400 0.437 0.170 Notes: N =51; AT = availability of technicians for biogas plants; OMGS = operational and maintenance government support; 394
LCCP = low-cost and clear policy; USPQ= user satisfaction and plant-quality; AU = awareness and understanding of AOBT; 395
ABT= adoption of biogas technology 396
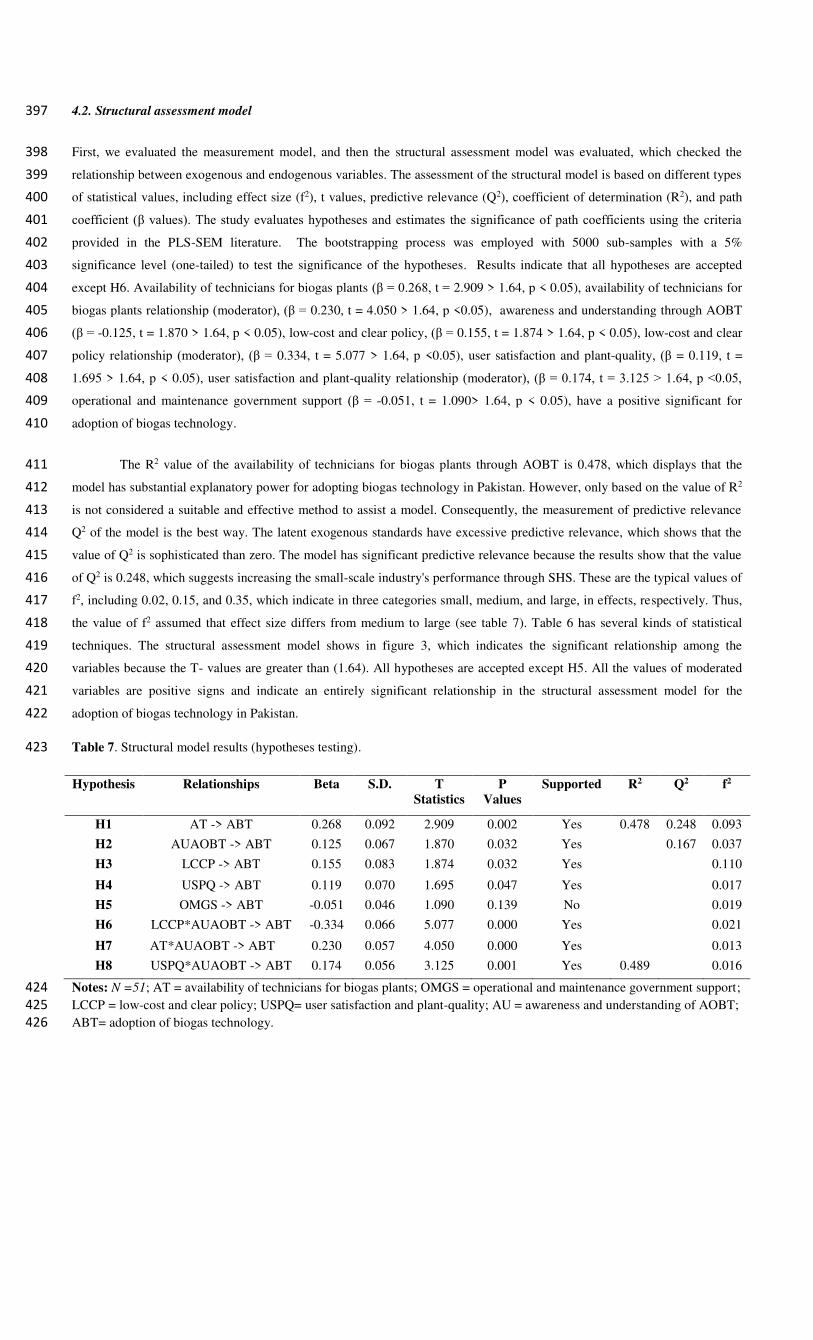
4.2. Structural assessment model 397
First, we evaluated the measurement model, and then the structural assessment model was evaluated, which checked the 398
relationship between exogenous and endogenous variables. The assessment of the structural model is based on different types 399
of statistical values, including effect size (f2), t values, predictive relevance (Q2), coefficient of determination (R2), and path 400
coefficient (β values). The study evaluates hypotheses and estimates the significance of path coefficients using the criteria 401
provided in the PLS-SEM literature. The bootstrapping process was employed with 5000 sub-samples with a 5% 402
significance level (one-tailed) to test the significance of the hypotheses. Results indicate that all hypotheses are accepted 403
except H6. Availability of technicians for biogas plants (β = 0.268, t = 2.909 > 1.64, p < 0.05), availability of technicians for 404
biogas plants relationship (moderator), (β = 0.230, t = 4.050 > 1.64, p <0.05), awareness and understanding through AOBT 405
(β = -0.125, t = 1.870 > 1.64, p < 0.05), low-cost and clear policy, (β = 0.155, t = 1.874 > 1.64, p < 0.05), low-cost and clear 406
policy relationship (moderator), (β = 0.334, t = 5.077 > 1.64, p <0.05), user satisfaction and plant-quality, (β = 0.119, t = 407
1.695 > 1.64, p < 0.05), user satisfaction and plant-quality relationship (moderator), (β = 0.174, t = 3.125 > 1.64, p <0.05, 408
operational and maintenance government support (β = -0.051, t = 1.090> 1.64, p < 0.05), have a positive significant for 409
adoption of biogas technology. 410
The R2 value of the availability of technicians for biogas plants through AOBT is 0.478, which displays that the 411
model has substantial explanatory power for adopting biogas technology in Pakistan. However, only based on the value of R2 412
is not considered a suitable and effective method to assist a model. Consequently, the measurement of predictive relevance 413
Q2 of the model is the best way. The latent exogenous standards have excessive predictive relevance, which shows that the 414
value of Q2 is sophisticated than zero. The model has significant predictive relevance because the results show that the value 415
of Q2 is 0.248, which suggests increasing the small-scale industry's performance through SHS. These are the typical values of 416
f2, including 0.02, 0.15, and 0.35, which indicate in three categories small, medium, and large, in effects, respectively. Thus, 417
the value of f2 assumed that effect size differs from medium to large (see table 7). Table 6 has several kinds of statistical 418
techniques. The structural assessment model shows in figure 3, which indicates the significant relationship among the 419
variables because the T- values are greater than (1.64). All hypotheses are accepted except H5. All the values of moderated 420
variables are positive signs and indicate an entirely significant relationship in the structural assessment model for the 421
adoption of biogas technology in Pakistan. 422
Table 7. Structural model results (hypotheses testing). 423
Hypothesis Relationships Beta S.D. T
Statistics
P
Values
Supported R2 Q2 f2
H1 AT -> ABT 0.268 0.092 2.909 0.002 Yes 0.478 0.248 0.093
H2 AUAOBT -> ABT 0.125 0.067 1.870 0.032 Yes 0.167 0.037
H3 LCCP -> ABT 0.155 0.083 1.874 0.032 Yes 0.110
H4 USPQ -> ABT 0.119 0.070 1.695 0.047 Yes 0.017
H5 OMGS -> ABT -0.051 0.046 1.090 0.139 No 0.019
H6 LCCP*AUAOBT -> ABT -0.334 0.066 5.077 0.000 Yes 0.021
H7 AT*AUAOBT -> ABT 0.230 0.057 4.050 0.000 Yes 0.013
H8 USPQ*AUAOBT -> ABT 0.174 0.056 3.125 0.001 Yes 0.489 0.016
Notes: N =51; AT = availability of technicians for biogas plants; OMGS = operational and maintenance government support; 424
LCCP = low-cost and clear policy; USPQ= user satisfaction and plant-quality; AU = awareness and understanding of AOBT; 425
ABT= adoption of biogas technology. 426
427
428
Figure 3. Structural model assessment. 429
The structural assessment model indicates the relationship of the variables because the T- values are more critical than 430
(1.64). The adoption of biogas technology is positive and significant for the availability of technicians for a biogas plant in 431
Pakistan. All the values of moderated variables have positive signs. They indicate an entirely substantial relationship in the 432
structural assessment model for adopting biogas technology to attract green FDI in Pakistan. 433
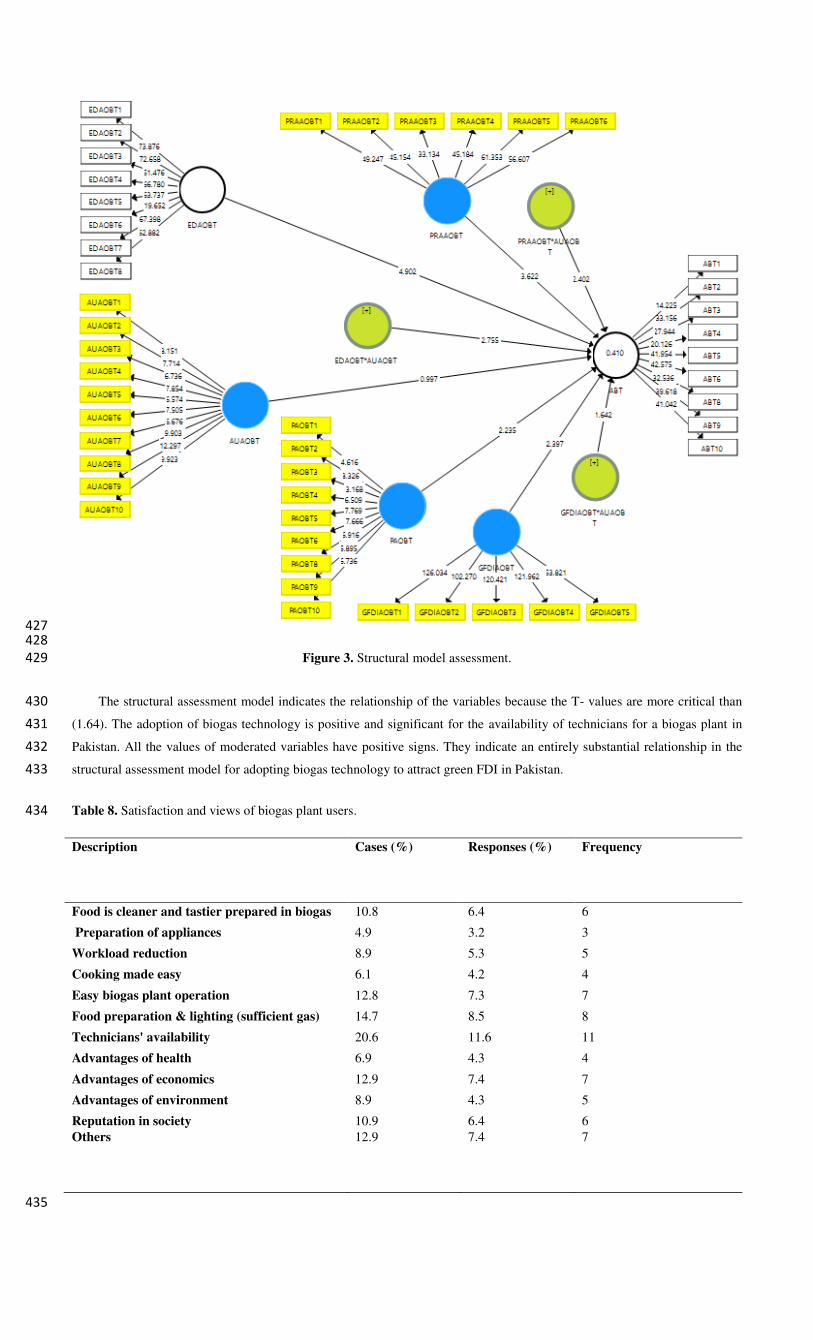
Table 8. Satisfaction and views of biogas plant users. 434
435
Description
Cases (%) Responses (%) Frequency
Food is cleaner and tastier prepared in biogas 10.8 6.4 6
Preparation of appliances 4.9 3.2 3
Workload reduction 8.9 5.3 5
Cooking made easy 6.1 4.2 4
Easy biogas plant operation 12.8 7.3 7
Food preparation & lighting (sufficient gas) 14.7 8.5 8
Technicians' availability 20.6 11.6 11
Advantages of health 6.9 4.3 4
Advantages of economics 12.9 7.4 7
Advantages of environment 8.9 4.3 5
Reputation in society 10.9 6.4 6 Others
12.9 7.4 7
Table 8 demonstrates the satisfaction and views of respondents from Pakistan for their biogas plants. The primary 436
reasons are the easy operation of biogas plant, availability of technicians, economic advantages, sufficient gas collection for 437
food preparation, gas used in lighting, and social reputation. The countries such as India, Nepal, and Bangladesh have 438
technical service availability as a sufficient driving force for social projects development generally (Breitenmoser et al., 439
2019). 64% of respondents said that adopting biogas technology needed user satisfaction with a biogas plant in Pakistan. 440
21% of respondents are expressed that a low-cost and straightforward policy is required for biogas technology, but 15% of 441
the respondents disclosed that user satisfaction and plant quality are also necessary. In excess half of biogas plants, user 442
respondents reported that their plants are functional and serviceable. 443
5. Important barriers and inspiring factors 444
The partial adaption of biogas plants is facing a list of various discouraging factors. Unavailability of technicians has the 445
highest response attributed to 16.8% while frequent operational problems were 13% and low pressure of biogas is another 446
problem. Many operational problems are facing by the biogas plants, such as deterioration of the steel parts, roof and walls 447
crack development of the biogas plants, and leakages of the gas pressure (Haile et al., 2019; Scheutz & Fredenslund, 2019). 448
The lowest pressure of biogas was 4.9% which is a severe issue to food for well cooking. Poor mixing in feed is the main 449
reason for the low pressure or biogas inside the reactor. The mechanism was stirring in biogas plants to improve the 450
requirement of gas pressure for the facilitation of end-user (Nsair et al., 2019). The complete dissatisfaction is indicated in the 451
second section of the table by the plant owners. The frequent technical problems are the reason to delay the operation of the 452
biogas plant, about which 21% of the owners complained. Correspondingly, to handle the biogas plant, the extra workload 453
was 15%, gas leakages were 13%, and technical support is equal to zero for biogas consumers. The users of biogas plants 454
feel failure and discouragement due to the contribution of these factors. The week's approval of technicians is attributed to the 455
project to the policy framework. 456
The sustainability of a biogas plant project negatively affects without a supporting system and technical assistance 457
running in the background (Pandyaswargo et al., 2019). The general problems include poor operation that linked 40% 458
including less or more water and dung. The case percentages 8%, 6%, and 4% and lower response percentages 3%, 2.7%, and 459
1.8% are the attachment of poor service, bio-slurry management issues, and un-sacred toilet during installation, respectively. 460
Table 9. Barriers and challenging factors 461
Variables Description Cases
(%)
Responses
(%)
Frequency
Reasons through which users are not fully satisfied with biogas plant
Insufficient gas to prepare food/lighting 7 9 12
Unavailability of technicians 9 11.7 16.7
Technical problems encounter frequently 7 9 8 Through extra workload 5 6.3 8.8 Biogas plant operational difficulty 3 3.7 4.9 Prepared food (not pleasant) 7 8 11.9 Others 5 6.3 8.9
Uncontrolled reasons for biogas plant
Complete work stops occasionally 7 6.5 12.8 To prepare food/lighting gas is Insufficient 8 8.4 14.7 Unavailability of technicians 9 9.5 16.7 Technical problems encounter frequently 11 11.5 19.8 Through extra workload 8 8.4 14.5 Food is not tasty prepared in biogas 7 7.5 12.5 Gas leakage difficulty 7 8 11.9 Stove's malfunctioning 5 5.3 8.7
Others 9 9.5 16.8 Main problems or common reasons of a biogas plant to work failure
Poor material applied for Construction 9.5 7.5 18.5 During installation poor service 5 3.4 8.7 Old/outdated design 10 7.6 18.7 Management issues as bio-slurry 4 3.2 6.9
Workload increasing 8 5.2 14.7 Poor maintenance 14 10.5 26.5
spare parts unavailability 11 8.4 20.7 Stove's malfunctioning 5 5.3 8.7 Empower local gas distribution authority in case availability of natural gas
7 5.4 12.8
Unavailability of the skilled operator of biogas plant 12 9 22.7 Poor operation with unbalanced Feed of water and dung 20 15.6 40.3 Natural disaster 10 7.7 18.7 Un-sacred attachment toilet 3 2.5 4.9 Bio-slurry obstruction in pipeline 11 8.4 20.7 condensed water made blockage of the pipeline 10 7.7 18.7
Others 16 16.9 30.5
6. Discussions and implications 462
The financial benefits of biogas technology are also evaluated in this study. 58% of respondents agree that they saved fuel 463
expenditure, whereas 42% of respondents did not agree with this view of point. In recent studies, low-, middle-income 464
countries reported fuel cost savings (Negri et al., 2020). Additionally, 38% of respondents reported a positive change in their 465
household financial status after biogas plant installation, while 53% of respondents had no change in their financial situation. 466
So, here this change is a feature to the number of family members and their expenditures. Joint families tend to save less, 467
while nuclear families kept more in rural Pakistan and supported each other by contributing equally. 53% of families could 468
not hold their money due to above mention reasons. The fully satisfied users have significantly reduced their expenditures 469
after the installation of a biogas plant. The reduction of expenses is considered a primary adaptive reason for the satisfaction 470
of partially satisfied users at a specific point. The biogas plant can solve and improve the household's financial status 471
indicated by this variable. Adapter for the environment has the significant benefits of cleanliness and fitness after installing 472
biogas plant and working in a fire accident as a substantial drop, free from illness correlated with deficiency of black kitchen 473
or dirt in-house and smoke. A significant decrease in fire accidents was highlighted by 33% of respondents. Freedom from 474
sickness was reported 15% correlated with deficiency and smoke of black dirt in kitchen and house, and 9% decided to 475
reduce everyday expenditures associated with fitness in response to the question. But the main benefits of biogas plants are 476
connected with cleanliness and healthiness. 43% of respondents were not responded to the question. 477
Our research findings offer valuable insights to rural people and government/ NGOs working in Pakistan. The study 478
suggests that biogas plants are very suitable for the rural areas of Punjab Pakistan to save their expenditures, to make 479
prosperity and economic development in these areas of Punjab. With the simultaneous implementation of biogas plants, the 480
government and NGOs should begin with motivation and complete information about the installation process to encourage 481
rural people and their prosperity. The results also suggested that the adoption of biogas plants has positive and significant 482
relationships with the availability of technicians and user satisfaction with plant quality in Pakistan. The owners of biogas 483
plants are required to complete operational guidelines for biogas plants to reduce their financial expenditure from the output 484
of plants. Moreover, the study findings demonstrate that skilled and trained owners get more financial and maintenance 485
benefits than non-skilled/untrained owners. The study also explored that biogas plants are more beneficial if technicians and 486
equipment are fully available. We also suggest that the government of Pakistan, INGOs/NGOs should improve the potion of 487
subsidies for biogas plants and economic development for the home-grown farmers. Most of the problems can solve if one 488
individual from the family of biogas plant owners is trained and can handle the maintenance issues to save their day-to-day 489
expenditures. The study suggested that biogas plants should be spread to other districts of Punjab rather than Faisalabad with 490
the government's support, INGOs/NGOs. 491
7. Conclusion and limitations 492
The globally well accepted and powerful source of RE is considered biogas. But Pakistan and other low-income countries 493
biogas has not received due to boosting rate. Although the government of Pakistan and some relevant INGO/NGO are trying 494
to make acceptable said technology by giving subsidies for biogas plants to home-grown farmers, the acceptance ratio is 495
meagre in rural areas and village communities. According to the choice theory of energy, the populations of this research area 496
expressed their interest in utilizing the biogas in native farms instead of in modern ways. Conversely, the main issue of 497
biogas plants was maintenance and operation. The major inspiring causes behind the installation and construction of biogas 498
plants include motivation from structure, social subsidy advantages, cases of existing biogas plant owners, and protection of 499
energy. Although, the significant reasons commonly include extra workload, gas leakages from connections, Insufficient gas 500
to prepare Food/lighting, complex biogas plant operations, technical problems, and unavailability of technicians. 501
Finally, the buyers did not facilitate the services after-sale from the construction and installation organizations or 502
bodies. Therefore, some recommendations are given to the Pakistani government to develop and promote biogas technology 503
in rural areas of Pakistan. Government should be planning a clear policy for short courses for operation, capacity building 504
sessions, technical support, and launching a media complaint about maintenance to develop biogas plants. The rural area of 505
Pakistan has great potential for biogas technology to overcome domestic energy shortages. Consequently, some training steps 506
should be taken by the relevant NGO/INGO and the government of Pakistan for sustainable project development, 507
maintenance, and smooth operation of biogas plants in the rural areas. Hence, government institutions of Pakistan and 508
relevant INGO/NGO should be arranged skilled technicians, technical centres and provide the appropriate installation of 509
biogas plants to the consumer after-sales service. 510
Declarations 511
• Ethics approval and consent to participate: Not applicable 512
• Consent for publication: Not applicable 513
• Availability of data and materials: All data generated or analyzed during this study are included in this article. 514
• Competing interests: The authors declare that they have no competing interests. 515
• Funding: This work is supported by Beijing Natural Science Foundation (8192043). 516
• Authors' contributions: S. Ali: Conceptualization, writing-original draft, formal analysis, data handling, and 517
methodology. Q. Yan: Supervision, funding acquisition. R.M. Elavarasan: Writing-review and editing, M. Irfan: 518
Writing-review and editing, variable construction. K.R. Abbasi: Writing-review and editing, C. Işik: Writing-review 519
and editing. 520
References 521
Abbas, I., Liu, J., Noor, R. S., Faheem, M., & Farhan, M. (2020). Development and performance evaluation of small size 522
household portable biogas plant for domestic use Development and performance evaluation of small size household 523
portable biogas plant for domestic use. Biomass Conversion and Biorefinery, 133, 1–13. 524
https://doi.org/10.1007/s13399-020-00956-y 525
Abbas, T., Ali, G., Ali, S., Khalid, M., & Asif, M. (2017). Economic analysis of biogas adoption technology by rural 526
farmers : The case of Faisalabad district in Pakistan. Renewable Energy, 107, 431–439. 527
https://doi.org/10.1016/j.renene.2017.01.060 528
Afridi, Z. U. R., & Qammar, N. W. (2020). Technical challenges and optimization of biogas plants. ChemBioEng Reviews, 529
7(4), 119–129. https://doi.org/10.1002/cben.202000005 530
Akbar, A., Ali, S., Ahmad, M. A., Akbar, M., & Danish, M. (2019). Understanding the antecedents of organic food 531
consumption in pakistan: Moderating role of food neophobia. International Journal of Environmental Research and 532
Public Health, 16(20). https://doi.org/10.3390/ijerph16204043 533
Alvi, J., Ashraf, I., Ch, K. M., & Iftikhar, M. (2015). Impact of livestock in uplifting rural livelihood. Pakistan Journal of 534
Agricultural Research, 28(3), 287–294. https://doi.org/.../j_75.pdf 535
Amir, S. M., Liu, Y., Shah, A. A., Khayyam, U., & Mahmood, Z. (2019). Empirical study on influencing factors of biogas 536
technology adoption in Khyber. Energy & Environment, 31(2), 308–329. https://doi.org/10.1177/0958305X19865536 537
Anderson, J. C., & Gerbing, D. W. (1988). Structural equation modeling in practice : A review and recommended two-step 538
approach. Psychological Bulletin, 103(3), 411–423. 539
Anieting, A. E., & Mosugu, J. K. (2017). Comparison of quota sampling and snowball sampling. An International 540
Multidisciplinary Research E-Journal, 3(3), 33–36. 541
Arbuckle, J. L. (2011). IBM SPSS Amos 20 user's guide." Amos development corporation, SPSS Inc. 542
Arshad, M., Bano, I., Khan, N., Imran, M., & Younus, M. (2018). Electricity generation from biogas of poultry waste : An 543
assessment of potential and feasibility in Pakistan electricity generation from biogas of poultry waste : An assessment 544
of potential and feasibility in Pakistan. Renewable and Sustainable Energy Reviewseviews, 81, 1241–1246. 545
https://doi.org/10.1016/j.rser.2017.09.007 546
Ashraf, S., Luqman, M., Yousaf, Z., & Yaqoob, A. (2019). Determinants of Biogas Technology Adoption in Pakistan. 2, 547
113–123. 548
Bates, M. N., Pope, K., Ram, T., Pokhrel, A. K., Pillarisetti, A., Lam, N. L., & Verma, S. C. (2019). Household fuel use and 549
pulmonary tuberculosis in western Nepal : A case- control study. Environmental Research, 168(September 2018), 193–550
205. https://doi.org/10.1016/j.envres.2018.09.036 551
Berhe, T. G., Tesfahuney, R. G., Desta, G. A., & Mekonnen, L. S. (2017). Biogas plant distribution for rural household 552
sustainable energy supply in Africa. Energy and Policy Research, 4(1), 10–20. 553
https://doi.org/10.1080/23815639.2017.1280432 554
Breitenmoser, L., Gross, T., Huesch, R., Rau, J., Dhar, H., Kumar, S., Hugi, C., & Wintgens, T. (2019). Anaerobic digestion 555
of biowastes in India: Opportunities, challenges and research needs. Journal of Environmental Management, 236, 396–556
412. https://doi.org/10.1016/j.jenvman.2018.12.014 557
Brislin, R. W. (1970). Back-translation for cross-cultural research. Journal of Cross-Cultural Psychology, 1(3), 185–216. 558
https://doi.org/10.1177/135910457000100301 559
Carmona, L. G., Whiting, K., Wiedenhofer, D., Krausmann, F., & Sousa, T. (2021). Resource use and economic 560
development: an exergy perspective on energy and material flows and stocks from 1900 to 2010. Resources, 561
Conservation and Recycling, 165. https://doi.org/10.1016/j.resconrec.2020.105226 562
Chandio, A. A., Yuansheng, J., & Magsi, H. (2017). Analysis of agricultural sub sectors contribution growth rate in the 563
agriculture GDP growth rate of Pakistan Agricultural Sub-Sectors Performance : An Analysis of Sector-Wise Share in 564
Agriculture GDP of Pakistan. April. https://doi.org/10.5539/ijef.v8n2p156 565
Chin, W., & Newsted, P. R. (1999). Structural equation modeling analysis with small samples using partial least squares. 566
Statistical Strategies for Small Sample Research, 1(1), 307–341. 567
Cohen, J. (1988). Statistical power analysis for the behavioral sciences New York. NY: Academic. 568
Cucchiella, F., Adamo, I. D., & Gastaldi, M. (2019). An economic analysis of biogas-biomethane chain from animal residues 569
in Italy. Journal of Cleaner Production, 230, 888–897. https://doi.org/10.1016/j.jclepro.2019.05.116 570
Duan, C., & Chen, B. (2017). Energy–water nexus of international energy trade of China. Applied Energy, 194, 725–734. 571
https://doi.org/10.1016/j.apenergy.2016.05.139 572
Franziska, R. N., Carrion, G. C., Roldán, J. L., & Ringle, C. M. (2016). European management research using partial least 573
squares structural equation modeling (PLS-SEM). European Management Journal, 34(6), 589–597. 574
Gao, M., Wang, D., Wang, H., Wang, X., & Feng, Y. (2019). Biogas potential , utilization and countermeasures in 575
agricultural provinces : A case study of biogas development in Henan Province , China. Renewable and Sustainable 576
Energy Reviews, 99, 191–200. https://doi.org/10.1016/j.rser.2018.10.005 577
Gautam, N. P., Chhetri, B. B. K., Raut, N. K., Tigabu, M., Raut, N., Rashid, M. H. U., Ma, X., & Wu, P. (2020). Do 578
earthquakes change the timber and firewood use pattern of the forest dependent households? Evidence from rural hills 579
in Nepal. Forest Policy and Economics, 119. https://doi.org/10.1016/j.forpol.2020.102283 580
Gebreegziabher, Z., Beyene, A. D., Bluffstone, R., Martinsson, P., Mekonnen, A., & Toman, M. A. (2018). Fuel savings, 581
cooking time and user satisfaction with improved biomass cookstoves: Evidence from controlled cooking tests in 582
Ethiopia. Resource and Energy Economics, 52, 173–185. https://doi.org/10.1016/j.reseneeco.2018.01.006 583
GoP. (2020). Energy year book edited by HDIP. Pakistan. Economic survey of Pakistan. 2020. in Finance Division (Ed.), 584
Government of Pakistan. Islamabad, Pakistan. 585
Govender, I., Thopil, G. A., & Inglesi-Lotz., R. (2019). Financial and Economic Appraisal of a Biogas to Electricity Project. 586
Journal of Cleaner Production, 214, 154–165. https://doi.org/10.1016/j.jclepro.2018.12.290 587
Haile, K., Emil, T., & Termansen, M. (2019). Impact of biogas plants on rural residential property values and implications for 588
local acceptance. Energy Policy, 129, 1121–1131. https://doi.org/10.1016/j.enpol.2019.03.008 589
Hair, Joe F, Ringle, C. M., & Sarstedt, M. (2011). PLS-SEM : Indeed a Silver Bullet. Journal of Marketing Theory and 590
Practice, 19(2), 139–151. https://doi.org/10.2753/MTP1069-6679190202 591
Hair, Joseph F., Risher, J. J., Sarstedt, M., & Ringle, C. M. (2019). When to use and how to report the results of PLS-SEM. 592
European Business Review, 31(1), 2–24. https://doi.org/10.1108/EBR-11-2018-0203 593
Hasan, A. S. M. M., Kabir, A., Hoq, T., Johansson, M. T., & Thollander, P. (2020). Drivers and barriers to the 594
implementation of biogas technologies in Bangladesh. Biofuels, 0(0), 1–13. 595
https://doi.org/10.1080/17597269.2020.1841362 596
Henseler, J., Ringle, C. M., & Sinkovics, R. R. (2009). The use of partial least squares path modeling in international 597
marketing. Advances in International Marketing, 20, 277–319. https://doi.org/10.1108/S1474-7979(2009)0000020014 598
Ikram, M., Sroufe, R., Rehman, E., Shah, S. Z. A., & Mahmoudi, A. (2020). Do quality , environment , social ( QES ) 599
certifications improve international trade ? Comparative grey relation anal ... related papers. Physica A: Statistical 600
Mechanics and Its Applications, 545. https://doi.org/10.1016/j.physa.2019.123486 601
Iqbal, T., Dong, C. Q., Lu, Q., Ali, Z., Khan, I., Hussain, Z., & Abbas, A. (2018). Sketching Pakistan's energy dynamics: 602
prospects of biomass energy. Journal of Renewable and Sustainable Energy, 10(2). https://doi.org/10.1063/1.5010393 603
Irfan, M., Elavarasan, R. M., Hao, Y., Feng, M., & Sailan, D. (2021). An assessment of consumers' willingness to utilize 604
solar energy in China: End-users' perspective. Journal of Cleaner Production, 292, 126008. 605
https://doi.org/10.1016/j.jclepro.2021.126008 606
Irfan, M., Zhao, Z. Y., Panjwani, M. K., Mangi, F. H., Li, H., Jan, A., Ahmad, M., & Rehman, A. (2020). Assessing the 607
energy dynamics of Pakistan: Prospects of biomass energy. Energy Reports, 6, 80–93. 608
https://doi.org/10.1016/j.egyr.2019.11.161 609
Jan, I., & Akram, W. (2018). Willingness of rural communities to adopt biogas systems in Pakistan: Critical factors and 610
policy implications. Renewable and Sustainable Snergy Reviews, 81(2), 3178–3185. 611
https://doi.org/10.1016/j.rser.2017.03.141 612
Jan, M. I. (2017). Adoption of Biogas: A Story from Rural Pakistan. 613
Jarrar, L., Ayadi, O., & Al Asfar, J. (2020). Techno-economic aspects of electricity generation from a farm based biogas 614
plant. Journal of Sustainable Development of Energy, Water and Environment Systems, 8(3), 476–492. 615
https://doi.org/10.13044/j.sdewes.d7.0302 616
Javed, M. S., Raza, R., Hassan, I., Saeed, R., Shaheen, N., Iqbal, J., Shaukat, S. F., Javed, M. S., Raza, R., & Hassan, I. 617
(2016). The energy crisis in Pakistan : A possible solution via biomass-based waste. 043102. 618
https://doi.org/10.1063/1.4959974 619
Jr, J. F. H., Marko, S., Hopkins, L., & Kuppelwieser, V. G. (2014). Partial least squares structural equation modeling ( PLS-620
SEM ): An emerging tool in business research. European Business Review, 26(2), 106–121. 621
https://doi.org/10.1108/EBR-10-2013-0128 622
Kamran, M. (2018). Current status and future success of renewable energy in Pakistan. Renewable and Sustainable Energy 623
Reviews, 82, 609–617. https://doi.org/10.1016/j.rser.2017.09.049 624
Marion, H., Jr, M., Xie, W., Liang, J., Mao, H., Lei, H., Ruan, R., & Bu, Q. (2017). A Techno-economic Evaluation of 625
Anaerobic Biogas Producing Systems in Developing Countries. Bioresource Technology. 626
https://doi.org/10.1016/j.biortech.2017.12.013 627
Mikhail, J., Gallego-schmid, A., Stamford, L., & Azapagic, A. (2020). Science of the total environment environmental 628
sustainability of cooking fuels in remote communities : Life cycle and local impacts. Science of the Total Environment, 629
713. https://doi.org/10.1016/j.scitotenv.2019.136445 630
Mushtaq, K., Zaidi, A. A., & Jawid, S. (2016). Design and performance analysis of floating dome type portable biogas plant 631
for domestic use in Pakistan. SUSTAINABLE ENERGY TECHNOLOGIES AND ASSESSMENTS, 14, 21–25. 632
https://doi.org/10.1016/j.seta.2016.01.001 633
Naz, S., & Khan, N. (2018). Financial contribution of livestock at household level in federally administered tribal areas of 634
Pakistan: An empirical perspective. Sarhad Journal of Agriculture, 34(1), 1–9. 635
https://doi.org/10.17582/journal.sja/2018/34.1.1.9 636
Negri, C., Ricci, M., Zilio, M., D’Imporzano, G., Qiao, W., Dong, R., & Adani, F. (2020). Anaerobic digestion of food waste 637
for bio-energy production in China and Southeast Asia: A review. Renewable and Sustainable Energy Reviews, 133. 638
https://doi.org/10.1016/j.rser.2020.110138 639
Nevzorova, T., & Kutcherov, V. (2019). Barriers to the wider implementation of biogas as a source of energy : A state-of-the-640
art review. Energy Strategy Reviews, 26, 100414. https://doi.org/10.1016/j.esr.2019.100414 641
Nsair, A., Önen Cinar, S., Abu Qdais, H., & Kuchta, K. (2019). Optimizing the performance of a large scale biogas plant by 642
controlling stirring process: A case study. Energy Conversion and Management, 198. 643
https://doi.org/10.1016/j.enconman.2019.111931 644
Osborne, J. W. (2010). Improving your data transformations: Applying the Box-Cox transformation. Practical Assessment, 645
Research and Evaluation, 15(12). https://doi.org/10.7275/qbpc-gk17 646
Oyeleke, O. J., & Akinlo, T. (2019). Energy generation and economic growth : empirical evidence from Nigeria. 647
Environment, Development and Sustainability, 301(22), 7177–7191. https://doi.org/10.1007/s10668-019-00476-4 648
Ozoh, O. B., Okwor, T. J., Adetona, O., Akinkugbe, A. O., Amadi, C. E., Esezobor, C., Adeyeye, O. O., Ojo, O., Nwude, V. 649
N., & Mortimer, K. (2018). Cooking fuels in lagos, Nigeria: Factors associated with household choice of kerosene or 650
liquefied petroleum gas (LPG). International Journal of Environmental Research and Public Health, 15(4), 1–13. 651
https://doi.org/10.3390/ijerph15040641 652
Pandyaswargo, A. H., Gamaralalage, P. J. D., Liu, C., Knaus, M., Onoda, H., Mahichi, F., & Guo, Y. (2019). Challenges and 653
an implementation framework for sustainable municipal organic waste management using biogas technology in 654
emerging Asian countries. Sustainability (Switzerland), 11(22). https://doi.org/10.3390/su11226331 655
Pilloni, M., Hamed, T. A., & Joyce, S. (2020). Assessing the success and failure of biogas units in Israel: Social niches, 656
practices, and transitions among Bedouin villages. Energy Research and Social Science, 61. 657
https://doi.org/10.1016/j.erss.2019.101328 658
Puzzolo, E., Pope, D., Stanistreet, D., Rehfuess, E. A., & Bruce, N. G. (2016). Clean fuels for resource-poor settings: A 659
systematic review of barriers and enablers to adoption and sustained use. Environmental Research, 146, 218–234. 660
https://doi.org/10.1016/j.envres.2016.01.002 661
Ramayah, T., Ahmad, N. H., Halim, H. A., Rohaida, S., Zainal, M., & Lo, M. (2010). Discriminant analysis: An illustrated 662
example. African Journal of Business Management, 4(9), 1654–1667. https://doi.org/10.5897/AJBM.9000211 663
Rehman, A., Jingdong, L., Chandio, A. A., & Hussain, I. (2017). Livestock Production and Population Census in Pakistan : 664
Determining Their Relationship with Agricultural GDP Using Econometric Analysis. Information Processing in 665
Agriculture. https://doi.org/10.1016/j.inpa.2017.03.002 666
Rosenthal, J., Quinn, A., Grieshop, A. P., Pillarisetti, A., & Glass, R. I. (2018). Energy for Sustainable Development Clean 667
cooking and the SDGs : Integrated analytical approaches to guide energy interventions for health and environment 668
goals ☆ , ☆☆. Energy for Sustainable Development, 42, 152–159. https://doi.org/10.1016/j.esd.2017.11.003 669
Scheutz, C., & Fredenslund, A. M. (2019). Total methane emission rates and losses from 23 biogas plants. Waste 670
Management, 97, 38–46. https://doi.org/10.1016/j.wasman.2019.07.029 671
Shah, A. A. L. I., & Sahito, A. R. (2017). Appraisal of Biogas Potential of Biogas from Animal Dung in Saeedabad, 672
Pakistan. 36(3), 707–718. 673
Shahzad, H. U., Mustafa, M. F., & Afridi, Z. U. (2020). Challenges and potential to adopt biogas technology: A case study of 674
Faisalabad, Pakistan. International Journal of Agricultural Extension, 8(3), 207–217. 675
https://doi.org/10.33687/ijae.008.03.3391 676
Sharma, P. N., & Kim, K. H. (2010). Structural equation modeling in information systems research using Partial Least 677
Squares. International Conference on Information Systems, ICIS 2012, 11(2), 5–40. https://doi.org/228467554 678
Słupek, E., Makoś, P., & Gȩbicki, J. (2020). Theoretical and economic evaluation of low-cost deep eutectic solvents for 679
effective biogas upgrading to bio-methane. Energies, 13(13). https://doi.org/10.3390/en13133379 680
Solangi, Y. A., Shah, S. A. A., Zameer, H., Ikram, M., & Saracoglu, B. O. (2019). Assessing the solar PV power project site 681
selection in Pakistan : Based on AHP-fuzzy vikor approach. Environmental Science and Pollution Research, 26(29), 682
30286–30302. https://doi.org/10.1007/s11356-019-06172-0 683
Tumusiime, E., Kirabira, J. B., & Musinguzi, W. B. (2019). Long-life performance of biogas systems for productive 684
applications : The role of R & D and policy. Energy Reports, 5, 579–583. https://doi.org/10.1016/j.egyr.2019.05.002 685
Uddin, W., Khan, B., Shaukat, N., Majid, M., Mujtaba, G., Mehmood, A., Ali, S. M., Younas, U., Anwar, M., & Almeshal, 686
A. M. (2016). Biogas potential for electric power generation in Pakistan : A survey. Renewable and Sustainable Energy 687
Reviews, 54, 25–33. https://doi.org/10.1016/j.rser.2015.09.083 688
Uhunamure, S. E., Nethengwe, N. S., & Tinarwo, D. (2019). Correlating the factors influencing household decisions on 689
adoption and utilisation of biogas technology in South Africa. Renewable and Sustainable Energy Reviews, 107, 264–690
273. https://doi.org/10.1016/j.rser.2019.03.006 691
Ur, Z., Afridi, R., Jing, W., & Younas, H. (2019). Biogas Production and Fundamental Mass Transfer Mechanism in 692
Anaerobic Granular Sludge. Ic, 1–15. 693
Wang, Y., Xu, L., & Solangi, Y. A. (2020). Strategic renewable energy resources selection for Pakistan: Based on SWOT-694
Fuzzy AHP approach. Sustainable Cities and Society, 52. https://doi.org/10.1016/j.scs.2019.101861 695
Wang, Z., Ali, S., Akbar, A., & Rasool, F. (2020). Determining the influencing factors of biogas technology adoption 696
intention in Pakistan: The moderating role of social media. International Journal of Environmental Research and 697
Public Health, 17(7). https://doi.org/10.3390/ijerph17072311 698
Yaqoo, H., Teoh, Y. H., Din, Z. U., Sabah, N. U., Jamil, M. A., Mujtaba, M. A., & Abid, A. (2021). The potential of 699
sustainable biogas production from biomass waste for power generation in Pakistan. Journal of Cleaner Production, 700
307. https://doi.org/10.1016/j.jclepro.2021.127250 701
Yasar, A., Nazir, S., Rasheed, R., Tabinda, A. B., & Nazar, M. (2017). Economic review of different designs of biogas plants 702
at household level in Pakistan. Renewable and Sustainable Energy Reviews, 74, 221–229. 703
https://doi.org/10.1016/j.rser.2017.01.128 704
Yasmin, N., & Grundmann, P. (2019). Adoption and diffusion of renewable energy – The case of biogas as alternative fuel 705
for cooking in Pakistan. Renewable and Sustainable Energy Reviews, 101(August 2018), 255–264. 706
https://doi.org/10.1016/j.rser.2018.10.011 707
Ying, M., Faraz, N. A., Ahmed, F., & Raza, A. (2020). How does servant leadership foster employees' voluntary green 708
behavior? A sequential mediation model. International Journal of Environmental Research and Public Health, 17(5). 709
https://doi.org/10.3390/ijerph17051792 710
Zambon, I. (2017). Costs-benefits analysis Of a small- scale biogas plant and electric energy production related papers. 711
Bulgarian Journal of Agricultural Science, 23(3), 357–362. 712