modelling biodiversity indicators using the cce background database cce workshop rome 2014 gert jan...
TRANSCRIPT

Modelling biodiversity indicators using the CCE background database
CCE workshop Rome 2014
Gert Jan Reinds, Luc Bonten, Janet Mol, Wieger Wamelink, Max Posch (CCE)
Klik op het pictogram als u een afbeelding wilt toevoegen

Introduction
Introduction
Methods
●Selection of sites
●Vegetation modelling
Results
Conclusions

Introduction
To support the ongoing development on soil-vegetation modelling we applied VSD+-PROPS to sites in Europe
We tested modelling concepts and robustness
We discuss how one could proceed
Its still somewhat preliminary...
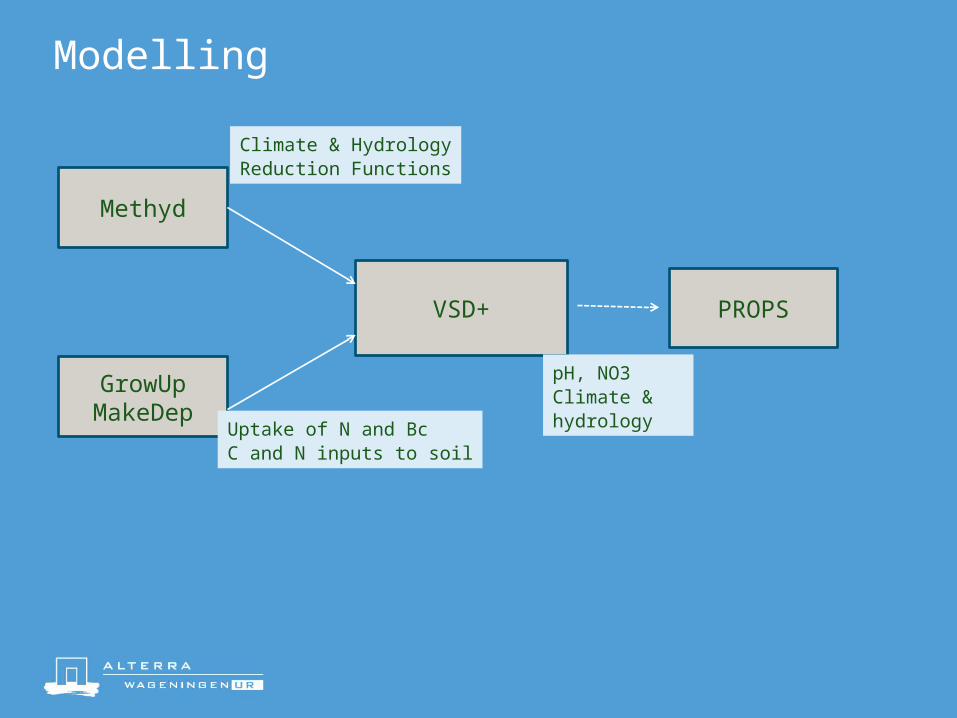
Modelling
VSD+
Methyd
GrowUpMakeDep
PROPS
Climate & HydrologyReduction Functions
Uptake of N and BcC and N inputs to soil
pH, NO3Climate & hydrology

Methods: selecting sites

Selecting sites
The 2014 call for data states:
(1) … selects (at least) two sites within every (level-3) EUNIS class present in the country for which the chosen soil-vegetation model can calibrated
(2) … selects the endpoint pertinent to the site and a corresponding biodiversity indicator;
(3) …runs the model with the background and the GP depositions to 2100 (provided by the CCE);
(4) …reports the indicator values and other variables computed for 2100 to the CCE

Selecting sites from the EU background data base
1. Select the dominant vegetation type for decidious forest, conifers forest and grassland/heathland
2. Find two EMEP cells in each country were this vegetation type occurs, one with a low and one with a high deposition
3. Find in these EMEP cells the units for VSD+ with the proper vegetation type (broadleaves, conifers, natural vegetation).
4. Compute SMB critical loads for these sites
5. Select from those VSD+ sites a sensitive site (with a CL(N),CL(S) closest to the 5th percentile CL of the country)

VSD+ application
Spatial data bases on soils, land cover ...
Outputs from MetHyd (climate and hydrology and reduction functions for Nmi and Nde) and GrowUp (uptake and litterfall)
Soil chemistry data: transfer functions using soil type and soil texture and parent material class (as in VSD)
Mineralisation constants and C/N ratios of the C-pools from calibration of VSD+ (on sites and chronosequences)
Drivers: deposition of N, S and BC from EMEP models, climate change according to A1b scenario or constant climate.
Initial C-pool, initial C/N ratio and exchange constants from calibration

VSD+ calibration
We calibrated initial Cpool,initial C/N ratio and exchange constants.
We estimated ‘observed’ C/N , Cpool and Bsat as a function of soil type, texture, vegetation type and country based on existing European data bases (like ICP-F level I with 6000 sites)
We used standard Bayesian calibration

Methods: biotic modelling

Vegetation modelling with PROPS
For each site we created a species list based on the vegetation type (as in VSD+Studio)
We run PROPS for each sites and compute the various diversity indices (Shannon, Simpson, Bray-Curtis, Habitat quality)

Results

Climate change

Abiotic conditions;pH

Abiotic conditions; N
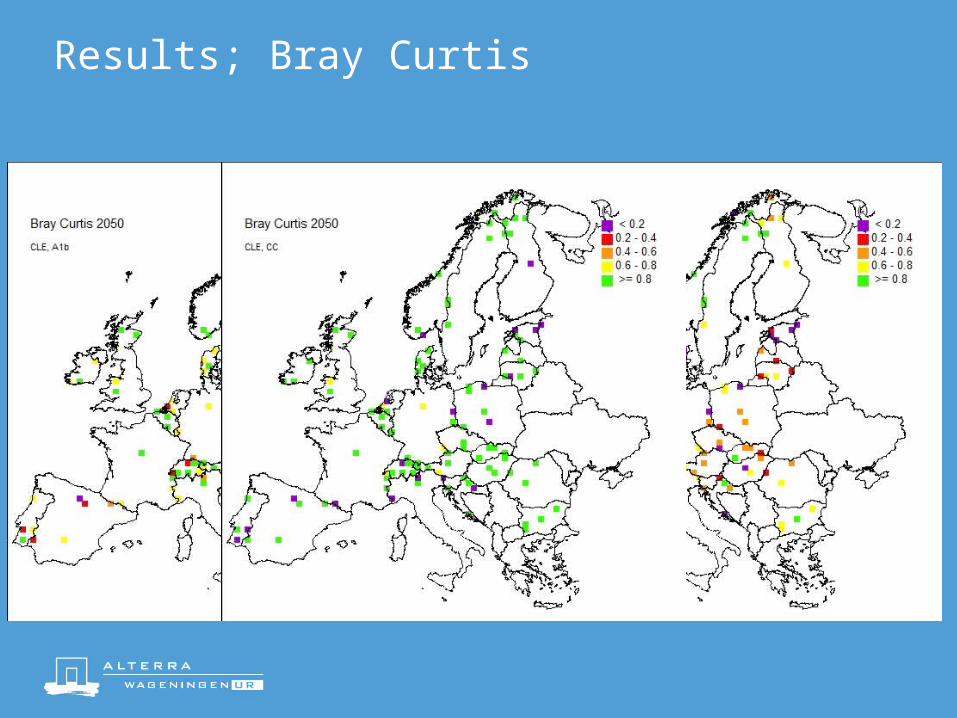
Results; Bray Curtis

Results; habitat quality

I would have liked to show even more but

Conclusions
Selecting sites for each vegetation type seems to be a useful approach as each site can be calibrated
But: Check how representative the sites are and how sensitive the outcome to the selections made
Bray Curtis index may provide useful information but principally should be based on abundance not probability
Habitat quality indicator is based on probability; now we used wanted (?) species only, unwanted should be added (?)
Some more in-depth analysis of results is needed

Future work
So far the model has been applied on 128 sites. Next steps would be to apply it for all ‘important habitat types’ per country.
We could select sites for VSD+PROPS using stratified random sampling (e.g. 10 (?) sites per habitat type per country) and check if this would be sufficient for a good regional representation by checking results against those of a ‘true’ regional application of VSD+-PROPS for 1-2 not-too-large countries
This could then yield ‘response functions’

End
Klik op het pictogram als u een afbeelding wilt toevoegen

Results; Simpson Index

Influence of climate change on abiotic conditions....