modelling of material removal and surface roughness on ... · modelling of material removal and...
TRANSCRIPT

International Journal of Mechanical & Mechatronics Engineering IJMME-IJENS Vol:14 No:01 46
145001-7676-IJMME-IJENS © February 2014 IJENS
I J E N S
Modelling of Material Removal and Surface
Roughness on Machining of Ti-6Al-4V Through EDM
Process G.Kumanan
1, D.Kanagarajan
2 and R.Karthikeyan
3
1Assistant professor in Manufacturing Engineering, Directorate of Distance Education, Annamalai University.
Email:[email protected] 2Assistant professor in Manufacturing Engineering, Annamalai University, Annamalai Nagar, Tamilnadu, India.
Email:[email protected], 3Department of Mechanical Engineering, Birla Institute Technology, Dubai.
Email:[email protected]
Abstract— The present work investigates the influence of
processing parameters of electrical discharge machining (EDM)
such as peak current, pulse on time, rotational speed and flushing
pressure. This study also attempts to study the effects of
parameters on EDM performance characteristics on Ti-6Al-4V
alloy using copper electrode as tool material. The performance
characteristics are analysed in terms of material removal rate
(MRR) and surface roughness (Ra), by varying the process
parameters. Mathematical model correlating the influences of
these variables on performance characteristics of the workpiece
are investigated. Design of experiments (DOE) and Response
Surface Methodology (RSM) are used to identify an optimal
machining condition. Analysis of variance (ANOVA) has been
performed for the validity test of the fit and adequacy of the
proposed models. The optimum machining conditions in favour
of MRR and Ra are estimated and verified with proposed
optimized results and the amounts of relative errors calculated. It
is observed that the developed model is within the limits of the
agreeable error (2%), when compared to experimental results.
This result leads to desirable MRR, Ra and economical industrial
machining to optimize the process parameters. This confirms the
feasibility and effectiveness of the adopted approach.
Index Term-- EDM, Ti-6Al-4V, MRR, Ra, RSM, ANOVA.
I. INTRODUCTION
The demand for complicated shapes within tighter
tolerances in many industrial applications is gradually
increasing with the introduction of new materials. This has
been a big challenge for engineers to meet out these demands.
The usage of titanium and its alloys is increasing in many
industrial and commercial applications. Titanium alloy is
unique in that it has excellent properties such as a high
strength–weight ratio, high temperature strength and
exceptional corrosion resistance [1]. In spite of its strength and
increased utility of titanium alloys, it is very difficult to
machine titanium alloys economically with conventional
techniques due to their poor machinability. The energy-based
technique, such as electrical discharge machining (EDM), has
continued to advance and gain favour as an alternative to
traditional machining methods. Different from traditional
machining methods, the material removal in the EDM process
is achieved through melting and vaporization [2,3].
EDM has been widely applied in modern metal
industry for producing complex cavities in moulds and dies,
which are difficult to machine by conventional machining.
The use of electrical discharge machining in the production of
forming tools to produce plastics mouldings, die castings,
forging dies etc. Electrical discharge machining (EDM)
technique possesses noticeable advantages over other
conventional machining process and can machine any hard
material effectively [4,8]. Proper selection of parameters in
EDM is very much essential to achieve better performance
characteristics that are still challenging for a particular
machining setup. The evaluation of the performance
characteristics and optimization of machining parameters have
received maximum research attention. It is in general observed
that out of the two main performance characteristics, material
removal rate (MRR) and surface roughness (Ra) have
traditionally received greater research attention [9-12].
The proposed work emphasizes the development of
mathematical models using RSM, based on the experimental
results for correlating the process variables such as peak
current (I, amp), pulse on time (Ton, μs), electrode rotational
speed (S, rpm), and flushing pressure (P, kg/cm2). Finally, an
attempt has been made to obtain optimum machining
conditions with respect to each of the machining parameters
considered in the present study with the help of response
surface methodology.
The remainder of the paper is organized as follows;
Section 2 describes the experimental procedure. Results are
discussed in section 3. Section 4 concludes the work with
future directions.
International Journal of Mechanical & Mechatronics Engineering IJMME-IJENS Vol:14 No:01 47
145001-7676-IJMME-IJENS © February 2014 IJENS I J E N S
II. EXPERIMENTAL PROCEDURE
In the present work experiments were designed on the
basis of experimental design technique using response surface
design method.
A. Equipment Used
A number of experiments are conducted to study the
effects of various machining parameters on EDM process.
These studies have been undertaken to investigate the effects
of peak current (I), pulse on time (Ton), electrode rotational
speed(S) and flushing pressure(P) on MRR and Ra. The
selected workpiece material for the research work is Ti-6Al-
4V. Copper cylindrical electrode of 12mm diameter is used as
a tool and kerosene is used as a dielectric fluid.
The equipment used to perform the experiments is a
die sinking EDM (Electronica-M100 MODEL) machine, it is
equipped with transistor switched power supply. The electrode
is fed downwards under servo control into the workpiece. The
dielectric fluid is circulated by jet flushing one of the primary
objectives is to study the effect of rotation of tool. Therefore, a
mechanism to rotate the tool is developed and the electrode is
rotated to machining on the surface of the work piece. Hence
all the experiments are performed with peak current, pulse on
time, electrode rotational speed and flushing pressure as
process variables. The ranges of these parameters are selected
on the basis of preliminary experiments conducted by using
one variable at a time approach.
Experiments were conducted according to DOE
concept covering full range of input variables. For each
experiment, a new set of tool and workpiece has been used.
The response variables selected for this study is metal removal
rate (MRR) and surface roughness (Ra) are calculated.
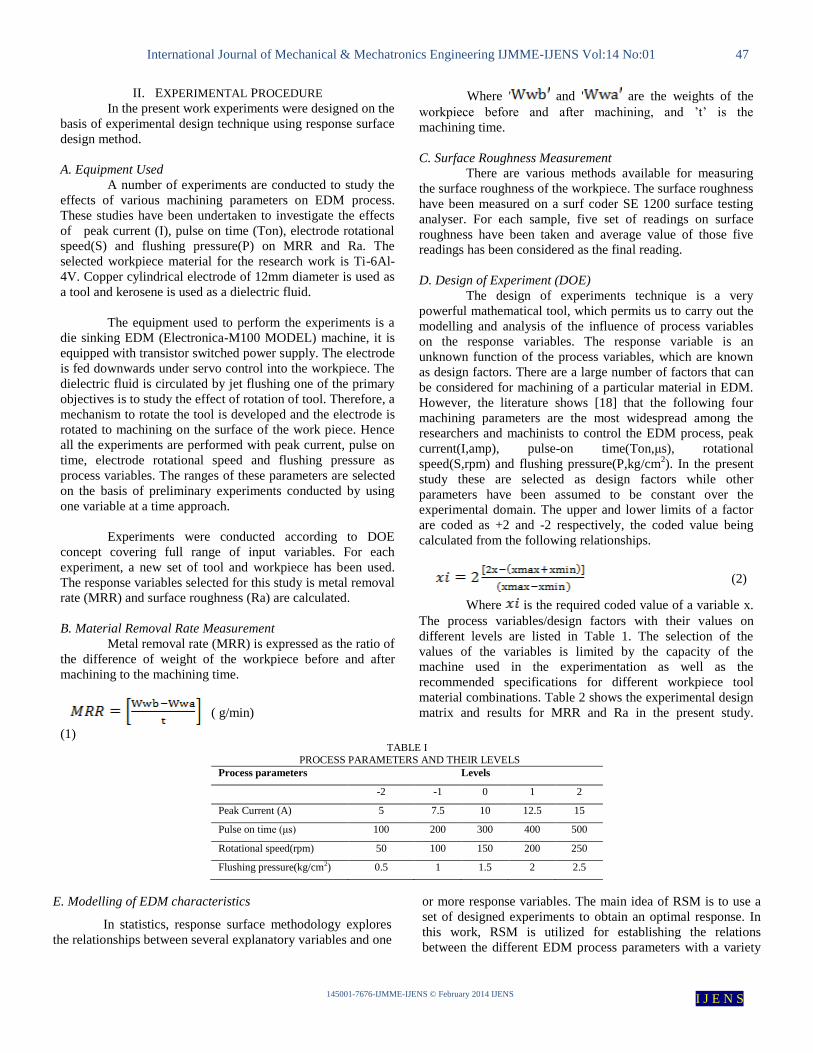
B. Material Removal Rate Measurement
Metal removal rate (MRR) is expressed as the ratio of
the difference of weight of the workpiece before and after
machining to the machining time.
( g/min)
(1)
Where ' and ' are the weights of the
workpiece before and after machining, and ’t’ is the
machining time.
C. Surface Roughness Measurement
There are various methods available for measuring
the surface roughness of the workpiece. The surface roughness
have been measured on a surf coder SE 1200 surface testing
analyser. For each sample, five set of readings on surface
roughness have been taken and average value of those five
readings has been considered as the final reading.
D. Design of Experiment (DOE)
The design of experiments technique is a very
powerful mathematical tool, which permits us to carry out the
modelling and analysis of the influence of process variables
on the response variables. The response variable is an
unknown function of the process variables, which are known
as design factors. There are a large number of factors that can
be considered for machining of a particular material in EDM.
However, the literature shows [18] that the following four
machining parameters are the most widespread among the
researchers and machinists to control the EDM process, peak
current(I,amp), pulse-on time(Ton,μs), rotational
speed(S,rpm) and flushing pressure(P,kg/cm2). In the present
study these are selected as design factors while other
parameters have been assumed to be constant over the
experimental domain. The upper and lower limits of a factor
are coded as +2 and -2 respectively, the coded value being
calculated from the following relationships.
(2)
Where is the required coded value of a variable x.
The process variables/design factors with their values on
different levels are listed in Table 1. The selection of the
values of the variables is limited by the capacity of the
machine used in the experimentation as well as the
recommended specifications for different workpiece tool
material combinations. Table 2 shows the experimental design
matrix and results for MRR and Ra in the present study.
TABLE I
PROCESS PARAMETERS AND THEIR LEVELS
Process parameters Levels
-2 -1 0 1 2
Peak Current (A)
5 7.5 10 12.5 15
Pulse on time (μs) 100 200 300 400 500
Rotational speed(rpm) 50 100 150 200 250
Flushing pressure(kg/cm2) 0.5 1 1.5 2 2.5
E. Modelling of EDM characteristics
In statistics, response surface methodology explores
the relationships between several explanatory variables and one
or more response variables. The main idea of RSM is to use a
set of designed experiments to obtain an optimal response. In
this work, RSM is utilized for establishing the relations
between the different EDM process parameters with a variety
International Journal of Mechanical & Mechatronics Engineering IJMME-IJENS Vol:14 No:01 48
145001-7676-IJMME-IJENS © February 2014 IJENS I J E N S
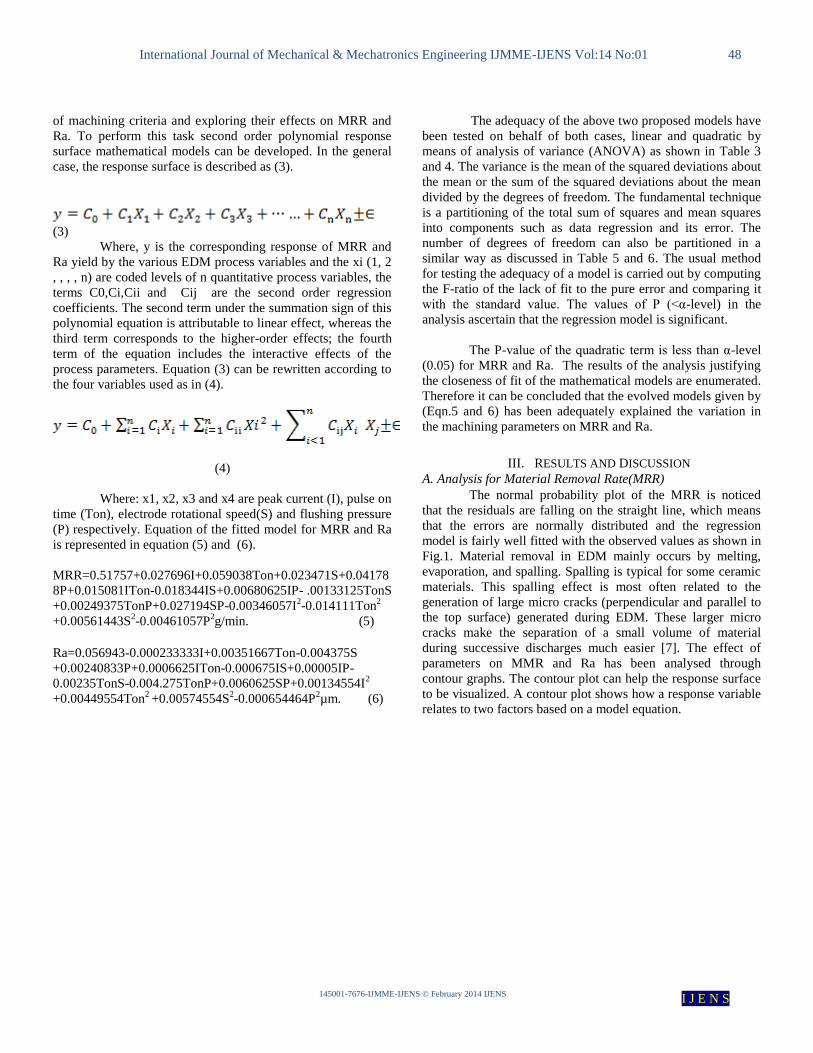
of machining criteria and exploring their effects on MRR and
Ra. To perform this task second order polynomial response
surface mathematical models can be developed. In the general
case, the response surface is described as (3).
(3)
Where, y is the corresponding response of MRR and
Ra yield by the various EDM process variables and the xi (1, 2
, , , , n) are coded levels of n quantitative process variables, the
terms C0,Ci,Cii and Cij are the second order regression
coefficients. The second term under the summation sign of this
polynomial equation is attributable to linear effect, whereas the
third term corresponds to the higher-order effects; the fourth
term of the equation includes the interactive effects of the
process parameters. Equation (3) can be rewritten according to
the four variables used as in (4).
(4)
Where: x1, x2, x3 and x4 are peak current (I), pulse on
time (Ton), electrode rotational speed(S) and flushing pressure
(P) respectively. Equation of the fitted model for MRR and Ra
is represented in equation (5) and (6).
MRR=0.51757+0.027696I+0.059038Ton+0.023471S+0.04178
8P+0.015081ITon-0.018344IS+0.00680625IP- .00133125TonS
+0.00249375TonP+0.027194SP-0.00346057I2-0.014111Ton
2
+0.00561443S2-0.00461057P
2g/min. (5)
Ra=0.056943-0.000233333I+0.00351667Ton-0.004375S
+0.00240833P+0.0006625ITon-0.000675IS+0.00005IP-
0.00235TonS-0.004.275TonP+0.0060625SP+0.00134554I2
+0.00449554Ton2 +0.00574554S
2-0.000654464P
2µm. (6)
The adequacy of the above two proposed models have
been tested on behalf of both cases, linear and quadratic by
means of analysis of variance (ANOVA) as shown in Table 3
and 4. The variance is the mean of the squared deviations about
the mean or the sum of the squared deviations about the mean
divided by the degrees of freedom. The fundamental technique
is a partitioning of the total sum of squares and mean squares
into components such as data regression and its error. The
number of degrees of freedom can also be partitioned in a
similar way as discussed in Table 5 and 6. The usual method
for testing the adequacy of a model is carried out by computing
the F-ratio of the lack of fit to the pure error and comparing it
with the standard value. The values of P (<α-level) in the
analysis ascertain that the regression model is significant.
The P-value of the quadratic term is less than α-level
(0.05) for MRR and Ra. The results of the analysis justifying
the closeness of fit of the mathematical models are enumerated.
Therefore it can be concluded that the evolved models given by
(Eqn.5 and 6) has been adequately explained the variation in
the machining parameters on MRR and Ra.
III. RESULTS AND DISCUSSION
A. Analysis for Material Removal Rate(MRR)
The normal probability plot of the MRR is noticed
that the residuals are falling on the straight line, which means
that the errors are normally distributed and the regression
model is fairly well fitted with the observed values as shown in
Fig.1. Material removal in EDM mainly occurs by melting,
evaporation, and spalling. Spalling is typical for some ceramic
materials. This spalling effect is most often related to the
generation of large micro cracks (perpendicular and parallel to
the top surface) generated during EDM. These larger micro
cracks make the separation of a small volume of material
during successive discharges much easier [7]. The effect of
parameters on MMR and Ra has been analysed through
contour graphs. The contour plot can help the response surface
to be visualized. A contour plot shows how a response variable
relates to two factors based on a model equation.
International Journal of Mechanical & Mechatronics Engineering IJMME-IJENS Vol:14 No:01 49
145001-7676-IJMME-IJENS © February 2014 IJENS I J E N S
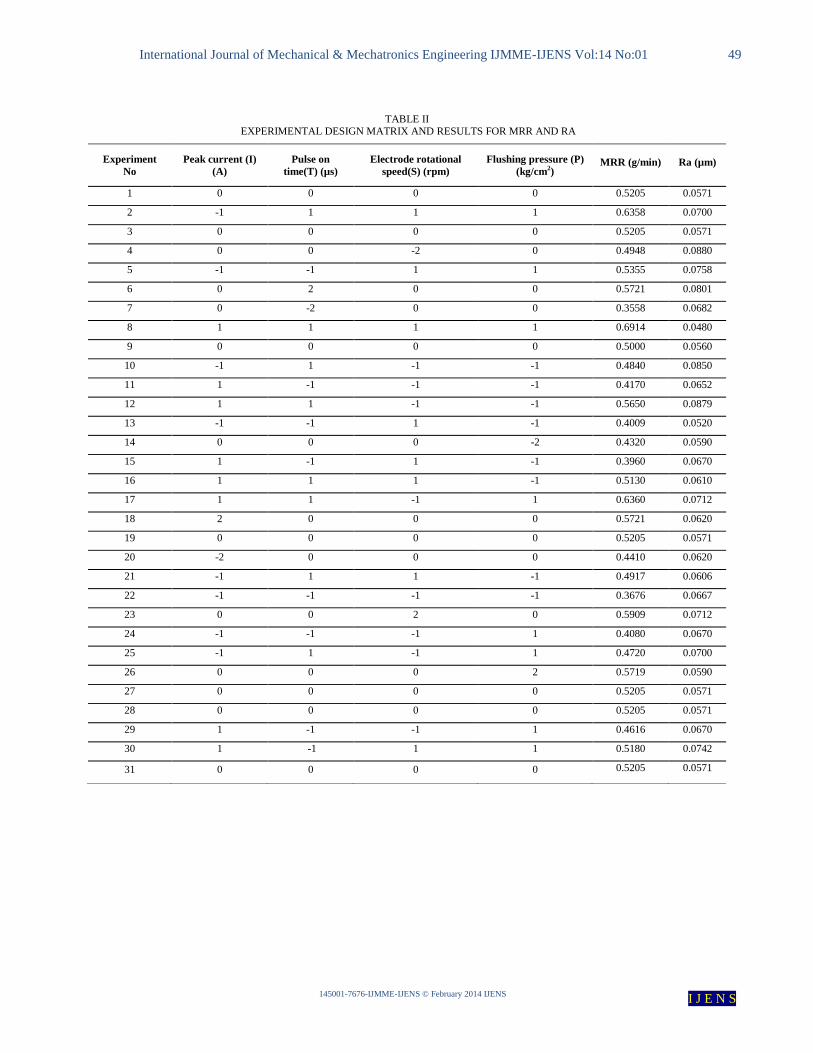
TABLE II EXPERIMENTAL DESIGN MATRIX AND RESULTS FOR MRR AND RA
Experiment
No
Peak current (I)
(A)
Pulse on
time(T) (µs)
Electrode rotational
speed(S) (rpm)
Flushing pressure (P)
(kg/cm2) MRR (g/min) Ra (µm)
1 0 0 0 0 0.5205 0.0571
2 -1 1 1 1 0.6358 0.0700
3 0 0 0 0 0.5205 0.0571
4 0 0 -2 0 0.4948 0.0880
5 -1 -1 1 1 0.5355 0.0758
6 0 2 0 0 0.5721 0.0801
7 0 -2 0 0 0.3558 0.0682
8 1 1 1 1 0.6914 0.0480
9 0 0 0 0 0.5000 0.0560
10 -1 1 -1 -1 0.4840 0.0850
11 1 -1 -1 -1 0.4170 0.0652
12 1 1 -1 -1 0.5650 0.0879
13 -1 -1 1 -1 0.4009 0.0520
14 0 0 0 -2 0.4320 0.0590
15 1 -1 1 -1 0.3960 0.0670
16 1 1 1 -1 0.5130 0.0610
17 1 1 -1 1 0.6360 0.0712
18 2 0 0 0 0.5721 0.0620
19 0 0 0 0 0.5205 0.0571
20 -2 0 0 0 0.4410 0.0620
21 -1 1 1 -1 0.4917 0.0606
22 -1 -1 -1 -1 0.3676 0.0667
23 0 0 2 0 0.5909 0.0712
24 -1 -1 -1 1 0.4080 0.0670
25 -1 1 -1 1 0.4720 0.0700
26 0 0 0 2 0.5719 0.0590
27 0 0 0 0 0.5205 0.0571
28 0 0 0 0 0.5205 0.0571
29 1 -1 -1 1 0.4616 0.0670
30 1 -1 1 1 0.5180 0.0742
31 0 0 0 0 0.5205 0.0571
International Journal of Mechanical & Mechatronics Engineering IJMME-IJENS Vol:14 No:01 50
145001-7676-IJMME-IJENS © February 2014 IJENS I J E N S
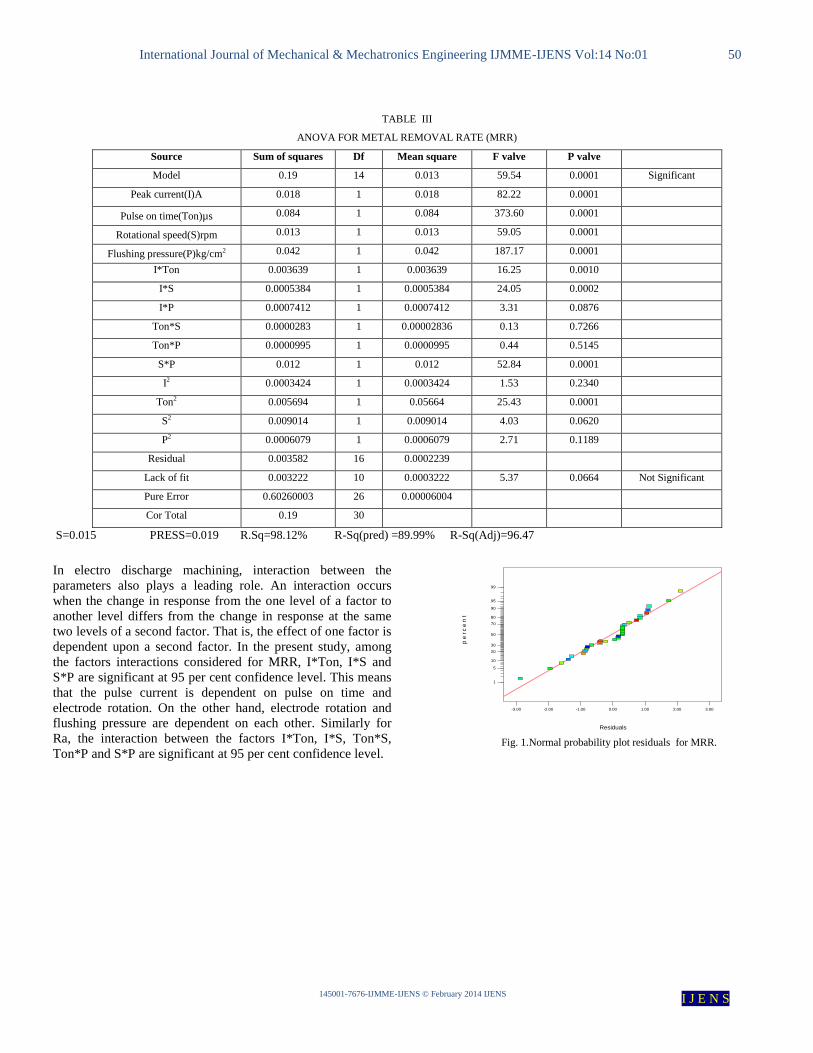
TABLE III
ANOVA FOR METAL REMOVAL RATE (MRR)
Source Sum of squares Df Mean square F valve P valve
Model 0.19 14 0.013 59.54 0.0001 Significant
Peak current(I)A 0.018 1 0.018 82.22 0.0001
Pulse on time(Ton)µs 0.084 1 0.084 373.60 0.0001
Rotational speed(S)rpm 0.013 1 0.013 59.05 0.0001
Flushing pressure(P)kg/cm2 0.042 1 0.042 187.17 0.0001
I*Ton 0.003639 1 0.003639 16.25 0.0010
I*S 0.0005384 1 0.0005384 24.05 0.0002
I*P 0.0007412 1 0.0007412 3.31 0.0876
Ton*S 0.0000283 1 0.00002836 0.13 0.7266
Ton*P 0.0000995 1 0.0000995 0.44 0.5145
S*P 0.012 1 0.012 52.84 0.0001
I2 0.0003424 1 0.0003424 1.53 0.2340
Ton2 0.005694 1 0.05664 25.43 0.0001
S2 0.009014 1 0.009014 4.03 0.0620
P2 0.0006079 1 0.0006079 2.71 0.1189
Residual 0.003582 16 0.0002239
Lack of fit 0.003222 10 0.0003222 5.37 0.0664 Not Significant
Pure Error 0.60260003 26 0.00006004
Cor Total 0.19 30
S=0.015 PRESS=0.019 R.Sq=98.12% R-Sq(pred) =89.99% R-Sq(Adj)=96.47
In electro discharge machining, interaction between the
parameters also plays a leading role. An interaction occurs
when the change in response from the one level of a factor to
another level differs from the change in response at the same
two levels of a second factor. That is, the effect of one factor is
dependent upon a second factor. In the present study, among
the factors interactions considered for MRR, I*Ton, I*S and
S*P are significant at 95 per cent confidence level. This means
that the pulse current is dependent on pulse on time and
electrode rotation. On the other hand, electrode rotation and
flushing pressure are dependent on each other. Similarly for
Ra, the interaction between the factors I*Ton, I*S, Ton*S,
Ton*P and S*P are significant at 95 per cent confidence level.
Design-Expert® SoftwareMRR g/min
Color points by value ofMRR g/min:
0.6914
0.3558
Residuals
pe
rc
en
t
-3.00 -2.00 -1.00 0.00 1.00 2.00 3.00
1
5
10
20
30
50
70
80
90
95
99
Fig. 1.Normal probability plot residuals for MRR.
International Journal of Mechanical & Mechatronics Engineering IJMME-IJENS Vol:14 No:01 51
145001-7676-IJMME-IJENS © February 2014 IJENS I J E N S
Design-Expert® SoftwareFactor Coding: ActualMRR g/min
Design points above predicted valueDesign points below predicted value0.6914
0.3558
X1 = A: Peak current(I) AX2 = B: Pluse on Time (Ton) µs
Actual FactorsC: Rotational Speed (S) rpm = 150.00D: Flushing Pressure (P) kgf/cm2 = 1.50
100.00
200.00
300.00
400.00
500.00
5.00
7.50
10.00
12.50
15.00
0.3
0.4
0.5
0.6
0.7
0.8
M
RR
g
/min
A: Peak current(I) A B: Pluse on Time (Ton) µs
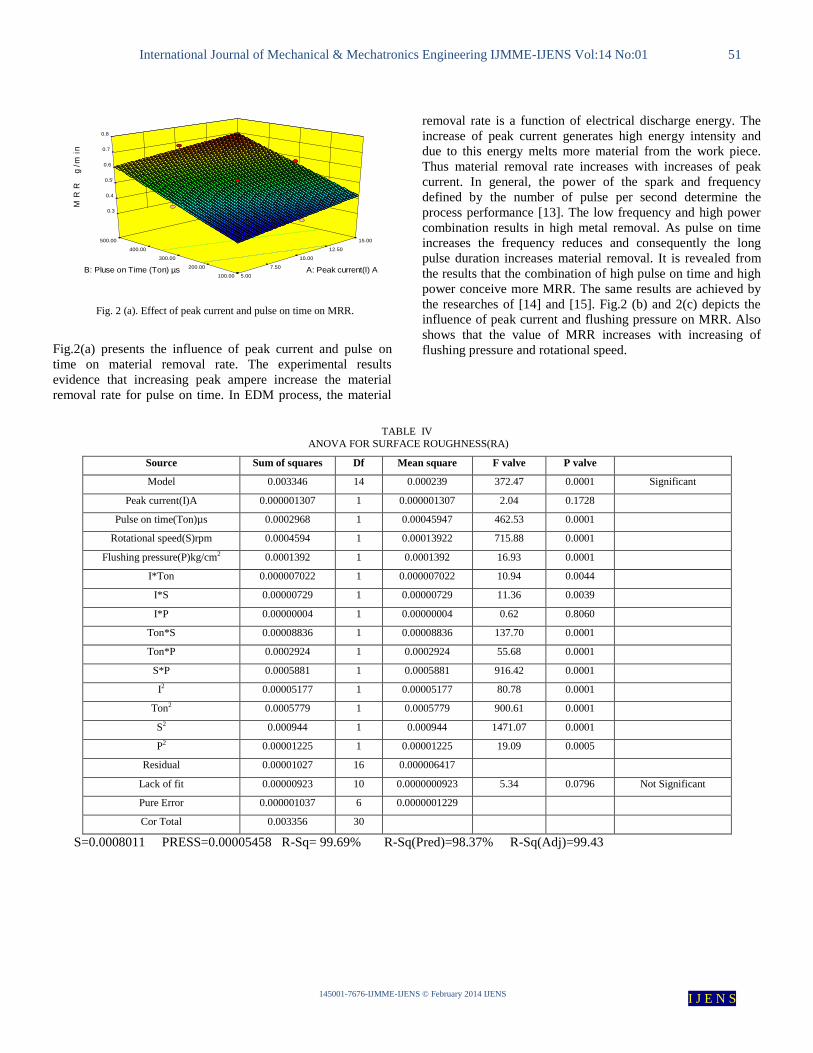
Fig. 2 (a). Effect of peak current and pulse on time on MRR.
Fig.2(a) presents the influence of peak current and pulse on
time on material removal rate. The experimental results
evidence that increasing peak ampere increase the material
removal rate for pulse on time. In EDM process, the material
removal rate is a function of electrical discharge energy. The
increase of peak current generates high energy intensity and
due to this energy melts more material from the work piece.
Thus material removal rate increases with increases of peak
current. In general, the power of the spark and frequency
defined by the number of pulse per second determine the
process performance [13]. The low frequency and high power
combination results in high metal removal. As pulse on time
increases the frequency reduces and consequently the long
pulse duration increases material removal. It is revealed from
the results that the combination of high pulse on time and high
power conceive more MRR. The same results are achieved by
the researches of [14] and [15]. Fig.2 (b) and 2(c) depicts the
influence of peak current and flushing pressure on MRR. Also
shows that the value of MRR increases with increasing of
flushing pressure and rotational speed.
TABLE IV
ANOVA FOR SURFACE ROUGHNESS(RA)
Source Sum of squares Df Mean square F valve P valve
Model 0.003346 14 0.000239 372.47 0.0001 Significant
Peak current(I)A 0.000001307 1 0.000001307 2.04 0.1728
Pulse on time(Ton)µs 0.0002968 1 0.00045947 462.53 0.0001
Rotational speed(S)rpm 0.0004594 1 0.00013922 715.88 0.0001
Flushing pressure(P)kg/cm2 0.0001392 1 0.0001392 16.93 0.0001
I*Ton 0.000007022 1 0.000007022 10.94 0.0044
I*S 0.00000729 1 0.00000729 11.36 0.0039
I*P 0.00000004 1 0.00000004 0.62 0.8060
Ton*S 0.00008836 1 0.00008836 137.70 0.0001
Ton*P 0.0002924 1 0.0002924 55.68 0.0001
S*P 0.0005881 1 0.0005881 916.42 0.0001
I2 0.00005177 1 0.00005177 80.78 0.0001
Ton2 0.0005779 1 0.0005779 900.61 0.0001
S2 0.000944 1 0.000944 1471.07 0.0001
P2 0.00001225 1 0.00001225 19.09 0.0005
Residual 0.00001027 16 0.000006417
Lack of fit 0.00000923 10 0.0000000923 5.34 0.0796 Not Significant
Pure Error 0.000001037 6 0.0000001229
Cor Total 0.003356 30
S=0.0008011 PRESS=0.00005458 R-Sq= 99.69% R-Sq(Pred)=98.37% R-Sq(Adj)=99.43
International Journal of Mechanical & Mechatronics Engineering IJMME-IJENS Vol:14 No:01 52
145001-7676-IJMME-IJENS © February 2014 IJENS I J E N S
Design-Expert® SoftwareFactor Coding: ActualMRR g/min
Design points above predicted valueDesign points below predicted value0.6914
0.3558
X1 = A: Peak current(I) AX2 = C: Rotational Speed (S) rpm
Actual FactorsB: Pluse on Time (Ton) µs = 300.00D: Flushing Pressure (P) kgf/cm2 = 1.50
50.00
100.00
150.00
200.00
250.00
5.00
7.50
10.00
12.50
15.00
0.3
0.4
0.5
0.6
0.7
0.8
M
RR
g
/min
A: Peak current(I) A C: Rotational Speed (S) rpm
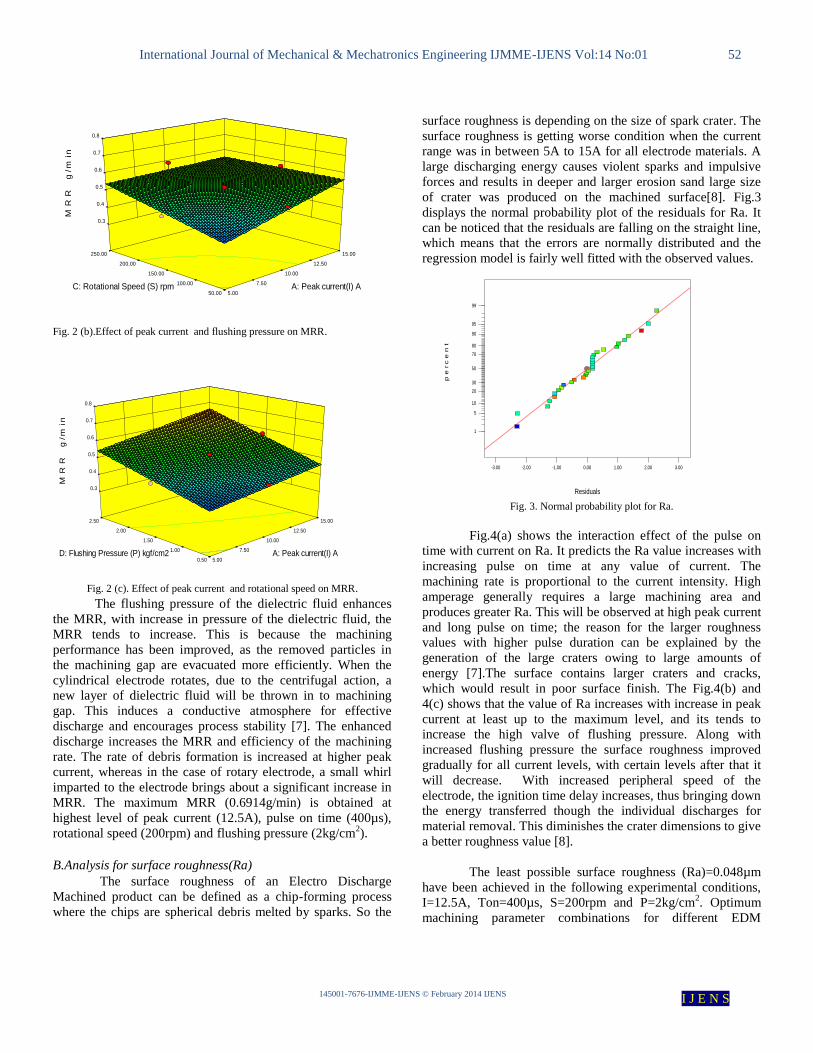
Fig. 2 (b).Effect of peak current and flushing pressure on MRR.
Design-Expert® SoftwareFactor Coding: ActualMRR g/min
Design points above predicted valueDesign points below predicted value0.6914
0.3558
X1 = A: Peak current(I) AX2 = D: Flushing Pressure (P) kgf/cm2
Actual FactorsB: Pluse on Time (Ton) µs = 300.00C: Rotational Speed (S) rpm = 150.00
0.50
1.00
1.50
2.00
2.50
5.00
7.50
10.00
12.50
15.00
0.3
0.4
0.5
0.6
0.7
0.8
M
RR
g
/min
A: Peak current(I) A D: Flushing Pressure (P) kgf/cm2
Fig. 2 (c). Effect of peak current and rotational speed on MRR.
The flushing pressure of the dielectric fluid enhances
the MRR, with increase in pressure of the dielectric fluid, the
MRR tends to increase. This is because the machining
performance has been improved, as the removed particles in
the machining gap are evacuated more efficiently. When the
cylindrical electrode rotates, due to the centrifugal action, a
new layer of dielectric fluid will be thrown in to machining
gap. This induces a conductive atmosphere for effective
discharge and encourages process stability [7]. The enhanced
discharge increases the MRR and efficiency of the machining
rate. The rate of debris formation is increased at higher peak
current, whereas in the case of rotary electrode, a small whirl
imparted to the electrode brings about a significant increase in
MRR. The maximum MRR (0.6914g/min) is obtained at
highest level of peak current (12.5A), pulse on time (400µs),
rotational speed (200rpm) and flushing pressure (2kg/cm2).
B.Analysis for surface roughness(Ra)
The surface roughness of an Electro Discharge
Machined product can be defined as a chip-forming process
where the chips are spherical debris melted by sparks. So the
surface roughness is depending on the size of spark crater. The
surface roughness is getting worse condition when the current
range was in between 5A to 15A for all electrode materials. A
large discharging energy causes violent sparks and impulsive
forces and results in deeper and larger erosion sand large size
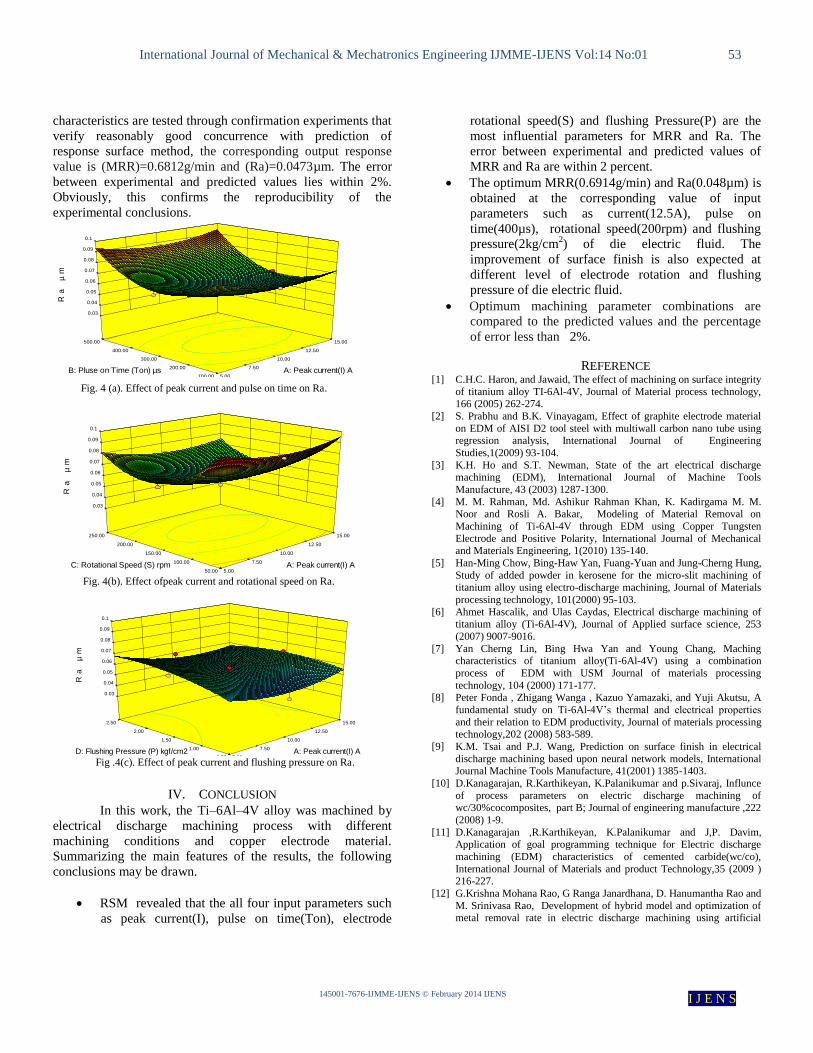
of crater was produced on the machined surface[8]. Fig.3
displays the normal probability plot of the residuals for Ra. It
can be noticed that the residuals are falling on the straight line,
which means that the errors are normally distributed and the
regression model is fairly well fitted with the observed values.
Fig. 3. Normal probability plot for Ra.
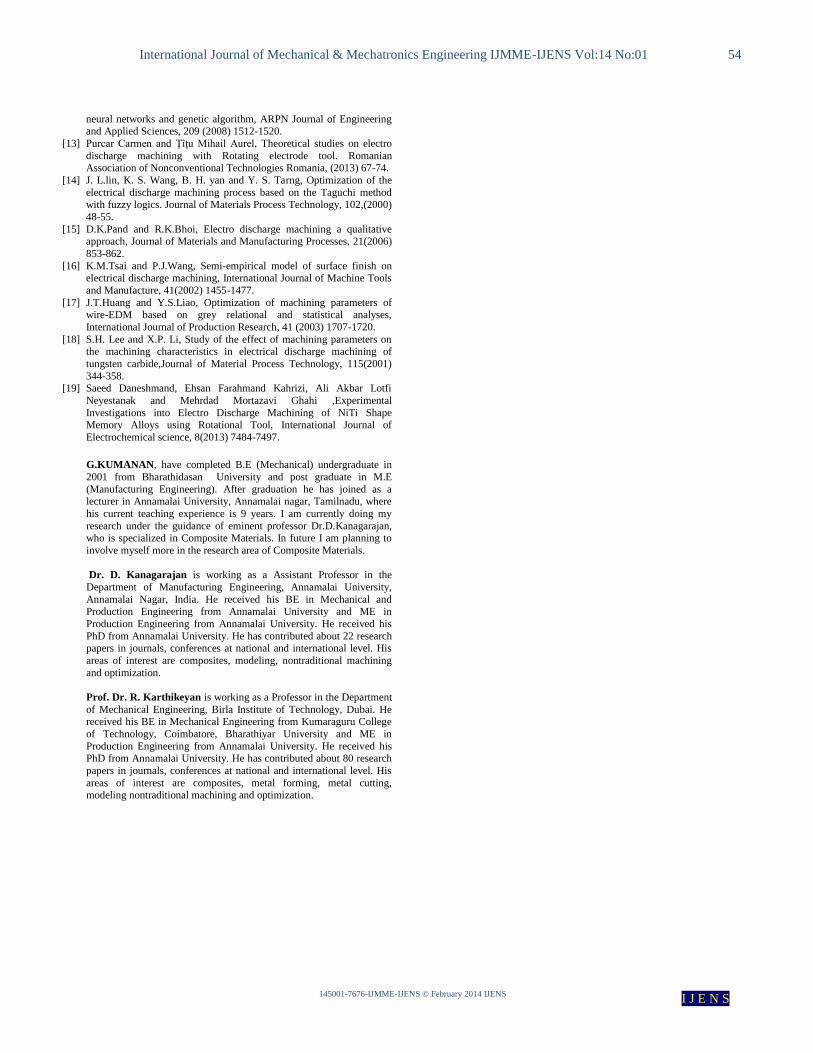
Fig.4(a) shows the interaction effect of the pulse on
time with current on Ra. It predicts the Ra value increases with
increasing pulse on time at any value of current. The
machining rate is proportional to the current intensity. High
amperage generally requires a large machining area and
produces greater Ra. This will be observed at high peak current
and long pulse on time; the reason for the larger roughness
values with higher pulse duration can be explained by the
generation of the large craters owing to large amounts of
energy [7].The surface contains larger craters and cracks,
which would result in poor surface finish. The Fig.4(b) and
4(c) shows that the value of Ra increases with increase in peak
current at least up to the maximum level, and its tends to
increase the high valve of flushing pressure. Along with
increased flushing pressure the surface roughness improved
gradually for all current levels, with certain levels after that it
will decrease. With increased peripheral speed of the
electrode, the ignition time delay increases, thus bringing down
the energy transferred though the individual discharges for
material removal. This diminishes the crater dimensions to give
a better roughness value [8].
The least possible surface roughness (Ra)=0.048µm
have been achieved in the following experimental conditions,
I=12.5A, Ton=400µs, S=200rpm and P=2kg/cm2. Optimum
machining parameter combinations for different EDM
Design-Expert® SoftwareRa µm
Color points by value ofRa µm:
0.0929
0.041
Residuals
pe
rc
en
t
-3.00 -2.00 -1.00 0.00 1.00 2.00 3.00
1
5
10
20
30
50
70
80
90
95
99
International Journal of Mechanical & Mechatronics Engineering IJMME-IJENS Vol:14 No:01 53
145001-7676-IJMME-IJENS © February 2014 IJENS I J E N S
Design-Expert® SoftwareFactor Coding: ActualRa µm
Design points above predicted valueDesign points below predicted value0.0929
0.041
X1 = A: Peak current(I) AX2 = D: Flushing Pressure (P) kgf/cm2
Actual FactorsB: Pluse on Time (Ton) µs = 300.00C: Rotational Speed (S) rpm = 150.00
0.50
1.00
1.50
2.00
2.50
5.00
7.50
10.00
12.50
15.00
0.03
0.04
0.05
0.06
0.07
0.08
0.09
0.1
R
a
µm
A: Peak current(I) A D: Flushing Pressure (P) kgf/cm2
characteristics are tested through confirmation experiments that
verify reasonably good concurrence with prediction of
response surface method, the corresponding output response
value is (MRR)=0.6812g/min and (Ra)=0.0473µm. The error
between experimental and predicted values lies within 2%.
Obviously, this confirms the reproducibility of the
experimental conclusions. Design-Expert® SoftwareFactor Coding: ActualRa µm
Design points above predicted valueDesign points below predicted value0.0929
0.041
X1 = A: Peak current(I) AX2 = B: Pluse on Time (Ton) µs
Actual FactorsC: Rotational Speed (S) rpm = 150.00D: Flushing Pressure (P) kgf/cm2 = 1.50
100.00
200.00
300.00
400.00
500.00
5.00
7.50
10.00
12.50
15.00
0.03
0.04
0.05
0.06
0.07
0.08
0.09
0.1
R
a
µm
A: Peak current(I) A B: Pluse on Time (Ton) µs
Fig. 4 (a). Effect of peak current and pulse on time on Ra.
Design-Expert® SoftwareFactor Coding: ActualRa µm
Design points above predicted valueDesign points below predicted value0.0929
0.041
X1 = A: Peak current(I) AX2 = C: Rotational Speed (S) rpm
Actual FactorsB: Pluse on Time (Ton) µs = 300.00D: Flushing Pressure (P) kgf/cm2 = 1.50
50.00
100.00
150.00
200.00
250.00
5.00
7.50
10.00
12.50
15.00
0.03
0.04
0.05
0.06
0.07
0.08
0.09
0.1
R
a
µm
A: Peak current(I) A C: Rotational Speed (S) rpm Fig. 4(b). Effect ofpeak current and rotational speed on Ra.
Fig .4(c). Effect of peak current and flushing pressure on Ra.
IV. CONCLUSION
In this work, the Ti–6Al–4V alloy was machined by
electrical discharge machining process with different
machining conditions and copper electrode material.
Summarizing the main features of the results, the following
conclusions may be drawn.
RSM revealed that the all four input parameters such
as peak current(I), pulse on time(Ton), electrode
rotational speed(S) and flushing Pressure(P) are the
most influential parameters for MRR and Ra. The
error between experimental and predicted values of
MRR and Ra are within 2 percent.
The optimum MRR(0.6914g/min) and Ra(0.048µm) is
obtained at the corresponding value of input
parameters such as current(12.5A), pulse on
time(400µs), rotational speed(200rpm) and flushing
pressure(2kg/cm2) of die electric fluid. The
improvement of surface finish is also expected at
different level of electrode rotation and flushing
pressure of die electric fluid.
Optimum machining parameter combinations are
compared to the predicted values and the percentage
of error less than 2%.
REFERENCE [1] C.H.C. Haron, and Jawaid, The effect of machining on surface integrity
of titanium alloy TI-6Al-4V, Journal of Material process technology, 166 (2005) 262-274.
[2] S. Prabhu and B.K. Vinayagam, Effect of graphite electrode material
on EDM of AISI D2 tool steel with multiwall carbon nano tube using regression analysis, International Journal of Engineering
Studies,1(2009) 93-104.
[3] K.H. Ho and S.T. Newman, State of the art electrical discharge machining (EDM), International Journal of Machine Tools
Manufacture, 43 (2003) 1287-1300.
[4] M. M. Rahman, Md. Ashikur Rahman Khan, K. Kadirgama M. M. Noor and Rosli A. Bakar, Modeling of Material Removal on
Machining of Ti-6Al-4V through EDM using Copper Tungsten
Electrode and Positive Polarity, International Journal of Mechanical and Materials Engineering, 1(2010) 135-140.
[5] Han-Ming Chow, Bing-Haw Yan, Fuang-Yuan and Jung-Cherng Hung,
Study of added powder in kerosene for the micro-slit machining of titanium alloy using electro-discharge machining, Journal of Materials
processing technology, 101(2000) 95-103.
[6] Ahmet Hascalik, and Ulas Caydas, Electrical discharge machining of titanium alloy (Ti-6Al-4V), Journal of Applied surface science, 253
(2007) 9007-9016.
[7] Yan Cherng Lin, Bing Hwa Yan and Young Chang, Maching characteristics of titanium alloy(Ti-6Al-4V) using a combination
process of EDM with USM Journal of materials processing
technology, 104 (2000) 171-177. [8] Peter Fonda , Zhigang Wanga , Kazuo Yamazaki, and Yuji Akutsu, A
fundamental study on Ti-6Al-4V’s thermal and electrical properties
and their relation to EDM productivity, Journal of materials processing technology,202 (2008) 583-589.
[9] K.M. Tsai and P.J. Wang, Prediction on surface finish in electrical
discharge machining based upon neural network models, International Journal Machine Tools Manufacture, 41(2001) 1385-1403.
[10] D.Kanagarajan, R.Karthikeyan, K.Palanikumar and p.Sivaraj, Influnce
of process parameters on electric discharge machining of wc/30%cocomposites, part B; Journal of engineering manufacture ,222
(2008) 1-9.
[11] D.Kanagarajan ,R.Karthikeyan, K.Palanikumar and J,P. Davim, Application of goal programming technique for Electric discharge
machining (EDM) characteristics of cemented carbide(wc/co),
International Journal of Materials and product Technology,35 (2009 ) 216-227.
[12] G.Krishna Mohana Rao, G Ranga Janardhana, D. Hanumantha Rao and
M. Srinivasa Rao, Development of hybrid model and optimization of metal removal rate in electric discharge machining using artificial
International Journal of Mechanical & Mechatronics Engineering IJMME-IJENS Vol:14 No:01 54
145001-7676-IJMME-IJENS © February 2014 IJENS I J E N S
neural networks and genetic algorithm, ARPN Journal of Engineering and Applied Sciences, 209 (2008) 1512-1520.
[13] Purcar Carmen and Ţîţu Mihail Aurel, Theoretical studies on electro
discharge machining with Rotating electrode tool. Romanian Association of Nonconventional Technologies Romania, (2013) 67-74.
[14] J. L.lin, K. S. Wang, B. H. yan and Y. S. Tarng, Optimization of the
electrical discharge machining process based on the Taguchi method with fuzzy logics. Journal of Materials Process Technology, 102,(2000)
48-55.
[15] D.K.Pand and R.K.Bhoi, Electro discharge machining a qualitative approach, Journal of Materials and Manufacturing Processes, 21(2006)
853-862.
[16] K.M.Tsai and P.J.Wang, Semi-empirical model of surface finish on electrical discharge machining, International Journal of Machine Tools
and Manufacture, 41(2002) 1455-1477.
[17] J.T.Huang and Y.S.Liao, Optimization of machining parameters of wire-EDM based on grey relational and statistical analyses,
International Journal of Production Research, 41 (2003) 1707-1720.
[18] S.H. Lee and X.P. Li, Study of the effect of machining parameters on the machining characteristics in electrical discharge machining of
tungsten carbide,Journal of Material Process Technology, 115(2001)
344-358. [19] Saeed Daneshmand, Ehsan Farahmand Kahrizi, Ali Akbar Lotfi
Neyestanak and Mehrdad Mortazavi Ghahi ,Experimental
Investigations into Electro Discharge Machining of NiTi Shape Memory Alloys using Rotational Tool, International Journal of
Electrochemical science, 8(2013) 7484-7497.
G.KUMANAN, have completed B.E (Mechanical) undergraduate in
2001 from Bharathidasan University and post graduate in M.E
(Manufacturing Engineering). After graduation he has joined as a lecturer in Annamalai University, Annamalai nagar, Tamilnadu, where
his current teaching experience is 9 years. I am currently doing my
research under the guidance of eminent professor Dr.D.Kanagarajan, who is specialized in Composite Materials. In future I am planning to
involve myself more in the research area of Composite Materials.
Dr. D. Kanagarajan is working as a Assistant Professor in the
Department of Manufacturing Engineering, Annamalai University,
Annamalai Nagar, India. He received his BE in Mechanical and Production Engineering from Annamalai University and ME in
Production Engineering from Annamalai University. He received his
PhD from Annamalai University. He has contributed about 22 research papers in journals, conferences at national and international level. His
areas of interest are composites, modeling, nontraditional machining
and optimization.
Prof. Dr. R. Karthikeyan is working as a Professor in the Department
of Mechanical Engineering, Birla Institute of Technology, Dubai. He received his BE in Mechanical Engineering from Kumaraguru College
of Technology, Coimbatore, Bharathiyar University and ME in
Production Engineering from Annamalai University. He received his PhD from Annamalai University. He has contributed about 80 research
papers in journals, conferences at national and international level. His
areas of interest are composites, metal forming, metal cutting, modeling nontraditional machining and optimization.