modelling of material removal rate on grinding …umpir.ump.edu.my/6520/1/cd6902.pdf · modelling...
TRANSCRIPT

MODELLING OF MATERIAL REMOVAL RATE ON GRINDING DUCTILE IRON
USING WATER BASED SiO2 NANOCOOLANT
ZUL SHUKRI BIN NAWAWI
Report submitted in partial fulfillment of the requirements for the award
of the degree of
Bachelor of mechanical Engineering
Faculty of Mechanical Engineering
UNIVERSITI MALAYSIA PAHANG
JUNE 2012

vi
ABSTRACT
This project presents the modelling of the material removal rate on grinding ductile iron
using water based silicon dioxide (SiO2) nanocoolant using response surface method. The
grinding fluids used in this study are conventional coolant and water based SiO2
nanoparticle grinding fluid. The SiO2 nanocoolant is prepared using two step methods. The
design of experiment for the grinding process is developed using central composite design
method. The method of grinding process is single pass and multiple pass. For the
experiment, the parameter has been considered as speed of table and depth of cut. The
range of the speed of table is 20-40 m/min and the depth of cut is 20-60 µm. The surface
roughness, G-ratio, temperature different, and also material removal rate are selected as the
output parameters. The use of central composite design method is use to obtained the
prediction model for material removal rate. The analysis of variance has been performed to
check the adequacy of the develop mathematical model. It can be seen that the lack of fit
for all models are less than 0.005 and R-square value for all model are more than 90 %.
Therefore, the mathematical models for conventional and SiO2 nanocoolant with single and
multiple pass grinding acceptable. The obtained results show the better medium for
grinding fluid are the conventional grinding in terms of material removal rate however, the
surface roughness for conventional coolant is poor compared to the SiO2 nanocoolant.

vii
ABSTRACK
Projek ini adalah mengenai membina model untuk Material Removal Rate dengan
mencanai ductile iron menggunakan water based silicon dioxide (SiO2) nanocoolant dan
menggunakan response surface method. Coolant yang digunakan dalam kajian ini adalah
coolant dari jenis konvensional dan water based silicon dioxide (SiO2) nanocoolant yang
dihasilkan melalui kaedah two step methods. Reka bentuk eksperimen untuk proses
mencanai adalah dihasilkan dengan menggunakan central composite design method.
Kaedah mencanai yang digunakan adalah dari jenis single pass dan multiple pass. Untuk
eksperimen, parameter yang digunakan adalah kelajuan meja mesin mencanai dan
kedalaman potongan bahan. Julat untuk kelajuan meja mesin mencanai adalah antara 20-40
m/min dan untuk kedalaman potongan bahan adalah 20-60 µm. Surface roughness, G-ratio,
perbezaan suhu bahan, dan material removal rate adalah parameter yang dipilih sebagai
output. Penggunaan central composite design method adalanh untuk mendapatkan model
jangkaan bagi parameter material removal rate. Analis untuk variance telah dibuat bagi
mengesahkan kejituan model matematik yang dihasilkan. Ianya boleh dilihat melalui nilai
lack of fit untuk model-model adalah kurang daripada 0.005 dan nilai R-square untuk
semua nilai model adalah lebih daripada 90 %. Dengan itu, model matematik untuk
konvensional dan SiO2 nanocoolant untuk proses mencanai single dan multiple pass adalah
diterima pakai. Hasil dari keputusan eksperimen, menunjukkan bahawa kesan untuk
material removal rate bagi bahan adalah lebih baik menggunakan konvensional grinding
fluid, tetapi bagi kesan surface roughness, penggunaan grinding fluid konvensional adalah
kurang memuaskan berbanding SiO2 nanocoolant.

viii
TABLE OF CONTENTS
Page
SUPERVISOR’S DECLARATION ii
STUDENT’S DECLARATION
DEDICATION
iii
iv
ACKNOWLEDGEMENTS v
ABSTRACT vi
ABSTRAK vii
TABLE OF CONTENTS viii
LIST OF TABLES x
LIST OF FIGURES xi
LIST OF SYMBOLS xii
LIST OF ABBREVIATIONS xiii
CHAPTER 1 INTRODUCTION
1.1 Background 1
1.2 Problem Statement 2
1.3 Project Objectives 3
1.4 Scope of Project 3
1.5 Overview of the Report 4
CHAPTER 2 LITERATURE REVIEW
2.1 Introduction 5
2.2 Grinding Processes 6
2.3 Nanocoolant 9
2.4 Response Surface Method 11

ix
CHAPTER 3 METHODOLOGY
3.1 Introduction 12
3.2 Preparation of Nanocoolants 12
3.3 Workpiece Preparation 13
3.4 Grinding Procedure 15
3.5 Central Composite Design 16
3.6 G-ratio 17
CHAPTER 4 RESULTS AND DISCUSSION
4.1 Introduction 18
4.2 Experimental Results 18
4.3 Modelling of Material Removal Rate 20
4.3.1 Analysis of Variances
4.3.2 Mathematical Model
20
22
4.4 G-ratio Analysis 25
4.5 Surface Topology Analysis 28
4.6 Thermal Effects 29
CHAPTER 5 CONCLUSION 31
REFERENCES 32

CHAPTER 1
INTRODUCTION
1.1 BACKGROUND
Metalworking is divided by two operations that are metal forming and metal
removing. Material removal process is among the most important manufacturing
operations. This operation is widely used in order to design or create the metal based on
specifications of the drawing, and this is strictly needed to be very precise. The removal
process is generally divided into two categories that are metal cutting (chip generation)
involving cutting on lathe, milling, planing, shaping, broaching, reaming, sawing,
drilling, grinding, and others. Second is alternative material removal process utilizing
electrical, chemical, optical (laser), and thermal technique. During machining process,
friction between workpiece-cutting tool and cutting tool-chip interfaces cause high
temperature on cutting tool. The effect of the high temperature decreases tool life,
increases surface roughness and decreases the dimensional sensitiveness of work
material (Cakir et al., 2007). This phenomenon is one of the problems when dealing
with grinding process. The increasing of heat on the workpiece will cause more
damages on it physical and also its microstructure properties. The thermal expansion
that causes by the residue tensile stress on the workpiece is beyond the yield stress. It
will give a result in material close to the surface that is under constant tension. The
challenge is to get the high quality of surface finish, accuracy in dimensional, high
production rate and fewer damages to the tool (Thamizhmanii and Hasan, 2006).
In contrast of metal cutting, grinding process require higher speed, smaller
volumes of material removed per unit time, and the desire for improve surface finish
and dimensional control. This requirement is very crucial in order to get the finest
2
surface finish for some metal removing process. Therefore, for better performance of
grinding process, there are something need to deal with is. The grinding process is
performing at high speed, this makes the material become very hot in a very short time.
In this problem, the solutions need to be done. The use of lubrication process is the
ultimate solution. Lubricating is the important part of metal forming process. The
process of grinding required the surface contact between tools and the work piece. This
process generates a new surface and hence the tool-chips and tool-work piece interfaces
are more critical. The new surface that been generated by grinding process are basically
do not have the protection surface layers, such as oxides, lubricants, and contaminants,
that are present on the work piece in forming operations. Thus, the proper lubricating
method is needed to be done in order to overcome the problem when dealing high
friction, elevated temperature and also the wear. This is very important to get a finest
surface finish from grinding operations. The benefit that can get when using the various
type of grinding fluid is such as longer tool life, and better dimensional accuracy. These
results also offer higher cutting speeds, feed rates and depths of cut (Cakir et al., 2007).
To improve the use of lubrication process, nanotechnologies are the best way to
deals with it. Nanofluid is the advanced product for lubricating fluids. The term ‘Nano’
describes the process of reducing the conventional material to the nanoscale that will be
the effect on the fundamental physical and chemical properties to the great extent.
Nanomaterial is prepared atom by atom or molecule by molecule to produce
functionalized better material with distinctly unique properties. These nanotechnologies
are involved to work at the molecular level in order to create a larger structure with
fundamentally new arrangements. The good thing of nanotechnologies is the accuracy
of placement, measurement, manipulation, and modelling of the matter in the range of
0.1 to 100 nanometres. When dealing in this range, the classic laws of physics are
change and the production of new structure of materials with new properties becomes
possible.
1.2 PROBLEM STATEMENT
Grinding process is one of the material removal process that is widely used in
industry. This process is been the practice in order to get better surface quality and also

3
very near tolerance that is very strict for design components. Since there is no other
suitable way to do this task, grinding process are been chosen. When there is about
grinding, the term thermal or high temperature will be heard. This is because this
operation deals with high speed cutting tools that are abrasive wheel. When the tools are
making contact with the workpiece surface, the heat rises in the second. In grinding
process, it is involved with several parameters and this project will cover the depth of
cut, speed of wheel and the feed rate. This is all the parameter that will be manipulated
to have such a result. Coolant is used to enhance the performance of grinding in giving
the better surface finish, reduce the temperature between the surface contacts and also
can clean the surface from the chip generations during grinding process. Although the
coolant gives solutions to the grinding process problem, still the performance is not
good enough. The introduction of nanocoolant of the new coolant to replace the
conventional coolant in order to overcome the temperature and surface finish problem.
In this project, the investigate differentiation between the conventional coolant and
nanocoolant in terms of material removal rate (MRR), and G-ratio.
1.3 PROJECT OBJECTIVES
The objectives of this project are as following:
1) To investigate the performance of grinding of ductile iron based on design of
experiment
2) To develop prediction model for material removal rate using central composite
design method.
1.4 SCOPE OF PROJECT
The scopes of this project are to construct the design of an experiment of
material removal rate and also the preparations of SiO2 Nanocoolant. In this research
also perform the experiment on grinding machine utilizing abrasive grinding wheel
using water based SiO2 nanocoolant. Mathematical modelling for MRR and G-ratio
analysis will also be discussed in this research, and all the data will be statically analyze
using the central composite method.

4
1.5 OVERVIEW OF THE REPORT
There are all five chapters in this report. Chapter 1 is the introduction of this
report. Chapter 2 provides more information about previous study that gives an evident
that this research is possible to carry on. Chapter 3 presents the methodology of this
research. All the machining process, the material involved and the equipment to run this
research are discussed details in this chapter. Chapter 4 presents the important finding
and their discussion. Chapter 5 is summarized the finding and proposed
recommendation for future work.

CHAPTER 2
LITERATURE REVIEW
2.1 INTRODUCTION
From the beginning of this project, various literature studies have been done.
The previous study about grinding, the use of nanocoolant and the evidence that show
this research is possible to be run. Many of the research mention of the heat problem,
and one of the solutions is using nanocoolant because it has a thermal conductivity
effect much higher than conventional coolant. In material removal operations, the role
of grinding process is vital. This process that contains the used of the abrasive wheel in
order to design the material is an example one of the oldest processes of manufacturing.
In terms of machining operations expenditure in industrialized countries, its account for
nearly 20-25% of the total and it is more costly than other material removal processes.
Grinding process is the abrasive material process that extensively been practise in
manufacturing industries for finishing operations that demand fine surface finish and
close tolerances. In grinding process, mostly the mechanical energy is turned into heat.
At very high-temperature, the heat can cause thermal and mechanical damages to the
workpiece. It affects the workpiece surface quality and process productivity. Therefore,
this is one of the factors that need to be overcome in operational of grinding process.
The amount of heat that enters the workpiece is important because it impacts the quality
of the finished part. High temperature can lead to workpiece burn, thermal softening,
and dimensional distortion (Chen et al., 1999)

6
2.2 GRINDING PROCESSES
Grinding is very complicated, which involved many parameters that included
such as wheel speed, depth of cut, work speed, density and, etc. Since the goal is to get
the fine surface finish and also the very near tolerance, grinding process need to be a
study for better performance. The low speed of grinding can waste the abrasive wheel,
but the high speed cause a hard grinding action and glaze the wheel. It can make the
grinding process is inefficient (U.S Army, 1996). It introduces a nanocoolant as a new
medium for the choice of coolant for a grinding process. In order to meet standard high
surface finish, narrow tolerance and actually, the total overall process of grinding
performance by controlling heat and wheel wear, a heavy supply of conventional fluids
is used and for these situations, the nanocoolant are been chosen. Coolant flow, coolant
pressure, tank size, and filtration are among the most important issues regarding
optimization of your grinding system. First, the coolant flow should, in almost all cases,
exceed the velocity of the wheel (Dale Savington, 2000). Heavy usage of lubricants is
not guaranteed to enhance the lubrication action, but the effectiveness of the lubricating
performance is depending on the fluid actually entering the arc contact. In addition,
coolant keeps the chips washed away from the grinding wheel and point of contact, thus
permitting free cutting (U.S Army, 1996). Figure 2.1 shows the different types of
grinding processes.
(a) Horizontal Grinding (b) Centreless Grinding
Figure 2.1: Types of grinding processes
Source: Colton (2009)

7
In conventional grinding process, there are three significant components that
need to be awarded. During grinding, high friction generated by the sliding action of
abrasive grains over the workpiece surface is converted into heat, causing the high
temperature particularly at wheel-workpiece contact zone. The three components are
abrasive wheel, grinding fluids and the limitations of conventional grinding process.
Such elevated temperature at the interface can cause thermal damage to the workpiece,
which affects its surface quality and limits the process efficiency. Abrasive wheel, the
grinding process tools and grinding fluid are two most important part of the process. In
grinding process, the cutting tools that used in this process are bonded abrasive wheel.
The bonded wheel is made from a matrix of tiny and coarse abrasive particle called
grains/grit pressed and bonded together with the bonding agent to form a solid, circular
shape. A grinding wheel surface consists of numerous cutting edges or a sharp grit
which means to remove the material from the workpiece surface.
This property of grinding wheel makes the process a multi point cutting tool
operations. The grinding wheel is also characterized by its blunt edges on the surface
and microscopic between the grits. The bonding matrix in which the abrasive grains are
fixed may include a variety of organic materials such as rubber, shellac or resin;
inorganic materials such as clay are also used. Inorganic bonds with glass-like or
vitreous structures are used on the tool-sharpening wheels for the home workshop
grinder, while resin bonds are used in masonry or steel-cutting wheels. Generally,
vitrified bonds are used with medium to fine grain sizes in wheels needed for precision
work. Resin bonds are used generally with coarse grains and for heavy-metal removal
operations such as foundry work. In addition to their abrasive and bonding materials,
grinding wheels often contain additional ingredients that produce pores within the wheel
or assists chemically when a particular abrasive is used to grind a special material. One
important aspect of a grinding wheel that can be created or altered through additives is
porosity, which also contributes to the cutting characteristics of the grinding wheel.
Porosity refers to the open spaces within the bond that allow room for small chips of
metal, and abrasive generated during the grinding process. Porosity also provides
pathways that carry fluids used to control heat and improve the cutting characteristics of
the abrasive grains. Without adequate porosity and spacing between abrasive grains, the
wheel can become loaded with chips and cease to cut properly.

8
In grinding process of the abrasive material removal process, the grinding fluids
serve to the following important functions. The grinding fluid does give a lubrication
action for the process. The fluid gives the area of contact with the grinding that is
between the grinding wheel and the surface of the workpiece less in sliding friction
between them. The grinding fluid also gives the cooling effect for the area of contact of
the grinding process. This is very important to give the surface of workpiece a low-
temperature experience which is exposing with high temperature will give certain
damage to the workpiece surface. In addition, the flow of the grinding fluid will flush
away the remaining chip on the surface that can affect the performance of grinding
process. When the lubricating action is done, the effectiveness of this method can
reduce the sliding frictions and wear by performing low shear strength-transfer film
between the rubbing surfaces. The application of lubricating only took a part if only the
fluids actually entering the arc of contact between the grinding wheel and workpiece.
The capability of the fluids to remove or flush away the chip is depended on the flow
speed and quantity of the fluid applied. The lubricating additives should have been
capable of overcoating the swarf to avoid the workpiece surface from damages.
The supply of coolant to the grinding wheel is vital to the grinding process. The coolant
helps keep the work piece and grinding wheel cool so the material being machined is not
burned. In addition, the coolant transfers away the swarf material, keeping it from fouling the
wheel. In order to make the lubrication performance is just as right to keep the material from
any damages from heat or surface on its surface, the right amount of fluids needs to be control
or the lubricating will give a bigger impact on grinding process. The better performance of
grinding process is archived with the use of lubricants/fluids. The additional of using the
nanoparticles/nanofluids will give the bigger impact. The transition from microparticles
to nanoparticles can lead to a number of changes in physical properties. Two of the
major factors in this is the increase in the ratio of surface area to volume, and the size of
the particle moving into the realm where quantum effects predominate. The use of
nanofluids as lubricating medium for grinding process is the better solution to improve
the surface finish and also the near tolerance of the material.

9
2.3 NANOCOOLANT
The three limitations give an impact for two major problems that is the quality of
the finish workpiece and the cost to produce a workpiece. The quality of the workpiece
can be control by the usage of coolant. In order to improve the performance of coolant,
the introducing of nanocoolant/nanofluids is the best solutions. Nanofluids are solid-
liquid composite materials consisting of solid nanoparticles or nanofibers with sizes
typically of 1 to 100 nm suspended in liquid. The performance of the coolant to give a
reduction of heat on the workpiece is concerned with the properties of its heat transfer's
capability. The high value of heat transfer properties can lead to better performance of
coolant.
The coolant needs to have a capability to reduce the temperature that exists
between the grinding tools and the workpiece. In grinding process, when the workpiece
surface been cut by the tools, the new surface will be existed, if the that surface not treat
well such as to control the temperature rising on it, it will make the surface burn that it
the surface will be gone to be damages, and the fine surface finish will not be achieved.
The surface of the workpiece also tends to crack if the surface gets to overload value of
temperature. The grinding process generates an extremely high input of energy per unit
volume of material removed.
Virtually, all this energy is converted to heat, which can cause high temperatures
and thermal damage to the workpiece such as workpiece burn, phase transformations,
undesirable residual tensile stresses, cracks, reduced fatigue strength, and thermal
distortion and inaccuracies. All this damage affected the surface finish of the workpiece.
The better used of coolant when the coolants are fully coated the surface of the
workpiece which mean can cover the new layer of surface and also wash away the chips
generated by the grinding of the surface to give the tool a better performance to make a
clean cut. The introducing of nanoparticles in this case is very important. The use of
solid particles as an additive suspended within the base fluid is the technique for the
heat-transfer enhancement. Improving the thermal conductivity is the key idea to
improve the heat-transfer characteristics of conventional fluids (Sridhara and Satapathy,

10
2011). The additions of solid particle as catalyze to perform better thermal conductivity
through the coolant.
Since the solid is known to be more conductive to heat than the liquid, it was
very significant that the solution of coolant with solid particle based will give better
performance of reducing the temperature of material that been grinded. The
enhancement of thermal conductivity of conventional fluids by the suspension of solid
particles, such as millimeter- or micrometer- sized particles has been well-known for
many years (Sridhara and Satapathy, 2011). This is the first step to make the
conventional coolant to a new improvisation. The addition of micrometer- or
millimeter-sized solid metal or metal oxide particles to the base fluids shows an
increment in the thermal conductivity of resultant fluids. But the presence of milli- or
microsized particles in a fluid poses a number of problems. They do not form a stable
solution and tend to settle down (Oronzio et al., 2010). So, the additional of solid
particle eventually solved the heat-transfer problem but come with a new problem.
However, they have not been of interest for practical applications due to problems such
as sedimentation leading to increased pressure drop in the flow channel (Sridhara and
Satapathy, 2011).
This is the right time to introduce what they said coolant with nanosizes or
nanocoolants/nanoparticles. Nanofluids are solid-liquid composite materials consisting
of solid nanoparticles or nanofibers with sizes typically of 1 to 100 nm suspended in
liquid (Sridhara and Satapathy, 2011). Several investigations have revealed that the
thermal conductivity of the fluid containing nanoparticles could be increased by more
than 20% for the case of very low nanoparticles concentrations (Oronzio et al., 2010).
Based on the earlier study about nanoparticles, it has shown that these elements can give
the significant impact on conductive the heat and since the size is reduced to nanosizes,
the problems such as the pressure drop in the flow channel can be reduced. There is an
evident to the previous study that the usage of nanocoolant gives the better performance
in case of thermal conductivity. The nanocoolant itself has higher the value of thermal
conductivity.

11
The silicon dioxide or can be called as silica is the chemical compound with the
chemical formula of SiO2. The hardness of this compound is already known since the
ancient times. This compound is commonly found in nature as sand and quartz. The
primary use of silica is in production of glasses, and the majority of optical fibers are
also using silica as the main component. Silica also used as the additive for the food
product. The purpose of using this is to water in hygroscopic applications and also as
the flow agent in powdered foods. The thermal conductivity is the main purpose to use
the silica as the nanoparticles to dissolve in water. These properties will give the effect
that increases the ability of the fluid to absorb the heat from the workpiece while in
grinding process. The heat that has been absorbed will reduce the possibility of the
workpiece to burn from high temperature and give fewer defects from excessive heat.
2.4 RESPONSE SURFACE METHOD
Generally, the is the interest of response variable that can be denoted by y with
the set of the predictor variables like x1, x2 and so on. This is what been faced by many
researcher with their experimental desire. Such example in dynamic network analysis
(DNA), response surface methodology (RSM) can be useful for sensitivity of various
DNA measures for the different type of random graphs and errors (Carley et al ., 2004).
There is the basic correspond with that need to use from certain experimental research
that is statistical experimental design fundamentals, regression modeling and also
optimization methods. This requirement is always used to identify and fitting from
experimental data for response surface methodology. RSM is actually the technique that
for developing, improving and optimizing the process by some of the statistical data
collection.
In this report, the main objective to use the RSM is to get the performance
measure for the interest response that is material removal rate (MRR) of the surface of
the material. The material will go under several sets of grinding process techniques.
There will be some input that will influence the interest response that is speed of table
of grinding machine and also the depth of cut (DOC) for grinding feed. These two
variables will use in order to model the experimental design and also to get the
prediction equation for the MRR.

CHAPTER 3
METHODOLOGY
3.1 INTRODUCTION
This chapter gives the method use to conduct the experiment based on this
research. Start with the preparations of workpeice materials and also nanocoolant, this
procedure is the guidelines on doing all the actions for running the experiments. The
parameter selection for this experiment is based on the literature study from passed
research and the output of this experiment is according to the objective and scope of this
research. The machine and all apparatus use in this experiment are available in UMP lab
such as Bend saw cutting machine, milling machine, Mahr Perthometer S2, Tachometer,
2D Microscope, Weight Balance and Surface grinding machine.
3.2 PREPARATION OF NANOCOOLANTS
There are two steps in preparation of nanocoolant that is:
1) Single-step direct evaporation method: In this method, the direct evaporation
and condensation of the nanoparticulate materials in the base liquid are obtained
to produce stable nanofluids.
2) Two-step method: In this method, first the nanoparticles are obtained by
different methods and then are dispersed into the base liquid.

13
In this experiment, the second step of preparation of nanocoolant is used. Firstly
the calculation is to be done because the SiO2 that is in weight %. So, the value needs to
convert to volume %. Eq. (3.1) is used to change the silica from weight % to volume %.
pw
w
1001
100
(3.1)
where
When the volume in % is obtained, the further process to calculate how much
the water need to dissolve the SiO2 nanoparticle to get the right 5 % of water based SiO2
nanoparticle. The equation used is as in Eq. (3.2)
1
2
1
1
VV (3.2)
where,
3.3 WORKPIECE PREPARATION
In this experiment, the material used is cast iron. The material is obtained from
the foundry lab at UMP in raw material conditions. The raw material is been machining
to get the dimensions according to the specifications needs.
Workpiece specifications are as follows:
Type of material : Cast iron
Dimensions : (20×30×65) mm
When the material is already been squaring, the next move is to cut its piece by
piece. There is 9 sample of workpiece is needed. This ductile iron needs to cut by this
bend saw due to its hardness and this machine also gives an accurate cut. Milling
machine is used to squaring the raw shape of material. The process need to be done to

14
get the dimensions of the workpiece. Figure 3.1 shows the milling machine that is used
in this experiment. Figure 3.2 also shows the bend saw cutting machine.
Figure 3.1: Milling Machine
Figure 3.2: Bend Saw Cutting Machine

15
3.4 GRINDING PROCEDURE
In this experiment, the type of grinding use is surface grinding method. The
parameter of the grinding will be set according to the Design of Experiment (DOE). The
value of the parameter that is speed of table and depth of cut (DOC) will be used
according to this DOE as shown in Table 3.1.
Table 3.1: Design of Experiment
Workpiece Table
Speed
(m/min)
Depth
of Cut
(µm)
Mass
Different
(g)
Diameter
Different
(mm)
Temperature
Different
(⁰c)
Time
Taken
(s)
A 20 20
B 20 20
C 20 20
D 30 40
E 30 40
F 30 40
G 40 60
H 40 60
I 40 60
There is two input parameter and its initial value for the experiment. There is 9
sample of test will be done. The desired value is the mass different, diameter different of
grinding disk and temperature different. The time taken is based on the experimental
grinding method. There is 2 types method of grinding is applied including single pass
and multiple pass grinding technique. The single pass method will let the grinding disk
feed the workpiece surface for a one feed only. For multiple pass the grinding disk will
make contact with the surface of the workpiece for 10 times. The time will started when
the machine is run and will stop counting when the pass grinding pass is finished for 1
strike for single pass and 10 strikes for multiple pass. Table 3.2 shows the time taken for
each experiment. The time taken is based on the value of speed of table. The high value
of speed table so less time was the grinding disk that made contact to the workpiece
surface. This supposes to give the different result for material removal rate (MRR) and
also for surface roughness effect on surface material. The experiment for each single
and multiple pass were gone less than two set of grinding fluid that is conventional
grinding fluid and also water based SiO2 nanocoolant. This experiment will be

16
conducted according to the DOE. Table 3.3 is listed the combination of experiments
conducted.
Table 3.2: Time Taken for Each Experiment
Type of Experiment Speed of Table
(m/min)
Time Taken
(s)
Single Pass
20 0.85
30 0.64
40 0.42
Multiple Pass
20 8.7
30 6.5
40 4.2
Table 3.3: List of Experiments
Types of Grinding Fluid Grinding Technique Abbreviation
Conventional Grinding Fluid Single-pass Conventional sp
Conventional Grinding Fluid Multiple-pass Conventional mp
Water Based SiO2
Nanocoolant
Singe-pass SiO2 sp
Water Based SiO2
Nanocoolant
Multiple-pass SiO2 mp
3.5 CENTRAL COMPOSITE DESIGN
This is the process to get the prediction model for the material removal rate
(MRR) for each four types of experiment that been done. All the value regarding the
experiment will used to gain this result. To get the value for MRR, the mass different of
the workpiece before and after and also the time taken is used.
MRR=
(3.3)
From this information result, the value of these experiment will gather to get the
prediction model of the MRR. All the equations and other interest vale related to its like
analysis of varience (ANOVA) and lack of fits will be use togather in order to get the
finest prediction model of MRR.Table 3.4 shows the design of central composite

17
method. The minus (-) sign and the lowercase (a) sign indicate the value of minimum of
the parameter. The positive (+) sign and capital letter (A) indicate the value of
maximum paramater. The zero (0) is indicate the value of the middle of the parameter
value.
Table 3.4 Central composite design method
No Pattern Speed of Table
(m/min)
Depth of Cut
(µm)
MRR
(g/s)
1 -- 20 20 0.179
2 a0 20 40 0.362
3 -+ 20 60 0.533
4 0a 30 20 0.230
5 00 30 40 0.472
6 00 30 40 0.400
7 0A 30 60 0.698
8 +- 40 20 0.329
9 A0 40 40 0.698
10 ++ 40 60 1.131
3.6 G-RATIO
G-ratio value is the value of material removal rate (MRR) and the value of the
tool wear. This value is need to study about the workpiece material and the grinding
wheel. This value is shown the interaction between the MRR and the tool wear. The
higher the value of G-ratio the better the method of grinding it is. To get the value of G-
ratio is by using Eq. (3.4).
G-ratio =
(3.4)

CHAPTER 4
RESULTS AND DISCUSSION
4.1 INTRODUCTION
This chapter contains the information of result from experimental and modeling
based on response surface method. The mathematical modeling for conventional and
nanocoolant are developed. The significance and adequacy of these models are verified
by analysis of variance using the response surface method. The accuracy of the RSM
model is studied. Moreover, this chapter depicts the optimal settings in order to achieve
the optimum machining performance.
4.2 EXPERIMENTAL RESULTS
There are four types of experiments have been performed on grinding ductile
iron using conventional grinding fluid and water based SiO2 nanocoolant with single-
pass (sp) and multiple-pass (mp) grinding technique. The results for various
combination of grinding processes and different cooling fluids are presented in
Table 4.1 – Table 4.4. The analysis is based on the material removal rate (MRR), G-
Ratio, and surface roughness (SR). This result gives the experimental value to obtain for
each desired parameter. The relationship between the parameter grinding is single pass
and multiple pass grinding technique. The result may vary from each of technique and
the use of different grinding fluid that is conventional grinding fluid and nanocoolant
SiO2 water based will give the different result. The analysis is based on the material
removal rate, G-Ratio, and surface roughness.

19
Table 4.1: Experimental result for conventional single pass
Workpiece Table
Speed
(m/min)
Depth
of Cut
(µm)
Mass
Different
(g)
Diameter
Different
(mm)
Temperature
Different
(⁰c)
Time
Taken
(s)
A 20 20 0.152 0.05 1 0.85
B 20 20 0.308 0.05 1 0.85
C 20 20 0.453 0.10 1 0.85
D 30 40 0.147 0.05 1 0.64
E 30 40 0.302 0.10 1 0.64
F 30 40 0.447 0.10 1 0.64
G 40 60 0.138 0.10 2 0.42
H 40 60 0.293 0.15 2 0.42
I 40 60 0.475 0.20 3 0.42
Table 4.2: Experimental result for conventional multiple pass
Workpiece Table
Speed
(m/min)
Depth
of Cut
(µm)
Mass
Different
(g)
Diameter
Different
(mm)
Temperature
Different
(⁰c)
Time
Taken
(s)
A 20 20 0.204 0.15 1 8.7
B 20 20 0.354 0.10 1 8.7
C 20 20 0.512 0.15 1 8.7
D 30 40 0.196 0.15 2 6.5
E 30 40 0.347 0.20 2 6.5
F 30 40 0.498 0.25 3 6.5
G 40 60 0.192 0.30 3 4.2
H 40 60 0.342 0.35 3 4.2
I 40 60 0.487 0.45 4 4.2
Table 4.3: Experimental result for SiO2 single pass
Workpiece Table
Speed
(m/min)
Depth
of Cut
(µm)
Mass
Different
(g)
Diameter
Different
(mm)
Temperature
Different
(⁰c)
Time
Taken
(s)
A 20 20 0.062 0.005 0 0.85
B 20 20 0.146 0.005 0 0.85
C 20 20 0.281 0.010 1 0.85
D 30 40 0.062 0.005 1 0.64
E 30 40 0.023 0.005 0 0.64
F 30 40 0.270 0.005 0 0.64
G 40 60 0.229 0.005 0 0.42
H 40 60 0.011 0.005 0 0.42
I 40 60 0.178 0.010 1 0.42

20
Table 4.4: Experimental result for SiO2 multiple pass
Workpiece Table
Speed
(m/min)
Depth
of Cut
(µm)
Mass
Different
(g)
Diameter
Different
(mm)
Temperature
Different
(⁰c)
Time
Taken
(s)
A 20 20 0.071 0.005 1 8.7
B 20 20 0.228 0.010 0 8.7
C 20 20 0.473 0.025 0 8.7
D 30 40 0.210 0.085 1 6.5
E 30 40 0.263 0.095 0 6.5
F 30 40 0.114 0.085 0 6.5
G 40 60 0.361 0.005 0 4.2
H 40 60 0.304 0.070 0 4.2
I 40 60 10.208 0.005 1 4.2
4.3 MODELLING OF MATERIAL REMOVAL RATE
4.3.1 Analysis of Variance
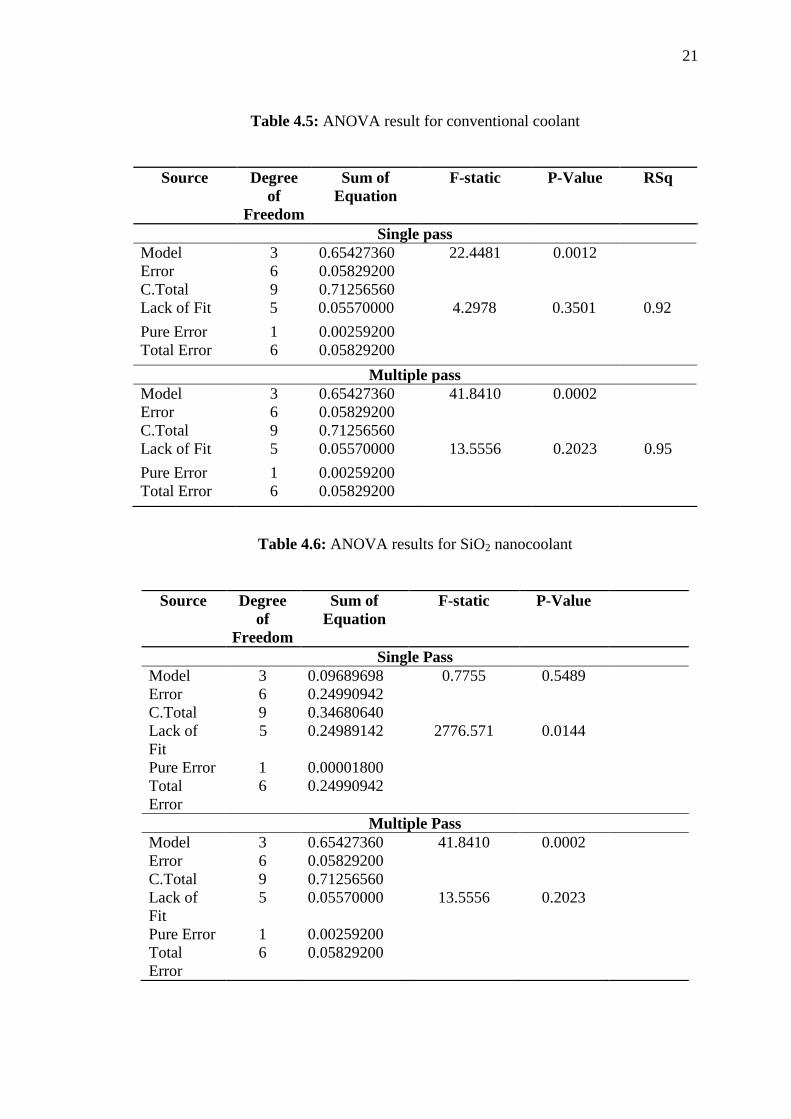
Table 4.5 and 4.6 give the summary of the analysis of variance for conventional
and SiO2 nanocoolant experiment. It can beseen that the P-value of lack of fit is more
than 0.05 for all cases. Therefore, the models are adequate and fir for the further
analysis.
From the sumarry value of the analysis, the result shows how the prediction
model of MRR will be performed. This statistical result tell that the conventional
experiment give the better prediction for MRR prediction model. The experiment with
conventional single pass shows the value of p-value for model that is 0.0012 and for
lack of fit is 0.3501. For conventional multiple pass the p-value for model is 0.0002 and
for lack of fit is 0.2023. The F-static value is indicate where there is higher the value of
F-static when there is significant effect in the model. The RSq value indicate how the
correlation between the actual and the predicted model. Value of 1 refer to the perfect fit
and 0 value mean that the fit predict the response no better than the overall response
mean. For SiO2 experiment, both give unexpexted value. The value for SiO2 single pass
of P-value for model is 0.5489 and for lack of fit is 0.0144. For SiO2 multiple pass, the
P-value for model is 0.0002 and lack of fit is 0.2023.
21
Table 4.5: ANOVA result for conventional coolant
Table 4.6: ANOVA results for SiO2 nanocoolant
Source Degree
of
Freedom
Sum of
Equation
F-static P-Value RSq
Single pass
Model 3 0.65427360 22.4481 0.0012
Error 6 0.05829200
C.Total 9 0.71256560
Lack of Fit 5 0.05570000 4.2978 0.3501 0.92
Pure Error 1 0.00259200
Total Error 6 0.05829200
Multiple pass
Model 3 0.65427360 41.8410 0.0002
Error 6 0.05829200
C.Total 9 0.71256560
Lack of Fit 5 0.05570000 13.5556 0.2023 0.95
Pure Error 1 0.00259200
Total Error 6 0.05829200
Source Degree
of
Freedom
Sum of
Equation
F-static P-Value
Single Pass
Model 3 0.09689698 0.7755 0.5489
Error 6 0.24990942
C.Total 9 0.34680640
Lack of
Fit
5 0.24989142 2776.571 0.0144
Pure Error 1 0.00001800
Total
Error
6 0.24990942
Multiple Pass
Model 3 0.65427360 41.8410 0.0002
Error 6 0.05829200
C.Total 9 0.71256560
Lack of
Fit
5 0.05570000 13.5556 0.2023
Pure Error 1 0.00259200
Total
Error
6 0.05829200
22
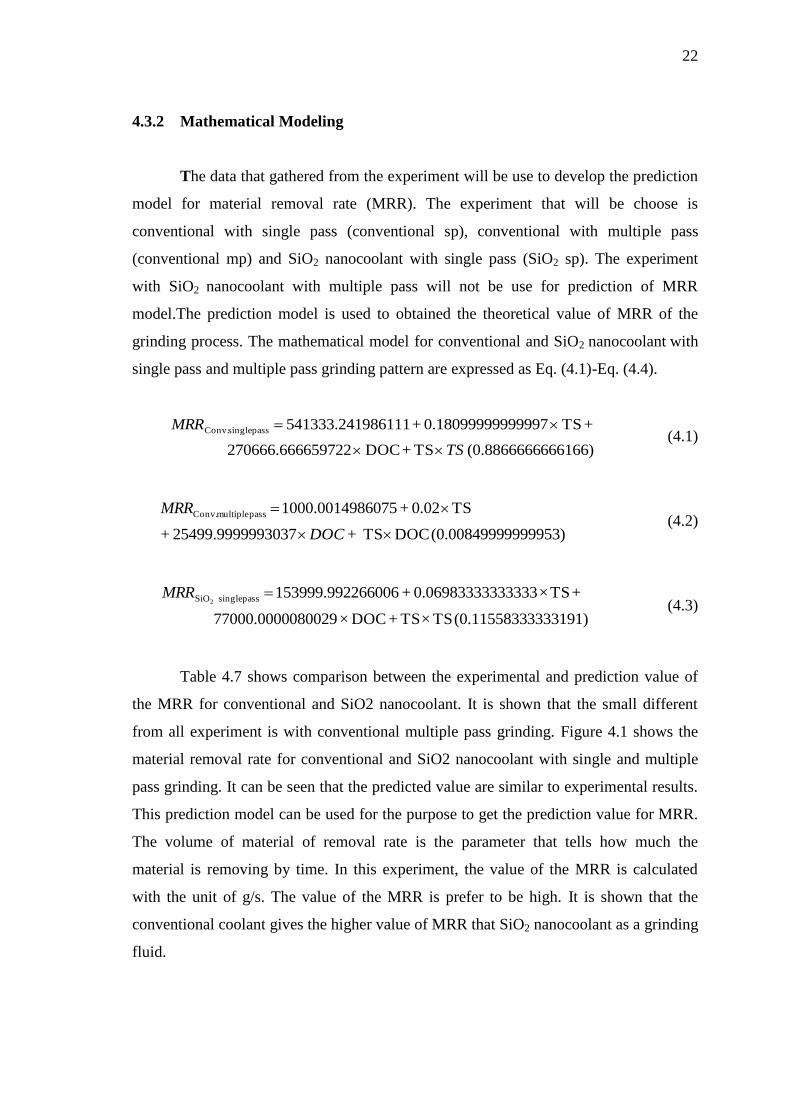
4.3.2 Mathematical Modeling
The data that gathered from the experiment will be use to develop the prediction
model for material removal rate (MRR). The experiment that will be choose is
conventional with single pass (conventional sp), conventional with multiple pass
(conventional mp) and SiO2 nanocoolant with single pass (SiO2 sp). The experiment
with SiO2 nanocoolant with multiple pass will not be use for prediction of MRR
model.The prediction model is used to obtained the theoretical value of MRR of the
grinding process. The mathematical model for conventional and SiO2 nanocoolant with
single pass and multiple pass grinding pattern are expressed as Eq. (4.1)-Eq. (4.4).
666166)(0.8866666 TS + DOC 659722270666.666
+TS 9999970.18099999 + 986111541333.241pass single Conv.
TS
MRR
(4.1)
9999953)(0.0084999 DOC TS + 99303725499.9999 +
TS0.02 + 860751000.00149pass multiple Conv.
DOC
MRR (4.2)
3333191)(0.1155833 TS×TS +DOC×08002977000.0000
+ TS ×3333330.06983333 + 266006153999.992pass single SiO2MRR
(4.3)
Table 4.7 shows comparison between the experimental and prediction value of
the MRR for conventional and SiO2 nanocoolant. It is shown that the small different
from all experiment is with conventional multiple pass grinding. Figure 4.1 shows the
material removal rate for conventional and SiO2 nanocoolant with single and multiple
pass grinding. It can be seen that the predicted value are similar to experimental results.
This prediction model can be used for the purpose to get the prediction value for MRR.
The volume of material of removal rate is the parameter that tells how much the
material is removing by time. In this experiment, the value of the MRR is calculated
with the unit of g/s. The value of the MRR is prefer to be high. It is shown that the
conventional coolant gives the higher value of MRR that SiO2 nanocoolant as a grinding
fluid.

23
(a) Single pass grinding
(b) Multiple pass
Figure 4.1: Material removal rate for conventional and SiO2 nanocoolant with single
and multiple pass grinding
0
0.2
0.4
0.6
0.8
1
1.2
A B C D E F G H I
MR
R (
g/s)
EXPERIMENTS
Conventional sp
SiO2 sp
0
0.02
0.04
0.06
0.08
0.1
0.12
0.14
0.16
0.18
0.2
A B C D E F G H I
MR
R (
g/s)
EXPERIMENTS
Conventional mp
SiO2 mp

24
Table 4.7: MRR for conventional and SiO2 nanocoolant
Workpiece TS
(m/min)
DOC
(µm)
Conventional
single pass
Conventional
multiple pass
SiO2
sp
SiO2
mp
A 20 20 0.176 0.023 0.073 0.008
B 20 40 0.362 0.041 0.172 0.026
C 20 60 0.533 0.059 0.331 0.054
D 30 20 0.230 0.030 0.097 0.032
E 30 40 0.472 0.053 0.036 0.040
F 30 60 0.698 0.077 0.422 0.018
G 40 20 0.329 0.046 0.545 0.086
H 40 40 0.698 0.081 0.026 0.072
I 40 60 1.131 0.116 0.424 2.430
(a) Conventional coolant single pass (b) Conventional coolant multiple pass
(a) SiO2 nanocoolant single pass (b) SiO2 nanocoolant multiple pass
Figure 4.2: Variation of MRR vs table speed for different depth of cut

25
Figure 4.2 shows the interaction between speed of table and depth of cut (DOC)
that influenced the material removal rate for conventional coolant and SiO2 nanocoolant
with single and multiple pass grinding. It can be seen that the increasing of speed of
table and DOC makes the MRR higher for all cases. The result shows that with speed of
table of 20 m/min, the highest value for MRR is 0.059 with the DOC of 60 µm while the
lowest is with the DOC of 20 µm is 0.023. For the speed of table of 30 m/min, the
highest value of MRR is 0.077 that is with the DOC of 60 µm and the lowest value is
with the DOC of 20 µm that is 0.030. The last is with the value of speed of table of 40
m/min, the highest vale for MRR is 0.116 that is with the DOC of 60 µm and the lowest
value is 0.046 that is with the DOC of 20 µm. The result tells that the DOC and the
speed of table give the influences to the MRR value. It is shown the high value of both
parameter that is speed of table and DOC give the high value of MRR.
4.5 G-RATIO ANALYSIS
Table 4.8 shows the G-ratio value for conventional coolant and SiO2
nanocoolant with single and multiple pass grinding. G-ratio is the parameter that
describes the relationship between the material removal (MRR) and the tool wear (TW).
The MRR is needed to be high and TW is needed to be low. The G-ratio will give the
better information that tells what the best parameter needs to choose to get the better
performance of grinding process. The G-ratio is the ratio between the MRR and TW.
Accordingly, the higher value of G-ratio is better for the grinding process of parameter
choice. The value of G-ratio is been influence by the MRR and TW value. Some of
value seem too high, this is occur because of some defect may happen to the workpiece.
Subsequently, the value of that result will also be discuss but when the data is converted
into graph, the dummy value will be used so the graph will be easily to analyze and also
easy to understand.

26
Table 4.8: G-ratio value for each experiment
Workpiece TS
(m/min)
DOC
(µm)
G-Ratio
Conventional
sp
Conventional
mp
SiO2
sp
SiO2
Mp
A 20 20 3.576 0.156 14.588 1.632
B 20 40 7.247 0.407 34.353 5.241
C 20 60 5.329 0.392 33.059 5.437
D 30 20 4.594 0.201 19.375 6.462
E 30 40 4.719 0.267 7.188 8.092
F 30 60 6.984 0.306 84.375 3.508
G 40 20 3.286 0.152 109.048 17.190
H 40 40 4.651 0.233 5.238 14.476
I 40 60 5.655 0.258 42.381 243.048
Figure 4.3 shows the G-ratio value of conventional and nanocoolant grinding
fluid with single and multiple pass grinding. It can be observed that the G-ratio is very
much higher than conventional coolant. It is satisfy with the value of TW for
nanocoolant grinding fluid is very low than conventional nanocoolant. The range is very
high. Therefore, in term of G-ratio value, the nanocoolant grinding fluid is the best
choice. This information also tell that the relationship between the MRR and TW. When
the MRR and TW values are high, it gives the low G-ratio value however the MRR is
high and the TW value low, the result will be show the high value of G-ratio. Thus, this
parameter is important to improvise the value of parameter need to choose to get both
qualities for MRR and TW value. The nanocoolant grinding fluid gives the better result
for G-ratio value. Since the value of TW for nanocoolant grinding fluid is low it is give
the result with the high value of G-ratio. Although the value of MRR for conventional
grinding fluid is less than nanocoolant grinds fluid but in G-ratio term, the nanocoolant
grinding gives the different result. It is shown that both of MRR and TW is the
important parameter to be control in processing a surface grinding because it is related
to the workpiece material and also the life of the tool.

27
(a) Single pass pattern
(b) Multiple pass pattern
Figure 4.3: G-ratio value
0
10
20
30
40
50
60
70
A B C D E F G H I
G-R
atio
EXPERIMENTS
Conventional sp
SiO2 sp
0
2
4
6
8
10
12
14
16
18
20
A B C D E F G H I
G-R
atio
EXPERIMENTS
Conventional mp
SiO2 mp

28
4.6 SURFACE TOPOLOGY ANALYSIS
Figure 4.4 shows the surface topology for conventional and SiO2 nanocoolant
from the surface roughness analysis, the value of Ra is just slightly different from each
experiment. Therefore, this method of scanning the surface of the workpiece can give
the better proof that the surface of the workpiece is acceptable.
(a) Conventional grinding fluid
(b) Nanocoolant grinding fluid
Figure 4.4: Surface topology with magnification of 200x

29
Figure 4.5 shows the defect on the surface of the workpiece, with the
magnificent of 700 times, the defect can be seen and this may be occurring as a result of
the rough feed by the grinding disk. The depth of cut (DOC) of the grinding disk is
given this kind of defect. This image is from one of the specimen with the DOC of 60
µm.
Figure 4.5: Defect on surface of the workpiece
4.7 THERMAL EFFECT
It is state that the element of thermal conductivity gives the effect of cooling for
the grinding process. The different of temperature of the workpiece is using the different
type of grinding fluid. The different of temperature can be seen from Table 4.9. It is
observed that the different of the temperature for each experiment. The temperature
different with water based SiO2 nanocoolant gives the better performance than the
conventional grinding fluid. This cooling effect gives less damage to the surface
workpiece. The high temperature that occurs at the surface of the workpiece can damage
the surface of the workpiece.

30
Table 4.9: The different of temperature for each experiment
Workpiece Temperature Different (⁰c)
Conventional sp Conventional mp SiO2 sp SiO2 mp
A 1 1 0 1
B 1 1 0 0
C 1 1 1 0
D 1 2 1 1
E 1 2 0 0
F 1 3 0 0
G 2 3 0 0
H 2 3 0 0
I 3 4 1 1

CHAPTER 5
CONCLUSION
In this chapter, the conclusion will be made according to the objective of the
project. It has been demonstrated that using the central composite design, the prediction
model for MRR can be obtained. There are four types of experiment have been carried
out. Conventional multiple pass gives prediction model is near to the experimental
value. It can be seen that the prediction model can be used for other value of parameter
since the stable and slightly different of value from the experimental and the prediction
model. The prediction model that gives the best with using conventional grinding fluid
by using multiple pass method of grinding. The results show that the grinding using the
nanocoolant is gives the better result than the conventional grinding fluid. The
nanocoolant performs well for four elements that are for surface roughness, tool wear,
G-ratio. The result supposes occur because of the properties of the nanocoolant. Since
the value of thermal conductivity is higher than the conventional grinding fluid, it
provides better cooling effect and also gives the better condition for a grinding wheel.
For recommendation, there is another parameter can be use such as the speed of
the grinding wheel. With the different type of parameter, suppose that the prediction
model for the MRR will give the better result. The use of different type of nanocoolant
also can give the different value for certain parameter such as the surface roughness.

32
REFERENCES
Cakir, O., Yardimeden, A., Ozben, T., and Kilickap, E. 2007. Selection of cutting fluids
in machining processes. Journal of Achievement in Materials and
Manufacturing Engineering. 25(2): 99-102.
Carley, K.M., Kamneva, N.Y. and Reminga, J. 2004. Response surface methodology.
Carnegie Mellon University, School of Computer Science. CMU-ISRI-04-136.
Chen, P., Qu, W., Miller, H. and Chandra, A. 1999. Precision Mechanic Lab, Michigan Tech.
Thermal Effects in Vibration Assisted Grinding, pp. 2.
Colton, J.S. 2009. Georgia Institute of Technologies. Manufacturing Processes and
Engineering, pp. 2.
Dale Savington Tooling & Accessories Group. 2000. Maximizing the Grinding Process,
pp.7.
Fundamentals of Machine Tools, Headquarters Department of the Army, Washington,
DC, 29 Oct. 1996.
Oronzio, M., Yogesh J., and Dimos, P. 2010. Advance in Mechanical Engineering. Heat
Transfer in Nanofluids, pp. 1.
Sridhara, V., and Satapathi, L.N. 2011. Nanoscale Research Letter A SpringerOpen
Journal. Al2O3-based nanofluids. 6(456): 1.
Thamizhmanii, S and Hasan, S. 2006. Analysis of Roughness, Forces and Wear in
Turning Gary Cast Iron. Journal of Achievements in Materials and
Manufacturing Engineering. 17(1-2): 401.