modelling, simulation and experimentation of a … · allel fluidic self-assembly of ......
TRANSCRIPT

Modelling, Simulation and Experimentation ofa Promising New Packaging Technology – Par-allel Fluidic Self-Assembly of Micro DevicesJ. LIENEMANN , A. GREINER, AND J. G. KORVINK ,Albert Ludwig University, Freiburg, Germany,X. X IONG, Y. HANEIN , AND K. F. BOHRINGER,University of Washington, Seattle, WA, USA
Abstract
The parallel fluidic self-assembly of micro devices is a new technology that promisesto greatly speed up the production of complex microsystems made up of manyseparate parts. The technology brings many advantages. First, it enables a mixof chipmaking technologies for each of the component parts, with each technol-ogy selected for its particular technical or financial benefits. Second, it eliminatesthe need for pick-and-place assembly that would unnecessarily slow down anymanual assembly technique. Third, it enables massively parallel assembly, almostindependent from the number of parts involved, and thereby mimics the elegantparallelism inherent in microchip circuit manufacture.
In this article we explore this new technology with the ultimate goal of discov-ering the practical limits for its practical use in manufacturing real microsystems.The driving force of the assembly process is interface surface tension, and ourapproach is to find the simplest models that correctly describe the attachment, ori-entation and bonding of parts to a suitably prepared substrate. We follow both ananalytical and a numerical approach in describing the surface tension effects, thelatter mainly to gain geometrical generality, and we couple modelling and sim-ulation with suitable laboratory experiments. The ultimate goal of this work isto find practical design rules with which to select bond site geometries and the

2 0.0 Parallel Self-Assembly of Micro Parts in the Fluidic Phase
properties of participating liquids, and to find practical tolerances for all requiredgeometrical and rheological parameters. The article extensively documents allresults found to date, and carefully references other work in this area.
Keywords: self-alignment, capillary forces, micro-assembly, fluidic self-assembly,surface energy, surface tension, alignment error, glue polymerization, micro partangular deflection, mirror tilting
Contents
0.0.1 Introduction . . . . . . . . . . . . . . . . . . . . . . . . . . . 2
0.0.2 Fundamentals of Interface Tension and Wetting . . . . . . . . . 50.0.2.1 Surface Tension and Surface Energies . . . . . . . . . . . . . . 50.0.2.2 Microscopic Picture: Intermolecular Forces . . . . . . . . . . . 7
0.0.3 Application to Self-Alignment . . . . . . . . . . . . . . . . . . 9
0.0.4 Experiments . . . . . . . . . . . . . . . . . . . . . . . . . . . 100.0.4.1 Preparation of Substrate and Micro Parts . . . . . . . . . . . . 110.0.4.2 Lubricant Deposition . . . . . . . . . . . . . . . . . . . . . . 120.0.4.3 Micro Part Assembly . . . . . . . . . . . . . . . . . . . . . . 130.0.4.4 Alignment Errors . . . . . . . . . . . . . . . . . . . . . . . . 15
0.0.5 Modelling and Simulation . . . . . . . . . . . . . . . . . . . . 150.0.5.1 Analytical Models . . . . . . . . . . . . . . . . . . . . . . . . 170.0.5.2 Three Dimensional Surface Simulations by Energy Minimization 240.0.5.3 Numerical Simulations for Geometry Design . . . . . . . . . . 260.0.5.4 Modelling of Perturbations and Non-ideal Systems . . . . . . . 29
0.0.6 Summary and Conclusions . . . . . . . . . . . . . . . . . . . 40
0.0.7 Acknowledgments . . . . . . . . . . . . . . . . . . . . . . . . 41
0.0.1 Introduction
Recent developments, with innovative materials and processes being developedin the area of microengineering, offer the opportunity to create a large variety

0.0.1 Introduction 3
of functional micro devices (e.g., chemical, electrical, mechanical, and optical).Promising applications, e.g., in telecommunications, chemical analysis and biomed-ical instrumentation require integration of such devices into single compact androbust microsystems. Monolithic integration is not applicable in building suchhybrid systems, when the components’ fabrication processes or the materials areincompatible. Emerging techniques in the area of micro-assembly provide a so-lution for microsystem integration. By taking advantage of micro-assembly tech-niques, we can simultaneously optimize design, fabrication processes and mate-rials for the micro components. In addition, fabrication and testing of differentmicro components can be done independently in a parallel manner. Researchershave been investigating the adoption of conventional macro scale ”pick and place”methods to assemble micro or even nano scale components [1–4]. One major con-cern in these approaches is the ”sticking effect” between assembly manipulatorsand components, due to electrostatic, van der Waals or surface tension forces [5].Special manipulators and additional tools are required to overcome these diffi-culties. Another concern is that the time efficiency is limited by the number ofmanipulators when a large number of components is to be assembled.
Recently, techniques have been developed to achieve massively parallel as-sembly. Researchers have developed techniques to transfer microstructures be-tween aligned wafers [6, 7] and later released the structures to the destined wafers.Such techniques are categorized as deterministic parallel assembly. Compared todeterministic methods, techniques applied to assemble a large number of identicalmicro parts on specific target sites, are classified as stochastic methods. Assem-bly approaches in the stochastic category are also referred to as “self-assembly”.Different driving forces are exploited in self-assembly. By using fluidic flow andgravitation, a process was developed by Yeh and Smith to assemble trapezoidalmicro components into matching holes in a substrate [8]. Bohringer et al. haveproposed a micro-assembly approach by employing electrostatic fields as the driv-ing force, with the aid of ultrasonic vibration to overcome and eliminate frictionand adhesion [9, 10]. Surface tension, more dominant in the small scale com-pared to gravity [5], has also been employed as the driving force for assembly.Whitesides and coworkers first developed a strategy driven by capillary force toassemble simple electrical circuits [11, 12], and later three-dimensional electronicnetworks [13]. Srinivasan et al. extended the surface tension driven assemblytechnique in [11, 12] to assemble microscopic parts, i.e. micro mirrors, onto de-sired sites on silicon and quartz substrates [14, 15]. Recently, Yellen et al. [16]reported on self-assembly exploiting ferromagnetic templates and external uni-form magnetic fields as driving forces for alignment and orientation of colloidal

4 0.0 Parallel Self-Assembly of Micro Parts in the Fluidic Phase
particles onto patterned surfaces. Another example of part-to-substrate assem-bly was demonstrated in [17] to assemble arrays of GaAs/GaAlAs light emitteddiodes (LEDs) on a flexible curved substrate, and establish connections for theassembled parts.
In order to achieve integration of hybrid systems, an innovative self-assemblytechnique is developed to repeatedly applying the surface-tension driven assem-bly for multiple batches of parts [18, 19]. In this technique, the assembly is stilldriven by capillary forces, and it proceeds on specially treated hydrophobic siteson the substrate as described in [14, 15]. In addition, electrochemical modulationof the hydrophobicity of specific binding sites is used to alter the driving forcefor assembly. Therefore assembly can be controlled to take place only on desiredbinding sites. By repeating the process to activate different sites on the substratefor assembly, different batches of micro parts can be assembled on a single sub-strate in a sequential manner. Electroplating is exploited as a post assembly pro-cess to establish electrical connections for assembled components, such as lightemitting diodes (LEDs).
The surface-tension driven assembly technique includes many process steps,so effects of perturbations must be investigated. One important advantage of thepresented process is that it is possible to perform the essential steps without theuse of expensive or complex equipments.in a common laboratory, thus a clean room is notnecessary. Since many steps may be sensitive to dust and inhomogeneities, adiscussion of the influence of defects is necessary.
Simulation is a valuable tool to determine the effect of both the setup andpossible defects, which is not easily accessible by experiments at the micro scale.We present calculations of the capillary driving forces occurring in the undisturbedalignment process and simulations of an alignment subjected to defects in thehydrophobic layer of the binding site and inhomogeneous hardening of the gluebetween micro part and binding site. The results enable the designer to determineif possible defects are negligible or if a clean room is necessary to maintain thereliability of the process. We further present a fast simulation tool for optimizationof the pad geometry with respect to local minima, allowing the designer to quicklyfind micro pad shapes with the requested assembly configuration.

0.0.2 Fundamentals of Interface Tension and Wetting 5
0.0.2 Fundamentals of Interface Tension and Wetting
When placing a droplet of liquid in contact with a solid surface surrounded by agaseous atmosphere three quasi two-dimensional phase boundaries form. Each ofthe phase boundaries consists of a transition region which we assume to be smallwith respect to the volumes of the phases themselves, so that an idealized descrip-tion as a surface is appropriate. Similar arguments hold for the one-dimensionaltriple phase contact line, to be observed where three different phases touch. Notethat on a length-scale that approaches the dimensions of intermolecular distancesin any of the three phases this picture does not hold any longer. In this article wedo not consider the latter situation but rather assume that all phases are separatedideally.
0.0.2.1 Surface Tension and Surface Energies
In general two wetting regimes are distinguished [20],
• Complete wetting: the liquid phase (L) spreads out on the solid surface (S),to form a three layer system consisting of solid, liquid, and surroundingmedium (M);
• Partial wetting: the liquid phase remains in a finite region, to form a finitecontact angleθ > 0 at the contact lineL .
Fluidic self-assembly exploits the latter case, where the resulting forces due tominimization of the surface free energy are the driving effect.
Any change in the surface areaδA of a liquid droplet results in a workW thatis proportional to the surface change
δW = γδA (1)
where the proportionality coefficientγ is called the surface tension (see e.g. [21,22]). It depends on the materials in contact at the interface.
On a curved interface separating two different materials, the pressure on eitherside of the interface is different.pL is the pressure in materialL andpM the pres-sure in materialM. We displace a surface element dA by an infinitesimal amountδξ normal to the surface and pointing away from materialL. Due to the volumechangeδξ dA we have to take into account an additional work contribution, sothat the total work reads
δW =−∫
(−pL + pM)δξ dA+ γδA (2)

6 0.0 Parallel Self-Assembly of Micro Parts in the Fluidic Phase
Note that dA denotes the infinitesimal surface element andδA is the total variationof the surface due to the displacementδξ . For given principal curvature radiiR1 andR2 at a specific surface point the respective infinitesimal arclengths dl1and dl2 change due to the infinitesimal displacementδξ to dl1(1+ δξR−1
1 ) anddl2(1+δξR−1
2 ), respectively. The surface element dA= dl1dl2 therefore changesto
dA′ = dl1(1+δξR−11 )dl2(1+δξR−1
2 )≈ dl1dl2(1+δξR−11 +δξR−1
2 ) (3)
where terms of second order inδξ have been discarded. The total variation in thesurface therefore becomesδA =
∫δξ (R−1
1 +R−12 )dA.
Inserting this into (2) and taking into account that in equilibriumδW = 0 forarbitraryδξ we get the Laplace-Young formula for surface pressure
pL − pM = γ(R−11 +R−1
2 ) (4)
In equilibrium the l.h.s. of (4) is a constant. This equation simply states that thesum of inverse principal curvature radii must be constant at any surface point.Therefore, provided that gravity effects are negligible, a small fluid droplet withfree surface must assume a spherical shape in order to fulfill this requirement.When the surface is clamped along a given line - as it is the case in fluidic self-assembly by the triple phase contact lineL - its shape will become more compli-cated. In these cases one may revert to directly minimize the surface free energy∫
γ dA under the constraint that the volume is constant,∫
dV = const(see [23] formore examples of constraint surfaces).
The material parameterγ is called the surface tension and can be seen as anenergy per unit area. On a closed line confining any part of the surface area,γ is
M
L
γLM
γSM γSLθ
S
Figure 1: Contact angle forming due to surface tensions at the contact line of threedifferent materials.

0.0.2 Fundamentals of Interface Tension and Wetting 7
equal to the force per unit length on this line pointing in the direction tangentialto the surface and inside the region enclosed by the line. This leads us to thespecification of the contact angle at the contact lineL of three different bodiesin contact. In self-assembly application these will be two immiscible fluids (Land M, here M stands for the second liquid phase) and a solid surface (S) as it isschematically drawn in fig. 1.
In thermodynamic equilibrium, i.e. when the contact lineL is not moving,the resultant force onL must vanish. Thus we have
γSM = γSL+ γLM cosθ (5)
to determine the contact angle, which is the famous Young condition. It is usedto determine the surface tensions between different materials by measuring thecontact angleθ .
0.0.2.2 Microscopic Picture: Intermolecular Forces
The capillary forces present when three different phases get in contact form themain driving effect for fluidic self-assembly. Their microscopic origin derivesfrom the intermolecular interactions.
In the case of polar molecules, dipole-dipole interactions determine the ther-modynamic properties of the liquid. The dipole moment is defined asu = ql,wherel is the distance vector between two unit charges+q and−q. The dipole-dipole interaction potential energy isw(r) ∝ r−3, wherer is the distance betweenthe two dipoles. It also depends on the relative orientation of the two dipole vec-tors with respect to each other. In a liquid these dipole molecules will rotate.Therefore, an angle averaged potential for a given distancer must be taken intoaccount [24]. This reduces the interaction potential to the form
w(r) =−Cr−6 (6)
where the constantC depends on the quality of the dipoles. For two moleculescarrying a permanent dipole momentu we obtainC = u4(3kT(4πεrε0)
2)−1, withε0 denoting the permittivity of free space,εr the relative permittivity,k the Boltz-mann constant, andT the absolute temperature. In case of one dipolar moleculeinteracting with a neutral polarizable second molecule we haveC= u2α0(4πεrε0)
−2,whereα0 is the electronic polarizability of the second molecule. And even in thecase of two neutral polarizable molecules second order quantum mechanical per-turbation theory leads to a contribution withC = 3α2
0I(8πεrε0)−2, whereI is the

8 0.0 Parallel Self-Assembly of Micro Parts in the Fluidic Phase
first ionization potential of the molecule. This latter contribution is called attrac-tion due to dispersive forces, first described by London. It is only a rough estimatebecause of its restriction to spherical molecules with a unique ionization potential.
Non-polar molecules that are non-spherical have multiple ionization poten-tials. For large organic molecules carrying a polar bond the numerous non-polarbonds promote dispersive interactions. This in turn leads to hydrophobicity im-peding the solving of specific organic molecules in water because the dispersiveinteraction cannot compete with the hydrogen bonds.
Due to the strong intermolecular interaction of the water molecules, specialproperties can be observed in water. Water molecules attract each other byhy-drogen bondsH · · ·O, which are stronger than usual van der Waals forces. Hy-drogen bonds derive from electrostatic interaction, but the extent of the bond issmaller than expected from van der Waals calculations. The interaction with elec-tronegative atoms is stronger due to the small size of the hydrogen atoms and theirtendency to become positively polarized and is therefore a special property of hy-drogen. Furthermore, hydrogen bonds are strongly directional. The tetrahedralcoordination of the water molecule (bond angle of the two covalent H−O bondsis 109◦) contributes to the unusual properties of water. It leads to ordering insolid water (ice) and even in the liquid, which, eventually, results in the densitymaximum at 4◦C.
If a non-polar molecule is immersed in water, the energy of a water–waterhydrogen bond is still higher than that of a van der Waals interaction. Hence, thewater molecules will reorient and pack around the molecule without losing theirhydrogen bond network structure, such that the least possible number of hydrogenbonds is used for adhesive interaction. This restructuring causes loss of entropy,because the water molecules are more ordered around the alien molecule, and thusmakes solution of non-polar particles unfavorable.
The same effect is also responsible for immiscibility with non-polar liquids:The extraction of a single water molecule requires the breaking of four hydrogenbonds, which is highly unfavorable.
Another approach to explain surface tension is the consideration of cohesionforces. The cohesion force assigned to a single molecule depends on its poten-tial and the number of nearest neighbors. These neighboring molecules screenthe electrostatic field of the molecule under investigation by reorientation of theircharges. In the bulk of the droplet, the time averaged sum of the intermolecu-lar forces is zero for symmetry reasons. No preferred direction is apparent, thusmovement of molecules in all directions is equally probable, whereas on the sur-face the force balance in the direction normal to the surface is broken. Therefore,

0.0.3 Application to Self-Alignment 9
a) b)
Figure 2: Cohesive forces inside (a) and on the surface (b). The molecules onthe surface interact with fewer nearest neighbors and therefore are subject to astronger lateral force. The break of symmetry causes an inwards pointing force.
a force pointing inwards arises (see fig. 2).. Furthermore, the number of nearestneighbors is smaller than inside the droplet, which increases the lateral stress andthe desire of the surface to contract due to the loss of screening.
0.0.3 Application to Self-Alignment
At micro scale, surface tension becomes more significant, and it has been ex-ploited for various applications. High-resolution wet printing was studied byusing dip-coating surfaces selectively patterned with regions of different surfacetension [25, 26]. A liquid-metal micromotor was described in [27], which wasdriven by surface tension. Building three-dimensional hinged micro structureswas accomplished by using surface tension [28]. In the self-assembly tech-niques described in [11, 13–15, 17, 19], surface tension forces are created by a
Figure 3: Self-assembly steps: (a) A fabricated substrate with the SAM-coatedAu binding site. (b) A substrate with lubricant droplets exclusively on the bindingsite in water. (c) After the parts are dispensed into water, the part is assembledand aligned to the binding site. (d) The lubricant can be cured to bond the part.

10 0.0 Parallel Self-Assembly of Micro Parts in the Fluidic Phase
liquid meniscus between hydrophobic surfaces in water to drive the assembly. Aschematic illustration of the assembly process is shown in fig. 3. For the assembly,the substrate is prepared with surfaces of different surface tensions. For examplein [14, 15, 19], the hydrophilic substrate is prepared with hydrophobic patterns,which are Au patterns with alkanethiol self-assembled monolayer (SAM) (fig. 3a).In order to create the driving force, the lubricant must have high interfacial energywith the surrounding medium and low interfacial energy with the SAM-coated Ausurface. Due to different surface tensions, the lubricant wets exclusively the hy-drophobic patterns on the substrate in water as shown in fig. 3b. After the parts areintroduced into water, as the result of minimizing the water-lubricant interfacialenergy, the capillary driving force attracts and aligns the parts to the binding sites(fig. 3c). During the assembly, agitation of the parts is provided by shaking. Fordifferent applications, various lubricants have been developed including organicpolymers [29] and alloy solder [17, 30, 31] in air environment, and the lubricantcan be cured [14, 15, 19] or hardened by cooling [17] to permanently bond theparts (fig. 3d). Water surrounded by air has been used [32–34] for experimentaldetermination of the alignment accuracy. Table 1 shows the interfacial tensionsfor various material systems.
Table 1: Interfacial tensionsγ for various material systems. The Abbreviationsare as follows: M: Surrounding medium; L: Lubricant; S: Substrate surface.
Material System (M, L, S) γML/mJ/m2 γSM− γSL/mJ/m2
Water, TEGDMA, Alkanethiol SAM 46 52Air, Water, Glass[35] 73 73Air, Water, Aluminium[35] 73 40Air, Sn/Pb Solder, Copper[36] 504–560 213–429
In the following section, we discuss the experimental details of the self-assemblyprocess.
0.0.4 Experiments
In this section, we describe the experimental issues of the self-assembly experi-ments for the purpose of investigating the self-alignment and self-assembly pro-cess. In our experiments, we demonstrate the technique by self-assembling microparts onto the specific Au binding sites patterned on the destined substrate. Toactivate the binding sites, a hydrophobic alkanethiol SAM is adsorbed on the Au

0.0.4 Experiments 11
binding sites. In order to perform the assembly, we first apply the lubricant ontothe whole substrate, and then slide the substrate into deionized (DI) water. Thelubricant forms droplets exclusively on the hydrophobic binding sites on the sub-strate. Next, micro parts with a hydrophobic side are introduced into the water.With agitation, they are attracted and aligned to the binding sites on the substrate.Finally, the lubricant is cured to bond the parts to the substrate permanently. Inthe assembly process, the lubricant plays a significant role in providing the drivingforce, as well as in bonding the parts after assembly. Two different hydro-carbonlubricants have been used in our experiments. For assembly of multiple batches,an electrochemical surface modification technique is integrated into the process,which is discussed in detail in [19, 37].
0.0.4.1 Preparation of Substrate and Micro Parts
Test part fabrication
We use 1×1 mm silicon test parts for the assembly experiments. The parts arefabricated by dicing a (100) Si wafer sputtered with Cr/Au on the polished side.The gold side of the parts acts as the binding site in the assembly process (fig. 4a).The square test parts are used as fabricated without any further process. UntreatedAu surfaces have a contact angle of 70◦ [38] after exposure to lab atmosphere,which is sufficient to ensure assembly.
Figure 4: (a) Silicon square test parts with Au binding site. (b) Cross section of asubstrate with Au binding sites for assembly.

12 0.0 Parallel Self-Assembly of Micro Parts in the Fluidic Phase
Substrate preparation
A silicon wafer with a thermal oxidation layer of approximately 4500A is usedas the substrate. Binding sites are defined on the substrate by photolithography,followed by a layer of 1100A Cr/Au, sputtered on the substrate. The photore-sist (AZ1512, Clariant) is then dissolved by acetone. The gold binding sitesof 1×1 mm in size with 1 mm space in between are patterned on the substrate(fig. 4b). The wafer is then cleaned with isopropyl alcohol (IPA), DI water anddried with N2. Afterwards, we clean the substrate by oxygen plasma for twominutes. Immediately after the plasma cleaning, the substrate is immersed in1 mM ethanolic dodecanethiol (CH3(CH2)11SH, Aldrich) solution for 2-24 hours,to form a hydrophobic monolayer on the gold areas. After the adsorption process,the exposed Au binding sites turn hydrophobic with a contact angle in the rangeof 110◦ [38].
0.0.4.2 Lubricant Deposition
We use two kinds of hydrocarbon polymers as lubricants for our experiments: heatcurable and UV curable ones. The heat curable lubricant is composed of 97 wt.%triethyleneglycol dimethacrylate (Sigma) as the monomer, and 3 wt.% benzoylperoxide (Sigma) as thermal initiator [39]. The UV curable lubricant is composed
Figure 5: A substrate with the lubricant is immersed into water. The lubricantforms droplets exclusively on the binding in water.

0.0.4 Experiments 13
Figure 6: A substrate with an array of binding sites is immersed into water. Thelubricant forms droplets exclusively on the binding sites.
of 95 wt.% 1,6-hexanediol diacrylate (Aldrich) as the monomer and 5 wt.% ben-zoin methyl ether (Aldrich) as the photoinitiator. To prepare for assembly, wespread the lubricant over the whole substrate. The substrate is then slid verticallyat a constant speed into water in a petri-dish. Due to the high water-SAM inter-facial tension compared to lubricant-SAM interfacial tension, the lubricant wetsexclusively the SAM-coated binding sites in water. Fig. 5 illustrates the lubrica-tion deposition step. Another method was demonstrated by passing the substratethrough a thin lubricant film on the water, therefore to coat the lubricant exclu-sively on the binding site[15]. For the second method, the thin lubricant film hasto remain continuous during the sliding process in order for all the binding sitesto have uniform lubricant coverage.
To measure the lubricant volume and thickness, we slide the substrate with theUV curable lubricant into water at a speed of approximately 3 cm/s and cure itwith UV lamp for one hour at the light intensity of 21000µW/cm2. Fig. 6 showsan array of square binding sites with cured lubricant. We use a surface profiler(P15, Tencor) to characterize the topology of the cured lubricant on one bindingsite (fig. 7). The peak point height of a cured lubricant droplet is 62.1µm, withthe volume of the droplet is calculated to be 33 nl.
0.0.4.3 Micro Part Assembly
After applying the lubricant, the micro parts are poured into water. As soon as thepart binding site has contact with a lubricant droplet on the substrate, it is alignedto the substrate binding site by the capillary driving force. The lubricant is then

14 0.0 Parallel Self-Assembly of Micro Parts in the Fluidic Phase
Figure 7: Surface topology of a lubricant droplet on a 1×1mm square bindingsite. (a) The side view of surface profile of the lubricant droplet. (b) Top view ofthe surface topology; different grayscales indicate different surface heights.
Figure 8: An array of micro square parts are assembled on a substrate.

0.0.5 Modelling and Simulation 15
cured and bonds the parts to the substrate as shown in fig. 8. The polymerizationprocess of heat curable lubricant takes approximately one hour at 80◦C in water.
0.0.4.4 Alignment Errors
An experimental study of the influence of the initial conditions and the pad shapeon the alignment accuracy has been presented by Satoet al. in [33, 34]. Theconsidered system consists of water as lubricant, air as surrounding medium andglass as binding site. The micro part is placed at a specific initial position and thenreleased onto the lubricant droplet.
The experiments show that the final accuracy depends on many parameters. Itwas shown that there is an optimal value for the lubricant volume. A high volumecauses a force weakening near the point of exact alignment; also, water overflowover the boundary of the highly wettable binding site occurs which further lowersthe force. A lower volume enforces a good alignment due to the stronger capillaryforces on the micro part. However, for a volume too low, the error was found toincrease again, both for the lateral alignment and the angular rotation relative tothe optimal position.
The initial lateral displacement has a lower effect on the resulting alignment,if the release position is near enough to the binding site center. For a larger dis-placement, the recovery of the aligned position fails, but for a system immersedin a liquid phase like for the process presented before, a better reliability can beexpected. The same results are obtained for the initial distance of the micro partto the substrate. The initial angular twist displacement has only a small effect onthe resulting angle.
The shape of the binding site was also found to influence the alignment error.Triangular, square and hexagonal shapes have been examined. The hexagonalshapes showed the lowest alignment error and also were the least sensitive to aninitial alignment error. The performance of the square shape was also good. Thetriangular shape showed a dewetting at the sharp corners of the binding site whichresulted in large alignment errors.
0.0.5 Modelling and Simulation
Simulation is important for both experimentation and design. For experimenta-tion, simulation augments our laboratory techniques by providing a way to isolateand separate physical effects, so as to test and make plausible our hypotheses on

16 0.0 Parallel Self-Assembly of Micro Parts in the Fluidic Phase
the dominant effects of interfacial interaction, by providing a way to design suit-able experiments, to estimate the outcome of proposed techniques and designs,and by providing a looking-glass for data that is not otherwise easily accessible.Prudent use of simulation tools has helped us to efficiently eliminate unproductiveconcepts, and to explore promising new avenues.
Once verified and understood, simulation tools become essential for engineer-ing design. In general, engineering design tools target system goals, such as man-ufacturability, process reliability, throughput maximization, and of course overallcost reduction. Typically, market forces dictate, so that computer-aided engineer-ing (CAE) tools only emerge once manufacturing processes become reasonablyestablished. Once this is the case, CAE tools can aid to rapidly spread the use of atechnology, and the classical example here is circuit simulation where tools suchas SPICE has brought circuit design to the smallest of enterprizes making it trulyubiquitous.
Simulation for fluidic self-assembly is definitely still in the experimental phase,and the focus of work in the area is in finding the best conditions for an assemblyevent, and in understanding the design options available to us. As we shall see inmore detail in the following sections, this includes:
• matching surface shape design
• surface energy modelling and optimization
• surface defect and error source modelling
• model simplification
• gluing process optimization
The current approach for surface force modelling is quasi-static. We generallyassume that we are close to equilibrium, and that many dynamic effects (suchas fluid flow dynamics and inertia) can be neglected. The surface shape is thuscompletely determined by the potential energy configuration of the system. Thischoice is partially dictated by the availability of simulation tools, and we mainlyuse:
• theSurface Evolverfor the simulation of the geometry of fluid droplets, and
• ANSYS for the simulation of elastostatic properties of solidifying glues,

0.0.5 Modelling and Simulation 17
for which we have developed additional modules and coupling methods, aug-mented by analytical techniques. This approach has its limitations, and in partic-ular we:
• do not consider the assembly process in its entirety.
• cannot consider questions involving microscopic intermolecular interactions.
Other limitations have more to do with verification, in that experimental tech-niques can only be expected to deliver some of the parameters that would com-pletely verify the simulation.
The advantage of this approach is that it is computationally fast, and deliversthe required results in excellent agreement with experimental observations. Inaddition, we avoid the costly overhead of a dedicated software implementation byusing commonly available simulations tools.
0.0.5.1 Analytical Models
Analytical models provide a powerful way for optimization of a given system.Since the computational costs of evaluating of an analytical function is usuallymuch smaller than for a numerical simulation, extensive searches in the parameterspace are possible. We therefore present an analytical treatment of the necessarypotential energy calculations. A comparison between analytical and numericalmodels is presented later in section 5.4.
The effect of capillary forces and surface tensions can often be described bypurely geometric models. The presented system consists of three interfaces, sur-rounding medium to solid (SM), surrounding medium to liquid (ML) and solid toliquid (SL). The potential energy is calculated by the energy integral
E =∫
γ dA (7)
over all three interfaces, where A is the interfacial area andγ the respective in-terfacial tension. For constant temperature and chemical composition, only spa-tial degrees of freedom must be considered. Gravity plays only a minor role forthese length scales and can thus be neglected. In a first approach, complete wet-ting of the binding site is assumed. As shown in fig. 9, the meniscus betweenthe hydrophobic binding sites provides the capillary force to self-align and self-assembles the part to the binding site on the substrate. Under different situations,
18 0.0 Parallel Self-Assembly of Micro Parts in the Fluidic Phase
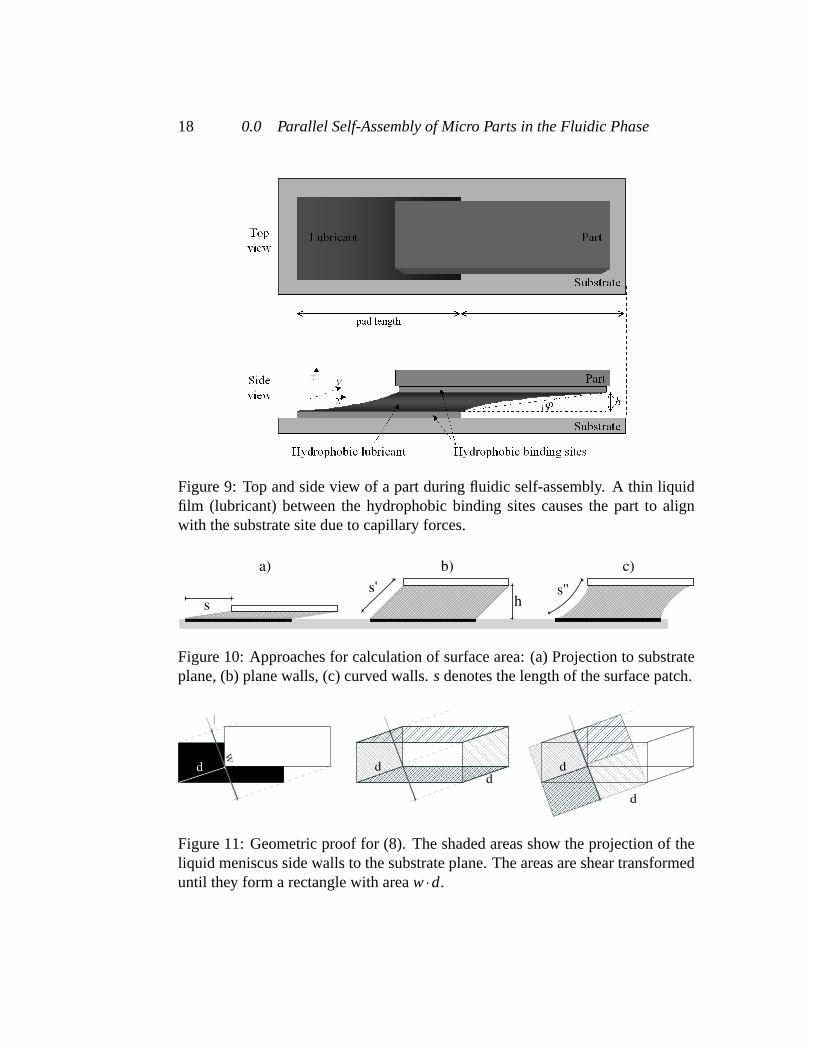
Figure 9: Top and side view of a part during fluidic self-assembly. A thin liquidfilm (lubricant) between the hydrophobic binding sites causes the part to alignwith the substrate site due to capillary forces.
ss' s''
a) b) c)
h
Figure 10: Approaches for calculation of surface area: (a) Projection to substrateplane, (b) plane walls, (c) curved walls.s denotes the length of the surface patch.
d
w
l
dd
d
d
Figure 11: Geometric proof for (8). The shaded areas show the projection of theliquid meniscus side walls to the substrate plane. The areas are shear transformeduntil they form a rectangle with areaw·d.

0.0.5 Modelling and Simulation 19
a
h
a
dα
bb
xy
z
xy
Figure 12: Calculation of area change for an area with a contact line not perpen-dicular to the displacement.
different analytical models are used to calculate the interfacial areas between themeniscus and the water (see fig. 10).
As long as the distance of the micro part to the substrate is small enoughcompared to the lateral size, the area of the medium-liquid interface can be ap-proximated by its projection onto the substrate plane. We first introduce a linelperpendicular to the direction of motion (see fig. 11). Then, all segments of thelubricant-medium-solid contact lineL on the substrate are projected onto thisline. The sumw of all absolute values of these projections can then be used to ap-proximate the area change∆A of the medium-liquid interface. Given coincidentshapes of both high wettability areas of the substrate and the micro part, we obtain
∆A≈ w·s≈ w· |d|, (8)
where the lengthsof the surface patch is equal to the absolute value of the lateraldisplacementd. (see fig. 10a). A geometric proof for a simple example is shownin fig. 11. The shaded areas show the projection of the liquid meniscus side wallsto the substrate plane. The areas are shear transformed until they form a rectanglewith areaw·d. Since shear transformations retain the area of the quadrilateral, thearea of the meniscus side walls is approximatelyw·d as well.
The surface energy is thus linear to the displacementd of the micro part, andthe forceF =−dE/dd =−γMLwsign(d) is constant.
Near the equilibrium point of the system, i.e., the point of zero micro partdeflection, we cannot further assume that the lateral displacement is much largerthan the height of the micro part. The projection approach is no longer valid, anda 3D treatment is therefore necessary.
For lubricant side walls where the contact lineL is perpendicular to the di-

20 0.0 Parallel Self-Assembly of Micro Parts in the Fluidic Phase
-1
-0.5
0
0.5
1
-1 -0.5 0 0.5 1
Forc
e [a
.u.]
Displacement [a.u.]
A = w |d|A = w sqrt(d2+h2)
0
0.2
0.4
0.6
0.8
1
-1 -0.5 0 0.5 1
Ene
rgy
[a.u
.]
Displacement [a.u.]
A = w |d|A = w sqrt(d2+h2)
Figure 13: Driving force and surface energy results comparison by using model(8) and model (9).
rection of displacement (i.e.α = 90◦ in fig. 12), the area is
∆A = w·s′ = w·√
d2 +h2, (9)
wheres′ =√
d2 +h2 is the length of the plane wall rectangle (see fig. 10b) [40].However, if the contact line of the area is not perpendicular to the displacement,the area is sheared, thus rectangles transform to parallelograms. This makes itnecessary to calculate the height of the parallelogram. In fig. 12, this correspondsto α 6= 90◦. The area of the resulting quadrilateral isA = b·
√a2 +h2 with a, b
andh as in fig. 12, resulting in
A = b·√
(dsinα)2 +h2 = bsinα√
d2 +(h/sinα)2
= w·√
d2 +h′2 with h′ = h/sinα, (10)
whereα is the angle between the contact line and the displacement vector.This yields a force of
F =−γMLwd/√
d2 +h′2. (11)
For a comparison between the two models, see fig. 13. In section 5.4 we presentan extension of this model to situations with partial dewetting and apply it to themodelling of surface tension defects on the binding site.
The model can be improved further by taking into account the curvature of thesurface patch. This allows for the modelling of non-planar lubricant side walls(fig. 10c).
0.0.5 Modelling and Simulation 21
θ1
θ2
R
R
s''
β θ −π/21θ2
Rh
uh2
h1
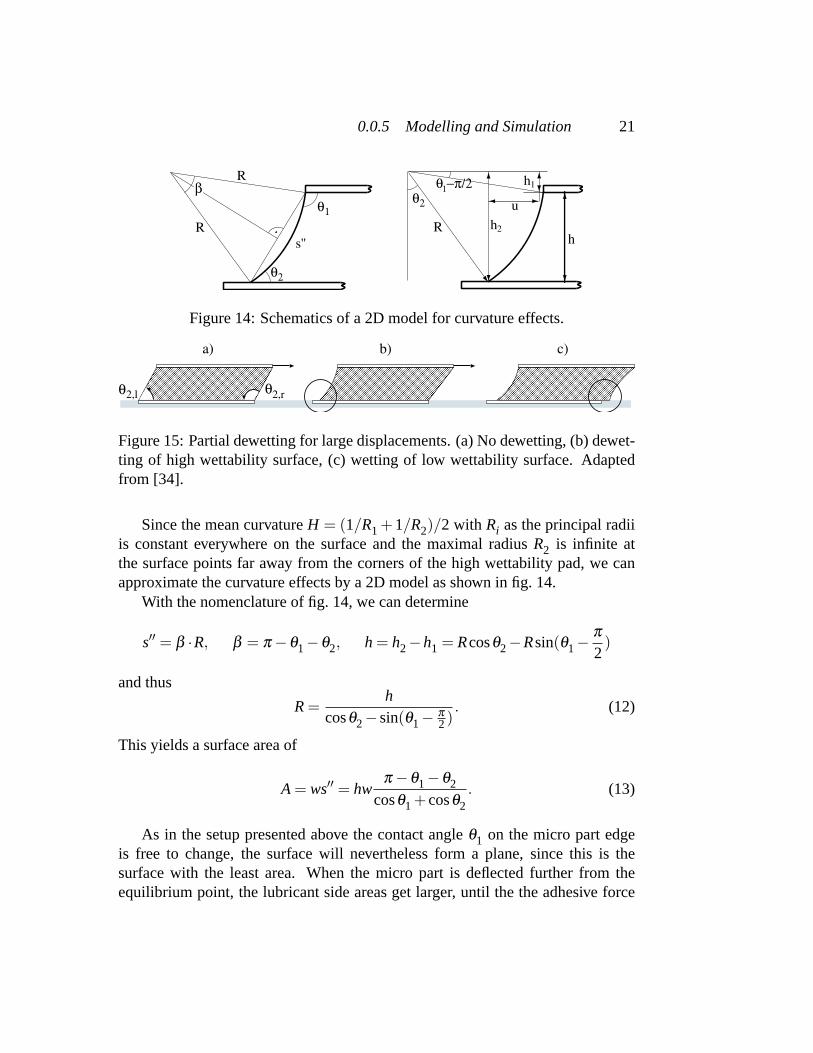
Figure 14: Schematics of a 2D model for curvature effects.
a) b) c)
θ2,l θ2,r
Figure 15: Partial dewetting for large displacements. (a) No dewetting, (b) dewet-ting of high wettability surface, (c) wetting of low wettability surface. Adaptedfrom [34].
Since the mean curvatureH = (1/R1 +1/R2)/2 with Ri as the principal radiiis constant everywhere on the surface and the maximal radiusR2 is infinite atthe surface points far away from the corners of the high wettability pad, we canapproximate the curvature effects by a 2D model as shown in fig. 14.
With the nomenclature of fig. 14, we can determine
s′′ = β ·R, β = π −θ1−θ2, h = h2−h1 = Rcosθ2−Rsin(θ1−π
2)
and thus
R=h
cosθ2−sin(θ1−π
2). (12)
This yields a surface area of
A = ws′′ = hwπ −θ1−θ2
cosθ1 +cosθ2. (13)
As in the setup presented above the contact angleθ1 on the micro part edgeis free to change, the surface will nevertheless form a plane, since this is thesurface with the least area. When the micro part is deflected further from theequilibrium point, the lubricant side areas get larger, until the the adhesive force

22 0.0 Parallel Self-Assembly of Micro Parts in the Fluidic Phase
of the solid-liquid interface is not strong enough to withstand the force exerted bythe medium-liquid surface (see fig. 15).
As soon as the contact angle on the bottom left,θ2,l , drops below a certainangleθdwh, partial dewetting takes place. The contact line now follows the furtherdisplacement, andθ2,l remains unchanged henceforth.
The same happens on the other side, where the contact line is pulled on thelow-wetting side by the medium-liquid interface. As soon as the contact angleon the bottom right,θ2,r , rises above another critical angleθwl, wetting of thelow wettability area occurs andθ2,r keeps fixed to the contact angle on an uncon-strained surfaceθw. Results of a similar model for a different micro part geometryare presented in [34].
The analytic determination of these angles in a global model is difficult, sincethe volume of the lubricant droplet must be held constant and thus the effect ofheight changes and the surface tension of the walls parallel to the displacementmust be considered. However, it is possible to derive the angles in an isolatedmodel.
For simplicity, we assume that all interfaces are either parallel to the displace-ment or perpendicular. With indexh for the high wettability area and indexlfor the low wettability area,u as in fig. 14,Ah the area of the high wettabil-ity area (binding site),wh the projection of the contact line of only the medium– lubricant interfaces pointing in the opposite direction of the displacement andAML = A their area,ASM,h = (d−u)wh the area of the interface medium – sub-strate,ASL,h = Ah− (d−u)wh the area of the substrate – lubricant interface andE0 an energy constant for all remaining surfaces, the energy of the system can bewritten as
E = E0 + γMLAML + γSL,hASL,h + γSM,hASM,h
= E0 + γMLhwh
π −θ1−θ2
cosθ1 +cosθ2+ γSL,h
(Ah− (d−u)wh
)+ γSM,h(d−u)wh,
(14)
usingu= R(sinθ1−sinθ2) = hsinθ1−sinθ2cosθ1+cosθ2
and summing up all terms independent
of θ1 andθ2 to E′0,
E = E′0 +hwh
γML(π −θ1−θ2)+(γSL,h− γSM,h)(sinθ1−sinθ2)
cosθ1 +cosθ2. (15)

0.0.5 Modelling and Simulation 23
The energy has a minimum for
θ2 = θdwh = π −arccotγSM,h− γSL,h√
γ2ML− (γSM,h− γSL,h)
2and θ1 = π −θ2. (16)
With the same method, we can determine for the right side
θwl = π −arccotγSL,l − γSM,l√
γ2ML− (γSL,l − γSM,l )
2. (17)
Since for both calculationsθ1 = π −θ2, the surfaces are again plane.Once both dewetting of the high wettability area and wetting of the low wetta-
bility areas have taken place, all angles as well asu do not change any more. Thus,the force is only determined by the energy change due to the wetting of the low-wettability area(γSL,l − γSM,l )wl (d−u) and the energy change due to the wettingof the high-wettability area(γSM,h− γSL,h)wh(d−u). Using (14) and adding theenergy change due to the wetting of the low wettability area, we find a constantforce
F =−dE/dd =−(γSL,l − γSM,l )wl − (γSM,h− γSL,h)wh (18)
with wl the projection of the contact line of only the medium – lubricant interfacespointing in the direction of the displacement.
A model for the complete process thus includes a distinction depending onthe contact angles on the substrate. For a small displacement, (11) may be ap-plied. For large displacements, dewetting of the high wettability area and wettingof the low wettability area takes place, and (18) must be applied. However, for theWater/TEGDMA/SAM material system presented above, no continuous dewet-ting takes place, since the argument of the arccot function in (16) is complex.Thus (11) can be applied over a wide range of displacements, until a sudden snap-through of the contact line to a dewetted position takes place.
Fig. 16 shows an example for the resulting force curve for another systemwith γML larger thanγSL,l − γSM,l . At a displacement of 133µm, dewetting starts.Near the alignment point, a force weakening is visible, which may slow downthe alignment process. Local minima caused by defects may even impede correctalignment. This force weakening also happens for systems without continuousdewetting.

24 0.0 Parallel Self-Assembly of Micro Parts in the Fluidic Phase
-10-8-6-4-202468
10
-200 -100 0 100 200Fo
rce
[10-5
N]
Displacement [10-6m]
Figure 16: Force curves for (11) and (18). The parameters arewl = wh = 1mm,h = 100µm, γSM,h = γSL,l = 40mJ/m2, γSL,h = γSM,l = 0 andγML = 50mJ/m2.The critical angles areθdwh = 0.643= 36.9◦ and θwl = 2.498= 143◦, whichyields an equivalent displacement of 133µm (marked in the graph as vertical line).
0.0.5.2 Three Dimensional Surface Simulations by Energy Mini-mization
Systems with complex shapes or with different high wettability areas on the sub-strate and micro part often give unsatisfactory results with the models presentedabove. Numerical simulations allow for the modelling of the complete surface andthus include curvature and nonlinear effects.
One of the most useful programs for the study of surface shapes is theSurfaceEvolverby K. A. Brakke. It “evolves” the surface, which is discretized by a unionof triangles, to an energy minimum by gradient descent minimization. Differentminimization schemes like steepest descent and conjugate gradients are availablejust as are second order schemes using the Hessian matrix.
The energy may not only consist of surface tension, but also gravity, a crys-talline integrand, squared mean curvature, user-defined surface integrals and manyother energy quantities can be used. It is freely available and provided with exten-sive documentation [41, 42].
The energy minimization is done with an explicit minimization scheme. Anartificial time dependency is introduced by using the energy gradient of the surfacetriangle vertices as a velocity. For a triangle with edges~s0 and~s1, the facet energydue to surface tensionγ is calculated by
E =γ
2
∣∣∣∣~s0×~s1
∣∣∣∣ . (19)

0.0.5 Modelling and Simulation 25
shift
zlift
x
ytilt tilt
twist
micro part
binding site
lubricant
Figure 17: Geometric setup and part displacements with respect to binding site.
The gradient for the first edge~s0 is then
~gs0=
γ
2
~s1×(~s0×~s1
)∣∣∣∣~s0×~s1
∣∣∣∣ . (20)
Summing up all gradient parts of the adjacent faces yields the total free energygradient of the vector motion.
Iterating this process finally yields a minimal energy surface. We apply thistechnique to the liquid lubricant meniscus below the micro part by constrainingthe liquid edges to match the setup geometry. Moving the micro part constraintsslightly and evolving the surface to a minimal energy state finally yields a graphof potential energy versus micro part position. We hereby assume that the menis-cus shape always goes through an energy minimum, i.e., the fluid shape followsadiabatically.
The derivative of the potential energy curve to the micro part position givesinsight on the forces acting on the micro part during the motion.
Simulation of capillary forces
The strengths of the capillary forces during the alignment process are crucial forgetting a well aligned position of the micro part. Fig. 17 shows the displacementsof all degrees of freedom of the micro part. They consist of a shift of the micropart against the binding site (x and y direction), a lift of the micro part in thedirection perpendicular to the binding site, a twist rotation about thez axis and atilt about thex andy axis. For all degrees of freedom, the system must provide aunique and distinct well defined energy minimum with high gradient.

26 0.0 Parallel Self-Assembly of Micro Parts in the Fluidic Phase
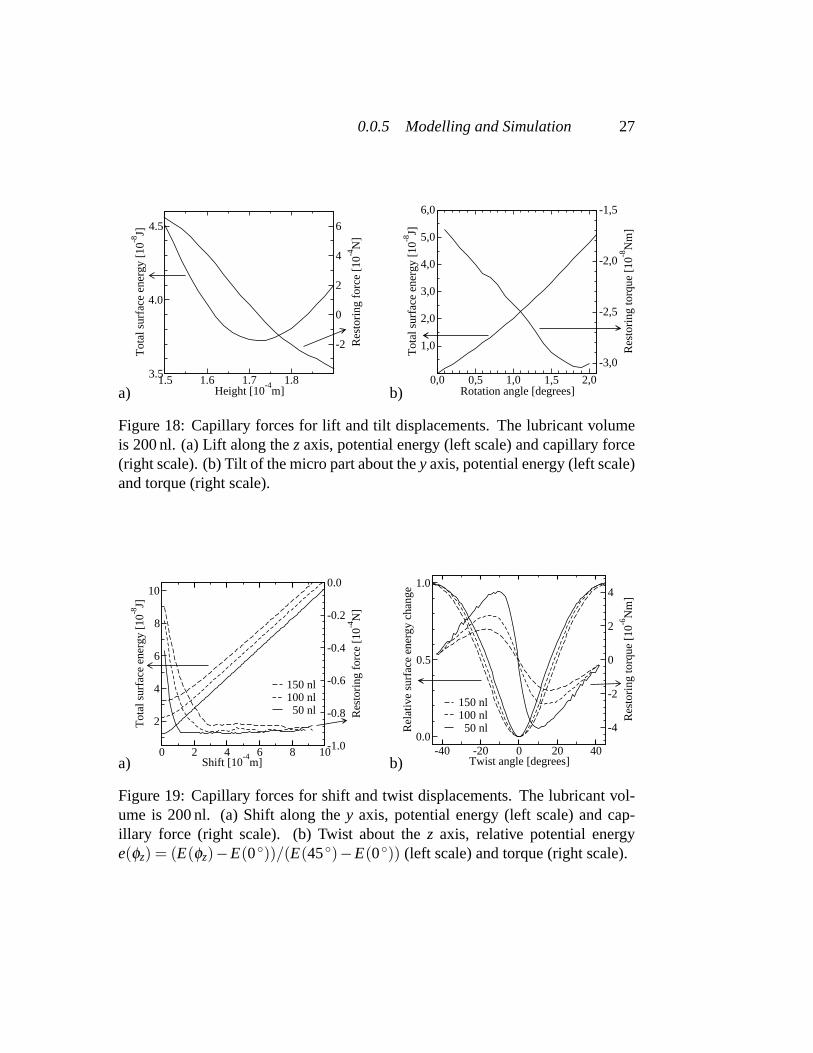
In our simulations we calculated the total surface energy for different displace-ments and lubricant volumes [43]. Fig. 18a shows the potential energy and theforce with respect to a lift displacement perpendicular to the binding size surfacefor a lubricant volume of 200 nl. The energy minimum and therefore the equilib-rium position is found at a distance of 0.174 mm between the binding site and thebottom of the micro part. A large restoring force results in a system rather stiffagainst lift displacement.
Fig. 18b shows the potential energy and restoring torque for a tilt displace-ment. Since the torque increases rapidly already for small tilt angles, a goodparallel alignment is ensured. Lift and tilt displacements are rather uncritical, aslong as the lubricant volume is not exceedingly high.
The results for a shift misalignment are shown in fig. 19a. Three different lu-bricant volumes were investigated. As predicted by the analytic model, the restor-ing force shows an increase linear with the shift displacement and then saturates ata constant level for higher deflection. Both the final saturation level and the forceincrease and thus the final alignment precision are smaller for higher volumes inaccordance to experiments and the analytic model. A detailed comparison be-tween the analytic model and numerical results is presented in Section 5.4 below.
The same results are obtained for twist displacement (fig. 19b); an increasinglubricant volume causes a force and torque weakening, which is also confirmedby experiments [43]. This force weakening may lead to a greater sensitivity toslight imperfections which form local energy minima at misaligned states. Theimpact of those imperfections is discussed in Section 5.4.
0.0.5.3 Numerical Simulations for Geometry Design
Since the driving force is created between hydrophobic surfaces, the design ofthe hydrophobic assembly patterns is of great significance in achieving a uniqueenergy minimum and thus good assembly result. For simplification, a fast simu-lation tool is used to evaluate different designs. As shown before in fig. 9, the firstorder approximation of this area is the projection of the interfacial surface ontothe substrate plane, as long as the separation between the binding sites is smallcompared to their lateral size. We can obtain the model of the interfacial energyin terms of overlap area as follows:
Let SandP be the substrate and part binding sites, respectively. The lubricantmeniscus occupies a volume that, when projected onto the substrate plane, is givenby S∪P (this assumes that S and P are not completely non-adjacent). Then, theprojected surfaceM of the lubricant meniscus is(S−S∩P) and(P−S∩P), and
0.0.5 Modelling and Simulation 27
a)1.5 1.6 1.7 1.8
Height [10-4
m]
-2
0
2
4
6
Res
tori
ng f
orce
[10
-4N
]
3.5
4.0
4.5
Tot
al s
urfa
ce e
nerg
y [1
0-8J]
b)
1,0
2,0
3,0
4,0
5,0
6,0
Tot
al s
urfa
ce e
nerg
y [1
0-8J]
0,0 0,5 1,0 1,5 2,0Rotation angle [degrees]
-3,0
-2,5
-2,0
-1,5
Res
tori
ng to
rque
[10
-8N
m]
Figure 18: Capillary forces for lift and tilt displacements. The lubricant volumeis 200 nl. (a) Lift along thez axis, potential energy (left scale) and capillary force(right scale). (b) Tilt of the micro part about they axis, potential energy (left scale)and torque (right scale).
a)0 2 4 6 8 10
Shift [10-4
m]
-1.0
-0.8
-0.6
-0.4
-0.2
0.0
Res
tori
ng f
orce
[10
-4N
]
150 nl100 nl 50 nl
2
4
6
8
10
Tot
al s
urfa
ce e
nerg
y [1
0-8J]
b)-40 -20 0 20 40
Twist angle [degrees]
-4
-2
0
2
4
Res
tori
ng to
rque
[10
-6N
m]
0.0
0.5
1.0
Rel
ativ
e su
rfac
e en
ergy
cha
nge
150 nl100 nl 50 nl
Figure 19: Capillary forces for shift and twist displacements. The lubricant vol-ume is 200 nl. (a) Shift along they axis, potential energy (left scale) and cap-illary force (right scale). (b) Twist about thez axis, relative potential energye(φz) = (E(φz)−E(0◦))/(E(45◦)−E(0◦)) (left scale) and torque (right scale).

28 0.0 Parallel Self-Assembly of Micro Parts in the Fluidic Phase
its area can be calculated as
M =| S−S∩P |+ | P−S∩P |=| S|+ | P | −2 | S∩P | (21)
The surface energy which is proportional to the surface area is given by:
W = γ(| S|+ | P | −2 | S∩P |) (22)
Hereγ is the proportionality factor (interfacial energy coefficient). Since the terms| S| and| P | in (22) are constants,W is determined by| S∩P |: the overlap areabetweenSandP. When S and P coincide perfectly, W is zero . These values are ingood accordance with estimates derived from the 3D surface energy minimizationanalysis discussed above.
This model has the further advantage that it accurately describes the situationafter the initial contact of the micro part with the lubricant. For non-convex bind-ing site shapes, multiple menisci may be involved, with severe consequences forthe uniqueness of the energy minimum uniqueness. It enables the designer to es-timate the energy of a system where the meniscus is confined at the overlap of thetwo hydrophobic areas.
To briefly describe the implementation of the simulation tool, the overlap areacalled A(x,y,θ) is computed with respect to three parameters, representing therelative location(x,y) and orientationθ of P to S. For a given orientationθ , thevalueA can be calculated efficiently by two-dimensional convolution ofP to S.To characterize the overlap area as a function of the rotation angle, calculationsare iterated for discretizedθ values in the range from 0◦ to 360◦. Therefore, fora binding site design, we use two plots to show the simulation results: translationand rotation. In the translation result, the overlap ratio, which is the ratio of theoverlap area to part binding site area (|S∩P|
|P| ), is plotted as a function of relativelocation(x,y) of P to S. In the rotation result, each point in the plot correspondsto a maximum overlap ratio with respect to a given orientationθ . An example ofthe simulation of a square pattern is shown in fig. 20. A comparison between sim-ulation and experimental results of different binding site designs is investigated in[44].
In case when the parts have pre-determined design, we have to decide what isthe optimal design for the binding site on the substrate. For example, the bindingsite design for assembly of the off-shelf LEDs with the hydrophobic pattern shownin fig. 21a is not straightforward. If we choose the substrate binding site the sameas the LED’s (fig. 21b), the simulation results in fig. 21c,d show the local overlapmaxima, which corresponds to energy minima. The experimental result in fig. 21d

0.0.5 Modelling and Simulation 29
Figure 20: Simulation results for the square pattern. (a) Translation simulationof two squares with relative orientation of 0◦. (b) Translation simulation of twosquares with relative orientation of 45◦. (c) Rotation simulation of two squares.
shows the part stuck at the position as indicated in the simulation (fig. 21c). Animproved design is shown in fig. 21f, which has openings in the top-left and right-bottom corners for post-assembly process [18, 19] . It has no isolated minima inthe translation result (fig. 21g). The minima in the rotation result at 180◦, show in(fig. 21h), can not be avoid due to the given LED symmetry design. Fig. 21i is anassembled LED on the improved binding site.
In summary, the simulation results accords to the experiment results. Thesimulation tool can be employed to efficiently evaluate designs for assembly ex-periments in order to improve the assembly results.
0.0.5.4 Modelling of Perturbations and Non-ideal Systems
The process of preparing the substrate and the micro parts involves many pro-cess steps, including lithographic patterning and monolayer deposition. In usualfabrication environment, these processes are sensitive to perturbations like non-uniform SAM coverage, dust on the substrate or the lithography mask, blebs, light

30 0.0 Parallel Self-Assembly of Micro Parts in the Fluidic Phase
Figure 21: (a) A commercial LED with the given binding site design. (b) Anintuitive design for the substrate binding site is the same as the binding site patternof the LED. (c) Translation and (d) rotation simulations for the design in (b). (e)An LED assembled on a binding site as shown in (b) with misalignment, whichcorresponds to the local maximum in the translation simulation result in (c). (f)Another binding pattern design for LED assembly, with the openings on the top-left and bottom-right corners for placing the electroplating bases. (g) Translationand (h) rotation simulations for the design shown in (f). (i) An assembled LED ona binding site as shown in (e).

0.0.5 Modelling and Simulation 31
interferences, particles in the lubricant, irregular hardening of the lubricant, sur-face stress [45] or phase transitions [46]. We have modelled two possible errorsdue to these disturbances:
• Modulations of the interfacial tension of the interface between lubricant andsubstrate
• inhomogeneous hardening of the lubricant
The former may lead to a shift of the local minimum, resulting in a misalignedequilibrium position. The latter may cause a tilt of the micro part during thehardening process.
For both simulations, we assumed that the alignment or hardening processhappen on a much larger timescale than the fluidic relaxation of the lubricantdroplet, i. e. the fluid shape follows adiabatically.
Surface tension defects
The effect of SAM disturbances is modelled by introducing a position dependentinterfacial tensionγSL(~r) = γ0 + γD(~r), where the defect amplitudeγD = γD,SL−γD,SM with γD,SL the defect amplitude for the interface lubricant – substrate andγD,SM the defect amplitude for the interface surrounding medium – substrate. Dueto the symmetry of the setup and the neglect of gravity, defects on the substrateand micro part can be considered equivalent. Two typical defect geometries havebeen investigated [47]:
• Pointlike defects. A good approximation is given by
D(x,y) =1
ax(x−x0)2 +ay(y−y0)2 +1. (23)
This shape function has a rotational symmetry forax = ay, a maximumheight of 1 at(x0,y0) and a width (at a level of 0.) of 2/
√ax in x direction
and 2/√
ay in they direction.
• Line defects, modelled by the shape function
D(x,y) =1
ax(x−x0)2 +1. (24)

32 0.0 Parallel Self-Assembly of Micro Parts in the Fluidic Phase
a)� � � � �� � � � �� � � � �� � � � �� � � � �� � � � �� � � � �� � � � �� � � � �
� � � � �� � � � �� � � � �� � � � �� � � � �� � � � �� � � � �� � � � �� � � � �
l d
l
c
b)
���������������������������������������������������������������������������������������������������������
�����������������������������������������������������������������������������������������������
7
3 4 5 c)�����������������������������������������������������������������������������������������������
�����������������������������������������������������������������������������������������������
543
7
6
h 1
2
b = l
a
Figure 22: Analytic model for partial dewetting. (a) Line defect on the substratehigh wettability area. (b) Complete wetting, (b) partial dewetting of the bindingsite.
The pointlike defect can be used to model defective spots on the high wettabilitylayer, where e.g. dust or blebs lead to the absence of the SAM on a small spot.Line defects can arise from light interferences or surface stress, when the goldlayer or the self-assembly of the monolayer are disturbed on a larger scale.
These defects lead to a partial dewetting of the highly wettable area on thebinding site. For a line defect example, the analytic model was modified to ac-count for this dewetting by modifying the calculation of the wetted area on thesubstrate, using trapezoidal surfaces perpendicular to the line defect and account-ing for height changes of the micro part.
We use (7) to draw the balance of the interfacial energies. Using the nomen-clature of fig. 22 andxd for the defect center position, we get the following energycontributions:
Trapezoidal faces (1): E = γMLha+b2 each
Covered solid (2,3): E = γSLc(a+b)Uncovered solid (4,5): E = γSMc(b−a)Defect (4): E = γDcldFront side (6): E = γMLc
√∆d2 +h2
Back side (7): E = γMLc√
(∆d+b−a)2 +h2
plus an additional energy offset to adapt the model to numerical results. Thelengtha can be calculated from the defect geometry with
a = xd− ld/2+ l/2. (25)
The height of the micro part must be calculated such as to fulfill the volume con-straint, i. e.
a+b2
ch= V. (26)

0.0.5 Modelling and Simulation 33
This leads to a ratio of the heighthc for a covered defect andhu for an uncovereddefect of
hu
hc=
2la+ l
. (27)
For the numerical simulation, it is important to discuss the time response of thesystem. Since the system is much stiffer for tilt, twist and lift than for shift [43],it is possible to separate the timescales of the lateral motion (i. e. inx and ydirection) from the timescale of the remaining degrees of freedom. This has theeffect that the lateral movement always goes through an energy minimum for theother tilt, twist and lift.
The simulation loop thus starts with finding the equilibrium for the rotation an-gles and thezposition by using a Newton minimization scheme, and then movingthe micro part by a small amount in the lateral direction.
Fig. 23a shows the effect of a 0.1 mm line defect in the center of the bindingsite for different defect amplitudes. The micro part was first placed at anx positionof −0.3 mm, then advanced to 0.3 mm in steps of 0.01 mm and returned back to-0.3 mm. They position was always set to zero.
Even for very high defect amplitudes, no alteration of the curve is visibleexcept for an overall energy increase contributed by the defect.
This behavior changes when the defect is placed at the binding site edge. Infig. 23, the energy minimum is shifted to the left side of the graph, since the defectimpedes wetting of the edge and thus the effective pad extent is smaller. Due tothe smooth defect shape, the minimum moves left with increasing defect energy.
If the defect moves further to the center again, wetting of the binding sitebecomes position and defect amplitude dependent. In fig. 24, the defect is placedat anx position of 0.4 mm. For small defect amplitudes, the energy curve is likein fig. 23a. For very high defect amplitudes, the minimum is shifted to the leftas in fig. 23b. Intermediate defect levels cause the energy curve to be combinedof both extremes, depending on position: For the micro part right of a certainposition, complete wetting is achieved and the curve is similar to fig. 23a. Whenthe micro part moves further to the left side, the liquid meniscus shows a suddensnap-through behavior, and the energy curve changes to a curve similar to fig. 23b,with the local minimum at an even further misaligned position. The position ofthis snap-through point depends on the direction of the motion: For the motionfrom left to right, the point lies further to the right than for the inverse direction,thus a hysteresis is visible in both the energy and the force.
However, the impact of this effect is mitigated by the decrease of the energycurve slope near the misaligned local minimum. This corresponds to a lower force

34 0.0 Parallel Self-Assembly of Micro Parts in the Fluidic Phase
a)
9.15
9.2
9.25
9.3
9.35
9.4
9.45
9.5
-3 -2 -1 0 1 2 3 4
Tot
al e
nerg
y [1
0-7J]
shift [10-4m]
Defect x position: 0 mm
50 mJ/m2
70 mJ/m2
90 mJ/m2
110 mJ/m2
b)
9.15
9.2
9.25
9.3
9.35
9.4
9.45
-3 -2 -1 0 1 2 3 4
Tot
al e
nerg
y [1
0-7J]
shift [10-4m]
Defect x position: 0.5 mm
50 mJ/m2
70 mJ/m2
90 mJ/m2
110 mJ/m2
130 mJ/m2
Figure 23: Total energy for a line defect, placed at the binding site edge, versus aparallel shift displacement. The defect is placed (a) at the binding site center, (b)at the binding site edge.
restoring the misaligned position, so that it is easier to leave the local minimumat the misaligned state than the global one at the aligned state. A small forceweakening is already visible at fig. 23b.
The comparison of the two curves for the analytic model and theSurfaceEvolver results shows an excellent agreement (see fig. 25). The model param-eters are listed in Table 2.
Table 2: Analytic model parameters for the simulation of a line defect.Defect position: 4·10−4mDefect amplitude: 58mJ/m2
Defect width: 5·10−5mOffset energy: 8.07·10−7J
We performed further simulations to investigate the effect of point defects.Fig. 27 shows the energy curves for a micro part which is rotated about thez axiswith a point defect placed at the positionx= 0.2mm andy= 0.35mm. Apart fromthe energy offset, only a very small influence on the energy curve was observed.However, point defect may alter the lateral motion.
We performed a shift simulation with a point defect on one corner (right side)of the path, but this time, they coordinate of the micro part was adapted accordingto the ratio of forces inx andy direction. While at the forward pass (right to left)

0.0.5 Modelling and Simulation 35
a)
9.15
9.2
9.25
9.3
9.35
9.4
9.45
9.5
-3 -2 -1 0 1 2 3 4
Tot
al e
nerg
y [1
0-7J]
shift [10-4m]
Defect x position: 0.4 mm
50 mJ/m2
70 mJ/m2
90 mJ/m2
110 mJ/m2
b)
9.18
9.2
9.22
9.24
9.26
9.28
9.3
-2 -1.5 -1 -0.5 0
Tot
al e
nerg
y [1
0-7J]
shift [10-4m]
Defect x position: 0.4 mm
50 mJ/m2
70 mJ/m2
90 mJ/m2
Figure 24: Total energy for a line defect, placed atx = 0.4mm, versus a parallelshift displacement. Curve (b) zoom on the region where snap-through (hysteresis)occurs.
9.15
9.2
9.25
9.3
9.35
9.4
9.45
9.5
-3 -2 -1 0 1 2 3 4
Tot
al e
nerg
y [1
0-7J]
shift [10-4m]
x position: 0.4 mm, 90 mJ/m2
Surface evolverAnalytic model, shiftedAnalytic model, aligned
Figure 25: Comparison between theSurface Evolverresults and the ana-lytic model. An excellent agreement isfound for a large displacement range.
9.1
9.15
9.2
9.25
9.3
9.35
9.4
−2 −1.5 −1 −0.5 0 0.5 1 1.5 2
Tot
al e
nerg
y [1
0−
7 J]
shift [10 −4m]
forward
backward
Figure 26: Stiffening effect of a pointdefect on the energy curve. The micropart passes the equilibrium and thencontinues on a different path.

36 0.0 Parallel Self-Assembly of Micro Parts in the Fluidic Phase
a)
9.15
9.2
9.25
9.3
9.35
9.4
-50 -40 -30 -20 -10 0 10 20 30 40 50
Tot
al e
nerg
y [1
0-7J]
twist angle [degrees]
50 mJ/m2
70 mJ/m2
90 mJ/m2
110 mJ/m2
130 mJ/m2
150 mJ/m2
b)
Point defect
Figure 27: Total energy for twist sweep with point defect. The micro part faceshave been omitted from (b) so as to show the meniscus.
no alteration of the path appeared, the path of the micro part changed as it hadpassed the equilibrium point (fig. 26), continuing at a 45◦angle from the previouspath. This causes a stiffening in thex direction, since the total deflection now is√
2 times higher than thex component.
Inhomogeneous glue hardening
Micro-fluidic self-assembly is a promising technique to produce products with alarge amount of equal components like pixel displays. While the exact parallelalignment of simple light emitting diodes is usually rather insignificant, intercon-nections may impose tighter constraints on the angular position of the micro part.If on the other hand mirrors or directed light sources like LASERs are assembled,deviations of a fraction of degrees can render the device defective.
Assuming a perfect alignment by the capillary forces, it is thus desirable toanalyze the sensitivity of the angular position to the hardening process.
The polymerization process is usually initialized by thermally breaking a spe-cial lubricant component, the starter molecule, into two radicals. These radicalsfunction as starting point of the polymer chains by breaking a triethylenglycoledimethacrylate monomer into two parts and forming a bond to one of them. Sincethe resulting molecule is again radicalic, the process continues, until the chainreaction is stopped by the reaction of two radicals.
This process leads to a volume shrinkage; the volume of the polymer is lowerthan that of the initially available monomer, since the molecules are now arranged

0.0.5 Modelling and Simulation 37
much tighter. Experiments show that this volume shrinkage can amount toβ =20%.
For the proposed self-assembly process, benzoyl peroxide is used as startermolecule. Benzoyl peroxides are known to break in the presence of non-noblemetals in a catalytic reaction at temperatures far below the thermal breakup tem-perature. Since the self-assembled monolayer is deposited on a gold film whichneeds several adhesive metal layers above, exposure of the lubricant to other met-als is probable at the corner of the micro part. This simulation therefore assumesthat due to a defect of the micro part the reaction starts at one corner of the setupand continues spherically through the lubricant until all of it is polymerized. Dueto the high aspect ratio of lateral extent and height of the glue, this can be approx-imated by a cylindrical growth.
The micro part has three degrees of freedom, the angleφ , lateral motionx andthe heightz (see fig. 28).
x
φz
micro part
binding site
lubricant
Figure 28: The degrees of freedom for the simulation of the inhomogeneous gluehardening
The simulation procedure is explained in detail in [48]. The three major stepsare:
1. Find the equilibrium state of the system by minimizing the free energy con-sisting of interfacial surface energy and the elastic energy of the alreadyhardened glue.
2. Increase the radius of the polymerized glue by constraining the yet liquidglue such that it does not touch the region occupied by the polymerizedglue. Decrease the volume of the liquid glue by the volume of the monomerused up by the polymerization.

38 0.0 Parallel Self-Assembly of Micro Parts in the Fluidic Phase
3. Adjust the calculation of the elastic energy so as to reflect the glue hardenedin the current time step.
The angular deflection elastic energy is modelled by a spring modelE =K
φφ2/2 with K
φthe spring constant for the degree of freedomφ . The remaining
degrees of freedom are modelled analogously. Since the shape of the hardenedglue is influenced by the degrees of freedom of the micro part, the zero point ofthe spring model must be adapted for every time step.
From time stept0 to t0+∆t, the radius of the hardened glue cylinder increasesfrom r0 to r0 + ∆r. A new cylindrical layer is formed on the elastic block. Theshape of this new part is determined by the current position of the micro part. Theequilibrium point of this spring ring therefore depends on the system coordinatesat t0. A later deflection from this position will lead to an increase in the elasticenergy stored in that spring by∆E = 1
2k(r(t0))∆r(φ − φ0(r(t0)))2, wherek(r) =
dKφ/dr andφ0(r) is theφ deflection when the glue was hardened up to a radius
of r.We then can express the elastic energy for the complete hardened glue with
radiusr by
E(r,φ) =12
∫ r
0k(ξ )
[φ −φ0(ξ )
]2dξ (28)
=12
φ2∫ r
0k(ξ )dξ −φ
∫ r
0k(ξ )φ0(ξ )dξ +
12
∫ r
0k(ξ )φ2
0(ξ )dξ (29)
= c2φ2 +c1φ +c0. (30)
This reduces to three easy updates for each integration step:
c0(r +∆r)≈ c0(r)+12
φ20(r)
[K
φ(r +∆r)−K
φ(r)
](31)
c1(r +∆r)≈ c1(r)−φ0(r)[K
φ(r +∆r)−K
φ(r)
](32)
c2(r +∆r) =12
Kφ(r +∆r). (33)
The spring constantKφ
was calculated with the finite elements software packageANSYS[49].
To model the volume shrinkage of the glue, for an increase dVG of the poly-merized volume, the monomer volumeVM is decrease by dVM = −dVG/(1−β ).For a change in the glue radius fromr1 = r to r2 = ∆, this evaluates to
∆VM =− 11−β
[π
4
(r22− r2
1
)zc−
√2
3
(r32− r3
1
)tanφ
](34)

0.0.5 Modelling and Simulation 39
Table 3: Tilting angle (in degrees) of the micro part as a function of Young’smodulusY and shrinking ratioβ . Values in parenthesis were noisy.
β Y/MPa 10 20 40 80 150 300 750 20000.2 0.0857 0.0657 (0.0372) (0.0411) 0.0171 0.0114 0.00728 0.003080.4 0.266 0.185 0.127 0.0835 0.0576 0.0296 0.0171 0.005680.6 0.655 0.462 0.336 0.232 0.157 0.106 0.0648 0.02770.7 0.991 0.711 0.504 0.356 0.240 0.168 0.0899 0.0430
0.710 0.08980.8 1.63 1.20 0.862 0.617 0.435 0.305 0.167 0.0818
1.62 1.19 0.856 0.614 0.433 0.304 0.166 0.08160.9 3.49 2.62 1.95 1.41 1.00 0.678 0.366 0.160
3.33 2.54 1.90 1.39 0.99 0.670 0.362 0.1590.95 5.36 4.70 3.49 2.49 1.78 1.20 0.666 0.323
5.35 4.59 3.30 2.38 1.72 1.17 0.651 0.317
with zc thez position of the chip corner where the polymerization has started.We performed simulations for different shrink ratiosβ and Young’s moduliY
by scaling the spring constants appropriately. The hardened glue radius increaseper simulation step was set to∆r = 10−5m.
The results of the simulation are shown in table 3 and fig. 29. For some com-binations ofβ andY, two values are listed. This is due to a relaxation of thetilt angle φ during the simulation run (see fig. 30). This relaxation is especiallydistinctive for high volume shrink rates. Since for highβ , the amount of liquidlubricant becomes small, the interface area to water surrounding the liquid alsobecomes smaller, until the torque exercised by the elasticity of the hardened glueis greater than the surface tension forces. The first line of the table denotes themaximum angle, while the second line denotes the final angle after 30 steps. Thefinal angle is only printed if it differs in the accuracy of the table.
High β values are unlikely to occur in polymerization processes, but are com-mon in drying processes, where most of the lubricant evaporates or dilutes ordiffuses into the surrounding liquid medium.
The results clearly show that the final tilt angle both depends on Young’s mod-ulus and the volume shrink ratio, and may achieve values of up to 5◦. The tiltangle depends also on the lubricant height; again, thinner lubricants work towardssmaller errors.
However, the system presented above is not very sensitive to tilt errors due to

40 0.0 Parallel Self-Assembly of Micro Parts in the Fluidic Phase
0.2
0.4
0.6
0.80
5001000
1500
2000Y/MPa
β
0
2
4
φ/deg
Figure 29: 3D plot of the results in ta-ble 3. High tilt angles are expected forhigh β and lowY.
0
0.5
1
1.5
2
2.5
3
3.5
4
0.5 1 1.5 2 2.5 3 3.5 4
Tilt
ang
le [
degr
ees]
Glue radius [10-4m]
Volume shrink 90%10 MPa20 MPa40 MPa80 MPa
150 MPa300 MPa750 MPa
2000 MPa
Figure 30: Micro part tilting angle ver-sus hardened glue radius for a volumeshrink ratio ofβ = 0.9.
the low volume shrink ratioβ = 20% and the high Young modulus of 2000MPa.The results offer a possibility for a new process to obtain defined tilt angles;
by carefully choosing a material and introducing a defined starting point for thepolymerization, production of defined tilt angles is possible.
0.0.6 Summary and Conclusions
In this paper, we have discussed a surface-tension driven micro-assembly tech-nique with focus on the assembly and self-alignment process. Presented are ex-perimental design and simulation results of the technique. We have performedsimulations including calculations of the surface-tension driving force for the as-sembly, geometry design for the binding site and investigations of perturbationinfluence on the assembly results. The experimental results accord with the sim-ulation results. In addition, we have derived several analytical models to predictthe driving forces in fluidic self-assembly, developed geometric calculations of thesurface area and the overlap of the binding sites, and outlined preliminary algo-rithms for optimization of binding site design. By applying the simulation tools todifferent configurations, we can reduce extensive experimental effort and achieveoptimal experimental design.

0.0.7 Acknowledgments 41
As an enabling technique, the assembly approach is applicable to generic partssuch as surface mount LEDs. We believe that parallel micro self-assembly isfeasible and essential for the production of microsystems. It is anticipated thatthis self-assembly technique can be applicable to a wide range of micro or nanoparts made of different materials, for the integration and packaging of complexheterogeneous systems.
0.0.7 Acknowledgments
We would like to thank Roger T. Howe and Uthara Srinivasan for inspiring dis-cussions. We thank Weihua Wang and Daniel T. Schwartz for help in the devel-opment of multi-batch assembly techniques. We thank Jiandong Fang, YanbingWang and Shenghsiung Liang for help in the fabrication and all the members ofthe University of Washington MEMS lab and the staff and users of the WashingtonTechnology Center Microfabrication laboratory for their help and support.
This research is supported in part by NSF Career Award ECS9875367 andNSF Award ECS0223598 to K. Bohringer and by donations from Agilent Tech-nologies, Intel Corporation, Microsoft Research, Tanner Research Inc. and Tech-nic Inc. Y. Hanein acknowledges partial support by NSF CISE Postdoctoral Re-search Associateship EIA0072744. X. Xiong acknowledges support from a FordFellowship.

42 0.0 Parallel Self-Assembly of Micro Parts in the Fluidic Phase
List of Symbols and Abbreviations
Symbol Designationa contact line segmenta extent of wetted binding siteax,ay defect shape parameterA areaα angle between displacement and contact lineα0 electronic polarizabilityb displacement component perpendicular to contact lineb micro part lengthβ apex angleβ relative volume shrinkC constantc pad widthD defect shape functiond displacementδ variation∆ changeE energyε0 permittivity of free spaceεr relative permittivityF forceγ interfacial/surface tensionI ionization potentialh distance between binding site and micro partK spring constantk Boltzmann constantL liquid phasel arclengthl line perpendicular to displacementl pad lengthld defect sizel distance vectorL contact lineM surrounding mediump pressure

0.0.References 43
Symbol Designationφ tilt angleq chargeR radiusr,~r distanceS substrate, solid surfaces, s′, s′′ length of a surface patch (projection, flat, curved)~s triangle edgeT absolute temperaturet timeθ contact angleθ micro part orientationu projection of curved lubricant side wall onto substrate planeu dipole momentV VolumeW workw potential energy of interactionw projection of contact lineξ displacementY Young’s modulus
Abbreviation ExplanationCAE Computer-Aided EngineeringDI water deionized waterIPA Isopropyl AlcoholLED Light Emitting DiodeSAM Self Assembled MonolayerTEGDMA triethyleneglycol dimethacrylateUV ultraviolet
References
[1] S. J. Ralis, B. Vikramaditya, and B. J. Nelson. Micropositioning of a weaklycalibrated microassembly system using coarse-to-fine visual servoing strate-gies.IEEE Transactions on Electronics Packaging Manufacturing, 2000, 23(2), 123 –131.

44 0.0 Parallel Self-Assembly of Micro Parts in the Fluidic Phase
[2] G. Yang, J. A. Gaines, and B. J. Nelson, A flexible experimental workcellfor efficient and reliable wafer-level 3D micro-assembly, inProc. IEEE In-ternational Conference on Robotics and Automation (ICRA), Seoul, SouthKorea,2001, p. 133 – 138.
[3] J. A. Thompson and R. S. Fearing, Automating microassembly with ortho-tweezers and force sensing, inProc. IEEE/RSJ International Conference onIntelligent Robots and Systems (IROS), Maui, HI, 2001, p. 1327 –1334.
[4] K. Saitou, D. A. Wang, and S. J. Wou. Externally resonated linear microvi-bromotor for microassembly.ASME/IEEE J. of Microelectromechanical Sys-tems, 2000, 9 (3), 336–346.
[5] R. S. Fearing, Survey of sticking effects for micro-parts, inProc. IEEE/RSJInt. Conf. on Robotics and Intelligent Systems (IROS), Pittsburg, PA,1995,p. 212 –217.
[6] M. B. Cohn, K. F. Bohringer, J. M. Noworolski, A. Singh, C. G. Keller,K. Y. Goldberg, and R. T. Howe, Microassembly technologies for MEMS,in Proc. SPIE Micromachining and Microfabrication Process Technology IV(Ed.: J. H. Smith), Vol. 3511, Santa Clara, CA, International Society forOptical Engineering, September1998, p. 2–16.
[7] A. S. Holmes and S. M. Saidam. Sacrificial layer process with laser-drivenrelease for batch assembly operations.ASME/IEEE J. of Microelectrome-chanical Systems, 1998, 7 (4), 416–422.
[8] H.-J. J. Yeh and J. S. Smith. Fluidic self-assembly for the integration ofGaAs light-emitting diodes on Si substrates.IEEE Photonics TechnologyLetters, June1994, 6 (6), 706–708.
[9] K. F. Bohringer, K. Y. Goldberg, M. B. Cohn, R. T. Howe, and A. P. Pisano,Parallel microassembly using electrostatic force fields, inIEEE InternationalConference on Robotics and Automation (ICRA), Leuven, Belgium,1998, p.483 – 496.
[10] K. F. Bohringer, R. S. Fearing, and K. Y. Goldberg, Microassembly, inTheHandbook of Industrial Robotics(Ed.: S. Nof), 2nd ed., John Wiley & Sons,February1999, p. 1045–1066.
0.0.References 45
[11] A. Terfort, N. Bowden, and G. M. Whitesides. Three-dimensional self-assembly of millimetre-scale components.Nature, 1997, 386, 162–164.
[12] A. Terfort and G. M. Whitesides. Self-assembly of an operating electricalcircuit based on shape complementarity and the hydrophobic effect.Ad-vanced Materials, 1998, 10 (6), 470–473.
[13] D. Gracias, J. Tien, T. L. Breen, C. Hsu, and G. M. Whitesides. Formingelectrical networks in three dimensions by self-assembly.Science, 2000,289, 1170–1172.
[14] U. Srinivasan, R. T. Howe, and D. Liepmann, Fluidic microassembly usingpatterned self-assembled monolayers and shape matching, inInternationalConferece on Solid-State Sensors and Actuators, Proc. Transducers, Sendai,Japan, June 7–101999, p. 1170–1173.
[15] U. Srinivasan, R. T. Howe, and D. Liepmann. Microstructure to substrateself-assembly using capillary forces.Journal of MicroelectromechanicalSystems, 2001, 10, 17–24.
[16] B. Yellen and G. Friedman, Magnetic driven assembly of colloidal particlesonto patterned surfaces, inTechnical Proceedings of the 2003 Nanotechnol-ogy Conference and Trade Show, Vol. 3, 2003.
[17] H. O. Jacobs, A. R. Tao, A. Schwartz, D. H. Gracias, and G. M. Whitesides.Fabrication of a cylindrical display by patterned assembly.Science, 2002,296(5566), 323–325.
[18] X. Xiong, Y. Hanein, W. Wang, D. T. Schwartz, and K. F. Bohringer, Con-trolled part-to-substrate micro-assembly via electrochemical modulation ofsurface energy, inProc. International Conference on Solid-State Sensors andActuators, Transducers, Munich, Germany, June2001.
[19] X. Xiong, Y. Hanein, J. Fang, Y. Wang, W. Wang, D. T. Schwartz, and K. F.Bohringer. Controlled multi-batch self-assembly of micro devices. Tech-nical Report UWEETR-2002-0006, Department of Electrical Engineering,University of Washington, Seattle, USA, March2002.
[20] P. G. de Gennes. Wetting: Statics and dynamics.Reviews of Modern Physics,July1985, 57 (3), 827–863.
46 0.0 Parallel Self-Assembly of Micro Parts in the Fluidic Phase
[21] L. D. Landau and E. M. Lifschitz.Course of Theoretical Physics, PergamonPress,1969, Vol. 5 and 6.
[22] L. D. Landau and E. M. Lifschitz.Course of Theoretical Physics, PergamonPress,1987, Vol. 6.
[23] Y. O. Popov and T. A. Witten. Characteristic angles in the wetting of anangular region: Surface shape.Eur. Phys. J. E, 2001, 6 (3), 211–220.
[24] J. Israelachvili.Intermolecular and Surface Forces, 2nd ed., Academic Press,1991.
[25] A. A. Darhuber, S. M. Troian, and S. Wagner. Physical mechanisms govern-ing pattern fidelity in microscale offset printing.Journal of Applied Physics,2001, 90 (7), 3602–3609.
[26] A. A. Darhuber, S. M. Troian, J. M. Davis, S. M. Miller, and S. Wagner.Selective dip-coating of chemically micropatterned surfaces.Journal of Ap-plied Physics, 2000, 88 (9), 5119–5126.
[27] J. Lee and C. J. Kim. Surface-tension-driven microactuation based on con-tinuous electrowetting.ASME/IEEE J. of Microelectromechanical Systems,2000, 9 (2), 171–180.
[28] K. F. Harsh, R. S. Irwin, and Y. C. Lee, Solder self-assembly forMEMS,in Proceedings of the 1998 International Instrumentation Symposium (ISA),Reno, NV,1998, p. 256–261.
[29] U. Srinivasan.Fluidic Self-Assembly of Microfabricated Parts to SubstratesUsing Capillary Forces. Ph.D Thesis, University of California at Berkeley,Department of Chemical Engineering,2001.
[30] R. R. A. Syms. Equilibrium of hinged and hingeless structures rotated usingsurface tension forces.Journal of Microelectromechanical Systems, Decem-ber1995, 4 (4), 177–184.
[31] M. J. Wale and C. Edge. Self-aligned flip-chip assembly of photonic deviceswith electrical and optical connections.IEEE Transactions on Components,Hybrids, and Manufacturing Technology, December1990, 13 (4), 780–786.

0.0.References 47
[32] K. Hosokawa, I. Shimoyama, and H. Miura. Two-dimensional micro-self-assembly using the surface tension of water.Sensors and Actuators A, 1996,57 (2), 117–125.
[33] K. Sato, S. Hata, and A. Shimokohbe, Self-alignment for microparts as-sembly using water surface tension, inProceedings of SPIE, InternationalSymposium on Microelectronics and Micro-Electro-Mechanical Systems MI-CRO/MEMS’99, Queensland, Australia,1999, p. 321–329.
[34] K. Sato, K. Ito, S. Hata, and A. Shimokohbe, Self-alignment of micropartsusing liquid surface tension – examination of alignment characteristics, inAmerican Society for Precision Engineering 15th Annual Meeting, Vol. 22,Arizona, USA,2000, p. 345–348.
[35] Munzing Chemie GmbH. Additives for surface and substrates, January2001.
[36] J. Y. Park, J. S. Ha, C. S. Kang, K. S. Shin, M. I. Kim, and J. P. Jung. Studyon the soldering of off-eutectic pb-sn solders in partial melting state.Journalof the Microelectronics and Packaging Society, 2000, 7 (2), 63–68.
[37] X. Xiong, Y. Hanein, W. Wang, D. T. Schwartz, and K. F. Bohringer, Multi-batch micro-selfassembly via controlled capillary forces, inInternationalConference on Intelligent Robots and Systems, Maui, HI, IEEE/RSJ IROS,October – November2001.
[38] C. D. Bain, E. B. Troughton, Y.-T. Tao, J. Evall, G. M. Whitesides, and R. G.Nuzzo. Formation of monolayer films by spontaneous assembly of organicthiols from solution onto gold.Journal of the American Chemical Society,1989, 111, 321–335.
[39] J. A. Pojman, W. W. West, and J. Simmons. Propagating fronts of polymer-ization in the physical chemistry laboratory.Journal of Chemical Education,1997, 74 (6), 727–730.
[40] J. Lienemann. Modeling and simulation of the fluidic controlled self-assembly of micro parts. Diplomarbeit, IMTEK, Albert Ludwig University,Freiburg, Germany, May 282002.
[41] K. A. Brakke. The surface evolver.Experimental Mathematics, 1992, 1 (2),141–165.

48 0.0 Parallel Self-Assembly of Micro Parts in the Fluidic Phase
[42] K. A. Brakke. Surface Evolver Manual, Mathematics Department, Susque-hanna University, Selinsgrove, August 18,1999.
[43] A. Greiner, J. Lienemann, J. G. Korvink, X. Xiong, Y. Hanein, and K. F.Bohringer, Capillary forces in micro-fluidic self-assembly, inFifth Interna-tional Conference on Modeling and Simulation of Microsystems (MSM’02),Tech. Proc. MSM, San Juan, Puerto Rico, USA, April 22–252002.
[44] K. F. Bohringer, U. Srinivasan, and R. T. Howe, Modeling of capillary forcesand binding sites for fluidic self-assembly, inIEEE Workshop on Micro Elec-tro Mechanical Systems (MEMS), Interlaken, Switzerland, January 21–25,2001.
[45] R. Berger, E. Delamarche, H. P. Lang, C. Gerber, J. K. Gimzewski, E. Meyer,and H.-J. Guntherodt. Surface stress in the self-assembly of alkanethiols ongold. Science, June1997, 276, 2021–2024.
[46] J. Noh and M. Hara. Molecular-scale growth processes of alkanethiol self-assembled monolayers on Au(111).Riken Review, August2001, 38, 49–51.
[47] J. Lienemann, A. Greiner, and J. G. Korvink, Surface tension defects inmicro-fluidic self-alignment, inSymposium on Design, Test, Integration, andPackaging of MEMS/MOEMS 2002, Vol. 4755, Cannes-Mandelieu, France,International Society for Optical Engineering, May2002, p. 55–63.
[48] J. Lienemann, A. Greiner, and J. G. Korvink, Volume shrinking in micro-fluidic self-assembly, in4th International Conference on Advanced Semicon-ductor Devices and Microsystems (ASDAM 2002), Smolenice Castle, Slo-vakia, October2002, p. 369–372.
[49] ANSYS, Inc.ANSYS User’s manual Revision 5.7. Canonsburg, USA,2000.http://www.ansys.com.