modified blaney-criddle for excelmodified blaney-criddle for excel this allocation program which...
TRANSCRIPT

Modified Blaney-Criddle for Excel
This allocation program which calculates a maximum monthly supplemental crop requirement and an average annual supplemental requirement using the Modified Blaney-Criddle method.
The District assumes no responsibility to the user for the accuracy of this program. The District advises the user that additional information is available in the Basis of Review Volume III.There may be discrepancies between the result obtained by the user(s) and those results obtained by the District.
This program was updated on September, 2000
Worksheet Developed by Jeffery Scott
Questions Concerning the Worksheet:Please Contact Jeffery Scott at SFWMD West Palm Beach Office 1-800-432-2045 Ext. 6924 or E-mail [email protected]

Rainfall Station: MiamiIrrigation System:Irrigated Acreage:Crop:Soil Type:MultiplierEfficiency
Calculations Jan Feb Mar Apr May Jun Jul Aug Sep Oct Nov Dec Total
Average Rainfall (inches) 2.02 2.06 2.08 3.13 6.35 7.84 5.44 6.29 8.30 8.38 2.80 2.05 56.74
Evapotranspiration (inches) 2.11 2.42 4.06 5.43 6.95 7.57 8.05 7.70 6.50 5.16 3.43 2.45 61.83
Average Effective Rainfall (inches) 0.95 0.98 1.09 1.69 3.39 4.20 3.16 3.51 4.15 3.89 1.37 0.98 29.36
1-in-10 Effective Rainfall (inches) 0.67 1.02 0.15 0.74 2.06 2.58 2.70 3.03 3.55 3.21 1.06 0.79 21.56
Average Irrigation (inches) 1.16 1.44 2.97 3.74 3.56 3.37 4.89 4.19 2.35 1.27 2.06 1.47 32.47
1-in-10 Irrigation (inches) 1.44 1.40 3.91 4.69 4.89 4.99 5.35 4.67 2.95 1.95 2.37 1.66 40.27
1-in-10 Annual Supplemental Crop Requirement = 40.27 inches
Annual Supplemental Crop Water Use:
40.27 inches X MG
1-in-10 Maximum Monthly Supplemental Crop Requirement = 5.35 inches
Maximum Monthly Supplemental Crop Water Use:
5.35 inches X MG
Notes:Evapotranspiration was calculated using a modified Blaney-Criddle method.Average effective rainfall is the amount that is useful to crops in an average year.2-in-10 drought rainfall is the rainfall minimum expected with a probability of 2 year in 10.2-in-10 effective rainfall is the amount that is useful to crops in a 2-in-10 drought rainfall.Average irrigation is the net amount that should be required for maximum yields during an average year.2-in-10 irrigation is the net amount that should be required for maximum yields during a 2-in-10 drought year.
1 Acres X 1.33 X 0.02715 MG/AC-IN =
1.45
0.19
1.33 X 0.02715 MG/AC-IN =
Calculations Of Irrigation Requirements (1-in-10)
Sprinkler1.00
Turf Grass0.801.33
1 Acres X
0.75

2-in-101-in-10
Maximum Monthly Supplemental Crop Water Use: 0.00 MG0.00 inches/acre
0.000.000.000.000.000.000.000.000.000.000.000.00
2-in-10Jan Feb Mar Apr May Jun Jul Aug Sep Oct Nov Dec Total 2.268 7.594
Average Rainfall (inches) 1.31 1.89 1.94 2.84 4.59 6.73 6.51 6.74 7.97 3.72 1.02 1.61 46.87 11.00 7.594Evapotranspiration (inches) 2.70 4.12 4.18 4.45 8.00 6.51 0.00 0.00 0.00 0.00 0.00 0.00 29.96 7.594Average Effective Rainfall (inches) 0.66 1.00 1.03 1.47 2.72 3.48 2.35 2.42 2.79 1.45 0.44 0.68 20.49 7.5942-in-10 Effective Rainfall (inches) 0.55 0.84 0.86 1.23 2.29 2.92 1.97 2.03 2.34 1.22 0.37 0.58 17.20 7.594Average Irrigation (inches) 2.04 3.12 3.15 2.98 5.28 3.03 0.00 0.00 0.00 0.00 0.00 0.00 19.60 7.5942-in-10 Irrigation (inches) 2.15 3.28 3.32 3.22 5.71 3.59 0.00 0.00 0.00 0.00 0.00 0.00 21.27 7.594
7.5942-in-10 Rainfall (inches) 1.1 1.59 1.63 2.39 3.86 5.65 5.47 5.66 6.69 3.12 0.86 1.35 7.594
7.5947.5947.594
1-in-10Jan Feb Mar Apr May Jun Jul Aug Sep Oct Nov Dec Total 2.395 8.019
Average Rainfall (inches) 2.08 1.98 2.37 2.39 4.27 7.20 6.28 6.38 5.92 3.46 1.93 1.67 45.93 11.00 8.019Evapotranspiration (inches) 2.71 4.04 4.13 4.41 8.03 6.55 0.00 0.00 0.00 0.00 0.00 0.00 29.87 8.019Average Effective Rainfall (inches) 1.01 1.04 1.23 1.25 2.56 3.69 2.28 2.31 2.17 1.36 0.81 0.71 20.42 8.0191-in-10 Effective Rainfall (inches) 0.94 1.26 0.22 0.69 2.00 2.96 1.67 1.92 1.94 1.08 0.84 0.61 16.13 8.019Average Irrigation (inches) 1.70 3.00 2.90 3.16 5.47 2.86 0.00 0.00 0.00 0.00 0.00 0.00 19.09 8.0191-in-10 Irrigation (inches) 1.77 2.78 3.91 3.72 6.03 3.59 0.00 0.00 0.00 0.00 0.00 0.00 21.80 8.019
8.0191-in-10 Rainfall (inches) 1.93 2.46 0.43 1.25 3.22 5.56 4.38 5.13 5.2 2.66 2.01 1.41 8.019
8.0198.0198.019
Update 2-in-10 and 1-in-10 Graph
Graphical Presentation
1.44 1.40
3.91
4.69 4.89 4.995.35
4.67
2.95
1.952.37
1.66
0.001.002.003.004.005.006.007.008.009.00
Jan Feb Mar Apr May Jun Jul Aug Sep Oct Nov Dec
Monthly Values
Inch
es
Average Rainfall(inches)
Evapotranspiration(inches)
Average EffectiveRainfall (inches)
1-in-10 EffectiveRainfall (inches)
1-in-10 Irrigation(inches)
Max Month Alloc.(inches/acre)
Graphical Presentation of 2-in-10 and 1-in-10
2.15
3.28 3.32 3.22
5.71
3.59
0.00 0.00 0.00 0.00 0.00 0.001.77
2.78
3.91 3.72
6.03
3.59
0.00 0.00 0.00 0.00 0.00 0.000123456789
Jan Feb Mar Apr May Jun Jul Aug Sep Oct Nov Dec
Monthly Values
Inch
es
2-in-10 Rainfall(inches)1-in-10 Rainfall(inches)Evapotranspiration(inches) 2-in-10Evapotranspiration(inches) 1-in-102-in-10 Irrigation(inches)1-in-10 Irrigation(inches)2-in-10 Max MonthAlloc (inches/acre)""1-in-10 Max MonthAlloc (inches/acre)"
g:\aproject\sdfsdfsdfsdfdsf

sdfg
sd
0.00
1.00
2.00
3.00
4.00
5.00
6.00
7.00
8.00
9.00
02
46
810
1214
sdfg
sdfg
sdfgsdfg
Ser
ies1
Ser
ies2
Ser
ies3
Ser
ies4
Ser
ies5
Ser
ies6

Data Input
Enter "X" for 1-in-10 calculations >>> 2-in-10 1-in-10Otherwise, 2-in-10 values will be calculated x
Enter Station Number>>> 24 1 Archbold 21 Loxahatchee2 Avon Park 22 Melbourne (No Data)3 Belle Glade 23 Merritt Island (No Data)4 Big Cypress (No Data) 24 Miami5 Clewiston 25 Moore Haven6 Everglades 26 Naples7 Fellsmere (No Data) 27 Okeechobee8 Fort Drum 28 Orlando9 Ft. Lauderdale 29 Pompano Beach
10 Ft. Myers 30 Punta Gorda11 Ft. Pierce 31 Stuart12 Hialeah 32 S-6513 Homestead 33 S 140 W14 Hypoluxo 34 Tamiami 415 Immokalee 35 Titusville (No Data)16 Indiantown (No Data) 36 Vero Beach (No Data)17 Jupiter 37 West Palm Beach18 Kissimmee19 La Belle20 Lake Placid (No Data)
Perennial AnnualEnter Crop Type>>> 15 5 Nursery 25 Palm Trees 51 Dry Beans
10 Sugarcane 52 Green Bean11 Alfalfa 53 Grain Corn12 Avocado 54 Silage Corn13 Citrus 55 Sweet Corn14 Grapes 56 Melons15 Turf Grass 57 Peas18 Blueberries 58 Potato20 Pasture 59 Soybeans21 Papaya 60 Tomato22 Carambola 61 Small Vegetables23 Tropical Fruit 62 Winter Wheat24 Mangoes
Enter for "Annual Crops" Jan Feb Mar Apr May Jun Jul Aug Sep Oct Nov DecEnter "X" for each month the
crop is being planted>>> YesNo
Growing Season Length in MonthsEnter for "Annual Crops" 2 3 4 5 6
Growing Season Length>>> 6
Soil TypesEnter Soil Type>>> 0.8 0.2 0.4 0.8 1.5 3.6
Enter Irrigation System No.>>> 07Micro-Irrigation Overhead Sprinkler Subirrigation
01 Micro-spinkler 07 Sprinkler 03 Seepage/Furrow02 Overhead Drip 08 Portable Gun 04 emi-Closed Flow-Through11 Nursery Container 09 Traveling Gun 05 Crown Flooding12 Semi-Closed Flow-Through 10 Overhead 06 Sub-irrigation13 Low Volume 92 Volume Gun 14 Surface Gravity90 Container 93 Walking Gun 18 Flood/Seepage
Yes NoIs there a SWM Permit? Enter Either Y or N N
Enter the Irrigated Acreage>>> 1.00

2-in-101-in-10
Maximum Monthly Supplemental Crop Water Use: 0.00 MG0.00 inches/acre
0.000.000.000.000.000.000.000.000.000.000.000.00
2-in-10Jan Feb Mar Apr May Jun Jul Aug Sep Oct Nov Dec Total 2.268 7.594
Average Rainfall (inches) 1.31 1.89 1.94 2.84 4.59 6.73 6.51 6.74 7.97 3.72 1.02 1.61 46.87 11.00 7.594Evapotranspiration (inches) 2.70 4.12 4.18 4.45 8.00 6.51 0.00 0.00 0.00 0.00 0.00 0.00 29.96 7.594Average Effective Rainfall (inches) 0.66 1.00 1.03 1.47 2.72 3.48 2.35 2.42 2.79 1.45 0.44 0.68 20.49 7.5942-in-10 Effective Rainfall (inches) 0.55 0.84 0.86 1.23 2.29 2.92 1.97 2.03 2.34 1.22 0.37 0.58 17.20 7.594Average Irrigation (inches) 2.04 3.12 3.15 2.98 5.28 3.03 0.00 0.00 0.00 0.00 0.00 0.00 19.60 7.5942-in-10 Irrigation (inches) 2.15 3.28 3.32 3.22 5.71 3.59 0.00 0.00 0.00 0.00 0.00 0.00 21.27 7.594
7.5942-in-10 Rainfall (inches) 1.1 1.59 1.63 2.39 3.86 5.65 5.47 5.66 6.69 3.12 0.86 1.35 7.594
7.5947.5947.594
1-in-10Jan Feb Mar Apr May Jun Jul Aug Sep Oct Nov Dec Total 2.395 8.019
Average Rainfall (inches) 2.08 1.98 2.37 2.39 4.27 7.20 6.28 6.38 5.92 3.46 1.93 1.67 45.93 11.00 8.019Evapotranspiration (inches) 2.71 4.04 4.13 4.41 8.03 6.55 0.00 0.00 0.00 0.00 0.00 0.00 29.87 8.019Average Effective Rainfall (inches) 1.01 1.04 1.23 1.25 2.56 3.69 2.28 2.31 2.17 1.36 0.81 0.71 20.42 8.0191-in-10 Effective Rainfall (inches) 0.94 1.26 0.22 0.69 2.00 2.96 1.67 1.92 1.94 1.08 0.84 0.61 16.13 8.019Average Irrigation (inches) 1.70 3.00 2.90 3.16 5.47 2.86 0.00 0.00 0.00 0.00 0.00 0.00 19.09 8.0191-in-10 Irrigation (inches) 1.77 2.78 3.91 3.72 6.03 3.59 0.00 0.00 0.00 0.00 0.00 0.00 21.80 8.019
8.0191-in-10 Rainfall (inches) 1.93 2.46 0.43 1.25 3.22 5.56 4.38 5.13 5.2 2.66 2.01 1.41 8.019
8.0198.0198.019
Update 2-in-10 and 1-in-10 Graph
Graphical Presentation
1.44 1.40
3.91
4.69 4.89 4.995.35
4.67
2.95
1.952.37
1.66
0.001.002.003.004.005.006.007.008.009.00
Jan Feb Mar Apr May Jun Jul Aug Sep Oct Nov Dec
Monthly Values
Inch
es
Average Rainfall(inches)
Evapotranspiration(inches)
Average EffectiveRainfall (inches)
1-in-10 EffectiveRainfall (inches)
1-in-10 Irrigation(inches)
Max Month Alloc.(inches/acre)
Graphical Presentation of 2-in-10 and 1-in-10
2.15
3.28 3.32 3.22
5.71
3.59
0.00 0.00 0.00 0.00 0.00 0.001.77
2.78
3.91 3.72
6.03
3.59
0.00 0.00 0.00 0.00 0.00 0.000123456789
Jan Feb Mar Apr May Jun Jul Aug Sep Oct Nov Dec
Monthly Values
Inch
es
2-in-10 Rainfall(inches)1-in-10 Rainfall(inches)Evapotranspiration(inches) 2-in-10Evapotranspiration(inches) 1-in-102-in-10 Irrigation(inches)1-in-10 Irrigation(inches)2-in-10 Max MonthAlloc (inches/acre)""1-in-10 Max MonthAlloc (inches/acre)"
g:\aproject\sdfsdfsdfsdfdsf

Mia
mi
Turf
Gra
ssC
alcu
late
et a
nd e
ffect
ive
aver
age
rain
rain
1-in
-10
Rai
nfal
l (in
ches
)Te
mp
sun
Soil
coef
f(3
)(4
)(5
)(6
)(7
) Ave
.(8
)(9
)(1
0) A
ve.
(7)
1
-in
-10
(10)
1-in
-10
2.02
1.38
67.3
57.
500.
800.
495.
0512
500.
8511
554.
2993
972.
1067
051.
1503
671.
1248
860.
7328
920.
9483
860.
8092
090.
6671
28
2.06
2.15
68.4
87.
130.
574.
8826
240.
8707
044.
2513
202.
4232
521.
1709
911.
1449
540.
7328
920.
9826
111.
2171
411.
0213
37
2.08
0.32
71.6
58.
380.
736.
0042
700.
9255
455.
5572
224.
0567
721.
1812
771.
2543
460.
7328
921.
0859
480.
1617
180.
1486
67
3.13
1.27
75.1
38.
630.
856.
4837
190.
9857
496.
3913
205.
4326
221.
7006
171.
3545
510.
7328
921.
6882
700.
7480
170.
7425
86
6.35
3.56
78.7
49.
360.
907.
3700
641.
0482
027.
7253
166.
9527
843.
1380
411.
4746
010.
7328
923.
3913
541.
9038
912.
0575
79
7.84
4.43
81.2
39.
280.
927.
5381
441.
0912
798.
2262
187.
5681
213.
7553
221.
5261
690.
7328
924.
2003
922.
3026
302.
5755
31
5.44
4.54
82.6
89.
480.
927.
8380
641.
1163
648.
7501
328.
0501
212.
7486
281.
5678
190.
7328
923.
1582
892.
3520
102.
7025
58
6.29
5.30
82.8
49.
130.
917.
5632
921.
1191
328.
4643
227.
7025
333.
1126
831.
5376
710.
7328
923.
5078
282.
6877
403.
0289
40
8.30
6.91
81.6
78.
320.
876.
7949
441.
0988
917.
4669
036.
4962
063.
9415
591.
4374
670.
7328
924.
1524
643.
3727
463.
5532
15
8.38
6.70
78.1
08.
070.
796.
3026
701.
0371
306.
5366
885.
1639
843.
9737
601.
3343
760.
7328
923.
8861
523.
2851
393.
2127
13
2.80
2.11
73.1
37.
370.
675.
3896
810.
9511
495.
1263
903.
4346
811.
5412
781.
2115
050.
7328
921.
3685
041.
1966
731.
0625
29
2.05
1.61
68.8
77.
380.
555.
0826
060.
8774
514.
4597
382.
4528
561.
1658
421.
1468
490.
7328
920.
9799
090.
9344
850.
7854
50
1-in
-10
Dat
a In
put

PART B
WATER USE MANAGEMENT SYSTEM
DESIGN AND EVALUATION AIDSI. SUPPLEMENTAL CROP REQUIREMENT
AND
WITHDRAWAL CALCULATION SUPPLEMENTAL CROP REQUIREMENT AND WITHDRAVAL CALCULATION
Introduction
An important aspect of successful crop production or landscape maintenance is ensuring that the vegetation receivessufficient moisture to meet its evapotranspiration demands. When rainfall is less than evapotranspiration, irrigationmust be applied to meet the deficit. As part of its consumptive water use permitting program, the South Florida WateManagement District issues permits for irrigation water use. The goal of the permitting program is to provide anallocation of irrigation water sufficient to meet the deficit between effective rainfall and evapotranspiration through adrought event that has a probability of occurring once in every ten years (1-in-10). That allocation is designed to meeboth the needs of a prolonged drought of up to one year as well as to meet peak monthly demands
The South Florida Water Management District uses a modified Blaney-Criddle equation to determine cropevapotranspiration and the method developed by the United States Department of Agriculture Soil ConservationService to determine supplemental irrigation needs
The Blaney-Criddle Equation
The Blaney-Criddle equation for estimating evapotransiration is
(1)
where:U = crop evapotranspiration for a given period,
k = an annual seasonal, or monthly empirical consumptive use coefficient which varies according to the cr
p = percent of daytime hours of the year which occur during the period,
t = mean temperature for the period, in Farenheit, and
m = month.
The equation has been modified to include:
(2) k = kt x kc
where:
kt = a climatic coefficient which is related to the mean air
� m
1
U = p t /100(1)

temperature, the value of which is expressed as
kt = 0.0173t - 0.314
kc = a coefficient reflecting the growth stage of the crop (Table B-I-1)
Calculation of Monthly Supplemental Crop Requirement and Allocation
The calculations to determine crop evapotraspiration are based on selected crop growth coefficients (Table B-I-1),rainfall, temperature and solar radiation for selected rainfall stations (Figures B-I-1 through B-I-15 and Table B-I-2)and net depth of application (Figures B-I-1 through B-I-15). In order to estimate monthly evapotranspiration, theDistrict approximates equations (1) and (2) as follows:
(3) f (m) = ( t (m) x p (m) ) / 100
(4) kt (m) = (0.0173 x t (m)) - 0.314
(5) kt f (m) = f (m) x kt (m)
(6) U (m) = kt f (m) x kc (m)
where:
m = month of year
f (m) = monthly evapotranspiration factor,
t (m) = average monthly temperature (Table B-I-2),
p (m) = monthly percentage of annual daylight hours (Table B-I-2),
kt (m) = kt,
U (m) = monthly evapotranspiration, and
kc (m) = monthly crop growth coefficient (Table B-I-1).
The effective rainfall available for crop evapotranspiration is calculated as a function of the 1-in-10-year droughtrainfall as:
(7) Rt1 (m) = ( 0.70917 x (Rt (m) 0.82416 ) - 0.11556)
(8) Ul (m) = 10 (0.02426 x U(m))
(9) F1 = 0.531747 + ( 0.295154 x D ) – ( 0 .057697 x D 2 ) + ( 0.003804 x D 3 )
(10) Re (m) = Rt1 (m) x Ul (m) x F1
where:
Rt1 (m) = monthly effective rainfall factor considering 1-in-10 monthly rainfall,
Rt (m) = 1-in-10 monthly rainfall (Table B-I-2),
Ul (m) = monthly effective rainfall factor considering monthly evapotranspiration,
F1 = soil factor,
D = net depth of,application (see Figures B-I-1 through B-I-15), and

Re (m) = monthly effmonthly effective rainfall.
Calculation of Water Use Allocations
After the monthly evapotranspiration, U (m), and the monthly 1-in-10 effective rainfall, Re (m), have been determined,the monthly supplemental crop requirement, Sup (m), is calculated as:
(11) Sup (m) = U (m) - Re (m)
for each month of the year for each of the perennial crops specified in the Water Use Application Crop InformationTable (Table D), or each month during which a crop is planted for annual crops, as specified in Table D. The irrigationquantity needed to supply the supplemental crop requirement Sup (m) is determined by:
(12) Q (m) = Sup (m) x k a x A
where:
k a = allocation coefficient multiplier (BOR Section 2, Table 2-1) for the irrigation system specified in Table D
A = irrigated acreage for the crop.
The individual monthly supplemental irrigation requirements for each month for each of the crops specified in theTable D are summed to determine the annual allocation. The supplemental irrigation requirements for each of thecrops specified in Table D are summed by month, and the largest of the monthly sums is the maximum monthlyallocation.
Additional Information:
Additional detail on this method may be found in "Irrigation Water Requirements," Technical Release no. 21, USDA, Soil Conservation Service, Engineering Division, 1970.

2-in-10Archbold (No Data) Avon Park Belle Glade
Rain Temp Sun Rain2.17 63.46 7.42 1.882.71 64.71 7.08 1.872.60 68.12 8.37 2.892.89 72.82 8.67 3.084.43 77.45 9.44 4.468.74 80.76 9.37 9.488.31 81.93 9.56 7.867.54 82.37 9.16 8.187.23 80.81 8.32 8.763.88 75.64 8.03 5.351.65 68.67 7.30 2.021.74 64.25 7.29 1.70
71 0.86 44
1-in-10Archbold Avon Park Belle GladeRain 1-in-10 Temp Sun Rain 1-in-10 Temp Sun Rain 1-in-10
1.91 1.13 60.61 7.43 2.24 1.63 61.74 7.42 2.20 1.942.20 1.83 61.97 7.09 2.51 1.73 63.41 7.08 1.89 1.623.11 0.55 66.39 8.38 2.82 0.56 67.61 8.37 3.02 0.592.33 1.32 70.40 8.66 2.52 1.31 72.20 8.67 2.85 1.304.27 3.34 75.65 9.42 4.12 3.03 77.06 9.44 4.85 3.397.80 5.55 79.37 9.35 8.27 6.23 80.63 9.37 8.65 6.356.94 5.66 80.42 9.54 8.03 6.55 81.90 9.56 7.81 6.397.15 6.18 80.94 9.15 7.50 6.45 82.00 9.16 7.95 7.086.80 5.43 79.60 8.32 7.15 5.79 80.47 8.32 7.98 6.663.24 2.83 74.37 8.04 3.59 3.65 74.97 8.03 4.34 3.651.63 1.62 68.40 7.31 1.71 1.60 68.17 7.3 2.22 1.821.64 1.10 62.65 7.31 1.76 1.27 63.29 7.29 1.72 1.70
Mean Rainfall = Rain2-in-10 Year Rainfall = 2-in-101-in-10 Year Rainfall = 1-in-10Mean Temperature (F) = TempAnnual Daylight (%) = Sun

Big Cypress ClewistonTemp Sun Rain Temp Sun Rain Temp Sun63.17 7.46 1.69 62.74 7.48 1.31 63.45 7.4564.15 7.11 2.59 63.20 7.12 1.89 65.57 7.1066.92 8.38 1.83 67.07 8.38 1.94 69.40 8.3870.73 8.65 2.06 70.83 8.64 2.84 73.51 8.6674.72 9.40 5.53 75.12 9.38 4.59 77.18 9.4078.41 9.32 8.80 78.76 9.30 6.73 80.23 9.3380.10 9.52 7.63 81.63 9.50 6.51 81.72 9.5280.55 9.13 6.87 82.11 9.12 6.74 82.09 9.1379.55 8.32 7.63 80.11 8.32 7.97 81.21 8.3274.95 8.05 5.11 76.09 8.06 3.72 76.31 8.0468.55 7.33 1.69 69.50 7.35 1.02 69.77 7.3364.19 7.34 1.01 63.31 7.36 1.61 64.47 7.33
0.87 15 0.85 22 0.84
Big Cypress (No Data) ClewistonTemp Sun Rain 1-in-10 Temp Sun Rain 1-in-10 Temp Sun63.00 7.46 2.08 1.93 63.52 7.4563.83 7.11 1.98 2.46 65.00 7.167.55 8.38 2.37 0.43 69.10 8.3870.60 8.65 2.39 1.25 73.20 8.6675.29 9.4 4.27 3.22 77.29 9.478.93 9.32 7.20 5.56 80.43 9.3380.32 9.52 6.28 4.38 81.84 9.5280.68 9.13 6.38 5.13 82.00 9.1379.43 8.32 5.92 5.20 81.17 8.3274.94 8.05 3.46 2.66 76.58 8.0468.87 7.33 1.93 2.01 70.57 7.3364.32 7.34 1.67 1.41 65.26 7.33

Everglades Fellsmere Fort Drum (No Data)Rain Temp Sun Rain Temp Sun1.63 66.30 7.49 2.20 62.96 7.411.68 67.41 7.12 2.30 64.28 7.082.00 69.94 8.38 3.05 67.27 8.372.33 73.92 8.64 3.14 72.02 8.674.96 77.38 9.37 4.36 75.92 9.449.26 80.71 9.29 7.38 79.88 9.378.37 82.18 9.49 7.11 81.44 9.567.34 82.82 9.11 7.52 81.83 9.1610.14 81.94 8.32 9.13 80.23 8.324.42 77.88 8.06 6.76 75.38 8.031.40 71.82 7.36 2.21 68.53 7.291.34 67.10 7.37 1.86 63.83 7.29
43 0.86 55 0.86
Everglades Fellsmere (No Data) Fort DrumRain 1-in-10 Temp Sun Rain 1-in-10 Temp Sun Rain 1-in-10
1.69 1.38 65.10 7.49 2.05 1.101.63 1.52 66.03 7.12 2.72 2.600.95 0.09 69.39 8.38 3.39 0.702.26 0.98 73.17 8.64 2.16 1.124.41 2.83 76.94 9.37 4.67 2.709.75 7.07 80.30 9.29 7.52 6.708.21 6.93 81.77 9.49 7.46 5.707.79 6.93 82.00 9.11 6.80 6.209.07 7.85 81.50 8.32 6.48 5.004.12 3.13 77.29 8.06 3.92 3.201.46 1.18 71.23 7.36 1.79 2.101.45 1.09 66.74 7.37 1.78 1.50

Ft. Lauderdale Ft. MyersRain Temp Sun Rain Temp Sun2.54 67.74 7.49 1.90 64.32 7.462.26 68.11 7.12 2.16 65.36 7.112.62 70.44 8.38 2.21 68.62 8.383.93 74.27 8.64 2.37 73.07 8.655.78 77.40 9.37 3.90 77.34 9.408.15 80.24 9.29 9.09 80.60 9.326.11 81.76 9.49 8.47 81.99 9.526.72 82.33 9.11 8.00 82.41 9.138.56 81.34 8.32 8.13 81.15 8.329.54 77.84 8.06 3.88 76.26 8.053.40 72.59 7.36 1.37 69.44 7.332.51 68.71 7.37 1.51 65.50 7.34
54 0.87 98 0.86
Ft. Lauderdale Ft. MyersTemp Sun Rain 1-in-10 Temp Sun Rain 1-in-10 Temp Sun61.77 7.41 2.86 1.89 66.81 7.49 1.90 1.30 64.03 7.4662.90 7.08 2.52 2.35 67.62 7.12 2.00 1.70 65.10 7.1166.84 8.37 2.90 0.44 70.71 8.38 1.50 0.30 68.87 8.3870.77 8.67 4.12 1.62 74.27 8.64 1.90 0.70 73.13 8.6575.48 9.44 6.28 4.20 77.94 9.37 4.10 2.90 77.97 9.479.23 9.37 9.02 7.13 80.90 9.29 9.40 7.20 81.23 9.3281.00 9.56 6.39 5.32 82.00 9.49 8.70 6.80 82.53 9.5281.00 9.16 6.90 6.10 82.26 9.11 8.60 7.40 82.90 9.1379.63 8.32 8.21 6.86 81.37 8.32 8.40 8.00 81.60 8.3274.61 8.03 8.40 6.38 77.77 8.06 3.50 2.40 76.58 8.0568.57 7.29 3.96 3.06 72.63 7.36 1.50 1.20 69.83 7.3363.00 7.29 2.52 2.21 68.42 7.37 1.50 1.30 65.29 7.34

Ft. Pierce Hialeah HomesteadRain Temp Sun Rain Temp Sun Rain2.44 64.70 7.42 2.10 65.91 7.49 1.672.66 65.57 7.09 1.90 66.53 7.12 1.732.96 68.31 8.38 2.05 70.07 8.38 2.363.27 72.62 8.66 3.73 73.78 8.64 3.364.13 76.57 9.43 5.95 76.93 9.37 6.486.40 79.96 9.36 9.24 80.03 9.29 9.255.47 81.59 9.55 7.23 81.20 9.49 8.225.68 82.01 9.15 7.69 81.82 9.11 7.777.74 80.76 8.32 9.35 80.63 8.32 9.987.21 76.48 8.03 8.82 76.62 8.06 8.582.69 70.14 7.30 2.96 71.30 7.36 2.142.08 65.76 7.30 1.81 66.92 7.37 1.18
75 0.86 28 0.87 55
Ft. Pierce Hialeah HomesteadRain 1-in-10 Temp Sun Rain 1-in-10 Temp Sun Rain 1-in-10
2.48 1.91 63.29 7.42 2.28 1.46 66.42 7.49 1.72 1.372.77 1.96 64.31 7.09 2.11 1.65 67.55 7.12 1.86 1.553.23 0.77 67.94 8.38 2.70 0.38 71.03 8.38 2.29 0.353.08 1.55 72.00 8.66 3.70 1.82 74.30 8.64 3.18 0.934.29 2.90 76.42 9.43 6.37 3.94 77.97 9.37 6.73 4.455.98 4.33 79.77 9.36 9.31 6.02 80.80 9.29 9.39 6.345.66 5.29 81.00 9.55 7.07 6.34 82.00 9.49 7.95 7.285.82 4.90 81.35 9.15 8.25 7.09 82.16 9.11 8.27 7.218.03 6.55 80.30 8.32 8.98 7.79 81.30 8.32 10.27 9.146.72 6.22 75.97 8.03 7.39 6.57 77.39 8.06 7.18 6.442.95 2.24 69.80 7.3 3.52 2.17 72.20 7.36 2.15 1.692.07 1.88 64.94 7.3 1.85 1.37 67.77 7.37 1.35 1.28

Hypoluxo Immokalee (No Data)Temp Sun Rain Temp Sun65.80 7.52 2.89 67.72 7.4666.60 7.13 2.72 68.09 7.1169.36 8.39 3.18 69.94 8.3872.94 8.63 3.55 73.62 8.6576.20 9.35 4.96 76.88 9.4079.34 9.26 7.61 79.96 9.3280.45 9.47 5.46 81.41 9.5280.97 9.09 5.63 82.00 9.1380.15 8.31 8.39 81.22 8.3276.56 8.07 8.75 77.78 8.0570.68 7.38 3.25 72.51 7.3366.54 7.40 2.44 68.75 7.34
0.87 67 0.87
Hypoluxo ImmokaleeTemp Sun Rain 1-in-10 Temp Sun Rain 1-in-10 Temp Sun65.77 7.52 3.10 2.08 65.84 7.46 2.14 1.91 64.03 7.4867.45 7.13 2.73 2.17 66.69 7.11 2.26 1.54 65.24 7.1269.81 8.39 3.46 0.23 70.10 8.38 3.09 0.48 68.77 8.3872.50 8.63 3.45 2.00 73.63 8.65 2.23 0.68 71.87 8.6476.52 9.35 5.26 3.44 77.81 9.4 4.23 2.47 76.74 9.3880.03 9.26 8.29 5.96 80.77 9.32 8.61 7.46 80.10 9.3081.45 9.47 5.75 4.79 82.29 9.52 7.48 6.76 81.26 9.5082.00 9.09 6.57 5.51 82.55 9.13 7.35 6.49 81.74 9.1281.07 8.31 7.78 6.36 81.30 8.32 6.71 5.47 80.67 9.3277.45 8.07 7.73 7.50 77.45 8.05 2.90 1.64 76.00 8.0671.93 7.38 3.81 2.64 71.87 7.33 1.95 1.65 67.20 7.3567.29 7.4 2.61 2.00 67.35 7.34 1.51 1.22 65.45 7.36

Indiantown Jupiter KissimmeeRain Temp Sun Rain Temp Sun Rain2.23 63.97 7.44 3.66 67.99 7.44 2.353.08 65.41 7.10 2.49 67.77 7.10 2.843.14 68.26 8.38 3.26 70.38 8.38 3.114.11 72.13 8.66 2.82 74.09 8.66 2.703.94 75.99 9.41 4.89 76.25 9.41 3.989.70 78.88 9.34 6.37 79.86 9.34 7.326.38 80.10 9.53 5.79 81.05 9.53 7.527.08 81.39 9.14 6.26 82.15 9.14 6.887.25 80.53 8.32 8.63 81.61 8.32 6.445.47 75.33 8.04 10.37 78.14 8.04 3.921.96 69.36 7.32 3.18 71.57 7.32 1.951.49 64.15 7.32 2.38 69.29 7.32 2.17
13 0.86 32 0.87 62
Indiantown (No Data) Jupiter KissimmeeRain 1-in-10 Temp Sun Rain 1-in-10 Temp Sun Rain 1-in-10
3.41 2.85 64.84 7.44 2.12 1.852.94 2.44 65.69 7.1 2.67 2.364.27 0.65 69.26 8.38 3.31 0.363.07 1.10 72.97 8.66 2.49 1.655.55 4.02 76.97 9.41 3.90 2.597.59 5.50 80.17 9.34 6.97 5.845.41 4.43 81.68 9.53 7.46 6.136.78 5.44 82.06 9.14 6.76 6.108.44 7.09 81.20 8.32 6.49 4.508.42 8.38 76.90 8.04 3.27 2.983.61 2.08 71.10 7.32 1.96 1.412.47 1.75 66.61 7.32 2.08 1.63

La Belle Lake PlacidTemp Sun Rain Temp Sun Rain Temp Sun61.07 7.39 1.62 63.79 7.45 1.83 62.83 7.4362.42 7.06 2.26 65.08 7.10 2.45 64.95 7.0966.43 8.37 2.74 68.57 8.38 2.65 68.67 8.3871.47 8.68 2.94 72.74 8.66 3.25 72.91 8.6676.43 9.47 4.11 76.98 9.40 3.90 77.72 9.4280.22 9.40 9.06 80.15 9.33 8.22 80.69 9.3581.54 9.59 8.18 81.45 9.52 7.85 81.78 9.5481.87 9.18 7.54 81.80 9.13 6.88 82.30 9.1580.06 8.32 7.69 80.67 8.32 7.15 80.78 8.3274.28 8.01 3.86 75.56 8.04 3.90 75.26 8.0466.69 7.27 1.31 68.90 7.33 1.74 68.49 7.3161.87 7.26 1.35 64.30 7.33 1.41 63.72 7.31
0.85 40 0.86 36 0.85
La Belle Lake Placid (No Data)Temp Sun Rain 1-in-10 Temp Sun Rain 1-in-10 Temp Sun60.94 7.39 1.95 1.42 62.94 7.4562.38 7.06 2.11 1.75 64.62 7.166.65 8.37 2.02 0.49 68.23 8.3871.20 8.68 2.54 1.18 72.27 8.6676.19 9.47 4.57 3.48 77.10 9.480.30 9.4 9.38 7.35 80.33 9.3381.65 9.59 8.19 7.01 81.16 9.5281.84 9.18 7.85 7.30 81.77 9.1380.07 8.32 6.82 5.54 80.43 8.3274.77 8.01 3.80 2.87 75.42 8.0467.93 7.27 1.73 1.85 68.97 7.3362.48 7.26 1.72 1.90 64.65 7.33
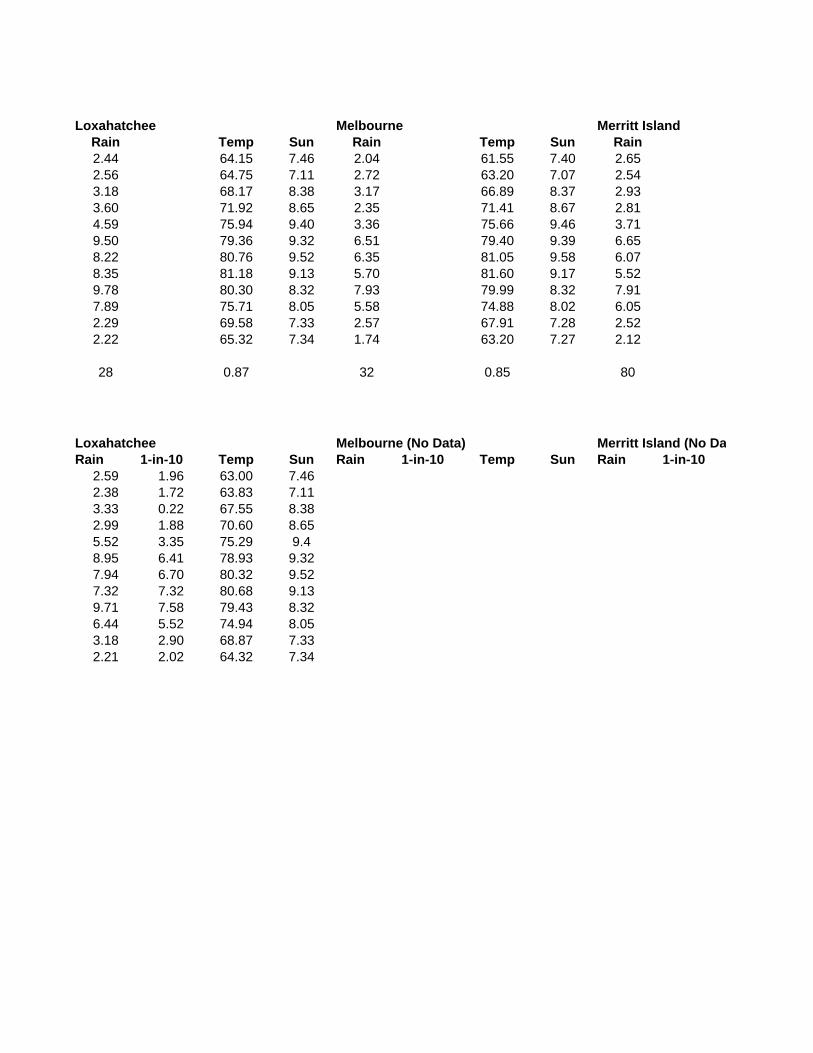
Loxahatchee Melbourne Merritt IslandRain Temp Sun Rain Temp Sun Rain2.44 64.15 7.46 2.04 61.55 7.40 2.652.56 64.75 7.11 2.72 63.20 7.07 2.543.18 68.17 8.38 3.17 66.89 8.37 2.933.60 71.92 8.65 2.35 71.41 8.67 2.814.59 75.94 9.40 3.36 75.66 9.46 3.719.50 79.36 9.32 6.51 79.40 9.39 6.658.22 80.76 9.52 6.35 81.05 9.58 6.078.35 81.18 9.13 5.70 81.60 9.17 5.529.78 80.30 8.32 7.93 79.99 8.32 7.917.89 75.71 8.05 5.58 74.88 8.02 6.052.29 69.58 7.33 2.57 67.91 7.28 2.522.22 65.32 7.34 1.74 63.20 7.27 2.12
28 0.87 32 0.85 80
Loxahatchee Melbourne (No Data) Merritt Island (No DaRain 1-in-10 Temp Sun Rain 1-in-10 Temp Sun Rain 1-in-10
2.59 1.96 63.00 7.462.38 1.72 63.83 7.113.33 0.22 67.55 8.382.99 1.88 70.60 8.655.52 3.35 75.29 9.48.95 6.41 78.93 9.327.94 6.70 80.32 9.527.32 7.32 80.68 9.139.71 7.58 79.43 8.326.44 5.52 74.94 8.053.18 2.90 68.87 7.332.21 2.02 64.32 7.34

Miami Moore HavenTemp Sun Rain Temp Sun Rain Temp Sun62.49 7.38 2.58 67.51 7.50 1.54 63.43 7.4463.68 7.06 2.14 67.94 7.13 1.90 64.59 7.1066.80 8.37 2.44 70.88 8.38 2.40 67.98 8.3871.51 8.68 3.42 73.89 8.63 2.87 72.17 8.6676.48 9.48 6.39 77.41 9.36 4.65 76.28 9.4180.03 9.41 6.85 80.28 9.28 8.11 79.67 9.3481.38 9.60 5.86 81.56 9.48 7.58 81.01 9.5381.77 9.18 6.27 82.16 9.13 6.87 81.59 9.1480.14 8.32 8.81 81.00 8.32 7.58 80.47 8.3275.30 8.01 8.86 77.54 8.07 4.24 76.00 8.0468.23 7.26 2.72 72.18 7.37 1.42 69.13 7.3263.55 7.25 2.01 68.77 7.38 1.23 64.63 7.32
0.85 77 0.87 51 0.85
ata) Miami Moore HavenTemp Sun Rain 1-in-10 Temp Sun Rain 1-in-10 Temp Sun
2.02 1.38 67.35 7.5 1.82 1.44 62.71 7.442.06 2.15 68.48 7.13 2.04 1.77 63.86 7.12.08 0.32 71.65 8.38 1.90 0.49 67.81 8.383.13 1.27 75.13 8.63 2.38 1.13 71.87 8.666.35 3.56 78.74 9.36 4.33 2.92 76.48 9.417.84 4.43 81.23 9.28 7.57 5.53 80.00 9.345.44 4.54 82.68 9.48 7.04 5.54 81.32 9.536.29 5.30 82.84 9.13 6.73 6.11 81.71 9.148.30 6.91 81.67 8.32 6.97 5.98 80.50 8.328.38 6.70 78.10 8.07 3.47 2.40 75.61 8.042.80 2.11 73.13 7.37 1.73 1.60 69.00 7.322.05 1.61 68.87 7.38 1.62 1.32 64.26 7.32

Naples Okeechobee OrlandoRain Temp Sun Rain Temp Sun Rain1.81 65.56 7.49 1.75 62.69 7.43 2.302.02 66.58 7.12 2.00 64.18 7.09 2.432.11 69.81 8.38 3.05 67.49 8.38 2.812.15 73.74 8.64 3.09 71.74 8.66 2.993.93 77.41 9.37 4.15 75.98 9.42 4.218.50 80.82 9.29 7.39 79.46 9.35 6.618.35 82.34 9.49 6.84 80.99 9.54 7.858.25 82.91 9.11 6.22 81.52 9.15 7.049.51 81.97 8.32 7.25 80.34 8.32 7.134.45 77.00 8.06 4.81 75.69 8.04 4.621.36 71.26 7.36 1.46 68.82 7.31 1.721.29 66.52 7.37 1.40 63.77 7.31 2.33
27 0.86 48 0.85 56
Naples Okeechobee OrlandoRain 1-in-10 Temp Sun Rain 1-in-10 Temp Sun Rain 1-in-10
1.88 1.48 64.97 7.49 1.76 0.96 62.03 7.43 2.30 1.861.93 1.59 65.93 7.12 2.19 1.68 63.93 7.09 2.60 2.150.96 0.06 69.39 8.38 2.89 0.24 67.84 8.38 3.45 0.812.05 0.68 73.00 8.64 2.78 1.51 72.13 8.66 2.75 1.754.42 2.96 77.26 9.37 4.29 2.72 76.81 9.42 4.10 2.888.17 5.63 80.57 9.29 7.35 6.15 80.17 9.35 7.30 6.188.36 6.77 81.87 9.49 6.55 5.90 81.61 9.54 7.80 6.788.18 7.25 82.00 9.11 6.65 5.65 81.71 9.15 6.95 6.358.69 7.53 81.53 8.32 6.37 5.03 80.47 8.32 6.99 5.514.09 3.56 77.03 8.06 4.10 3.24 75.35 8.04 3.55 3.311.56 1.18 71.20 7.36 1.91 1.35 69.13 7.31 1.89 1.731.32 0.95 66.55 7.37 1.58 1.37 63.65 7.31 2.22 2.06

Pompano Beach Punta Gorda (No Data)Temp Sun Rain Temp Sun61.27 7.38 2.41 67.10 7.4863.12 7.06 2.34 67.46 7.1266.80 8.37 2.38 70.70 8.3871.50 8.68 3.65 74.19 8.6476.75 9.48 5.08 77.02 9.3880.68 9.41 7.93 79.95 9.3082.04 9.60 6.74 81.43 9.5082.31 9.18 7.07 81.82 9.1280.40 8.32 9.06 81.00 8.3274.34 8.01 10.46 77.20 8.0666.65 7.26 2.75 72.24 7.3561.87 7.25 2.49 68.08 7.36
0.85 28 0.87
Pompano Beach Punta GordaTemp Sun Rain 1-in-10 Temp Sun Rain 1-in-10 Temp Sun59.45 7.38 2.94 1.77 66.90 7.48 2.41 2.22 62.55 7.4362.28 7.06 3.60 2.40 67.55 7.12 2.34 1.72 63.72 7.0966.94 8.37 5.98 0.40 70.77 8.38 2.35 0.73 67.97 8.3871.13 8.68 7.75 1.46 74.30 8.64 1.85 0.94 72.27 8.6677.03 9.48 6.41 3.71 77.68 9.38 4.03 2.89 77.35 9.4281.17 9.41 6.73 5.13 80.53 9.3 8.90 7.14 81.00 9.3582.23 9.6 7.99 5.65 82.03 9.5 7.52 6.25 82.19 9.5482.39 9.18 7.71 6.60 82.42 9.12 7.55 6.87 82.19 9.1580.83 8.32 3.60 6.98 81.10 8.32 6.48 5.82 81.03 8.3274.77 8.01 2.30 5.57 77.39 8.06 3.19 2.62 75.90 8.0468.17 7.26 2.71 3.40 72.40 7.35 1.77 1.21 69.13 7.3162.19 7.25 2.14 1.90 68.03 7.36 1.84 1.58 64.35 7.31

Stuart S-65 (No Data) S 140 W (No Data)Rain Temp Sun2.34 65.49 7.442.46 66.35 7.102.98 69.87 8.383.15 73.80 8.664.48 77.34 9.427.09 80.82 9.356.49 82.16 9.545.97 82.58 9.148.65 81.35 8.328.06 77.25 8.042.31 71.52 7.322.24 66.82 7.31
34 0.85
Stuart S-65 S 140 WRain 1-in-10 Temp Sun Rain 1-in-10 Temp Sun Rain 1-in-10
2.40 1.90 64.84 7.44 2.18 2.18 61.03 7.41 2.03 1.122.72 1.90 65.69 7.1 2.91 2.91 62.72 7.08 1.67 0.823.57 0.60 69.26 8.38 3.05 3.05 67.00 8.37 2.36 0.022.76 1.20 72.97 8.66 2.20 2.20 71.60 8.67 2.33 1.644.95 3.20 76.97 9.42 4.39 4.39 76.77 9.44 4.27 2.486.58 5.50 80.17 9.35 7.90 7.90 80.23 9.37 8.38 5.186.53 5.60 81.68 9.54 7.70 7.70 81.16 9.56 5.72 4.705.71 4.40 82.06 9.14 6.58 6.58 81.48 9.16 6.71 6.908.05 7.20 81.20 8.32 6.30 6.30 79.97 8.32 5.48 5.326.69 6.10 76.90 8.04 3.30 3.30 74.10 8.03 2.47 1.732.83 2.00 71.10 7.32 2.14 2.14 67.17 7.29 1.93 1.072.56 2.20 66.61 7.31 1.84 1.84 62.16 7.29 1.38 0.89

Tamiami 4 TitusvilleRain Temp Sun Rain Temp Sun1.44 67.12 7.50 2.14 61.26 7.371.46 68.75 7.12 2.39 62.90 7.061.89 70.82 8.38 3.15 65.92 8.372.67 73.29 8.64 2.97 71.06 8.686.21 76.93 9.36 4.08 76.10 9.488.95 80.56 9.28 7.38 80.06 9.428.37 82.41 9.48 8.06 81.58 9.607.81 83.19 9.13 7.28 81.82 9.189.66 82.56 8.32 8.56 80.15 8.336.09 78.67 8.06 6.41 74.81 8.011.51 72.95 7.37 2.18 67.21 7.261.05 68.13 7.38 2.40 62.22 7.24
26 0.86 43 0.86
Tamiami 4 Titusville (No Data)Temp Sun Rain 1-in-10 Temp Sun Rain 1-in-10 Temp Sun66.71 7.50 1.67 1.77 66.94 7.568.34 7.12 1.56 1.57 67.72 7.1270.45 8.38 1.99 0.29 70.65 8.3873.73 8.64 2.73 1.49 73.53 8.6478.16 9.36 5.44 3.76 77.48 9.3682.07 9.28 9.35 6.19 80.93 9.2883.90 9.48 8.06 7.55 82.77 9.4884.00 9.13 7.26 7.73 83.06 9.1383.37 8.32 8.20 6.33 82.23 8.3279.23 8.06 4.72 2.79 78.55 8.0674.00 7.37 2.02 1.58 73.00 7.3768.65 7.38 1.19 1.05 68.23 7.38

Vero Beach West Palm BeachRain Temp Sun Rain Temp Sun2.05 63.05 7.41 2.42 66.33 7.472.45 64.63 7.08 2.54 66.88 7.113.58 68.06 8.37 2.84 70.19 8.383.07 72.16 8.67 3.64 74.22 8.653.37 76.47 9.44 5.13 77.70 9.394.88 79.85 9.37 7.81 80.62 9.325.69 81.33 9.56 6.67 82.47 9.516.04 81.68 9.16 6.85 82.78 9.128.97 80.47 8.32 9.53 81.72 8.326.87 75.66 8.03 8.70 77.71 8.052.54 69.13 7.29 2.56 71.98 7.341.72 64.11 7.29 2.31 67.63 7.34
23 0.85 29 0.87
Vero Beach (No Data) West Palm BeachRain 1-in-10 Temp Sun Rain 1-in-10 Temp Sun
2.77 2.42 65.84 7.472.54 2.25 66.69 7.113.38 0.84 70.10 8.383.52 1.34 73.63 8.655.65 3.07 77.81 9.397.97 5.93 80.77 9.326.32 5.00 82.29 9.516.73 6.42 82.55 9.128.81 7.06 81.30 8.326.86 6.34 77.45 8.053.90 2.64 71.87 7.342.52 2.59 67.35 7.34

Perennialsa 5 10 11 12 13 14 15 18 20
b
Nur
sery
Suga
rcan
e
Alfa
lfa
Avo
cado
Citr
us
Gra
pes
Turf
Gra
ss
Blu
eber
ries
Past
ure
a 0.49 0.39 0.63 0.27 0.63 0.20 0.49 0.63 0.46b 0.57 0.30 0.73 0.42 0.66 0.24 0.57 0.66 0.60c 0.73 0.53 0.86 0.58 0.68 0.38 0.73 0.68 0.63d 0.85 0.61 0.99 0.70 0.70 0.60 0.85 0.70 0.68e 0.90 0.70 1.08 0.78 0.71 0.71 0.90 0.71 0.70f 0.92 0.79 1.13 0.81 0.71 0.80 0.92 0.71 0.53g 0.92 0.79 1.11 0.77 0.71 0.80 0.92 0.71 0.56h 0.91 0.84 1.06 0.71 0.71 0.76 0.91 0.71 0.58I 0.87 0.73 0.99 0.63 0.70 0.61 0.87 0.70 0.52j 0.79 0.88 0.91 0.54 0.68 0.50 0.79 0.68 0.53k 0.67 0.72 0.78 0.43 0.67 0.35 0.67 0.67 0.49l 0.55 0.69 0.64 0.30 0.64 0.23 0.55 0.64 0.44
Annualsa 51 52 53 54 55 56 57 58 59
b
Dry
Bea
ns
Gre
en B
ean
Gra
in C
orn
Sila
ge C
orn
Swee
t Cor
n
Mel
ons
Peas
Pota
to
Soyb
eans
a 0.54 0.53 0.46 0.45 0.47 0.45 0.54 0.36 0.22b 0.59 0.55 0.50 0.47 0.50 0.48 0.59 0.41 0.26c 0.65 0.58 0.53 0.50 0.54 0.52 0.65 0.45 0.30d 0.72 0.61 0.58 0.54 0.58 0.56 0.72 0.51 0.33e 0.81 0.64 0.64 0.59 0.64 0.61 0.80 0.59 0.37f 0.90 0.68 0.71 0.64 0.72 0.66 0.88 0.72 0.41g 0.96 0.73 0.82 0.71 0.82 0.71 0.97 0.85 0.48h 1.03 0.79 0.92 0.80 0.91 0.75 1.03 0.97 0.55I 1.08 0.84 1.00 0.90 0.99 0.80 1.07 1.08 0.63j 1.11 0.89 1.05 0.98 1.05 0.82 1.11 1.17 0.72k 1.12 0.94 1.07 1.03 1.07 0.82 1.12 1.25 0.84l 1.11 0.98 1.08 1.06 1.08 0.80 1.12 1.31 0.92m 1.08 1.02 1.07 1.07 1.08 0.79 1.11 1.35 0.98n 1.03 1.05 1.06 1.08 1.07 0.77 1.10 1.37 1.02o 0.96 1.08 1.03 1.07 1.07 0.76 1.08 1.37 1.02p 0.90 1.10 1.00 1.06 1.06 0.75 1.06 1.36 0.93q 0.83 1.11 0.97 1.04 1.05 0.73 1.04 1.34 0.83r 0.75 1.12 0.93 1.02 1.03 0.71 1.01 1.30 0.77s 0.67 1.12 0.89 1.00 1.02 0.69 0.97 1.27 0.72t 0.60 1.11 0.85 0.96 1.00 0.67 0.96 1.23 0.68
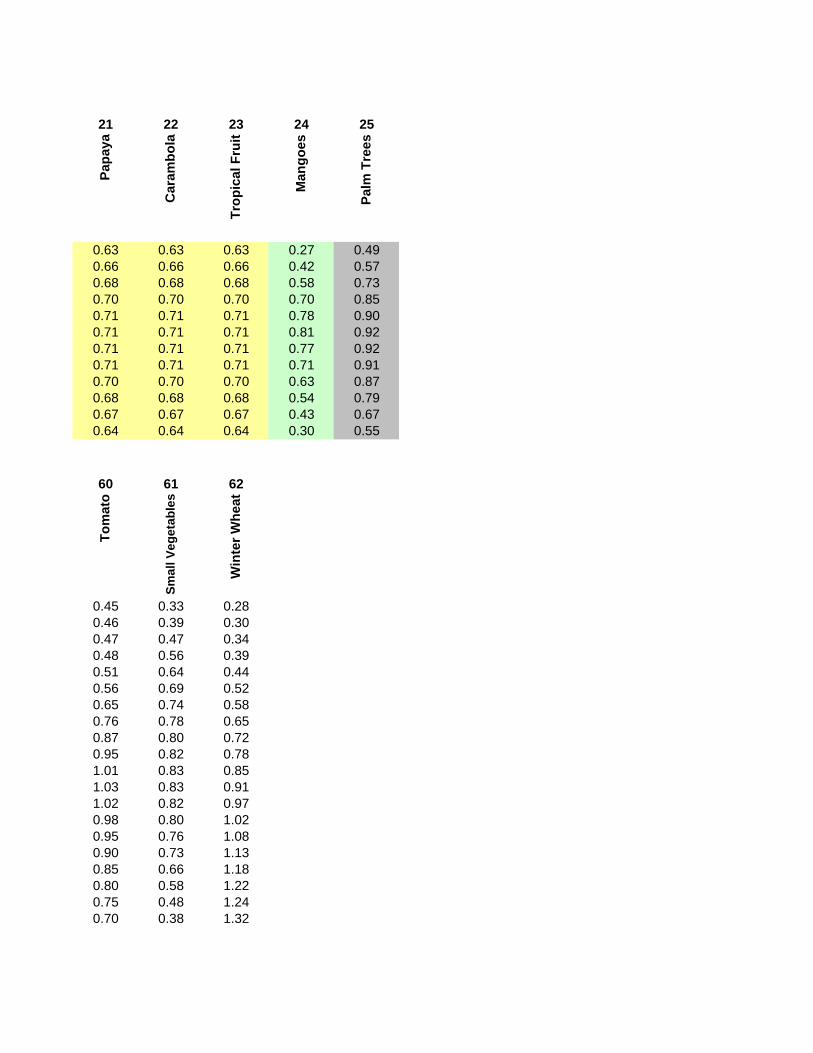
21 22 23 24 25Pa
paya
Car
ambo
la
Trop
ical
Fru
it
Man
goes
Palm
Tre
es
0.63 0.63 0.63 0.27 0.490.66 0.66 0.66 0.42 0.570.68 0.68 0.68 0.58 0.730.70 0.70 0.70 0.70 0.850.71 0.71 0.71 0.78 0.900.71 0.71 0.71 0.81 0.920.71 0.71 0.71 0.77 0.920.71 0.71 0.71 0.71 0.910.70 0.70 0.70 0.63 0.870.68 0.68 0.68 0.54 0.790.67 0.67 0.67 0.43 0.670.64 0.64 0.64 0.30 0.55
60 61 62
Tom
ato
Smal
l Veg
etab
les
Win
ter W
heat
0.45 0.33 0.280.46 0.39 0.300.47 0.47 0.340.48 0.56 0.390.51 0.64 0.440.56 0.69 0.520.65 0.74 0.580.76 0.78 0.650.87 0.80 0.720.95 0.82 0.781.01 0.83 0.851.03 0.83 0.911.02 0.82 0.970.98 0.80 1.020.95 0.76 1.080.90 0.73 1.130.85 0.66 1.180.80 0.58 1.220.75 0.48 1.240.70 0.38 1.32

2-in-101-in-10
Maximum Monthly Supplemental Crop Water Use: 0.00 MG0.00 inches/acre
0.000.000.000.000.000.000.000.000.000.000.000.00
2-in-10Jan Feb Mar Apr May Jun Jul Aug Sep Oct Nov Dec Total 2.268 7.594
Average Rainfall (inches) 1.31 1.89 1.94 2.84 4.59 6.73 6.51 6.74 7.97 3.72 1.02 1.61 46.87 11.00 7.594Evapotranspiration (inches) 2.70 4.12 4.18 4.45 8.00 6.51 0.00 0.00 0.00 0.00 0.00 0.00 29.96 7.594Average Effective Rainfall (inches) 0.66 1.00 1.03 1.47 2.72 3.48 2.35 2.42 2.79 1.45 0.44 0.68 20.49 7.5942-in-10 Effective Rainfall (inches) 0.55 0.84 0.86 1.23 2.29 2.92 1.97 2.03 2.34 1.22 0.37 0.58 17.20 7.594Average Irrigation (inches) 2.04 3.12 3.15 2.98 5.28 3.03 0.00 0.00 0.00 0.00 0.00 0.00 19.60 7.5942-in-10 Irrigation (inches) 2.15 3.28 3.32 3.22 5.71 3.59 0.00 0.00 0.00 0.00 0.00 0.00 21.27 7.594
7.5942-in-10 Rainfall (inches) 1.1 1.59 1.63 2.39 3.86 5.65 5.47 5.66 6.69 3.12 0.86 1.35 7.594
7.5947.5947.594
1-in-10Jan Feb Mar Apr May Jun Jul Aug Sep Oct Nov Dec Total 2.395 8.019
Average Rainfall (inches) 2.08 1.98 2.37 2.39 4.27 7.20 6.28 6.38 5.92 3.46 1.93 1.67 45.93 11.00 8.019Evapotranspiration (inches) 2.71 4.04 4.13 4.41 8.03 6.55 0.00 0.00 0.00 0.00 0.00 0.00 29.87 8.019Average Effective Rainfall (inches) 1.01 1.04 1.23 1.25 2.56 3.69 2.28 2.31 2.17 1.36 0.81 0.71 20.42 8.0191-in-10 Effective Rainfall (inches) 0.94 1.26 0.22 0.69 2.00 2.96 1.67 1.92 1.94 1.08 0.84 0.61 16.13 8.019Average Irrigation (inches) 1.70 3.00 2.90 3.16 5.47 2.86 0.00 0.00 0.00 0.00 0.00 0.00 19.09 8.0191-in-10 Irrigation (inches) 1.77 2.78 3.91 3.72 6.03 3.59 0.00 0.00 0.00 0.00 0.00 0.00 21.80 8.019
8.0191-in-10 Rainfall (inches) 1.93 2.46 0.43 1.25 3.22 5.56 4.38 5.13 5.2 2.66 2.01 1.41 8.019
8.0198.0198.019
Update 2-in-10 and 1-in-10 Graph
Graphical Presentation
1.44 1.40
3.91
4.69 4.89 4.995.35
4.67
2.95
1.952.37
1.66
0.001.002.003.004.005.006.007.008.009.00
Jan Feb Mar Apr May Jun Jul Aug Sep Oct Nov Dec
Monthly Values
Inch
es
Average Rainfall(inches)
Evapotranspiration(inches)
Average EffectiveRainfall (inches)
1-in-10 EffectiveRainfall (inches)
1-in-10 Irrigation(inches)
Max Month Alloc.(inches/acre)
Graphical Presentation of 2-in-10 and 1-in-10
2.15
3.28 3.32 3.22
5.71
3.59
0.00 0.00 0.00 0.00 0.00 0.001.77
2.78
3.91 3.72
6.03
3.59
0.00 0.00 0.00 0.00 0.00 0.000123456789
Jan Feb Mar Apr May Jun Jul Aug Sep Oct Nov Dec
Monthly Values
Inch
es
2-in-10 Rainfall(inches)1-in-10 Rainfall(inches)Evapotranspiration(inches) 2-in-10Evapotranspiration(inches) 1-in-102-in-10 Irrigation(inches)1-in-10 Irrigation(inches)2-in-10 Max MonthAlloc (inches/acre)""1-in-10 Max MonthAlloc (inches/acre)"
g:\aproject\sdfsdfsdfsdfdsf

sdfg
sd
0.00
1.00
2.00
3.00
4.00
5.00
6.00
7.00
8.00
9.00
02
46
810
1214
sdfg
sdfg
sdfgsdfg
Ser
ies1
Ser
ies2
Ser
ies3
Ser
ies4
Ser
ies5
Ser
ies6

2-in-10With SWM Without SWM
01 1 Micro-spinkler 1.18 1.18
02 2 Overhead Drip 1.18 1.18
03 13 Seepage/Furrow 2.50 1.67
04 14 Semi-Closed Flow-Through 2.50 1.67
05 15 Crown Flooding 2.50 1.67
06 16 Sub-irrigation 2.50 1.67
07 7 Sprinkler 1.33 1.25
08 8 Portable Gun 1.54 1.43
09 9 Traveling Gun 1.43 1.33
10 10 Overhead 1.33 1.25
11 3 Nursery Container 5.00 2.86
12 4 Low Volume 1.18 1.18
13 5 Drip 1.18 1.18
14 17 Surface Gravity 2.50 1.67
18 18 Flood/Seepage 2.50 1.67
90 6 Container 5.00 2.86
92 11 Volume Gun 1.43 1.33
93 12 Walking Gun 1.43 1.33
94 Low Volume/Canal Eff 0.50 0.50
95 Flood/Canal Eff 0.50 0.50
1-in-10With SWM Without SWM
01 1 Micro-spinkler 1.18 1.18
02 2 Overhead Drip 1.18 1.18
03 13 Seepage/Furrow 2.00 2.00
04 14 Semi-Closed Flow-Through 2.00 2.00
05 15 Crown Flooding 2.00 2.00
06 16 Sub-irrigation 2.00 2.00
07 7 Sprinkler 1.33 1.33
08 8 Portable Gun 1.43 1.43
09 9 Traveling Gun 1.33 1.33
10 10 Overhead 1.33 1.25
11 3 Nursery Container 2.86 2.86
12 4 Low Volume 1.18 1.18
13 5 Drip 1.18 1.18
14 17 Surface Gravity 2.00 2.00
18 18 Flood/Seepage 2.00 2.00
90 6 Container 2.86 2.86
92 11 Volume Gun 1.33 1.33
93 12 Walking Gun 1.33 1.33
94 Low Volume/Canal Eff 0.50 0.50
95 Flood/Canal Eff 0.50 0.50