module 2 – operations strategycsbapp.uncw.edu/janickit/ops370/modules/module2.pdf · often limit...
TRANSCRIPT

MODULE 2 – OPERATIONS STRATEGY
July 14, 2014 - 2
OVERVIEW – MODULE 2
Business (corporate strategy)
Operations strategy
Competitiveness
Productivity
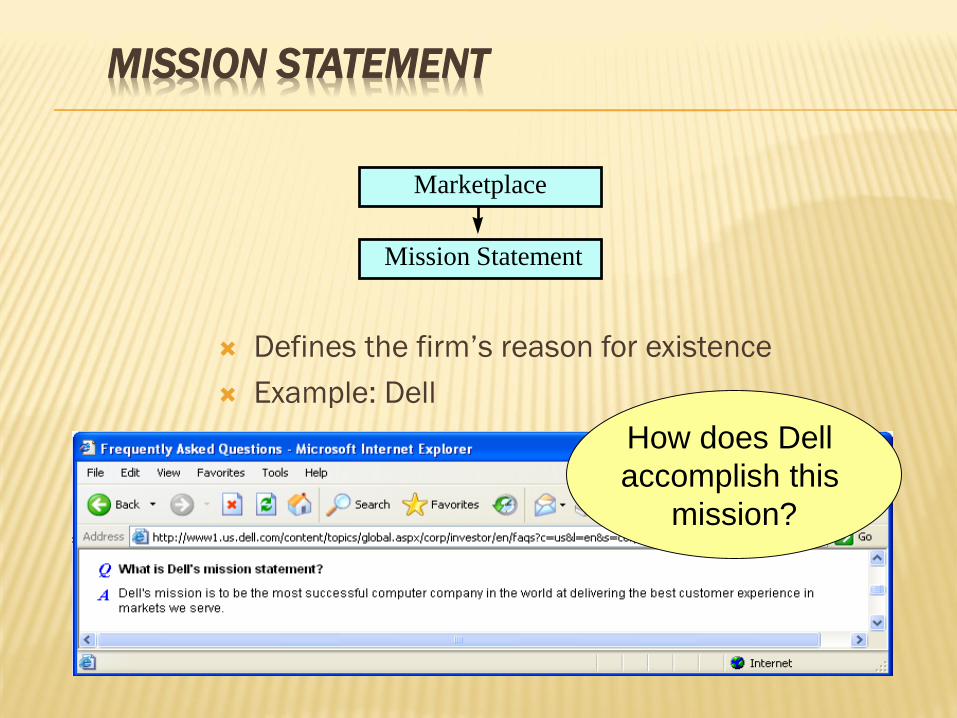
Defines the firm’s reason for existence
Example: Dell
Mission Statement
MISSION STATEMENT
Marketplace
How does Dell
accomplish this
mission?
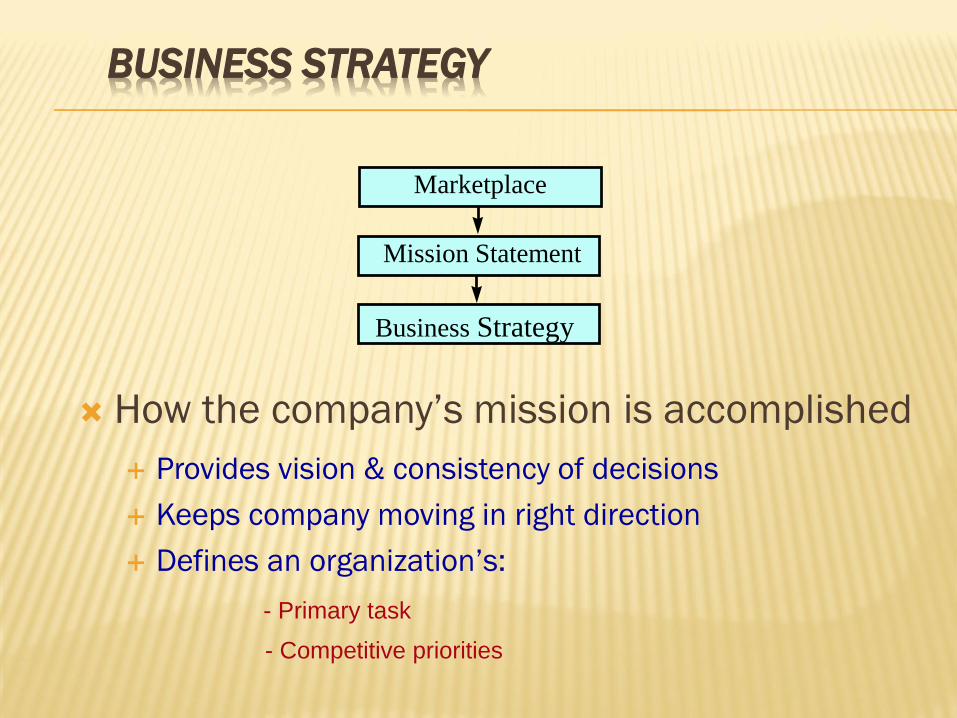
Business Strategy
How the company’s mission is accomplished
Provides vision & consistency of decisions
Keeps company moving in right direction
Defines an organization’s:
BUSINESS STRATEGY
Mission Statement
- Primary task
- Competitive priorities
Marketplace

BUSINESS STRATEGY
Provides The “How”
1. Primary Task of Organization
2. Competitive Priorities
Operations Strategy How to Best Utilize Resources to Support Business Strategy
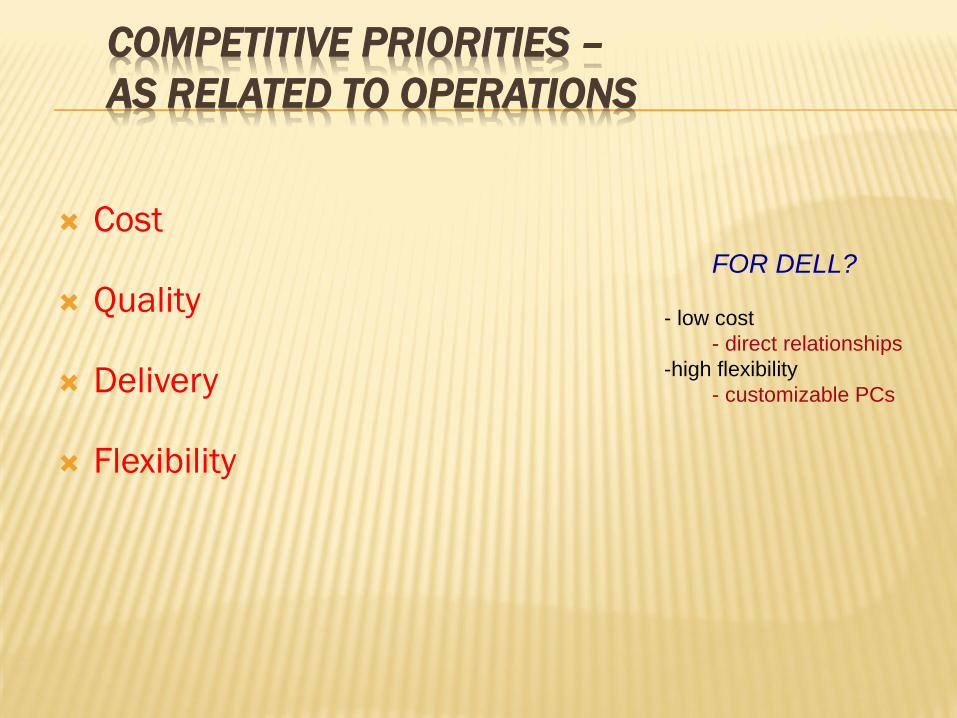
Cost
Quality
Delivery
Flexibility
COMPETITIVE PRIORITIES –
AS RELATED TO OPERATIONS
FOR DELL?
- low cost
- direct relationships
-high flexibility
- customizable PCs
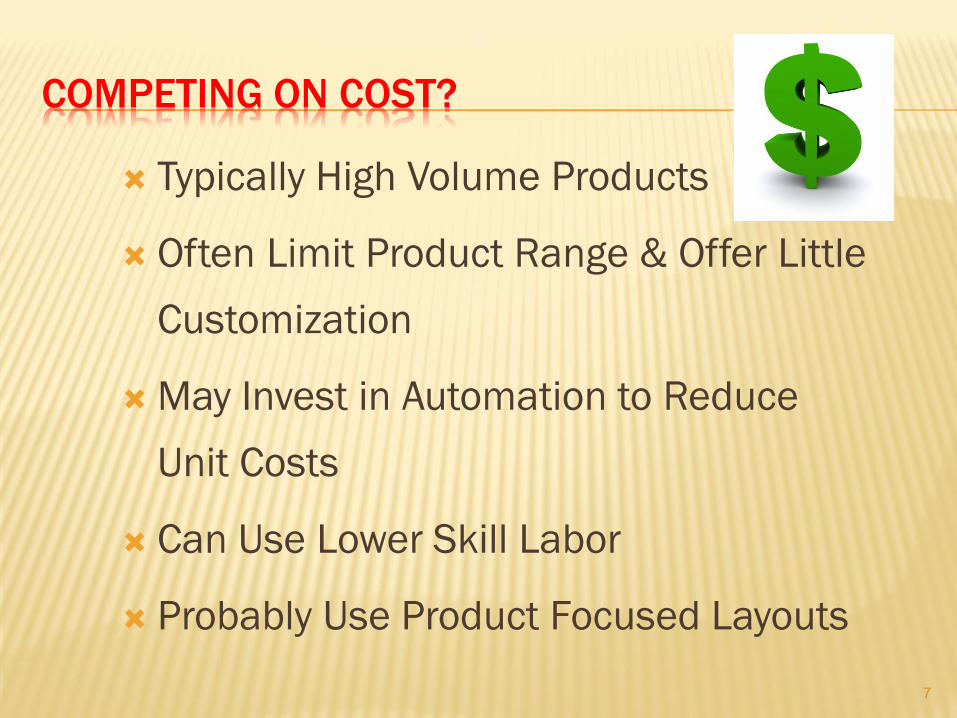
COMPETING ON COST?
Typically High Volume Products
Often Limit Product Range & Offer Little
Customization
May Invest in Automation to Reduce
Unit Costs
Can Use Lower Skill Labor
Probably Use Product Focused Layouts
7

COMPETING ON QUALITY?
High Performance Design:
Superior features, high durability, & excellent customer service
Product & Service Consistency:
Meets design specifications
Close tolerances
Error free delivery
8

COMPETING ON TIME?
Fast Delivery Focused on shorter time
between order placement and delivery
On-time DeliveryDeliver product exactly when needed every time
Rapid Development Speed Using concurrent processes to shorten product
development time
9
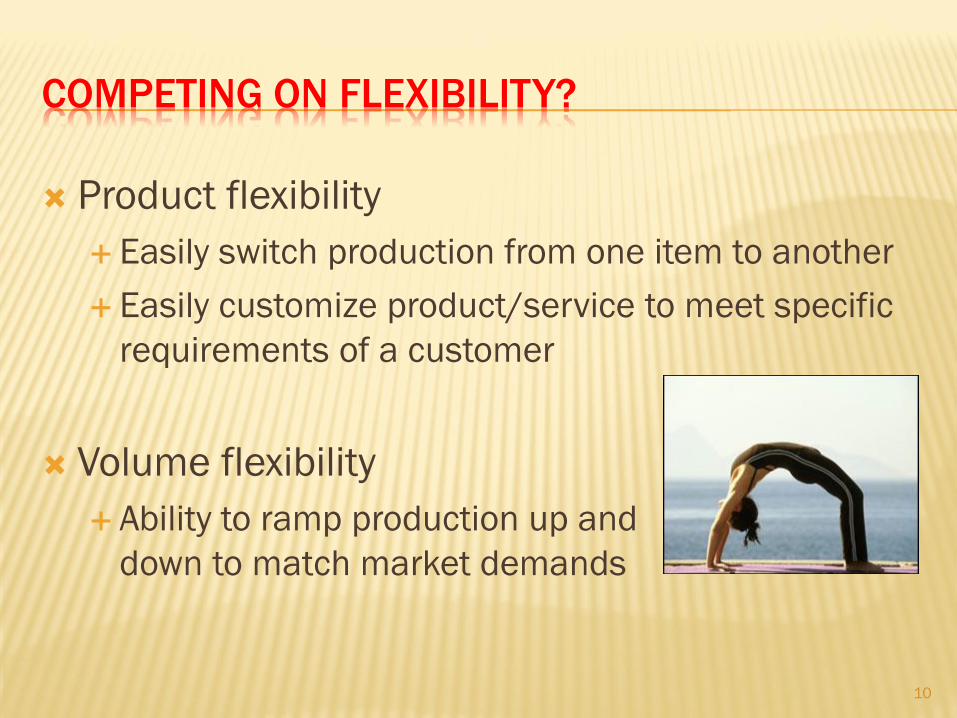
COMPETING ON FLEXIBILITY?
Product flexibility
Easily switch production from one item to another
Easily customize product/service to meet specific
requirements of a customer
Volume flexibility
Ability to ramp production up and
down to match market demands
10

FLOWCHARTS FOR PROCESS CHOICE
PRODUCT-PROCESS MATRIX
Product-process matrix: matches product characteristics with the appropriate choice of production process
There is a tradeoff between high-volume standardized products that get produced for a low per-unit cost and low-volume customized products that have a high per-unit cost.
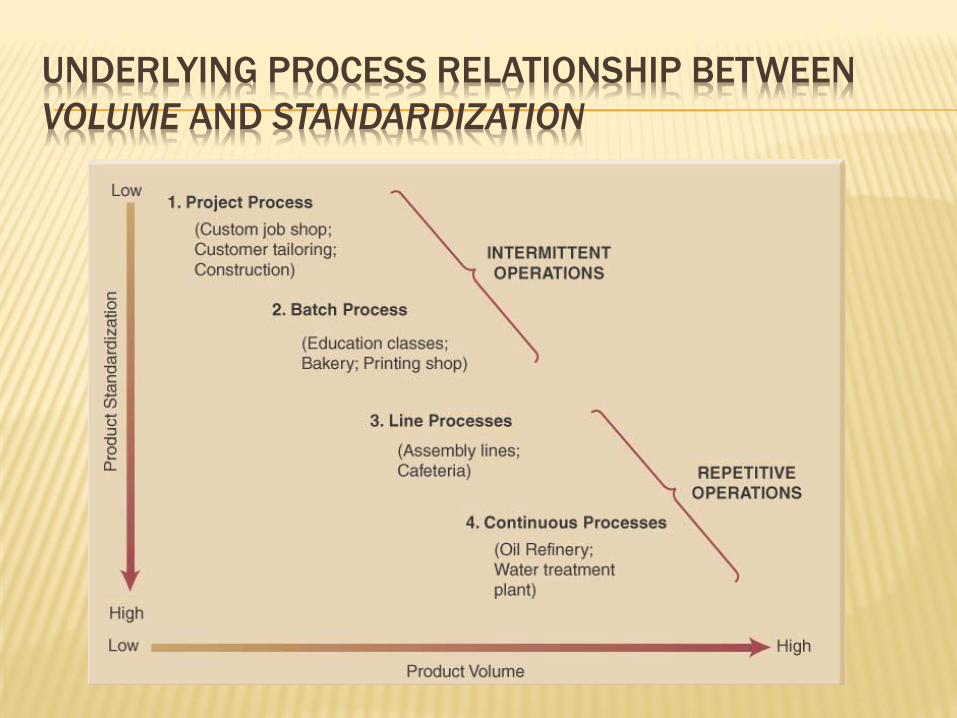
UNDERLYING PROCESS RELATIONSHIP BETWEEN
VOLUME AND STANDARDIZATION
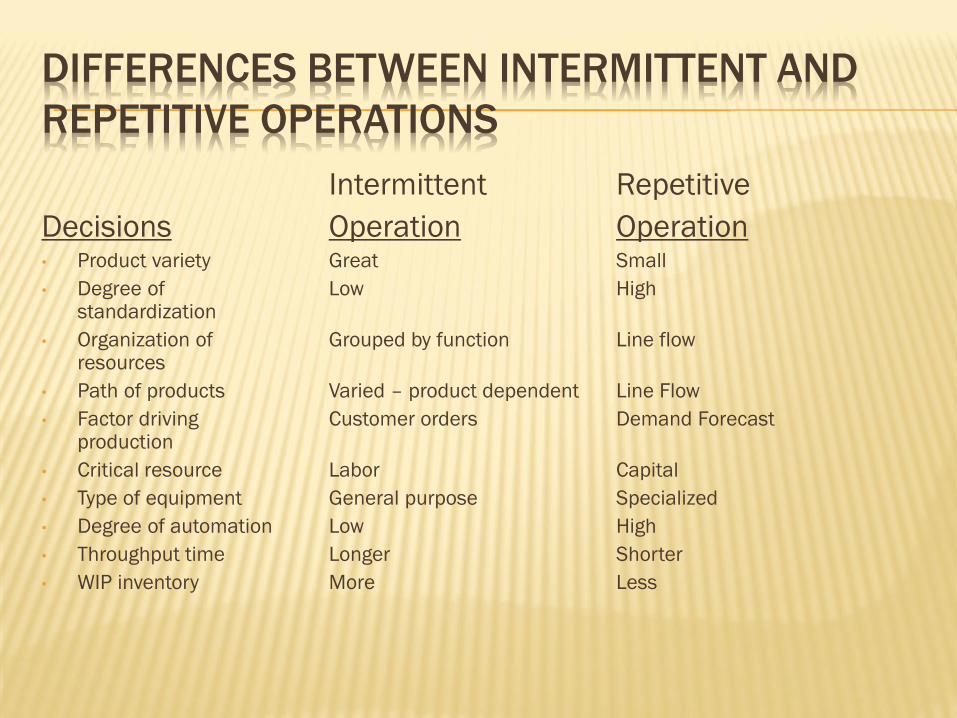
DIFFERENCES BETWEEN INTERMITTENT AND
REPETITIVE OPERATIONS
Intermittent Repetitive
Decisions Operation Operation• Product variety Great Small
• Degree of Low High standardization
• Organization of Grouped by function Line flow resources
• Path of products Varied – product dependent Line Flow
• Factor driving Customer orders Demand Forecastproduction
• Critical resource Labor Capital
• Type of equipment General purpose Specialized
• Degree of automation Low High
• Throughput time Longer Shorter
• WIP inventory More Less

PROJECTS
• Project process: a type of process that has a high degree of customization, a large scope, a high degree of customer involvement, and the use of primarily generalized tools and equipment
• A critical characteristic of projects is the requirement for close coordination among the various people and organizations involved with the project.
– The 2008 Summer Olympics held in Beijing involved over 10,000 athletes, 37 competition venues, and over 70,000 volunteers.

BATCH PROCESSES
Batch process: a higher-volume job shop, in
which the same or similar products are
produced repetitively
Examples: commercial printers that produce
brochures or advertisements, production of
clothing by size/style, micro breweries
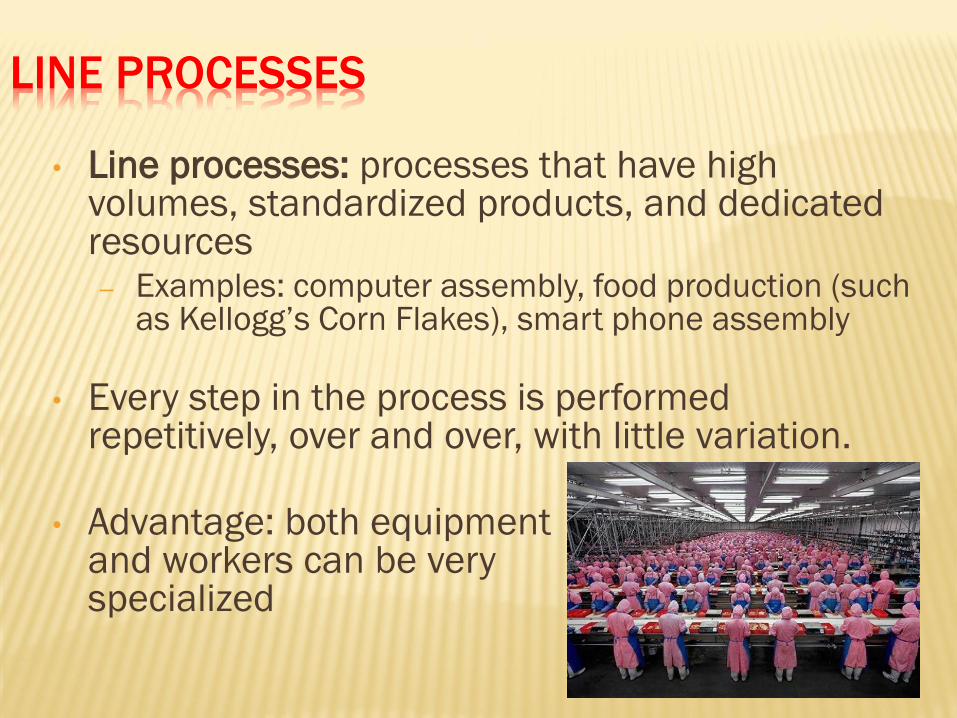
LINE PROCESSES
• Line processes: processes that have high volumes, standardized products, and dedicated resources– Examples: computer assembly, food production (such
as Kellogg’s Corn Flakes), smart phone assembly
• Every step in the process is performed repetitively, over and over, with little variation.
• Advantage: both equipmentand workers can be very specialized

CONTINUOUS PROCESSES
• Continuous processes: processes that have high volume and low flexibility, and that work with nondiscrete items that are not divided into their final packages until the very end of production
– Examples: soda production, chemical production, brewing beer, and sugar and paint production
• Extremely capital intensive, very standardized, and very inflexible
• May be costly to stop to process

SERVICE-PROCESS MATRIX
Customer involvement:
the degree to which customers are involved inshaping the end service/products that they receive
Labor intensity:
the amount of labor needed to provide a service relative to the total amount of physical resources needed
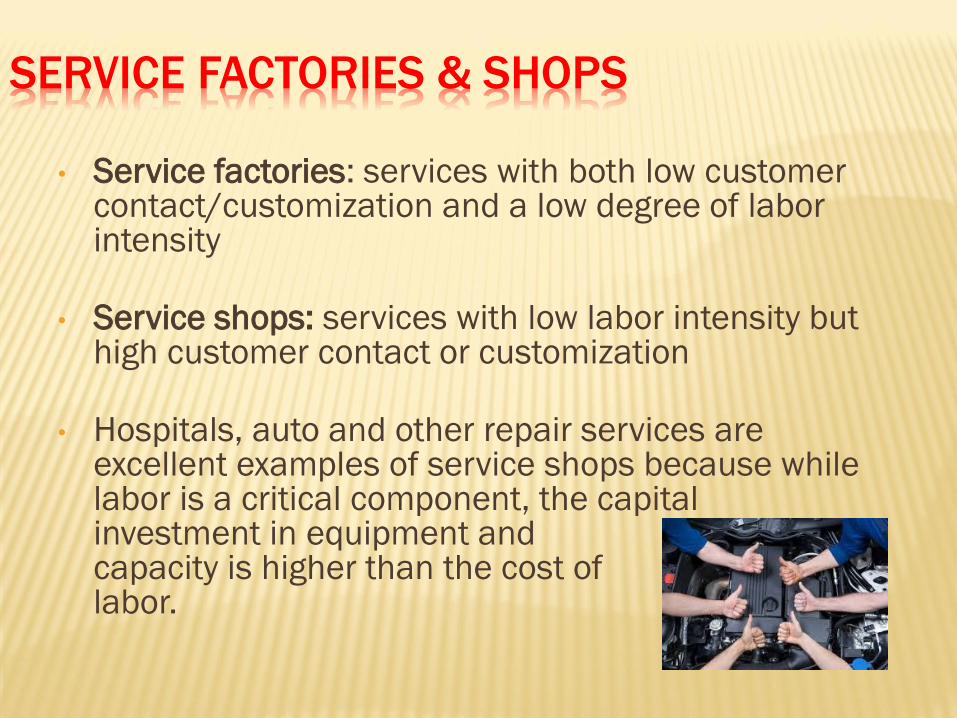
SERVICE FACTORIES & SHOPS
• Service factories: services with both low customer contact/customization and a low degree of labor intensity
• Service shops: services with low labor intensity but high customer contact or customization
• Hospitals, auto and other repair services are excellent examples of service shops because while labor is a critical component, the capital investment in equipment and capacity is higher than the cost of labor.

MASS SERVICES
Mass services: services with low customer
contact or customization in combination with
high labor intensity
Retail companies,
wholesalers, and
schools are examples
of mass services.
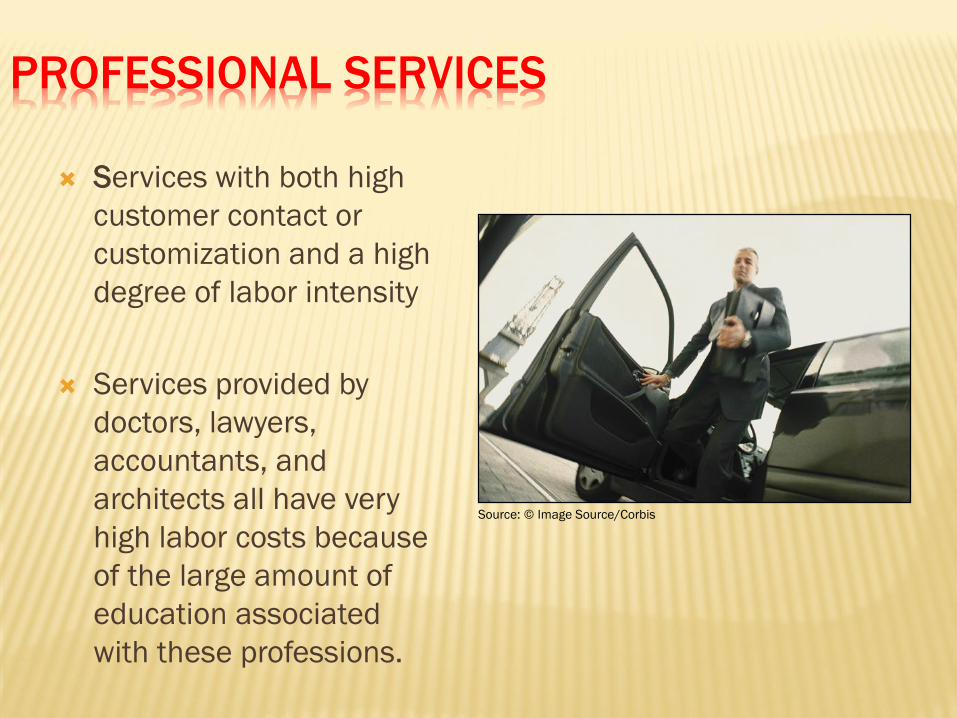
PROFESSIONAL SERVICES
Services with both high
customer contact or
customization and a high
degree of labor intensity
Services provided by
doctors, lawyers,
accountants, and
architects all have very
high labor costs because
of the large amount of
education associated
with these professions.
Source: © Image Source/Corbis

Mission Statement
Business Strategy
Operations Strategy Marketing StrategyFinance Strategy
People Plants Parts Processes
Planning & control systems
Production System
Inputs:
LAND
LABOR
CAPITAL..
Outputs:GOODS
SERVICES
Primary Task and Competitive Priorities
OPERATIONS STRATEGY
Marketplace
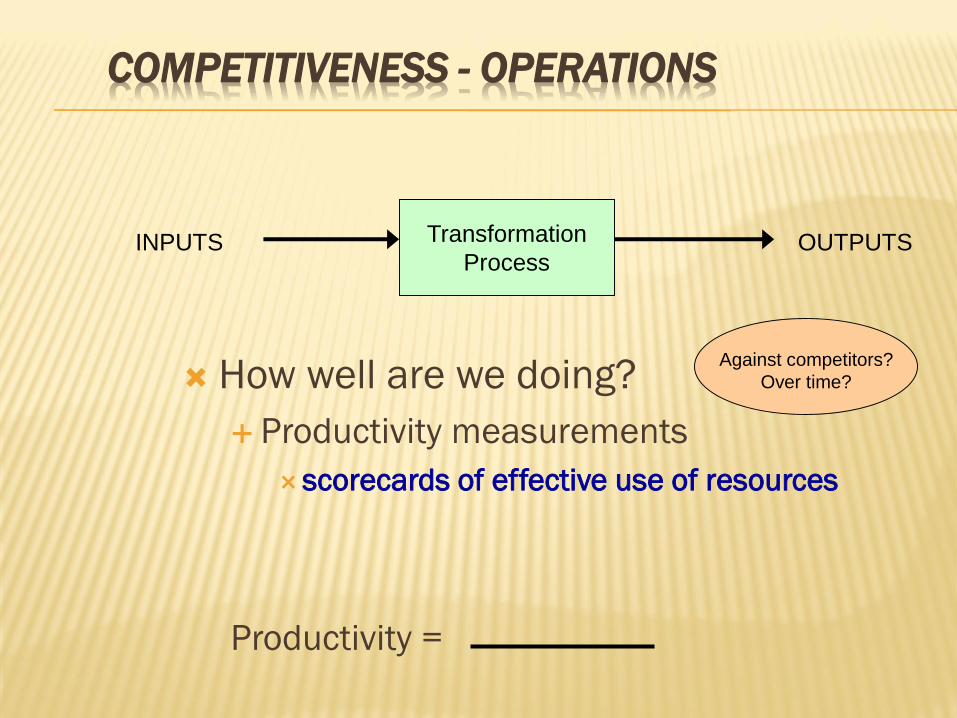
COMPETITIVENESS - OPERATIONS
Transformation
ProcessINPUTS OUTPUTS
How well are we doing?
Productivity measurements
scorecards of effective use of resources
Productivity =
Against competitors?
Over time?

COMPETITIVENESS
Transformation
Process
INPUTS
OUTPUTS
How well are we doing?
Productivity measurements
scorecards of effective use of resources
Productivity =
To increase productivity…
- increase outputs
- decrease inputs
(required to produce output)
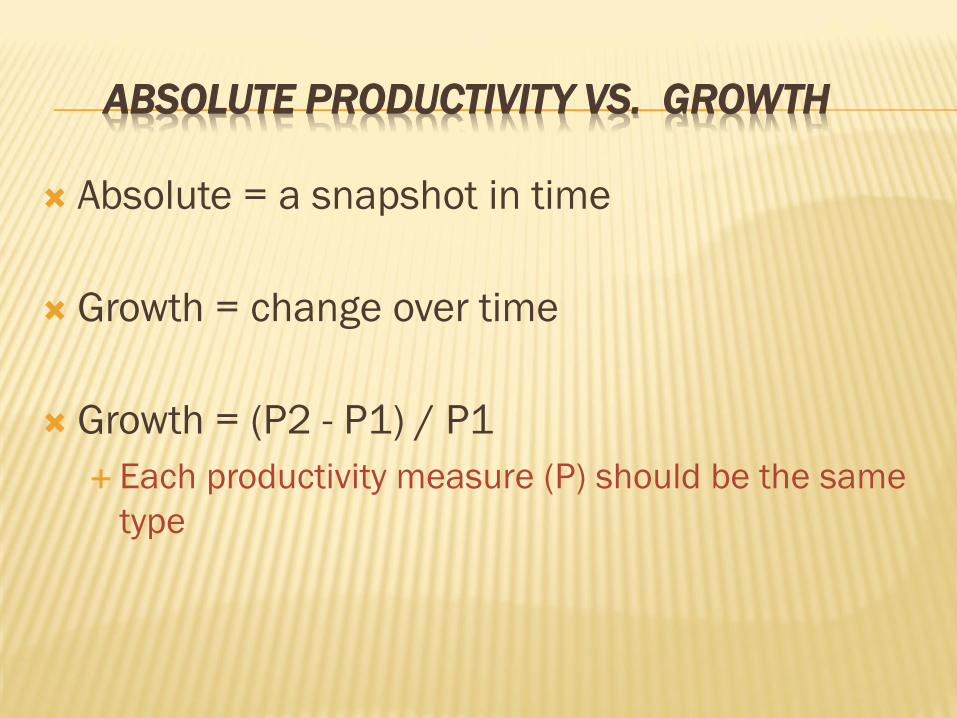
ABSOLUTE PRODUCTIVITY VS. GROWTH
Absolute = a snapshot in time
Growth = change over time
Growth = (P2 - P1) / P1
Each productivity measure (P) should be the same
type
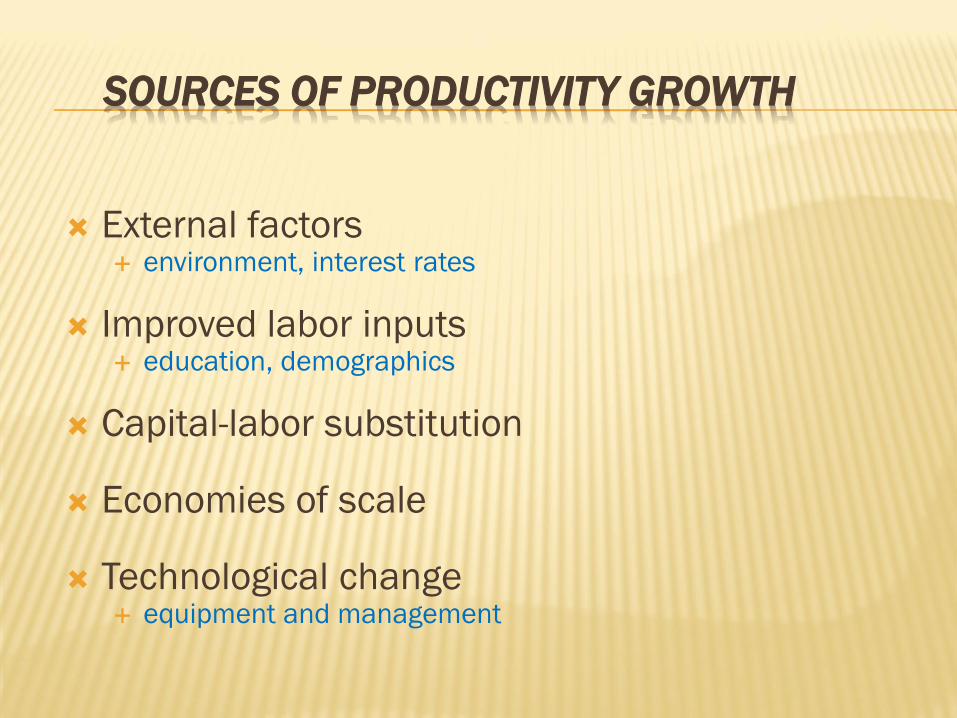
SOURCES OF PRODUCTIVITY GROWTH
External factors environment, interest rates
Improved labor inputs education, demographics
Capital-labor substitution
Economies of scale
Technological change equipment and management
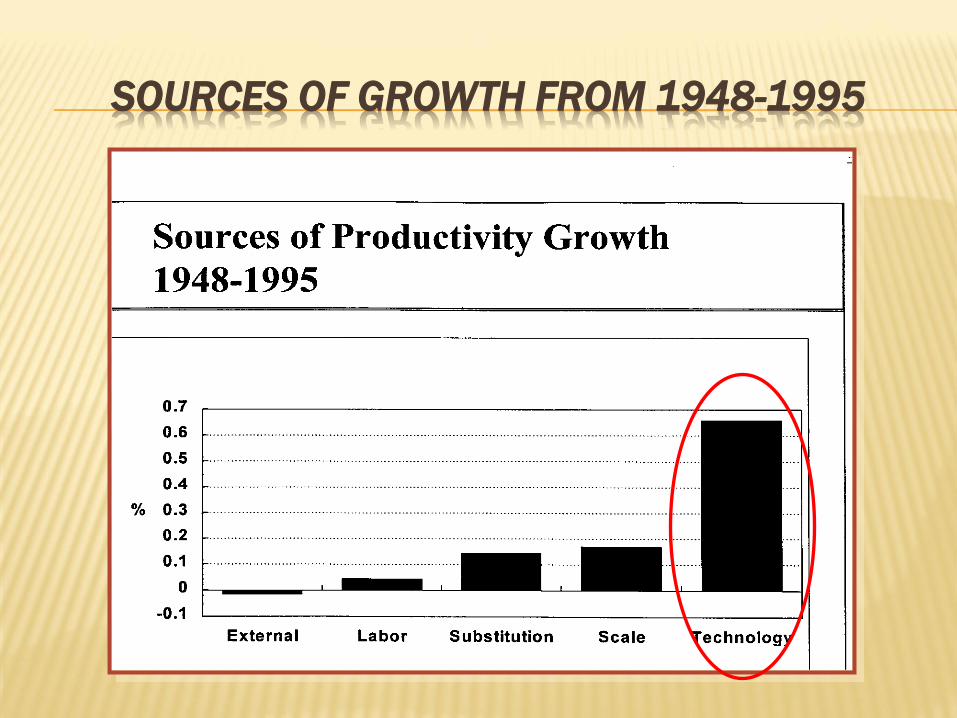
SOURCES OF GROWTH FROM 1948-1995

PROBLEM 1
As operations manager, you are concerned about being able to meet sales
requirements in the coming months. You have been given the following
production report. Find the average total productivity per month (units per
hour).
Jan Feb Mar Apr
Units produced 2300 1800 2800 3000
Hours worked
Per machine 325 200 400 320
# of machines 3 5 4 4
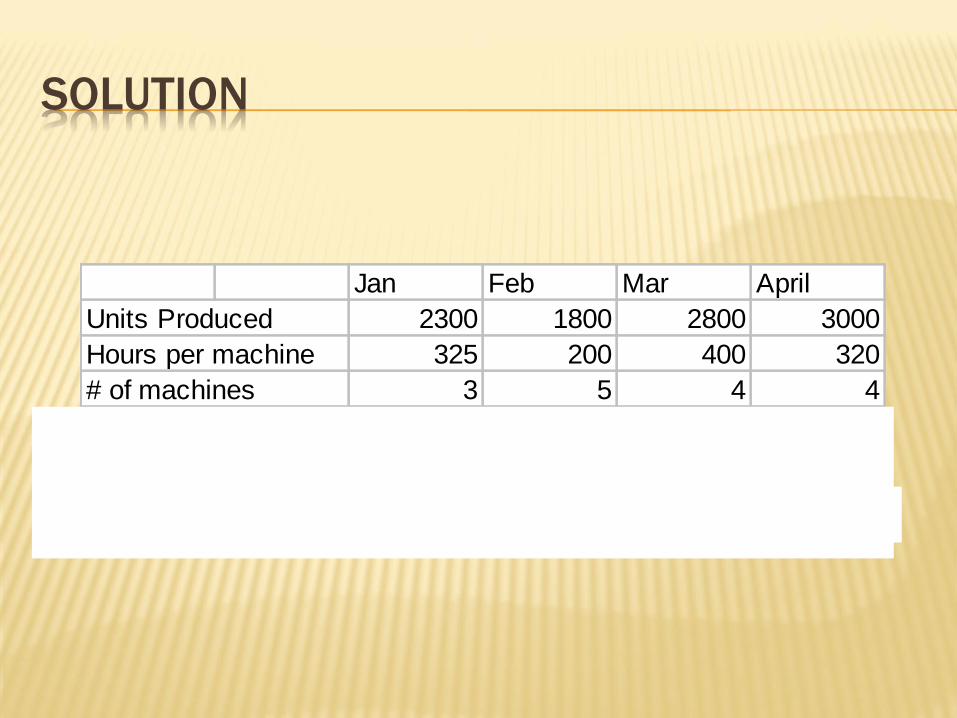
SOLUTION
Jan Feb Mar April
Units Produced 2300 1800 2800 3000
Hours per machine 325 200 400 320
# of machines 3 5 4 4
Productivity 2.36 1.80 1.75 2.34
units
labor-hour
units
labor-hour
units
labor-hour
units
labor-hour

PROBLEM 2
For the previous data set, based on growth in
productivity between March and April, how
many units can we expect to produce in May,
if operating resources for May are the same as
they were in April and we experience the same
gain in productivity?
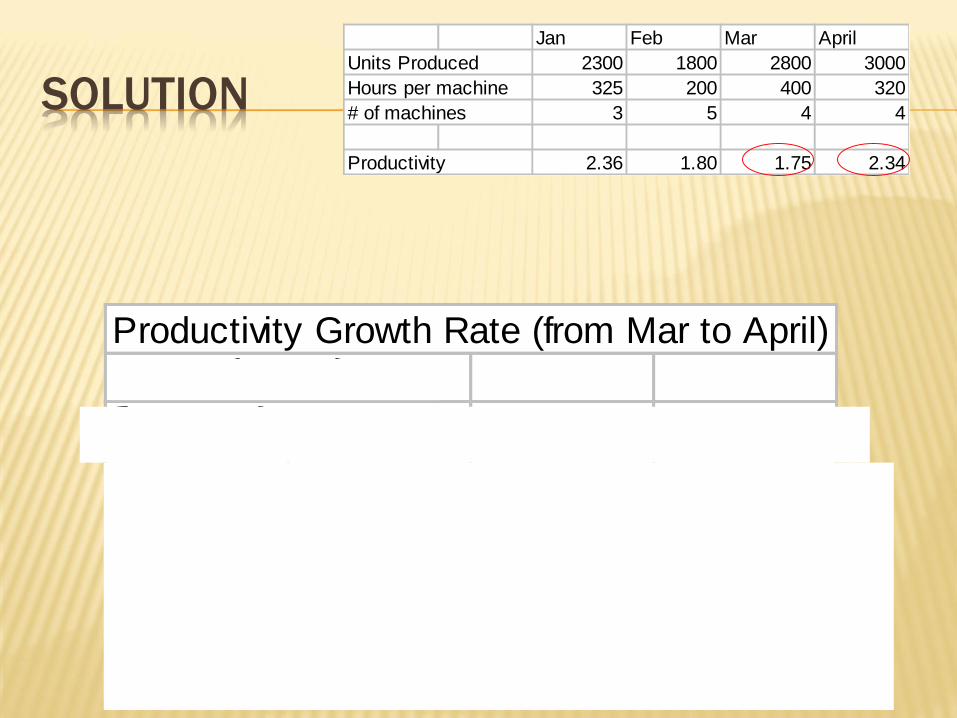
Productivity Growth Rate (from Mar to April)
PGR = P2-P1/P1
2.34-1.75/1.75= 33.93%
Therefore, for May
2.34 X 1.3393= 3.13
SOLUTION
Jan Feb Mar April
Units Produced 2300 1800 2800 3000
Hours per machine 325 200 400 320
# of machines 3 5 4 4
Productivity 2.36 1.80 1.75 2.34
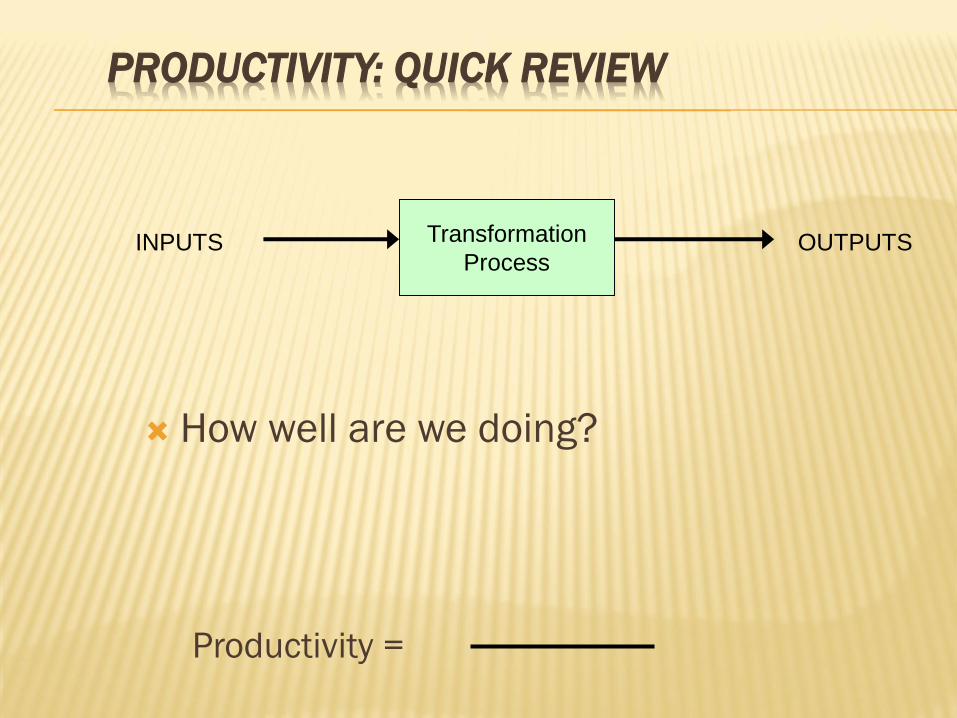
PRODUCTIVITY: QUICK REVIEW
Transformation
ProcessINPUTS OUTPUTS
How well are we doing?
Productivity =
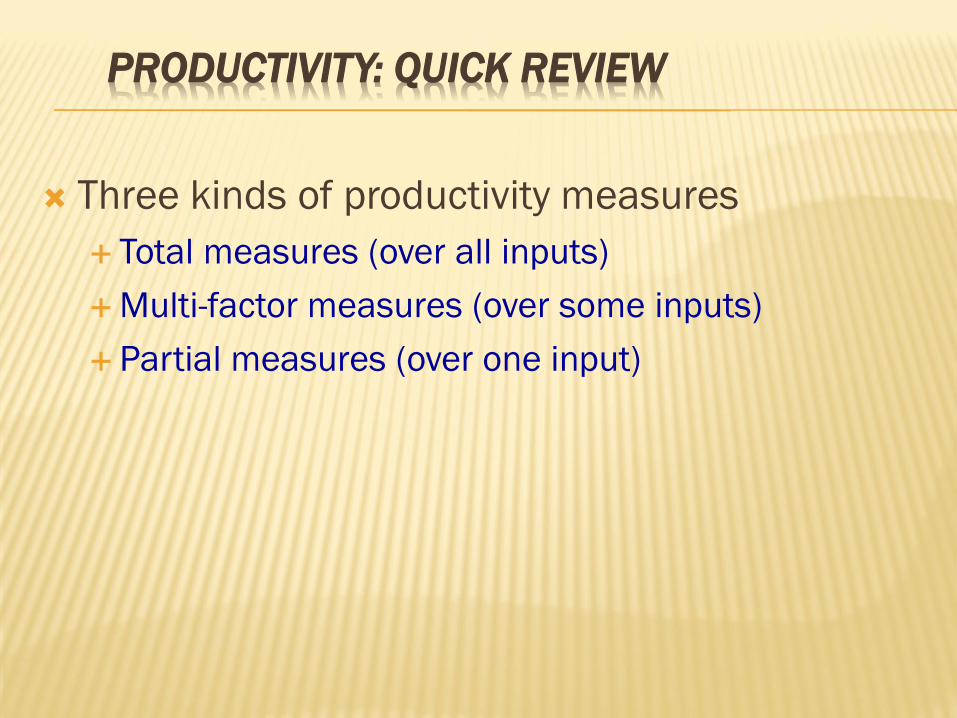
PRODUCTIVITY: QUICK REVIEW
Three kinds of productivity measures
Total measures (over all inputs)
Multi-factor measures (over some inputs)
Partial measures (over one input)
MODULE 2: SUMMARY
What is business strategy in relation to OPS?
Name and describe 4 means to achieve
competitive advantage as pertains to OPS?
Name and describe 3 processes to
manufacture a product
Name and describe 2 vehicles to deliver
services