molopo energy limited
TRANSCRIPT

MOLOPO ENERGY LIMITED ABN 79 003 152 154
Registered Office c/- First Advisers Pty Ltd Suite 604, Level 6, 309 Kent Street Sydney, NSW 2000 Australia P.O. Box H206, Australia Square NSW 1215 Telephone: (61 3) 9618 8722 Facsimile: (61 2) 8011 0359 Website: www.molopo.com.au Email: [email protected]
ASX ANNOUNCEMENT / MEDIA RELEASE 28 March 2013
MOLOPO LODGES 31 DECEMBER 2012 ANNUAL REPORT Molopo Energy Limited (ASX: MPO) (“Molopo” or “the Company”) today lodged its 31 December 2012 Annual Report. As previously announced on 29 November 2012, Molopo changed its financial year end from 30 June to 31 December and its presentational currency from Australian dollars to US dollars. These changes bring the Company’s disclosures more in line with North American based reporting and enable financial reporting to reflect the same currency as the majority of its revenues and expenditures. This Annual Report includes audited financial statements for the six month period ended 31 December 2012 prepared in compliance with International Financial Reporting Standards, and will be mailed to shareholders who have elected to receive a printed copy of annual reports. It is also available on the Company’s website at www.molopo.com.au. Issued by: Molopo Energy Limited For further information contact: Steve Cloutier, CEO +1.403.648.3594
+ 61 3 9618 8704 (Australia local)
Cindy Gray, VP Capital Markets +1.403.648.8026
+ 61 3 9618 8704 (Australia local)

A.B.N. 79 003 152 154
ANNUAL REPORT
For the six months ended 31 December 2012

MOLOPO ENERGY LIMITED DECEMBER 2012 ANNUAL REPORT
2
Table of Contents Page Corporate Directory 3 Directors’ Report 4 Remuneration Report 16 Auditors’ Independence Declaration 28 Independent Auditor’s Report 29 Consolidated Statement of Financial Position 31 Consolidated Statement of Comprehensive Income/(Loss) 32 Consolidated Statement of Changes in Equity 33 Consolidated Statement of Cash Flow 34 Notes to the Consolidated Financial Statements 35 Directors’ Declaration 83 Corporate Governance Statement 84 ASX Additional Information 90 Glossary of Terms 93

MOLOPO ENERGY LIMITED DECEMBER 2012 ANNUAL REPORT
3
Corporate Directory Directors G. Lewin (Chairman) S. Cloutier (Managing Director and CEO) M. Beck (Non-Executive Director) G. Cameron (Non-Executive Director) D. Engle (Non-Executive Director) G. Ross (Non-Executive Director) B. Straub (Non-Executive Director) J. Schwarz (Non-Executive Director) Company Secretary J. Huberman Registered Office Suite 604, Level 6, 309 Kent Street, Sydney, New South Wales, 2000 Australia Telephone: (61 3) 9618 8722 Facsimile: (61 3) 9620 2804 Canadian Office Suite 2000, 500 4th Avenue SW, Calgary, AB T2P 2V6 Canada Telephone: (403) 264-9778 Facsimile: (403) 264-9903 Website and Email www.molopo.com.au [email protected]
Auditors Deloitte Touche Tohmatsu 550 Bourke Street Melbourne, VIC 3000 Australia Engineers Sproule Associates Ltd. 900, 4th Avenue SW, Calgary, AB T2P 3N3 Canada Bankers National Australia Bank Limited 330 Collins Street, Melbourne, VIC 3000 Australia National Bank of Canada 301 – 6th Avenue, Calgary, AB T2P 4M9 Canada Share Registry Computershare Investor Services Pty Ltd Yarra Falls 452 Johnston Street Abbotsford VIC 3067 Australia Telephone: (61 3) 9415 4000 Stock Exchange Listing Australian Securities Exchange Limited Level 4, North Tower, 525 Collins Street, Melbourne, VIC 3000 Australia (ASX code: MPO)

MOLOPO ENERGY LIMITED DECEMBER 2012 ANNUAL REPORT
4
Directors’ Report Your Directors present their report on the consolidated entity (the Group) consisting of Molopo Energy Limited (Molopo or the Company) and the entities it controlled at the end of, or during, the six month period to 31 December 2012. Directors The following persons were directors of Molopo at any time during the six months and up to the date of this report:
Mr. Gregory Lewin, Chairman
Mr. Steven Cloutier, Chief Executive Officer and Managing Director1
Mr. Timothy Granger, Former Chief Executive Officer and Managing Director2
Mr. Maxwell Beck
Mr. Garry Cameron
Mr. Donald Engle
Mr. Glenn Ross3
Mr. Brian Straub
Mr. Jeffrey Schwarz4
1. Appointed Chief Executive Officer and Managing Director on 17 January 2013 2. Ceased as Chief Executive Officer and Managing Director on 17 January 2013 3. Appointed 22 November 2012. Previously he was an alternate director for Mr. Beck since 15 February 2011. 4. Appointed as an independent non-executive director by the Board on 15 March 2013. He retires at the 2013 Annual
General Meeting and is eligible for election at that meeting.
Director information Mr. Gregory Lewin AM BE (Chem), MBA, FREng, FIChemE Chairman, Non-Executive Director Mr. Lewin was elected as a Non-Executive Director and appointed as Chairman of Molopo Energy Limited on 15 February 2011.
Mr. Lewin’s career spanned 34 years with Royal Dutch Shell, from Shell Australia in 1975 to Royal Dutch Shell in The Hague. He held a number of senior executive positions with Shell throughout the world, including President, Shell Global Solutions and Executive Vice President – Shell Downstream. Mr. Lewin held the position of director of Sasol Ltd (JSE and NYSE) - during 2010 and until March 2011. He was President of the Institution of Chemical Engineers from 2006 to 2007. The Institution of Chemical Engineers is the Royal Society for professional Chemical Engineers with a membership of 30,000. He was elected President of the World Chemical Engineering Council in February 2012 and is a Director of the Australian Wildlife Arts Foundation. In 2010, he was admitted as a Fellow of the Royal Academy of Engineering. He is a Board member of Alinta Energy Holdings Limited and the Cooperative Research Centre for Greenhouse Gas Technologies (CO2CRC) and is an Executive Director of Sapphire Global Pty Ltd.
In 2012, Mr. Lewin was recognised in the Honours list as Member of the Order of Australia (AM) for service to the profession of chemical engineering through senior roles in the petroleum industry, to business and commerce and to professional organisations. Special Responsibilities: Member of the HSE and Technical Committee. Chairman of the Remuneration and Nomination Committee until 31 July 2012.

MOLOPO ENERGY LIMITED DECEMBER 2012 ANNUAL REPORT
5
Mr. Steven G. Cloutier, BA, JD Chief Executive Officer and Managing Director Mr. Cloutier was appointed Chief Executive Officer and Managing Director on 17 January 2013. Mr. Cloutier has more than 23 years’ experience in commercial legal practice and oil and gas. He was the President and a co-founder of APF Energy Trust from 1996 to 2005 and Rockyview Energy Inc. from 2005 to 2008, both listed on the Toronto Stock Exchange. From 2009 until his appointment as the Chief Executive Officer and Managing Director of Molopo, Mr. Cloutier was the President & Chief Executive Officer of Skyridge Capital Corporation, a private company that provides corporate finance and M&A advisory services with a particular emphasis on the upstream energy sector.
He has been a director of Kallisto Energy Corporation (TSX.V:KEC) since 12 October 2012 and has sat on the boards of a number of exploration and production companies, including Millennium Energy Inc., Star Point Energy Trust, Cumberland Oil & Gas Ltd., and Ki Exploration Inc. He holds a Bachelor of Arts from McGill University and a Juris Doctor (Bachelor of Laws) from the University of Victoria (Canada).
Special Responsibilities: Member of the Special Committee from 17 January 2013.
Mr. Timothy Granger, BSc – Mechanical Engineering Former Chief Executive Officer and Managing Director Mr. Granger was appointed as Chief Executive Officer and Managing Director on 3 January 2012. He ceased in this role on 17 January 2013.
Mr. Granger has over 30 years of experience in North American oil and gas exploration and production operations and asset management. Most recently, he held the position of President and Chief Executive Officer of Toronto Stock Exchange listed Compton Petroleum Corporation. Mr Granger graduated from Carleton University (Ottawa) with a B.Sc. in Mechanical Engineering.
Mr. Granger was a director of Compton Petroleum Corporation (TSX:CMT) from January 2009 to December 2011. Mr. Maxwell Beck AM Non-Executive Director Mr. Beck was elected as a Non-Executive Director of Molopo on 15 February 2011.
Mr. Beck is the founder and major shareholder of the Becton Property Group (Becton). In 1976, he established Becton as a respected and highly successful property development, construction and investment company. Mr. Beck retired as Chairman of Becton in 2007.
Mr. Beck was on the inaugural Board of Directors of the Victorian Government’s Melbourne Major Events Company Limited which has become the most important catalyst in securing sporting, recreational and cultural events for Melbourne.
He was the founder and Chairman of the Melbourne Chapter of Children’s International Summer Villages and is a former board member of the Melbourne Neuromuscular Research Centre, has been a board member of World Track Cycling, is a member of the Peter MacCallum Cancer Foundation, and was appointed Deputy Chair of the Royal Children’s Hospital in 2004.
In June 2006, Mr. Beck was awarded The Member of the Order of Australia (AM) medal for his services to the construction and property development industries and to the community through fund raising and executive roles in a range of organisations and charities.
In March 2009, Mr. Beck was appointed by the Victorian Premier to Chair the Victorian Bushfire Advisory Reconstruction Board for the Black Saturday Bushfires.

MOLOPO ENERGY LIMITED DECEMBER 2012 ANNUAL REPORT
6
Special Responsibilities: Member of the Remuneration and Nomination Committee until 13 December 2012. Other than Molopo, Mr. Beck has not held directorships in publicly listed companies during the past three years. Mr. Brian Straub, BSc - Petroleum Engineering Non-Executive Director Mr. Straub was appointed by the Board as a Non-Executive Director of Molopo on 17 March 2011. Mr. Straub was elected as a director by the shareholders at the 2011 Annual General Meeting (AGM).
Mr. Straub recently retired as President - Shell Canada Limited and Canada Country Chair - Royal Dutch Shell. With over 32 years of diverse Canadian and Global Oil and Gas experience, his previous executive responsibilities have included the Oil Sands, Exploration & Production, Major Construction and Technology Development/Application.
During his career with Shell he gained broad exploration and production experience, holding positions in key technical functions including Drilling, Production Operations and HSE as well as critical business functions such as Marketing, Joint Ventures and New Business Development for both major onshore and offshore developments.
Special Responsibilities: Chairman of the HSE and Technical Committee. Member of the Audit and Risk Committee. Member of the Special Committee from 17 January 2013.
Mr. Straub has been a director of Ridgeline Energy Services Inc. (TSX.V:RLE) from 18 January 2011. Mr. Garry Cameron PSM B.Bus (A/c), B.Eco. (Hons.), M.Eco, FAICD, FCPA Non-Executive Director Mr. Cameron was appointed by the Board as a Non-Executive Director of Molopo on 30 March 2011. Mr. Cameron was elected as a director by the shareholders at the 2011 AGM.
Mr. Cameron currently holds non-executive directorships with various companies, including ANZ Specialised Asset Management Ltd, ANZ Business Equity Fund Ltd and Heemskirk Consolidated Limited. He previously held the position of Managing Director and CEO of an ASX listed property trust for 10 years, and prior to that held a number of senior executive roles including Executive Director, Finance, with Telecom/Telstra and Deputy Managing Director of Treasury Corporation Victoria. He was also recognised in 1992 on the Australia Day Honours list for his contribution to finance and telecommunications. Special Responsibilities: Chairman of the Audit and Risk Committee. Member of the Remuneration and Nomination Committee. Member of the Special Committee from 17 January 2013. Mr. Cameron was a non-executive director of Aevum Ltd (ASX:AVE) from August 2009 to December 2010 and is currently a non-executive director of Heemskirk Consolidated Limited (ASX:HSK) since 24 February 2011. Mr. Donald Engle Non-Executive Director Mr. Engle was elected by the shareholders as a Non-Executive Director of Molopo on 22 November 2012. Prior to his election, he had been a Non-Executive Director since 20 January 2012, when he assumed the role as a result of a Board appointment.
Mr. Engle brings with him a wealth of experience in North American oil and gas. His work in the sector spans more than 36 years, including as a Founder and President of several companies including Grey Wolf Exploration, an oil and gas company listed on the TSX. He was Chairman of the Board of APF Energy Inc., a Director of Canscot Resources Ltd., Churchill Energy Inc. and Brompton Financial Limited, a private merchant bank. Most

MOLOPO ENERGY LIMITED DECEMBER 2012 ANNUAL REPORT
7
recently he was the Executive Chairman, CEO and President of TriWestern Energy Inc., a private oil and gas company. Special Responsibilities: Member of the Audit and Risk Committee. Member of the HSE and Technical Committee. Chairman of the Remuneration and Nomination Committee from 31 July 2012. Chairman of the Special Committee from 17 January 2013.
Mr. Glenn Ross Non-Executive Director Mr. Ross was elected by the shareholders as a Non-Executive Director of Molopo on 22 November 2012. Prior to his election, he was an alternate director for Mr. Beck since 15 February 2011.
Mr. Ross currently manages the non-property investments for Beck Corporation Pty Ltd. Mr. Ross’ background is in commodity trading, having worked with Cargill in Australia and Japan covering both soft commodities and metals and minerals. More recently, Mr. Ross has had experience in sales and marketing of industrial minerals including a role with RioTinto Minerals. Other than Molopo, Mr. Ross has not held directorships in publicly listed companies during the past three years. Special Responsibilities: Member of the Remuneration and Nomination Committee from 13 December 2012. Member of the Special Committee from 13 February 2013.
Mr. Jeffrey Schwarz Non-Executive Director Mr. Schwarz was appointed by the Board as a Non-Executive Director of Molopo on 15 March 2013. Mr. Schwarz is a Senior Advisor to Metropolitan Capital Advisors, Inc. (“MCA”), a New York-based investment management firm, which he co-founded in 1992. He has more than thirty years of experience in funds management employing value and event investing strategies. From its inception until 2012, Mr. Schwarz served as Chief Investment Officer of MCA, during which time he directed the commitment of significant capital to the energy sector. He holds degrees from the University of Pennsylvania’s Wharton School (summa cum laude graduate with a B.S. in Economics; and an MBA with a concentration in Finance). General Counsel and Company Secretary Ms. Jessica Huberman was appointed Company Secretary on 11 March 2011 and was appointed as General Counsel on 23 May 2012. Prior to her appointment as Company Secretary in 2011, Ms. Huberman’s experience included one year as Finance and Governance Manager at Molopo, preceded by a number of years as a corporate lawyer in private practice, specialising in corporate and commercial law, including advising ASX listed entities on matters including mergers and acquisitions, capital raisings and other corporate transactions. Ms. Huberman holds Bachelor degrees in Commerce and Law (Hons) from Monash University, as well as a Masters in Applied Finance (Corporate Finance and Investment Management). Ms. Huberman has been admitted to practice as a Solicitor and Barrister in the Supreme Court of Victoria and the High Court of Australia. Dividends The Directors do not propose to pay a dividend in respect of the current six months ended 31 December 2012 (Year ended 30 June 2012: $Nil).

MOLOPO ENERGY LIMITED DECEMBER 2012 ANNUAL REPORT
8
Principal Activities The Group’s principal activities during the six months continued to be investment in exploration, appraisal, development and production of oil and gas. Significant Changes in State of Affairs Corporate
In December 2012 the Company announced that the Directors had elected to change Molopo’s year end from 30 June to 31 December effective from 31 December 2012. At that time, the Company also announced it would change its presentation currency from Australian dollars to U.S. dollars to enable reporting in the same currency as the majority of its revenue and expenditures. Australia – Queensland, Bowen Basin On 1 November 2012, the Group completed the sale of its Queensland, Bowen Basin gas assets to a subsidiary of PetroChina International Investment Company Limited for proceeds of US$42.6 million plus a working capital adjustment of US$2.5 million. Operational Review During the six months ended 31 December 2012, the Company focused its operational activities and capital expenditures predominantly in the Wolfcamp shale trend in the Permian Basin, West Texas. An update of the activities that were undertaken is provided below, along with commentary regarding the Company’s non-core assets. West Texas, USA - Barnhart Project Molopo acquired the 1,400 acre Barnhart Project area in November 2011, which is located amidst existing development by operators such as EOG Resources Inc. The Company drilled and completed its first Barnhart well, Linthicum Washington 36-2H, through May and June 2012, and released results in August 2012. Subsequently, the Company drilled and completed its second well, Linthicum Washington 36-1H through August and September 2012 with preliminary results announced in late October. The third Barnhart well, Linthicum Washington 24-2H, was drilled and completed through late November and December, and results were announced in January 2013. A summary of each Barnhart well drilled and completed during the reporting period is included in the following table:
IP30 Rate1
Target Bench Spud Date
HZ Length (miles)
Completion Techniques BOE (boe/d)
Liquids Weighting
Barnhart
Linthicum Washington 36-2H
B May 2012 1.3 Slickwater, 34 frac stages 403 71%
Linthicum Washington 36-1H
B August 2012 1.5 Slickwater, 36 frac stages 460 70%
Linthicum Washington 24-2H
B November 2012 1.4 Slickwater, 36 frac stages 179 66%
1IP30 rates reflect the average production rate of the well over the first 30 days on production, excluding downtime

MOLOPO ENERGY LIMITED DECEMBER 2012 ANNUAL REPORT
9
West Texas, USA - Fiesta Project The Company acquired the majority of its 24,600 acre Fiesta Project in 2010, with an additional 22% partner interest acquired in April 2012. The Fiesta acreage is one of the southern-most positions in the Wolfcamp play, and is approximately 1,000 feet shallower than comparable acreage in regions farther north, which results in lower reservoir pressure. When selecting drilling locations and frac design, the Company factored in this shallower depth, but until drilling was completed could not confirm the ultimate impact of the decreased pressure. Through late 2011 and early 2012, the Company undertook the first phase of drilling in Fiesta to prove the acreage was in the oil window and would produce hydrocarbon. Three horizontal wells were drilled and completed targeting Bench A. These wells confirmed that Fiesta was in the oil window, but were not economic. Changes were made to the drilling program to conform to practices being utilised by other area operators, such that subsequent wells featured longer horizontal laterals, an increase in the number of frac stages and slickwater fluid for completion. Using these modified techniques, the Company drilled and completed its first Fiesta well at Baggett 16-1H through July and August, and the well continued to flow back through the end of September. Results from Baggett 16-1H were announced in October. A second well was drilled in Fiesta through July and August at Baggett 40-2H, and completion of that well commenced in late September, with results provided in October. Through September and October the third Fiesta well in 2012, Baggett 54-1H, was drilled and completed targeting Bench B, in an area of the reservoir which appeared to have greater natural fracturing. Results from the third and final Fiesta well were announced in late December. The Fiesta wells generally produced lower than anticipated volumes, showed a sharper decline on the type curve, and in two of the three wells exhibited a higher than expected gas weighting. A summary of each Fiesta well drilled and completed during the reporting period is included in the following table:
IP30 Rate1
Target Bench Spud Date
HZ Length (miles)
Completion Techniques BOE (boe/d)
Liquids Weighting
Fiesta
Baggett 16-1H
A June 2012 1.4 Slickwater, 34 frac stages 244 60%
Baggett 40-2H
A July 2012 1.5 Slickwater, 35 frac stages 250 76%
Baggett 54-1H
B September 2012 1.4 Slickwater, 38
frac stages 238 58% 1IP30 rates reflect the average production rate of the well over the first 30 days on production, excluding downtime Results from the Company’s drilling in Texas demonstrated that the Wolfcamp is an emerging resource play still in its infancy. Subsequent to the end of the reporting period, the Company announced a leadership change, along with a review of the tactical execution of its strategy, including its 2013 capital budget. The outcome of this review is expected to be finalised near the end of the first quarter 2013 and will determine an optimal strategy for generating positive shareholder returns from all of the Company’s assets, including its Wolfcamp acreage. Through the review period, no new operational capital will be invested except as required to maintain existing wells and production. Saskatchewan, Canada The Company has approximately 46,000 net acres in the Williston Basin in the Canadian province of Saskatchewan, with an average 98% working interest. Nominal capital was invested in this area during the reporting period, primarily related to completion costs of a non-operated well. As part of the Company’s tactical review of strategic execution, an optimal future development strategy for the Company’s acreage in Saskatchewan is being assessed.

MOLOPO ENERGY LIMITED DECEMBER 2012 ANNUAL REPORT
10
Quebec, Canada The Company has 1.4 million net acres in the Utica Shale of the St. Lawrence Lowlands in the Canadian province of Quebec, with a 100% working interest. The Quebec Government has imposed a moratorium on fracture stimulation operations, which has rendered activity in the play on hold. As such, no capital is being invested in this area during the moratorium; however there is minimal cost to the Company and the tenure clock and leasehold payments remain ‘frozen’. Corporate Production For the six month period ended December 31, 2012, the Company’s corporate production averaged 694 boe/d, weighted 68% to liquids. The wells in Texas contributed 527 boe/d or 76% of the total, with 167 boe/d coming from wells in Saskatchewan. Company Reserves
As a result of drilling 6 wells in Texas through the last half of 2012, Molopo booked additional reserves. As at 31 December 2012 the Company’s Gross and Net Reserves from Texas and Saskatchewan were:
Summary of Oil and Gas Reserves at December 31, 2012 1,2,3,4,5
Oil Natural Gas
Liquids Natural Gas BOE
Reserve Category Gross (mbbl)
Net (mbbl)
Gross (mbbl)
Net (mbbl)
Gross (mmcf)
Net (mmcf)
Gross (mboe)
Net (mboe)
Proved Developed Producing 405.9 308.9 203.4 151.4 1,929 1,437 930.8 699.8 Developed Non-Producing - - - - - - - - Undeveloped 37.5 28.7 - - - - 37.5 28.7 Total Proved 443.4 337.7 203.4 151.4 1,929 1,437 968.3 728.5 Probable 312.0 264.1 81.0 60.4 578 430 489.3 396.1 Total Proved plus Probable 755.4 601.8 284.4 211.8 2,507 1,867 1,457.6 1,124.6
Notes: 1 Gross Reserves are Molopo’s working interest share of the remaining reserves, before deduction of any royalties. 2 Net Reserves are Molopo’s working interest share of remaining reserves less all royalties and interests owned by others. 3 Reserves independently certified by Scott Pennell of Sproule Associates Limited Calgary, Canada, who has consented to the inclusion of the reserves information in the form and context in which it appears. 4 Due to rounding, certain totals may not add. 5Boe's may be misleading, particularly if used in isolation. A boe conversion ratio of 6 mcf : 1 bbl is based on an energy equivalency conversion method primarily applicable at the burner tip and does not represent a value equivalency at the wellhead.

MOLOPO ENERGY LIMITED DECEMBER 2012 ANNUAL REPORT
11
Financial Review The net result attributable to the Group, after income tax expense, for the six months ended 31 December 2012 was a profit/(loss) of (US $64.2 million) (year ended 30 June 2012: (US $65.7 million)). As at 31 December 2012, the Group’s net asset position was US$120.2 million (30 June 2012: US $181.4 million), and cash reserves were US $71.0 million (30 June 2012: US $67.0 million). Profit/(Loss), EPS, dividends and the share price at 31 December and for the last 4 years ended 30 June is summarised below:
2012 2012 2011 2010 2009Net Profit/(Loss) after Income Tax (US$000) (64,153) (65,715) 83,481 2,312 53,981Basic Earnings/(Loss) per share (US$) (0.26) (0.27) 0.33 0.01 0.30Diluted Earnings/(Loss) per share (US$) (0.26) (0.27) 0.32 0.01 0.30Dividend per share (US$) - - - - -Share price at 30 June * n/a 0.545 0.760 0.985 1.020Share price at 31 December * 0.280 n/a n/a n/a n/a
* Share price is in Australian dollars.
Year ended 30 June
Six Months ended 31
December
Business strategies and prospects for future financial years The Group’s business strategies and future development prospects are discussed in the above section “Operational Review”. Health, Safety and Environment Molopo Energy expects excellence in health, safety and environmental performance and is committed to conducting all operations in a safe manner which minimises environmental impact, while meeting regulatory requirements and corporate standards. Molopo Energy maintains a comprehensive range of internal programs and controls to promote regulatory compliance and an appropriate level of safety and environmental protection in all of its operations. Its proactive program includes internal safe work practices and procedures, company and site specific emergency response plans and inspection programs to ensure the Company’s operations continually meet or exceed regulatory standards. Molopo Energy’s HSE and Technical Committee of the Board of Directors has oversight and is responsible for the Company’s overall policies and guidelines with respect to (a) health, safety and environment , and (b) engineering, reserves and operations. Molopo Energy is committed to minimising any potential impact on the environment by ensuring its operations are performed at a high standard. As such, the Company’s regulatory compliance is satisfactory and it has not experienced any material non-compliance actions Environmental regulation provides for, among other things, restrictions and prohibitions on the generation, handling, storage, transportation, treatment, and disposal of hazardous substances and waste from spills, releases, or emissions of various substances produced in association with oil and gas operations. The legislation also requires that wells, facility sites, and other properties associated with the Company’s operations be operated, maintained, abandoned, and reclaimed to the satisfaction of relevant regulatory authorities. There have been no significant environmental spills, releases or incidents with any material financial impact, no legal actions due to any environmental or safety events or incidents and no known material environmental contamination associated with historical practices or operations. At present, the Company believes that it meets all existing environmental standards and regulations and includes appropriate amounts for environmental, health and safety costs in its annual capital and operating expenditure budget to continue to meet current environmental protection requirements. The Company does not anticipate making extraordinary material expenditures for environmental compliance during 2013.

MOLOPO ENERGY LIMITED DECEMBER 2012 ANNUAL REPORT
12
Subsequent Events On 17 January 2013, the Board appointed Mr. Steven Cloutier as Molopo’s Chief Executive Officer and Managing Director, replacing Mr. Tim Granger. On the same date, the Board formed a Special Committee to oversee and assist Mr. Cloutier in developing and implementing a strategic review to enhance shareholder value. This committee is chaired by Mr. Don Engle, with Mr. Garry Cameron, Mr. Brian Straub, Mr. Glenn Ross and Mr. Steven Cloutier as members. Share Options
Unissued shares As at 31 December 2012, there were 490,000 unissued ordinary shares under options (1,145,000 as at 30 June 2012). Refer to the Remuneration Report and Note 19 of the Financial Report for further details regarding the options outstanding. Option holders do not have any right, by virtue of the option, to participate in any share issue of Molopo or any related body corporate.
Shares issued as a result of the exercise of options During the Period, employees and executives did not exercise any options to acquire shares in Molopo. Performance Share Rights The Board approves the offering of performance share rights and performance rights to employees and executives in accordance with the rules of the Company’s Employee Incentive Scheme. Each Performance Share Right (PSR) entitles the holder to one ordinary share upon the satisfaction of specified performance criteria. Each Performance Right (PR) entitles the holder to up to 100 ordinary shares upon the satisfaction of specified performance criteria. PSR and PR holders do not have any right, by virtue of the performance share right, to participate in any share issue of Molopo or any related body corporate. There were no PSRs granted during the six months ended 31 December 2012. The following table discloses the number, nature and status of the PSRs outstanding during the six months ended 31 December 2012:
PSRs Outstanding
30 June 2012 PSRs Granted PSRs Vested PSRs Expired or Cancelled
PSRs Outstanding
31 December 2012
Transitional 423,620 - - (6,625) 416,995 Sign-on 1,615,717 - (132,041) (69,929) 1,413,747
867,494 - - (8,000) 859,494
Total 2,906,831 - (132,041) (84,554) 2,690,236
2011 Deferred Short Term Incentive
There were 4,170 PRs granted to new employees during the six months ended 31 December 2012. The following table discloses the number, nature and status of the PRs granted and outstanding during the six months ended 31 December 2012:
PRs Outstanding
30 June 2012 PRs Granted PRs Vested PRs Expired or Cancelled
PRs Outstanding
31 December 2012
2012 Long Term Incentive 28,610 4,170 - (3,019) 29,761
MOLOPO ENERGY LIMITED DECEMBER 2012 ANNUAL REPORT
13
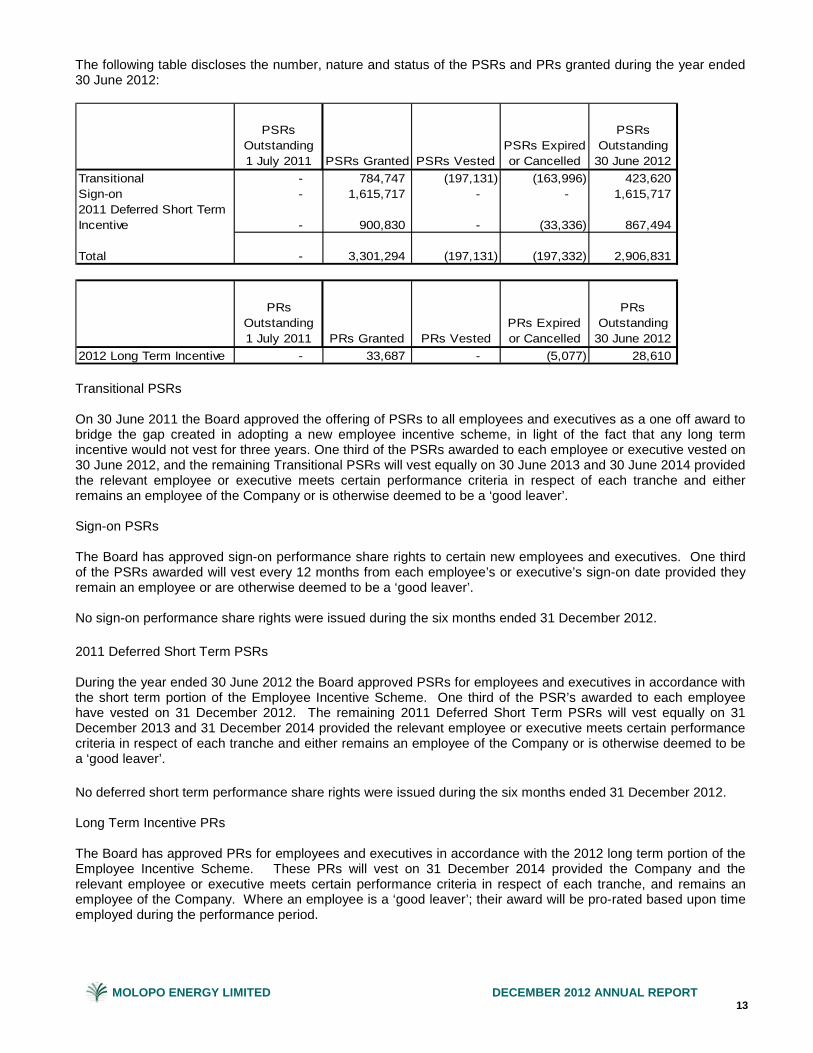
The following table discloses the number, nature and status of the PSRs and PRs granted during the year ended 30 June 2012:
PSRs Outstanding 1 July 2011 PSRs Granted PSRs Vested
PSRs Expired or Cancelled
PSRs Outstanding
30 June 2012Transitional - 784,747 (197,131) (163,996) 423,620 Sign-on - 1,615,717 - - 1,615,717
- 900,830 - (33,336) 867,494
Total - 3,301,294 (197,131) (197,332) 2,906,831
PRs Outstanding 1 July 2011 PRs Granted PRs Vested
PRs Expired or Cancelled
PRs Outstanding
30 June 20122012 Long Term Incentive - 33,687 - (5,077) 28,610
2011 Deferred Short Term Incentive
Transitional PSRs On 30 June 2011 the Board approved the offering of PSRs to all employees and executives as a one off award to bridge the gap created in adopting a new employee incentive scheme, in light of the fact that any long term incentive would not vest for three years. One third of the PSRs awarded to each employee or executive vested on 30 June 2012, and the remaining Transitional PSRs will vest equally on 30 June 2013 and 30 June 2014 provided the relevant employee or executive meets certain performance criteria in respect of each tranche and either remains an employee of the Company or is otherwise deemed to be a ‘good leaver’. Sign-on PSRs The Board has approved sign-on performance share rights to certain new employees and executives. One third of the PSRs awarded will vest every 12 months from each employee’s or executive’s sign-on date provided they remain an employee or are otherwise deemed to be a ‘good leaver’. No sign-on performance share rights were issued during the six months ended 31 December 2012. 2011 Deferred Short Term PSRs During the year ended 30 June 2012 the Board approved PSRs for employees and executives in accordance with the short term portion of the Employee Incentive Scheme. One third of the PSR’s awarded to each employee have vested on 31 December 2012. The remaining 2011 Deferred Short Term PSRs will vest equally on 31 December 2013 and 31 December 2014 provided the relevant employee or executive meets certain performance criteria in respect of each tranche and either remains an employee of the Company or is otherwise deemed to be a ‘good leaver’. No deferred short term performance share rights were issued during the six months ended 31 December 2012. Long Term Incentive PRs The Board has approved PRs for employees and executives in accordance with the 2012 long term portion of the Employee Incentive Scheme. These PRs will vest on 31 December 2014 provided the Company and the relevant employee or executive meets certain performance criteria in respect of each tranche, and remains an employee of the Company. Where an employee is a ‘good leaver’; their award will be pro-rated based upon time employed during the performance period.

MOLOPO ENERGY LIMITED DECEMBER 2012 ANNUAL REPORT
14
Indemnification of Officers and Auditor During the financial period, the Group paid premiums to insure the Directors, Secretary of Molopo, and the officers of the Group. The policies prohibit the Company disclosing premiums.
The liabilities insured are legal costs that may be incurred in defending civil or criminal proceedings that may be brought against the officers in their capacity as officers of entities of the Group, and any other payments arising from liabilities incurred by the officers in connection with such proceedings, other than where such liabilities arise out of conduct involving a deliberately fraudulent or wilful breach of duty by the officer or are otherwise prohibited by the Corporations Act 2001. The Company has entered into Deeds of Access, Insurance and Indemnity for all directors of Molopo as well as Deeds of Insurance and Indemnity for executives that act as directors or officers of a Group Company. Proceedings on behalf of the Company No person has applied to the Court under section 237 of the Corporations Act 2001 for leave to bring proceedings on behalf of the Company, or to intervene in any proceedings to which the Company is a party, for the purpose of taking responsibility on behalf of the Company for all or part of those proceedings. No proceedings have been brought or intervened in on behalf of the Company with leave of the Court under section 237 of the Corporations Act 2001. Directors’ Meetings The following table sets out the number of Directors’ meetings (including meetings of committees of Directors) held during the six months ended 31 December 2012, and the number of meetings attended by each Director (while they were a Director or committee member).
Number of meetings held: 7 2 1 3
Number of meetings attended:G. Lewin 7 3M. Beck 5B. Straub 7 2 3A
G. CameronFE 7 2A 1G. Ross (Alternate for M. Beck) 2 1G. RossB 1 T. Granger 7 D. EngleC 7 2 1A 3
Board of Directors
Audit and Risk
Committee
Remuneration and
Nomination Committee
HSE &Technical
Committee
A. Committee Chair B. One meeting since appointment C. Appointed Chair of Remuneration and Nomination Committee on 31 July 2012 FE. Financial expert as defined by the Board
Auditor’s Independence Declaration The auditor’s independence declaration as required under Section 307C of the Corporations Act 2001 is set out on page 28.

MOLOPO ENERGY LIMITED DECEMBER 2012 ANNUAL REPORT
15
Non-Audit Services The Directors are satisfied that the provision of non-audit services during the year, by the Auditor Deloitte Touche Tohmatsu (or by another person or firm on the Auditor’s behalf) is compatible with the general standard of independence imposed by the Corporations Act 2001. The Directors’ reasons for being satisfied that the provision of those non-audit services did not compromise the auditor independence requirements of the Act are: • All non-audit services were subject to the corporate governance procedures adopted by Molopo and have
been reviewed by the Audit and Risk Committee to ensure they do not impact the integrity and objectivity of the Auditor; and
• The non-audit services provided do not undermine the general principles relating to auditor independence as set out in the Code of Ethics for Professional Accountants, as they did not involve reviewing or auditing the Auditor’s own work, acting in a management or decision making capacity for Molopo, acting as an advocate for Molopo or jointly sharing risks and rewards.
During the period, the following fees were paid or payable for non-audit services provided by the auditor of Molopo.
Six Months RestatedEnded Year Ended
31 December 2012 30 June 2012US$000 US$000
Taxation Services:Tax compliance services 20 323Tax advice in respect of asset disposals and acquisitions - 24Other tax services 53 -
73 347
Consolidated
Rounding of amounts The Company is of the kind referred to in ASIC class Order 98/0100, dated 10 July 1998 and in accordance with that Class Order amounts in the Directors Report and the Financial Statements are rounded off to the nearest thousand dollars, unless otherwise indicated.

MOLOPO ENERGY LIMITED DECEMBER 2012 ANNUAL REPORT
16
Remuneration Report (audited) Contents Key Remuneration Principles Performance Related Pay FY2012 Performance Targets Executive Remuneration Executive Contracts of Employment Non-Executive Director Remuneration Executive and Director Shareholdings About this Report This report is prepared in accordance with section 300A of the Australian Corporations Act 2001 and corporate governance guidance in Australia. Australian legislation requires disclosures in respect of Key Management Personnel (KMP) which is defined as those persons having authority and responsibility for planning, directing and controlling the activities of the Company. For the purposes of this report, the Key Management Personnel comprise the non-Executive Directors, the CEO and Managing Director, the Chief Financial Officer (CFO), and the Chief Operating Officer (COO), of Molopo Energy. Where the term “Executives” is used, then this refers to the CEO and his Executive team, comprising COO, CFO, Vice President, Exploration, Vice President Land and Business Development, Vice President, Capital Markets and General Counsel and Company Secretary. In this report, the remuneration and benefits reported have been presented in US dollars as a result of the Company’s change in presentational currency from Australian to US dollars effective 1 July 2012. Compensation for the non-Executive Directors is paid in Australian dollars and, for reporting purposes, converted to US dollars based on the average exchange rate for the applicable period. Compensation for the CEO and Managing Director, the CFO, and the COO is paid in Canadian dollars and, for reporting purposes, converted to US dollars based on the average exchange rate for the applicable period. The valuation of equity awards for the year ended 30 June 2012 were converted to US dollars at the average exchange rate for the year. The valuation of equity awards granted from 1 July 2012 was converted at the average rate for the period. The rates applied to the Australian dollar compensation and equity awards for the six month period ended 31 December 2012 was US$1 : 1.0386 and for the year to 30 June 2012 was US$1 : 1.0323. The rates applied to the Canadian dollar compensation and equity awards for the six month period ended 31 December 2012 was US$1 : 1.0064 and for the year to 30 June 2012 was US$1 : 0.9968. Quoted prices and volume weighted average price of shares are expressed in Australian Dollars. Key Remuneration Principles
The Company reviewed its remuneration practices and introduced a new Employee Incentive Scheme (Incentive Scheme) during 2011. Remuneration levels of all roles throughout the Company, including Executives and Non-Executive Directors were benchmarked. The objective of the Incentive Scheme is to provide sufficient incentives to attract and retain high calibre personnel and to promote a performance-driven culture throughout the organisation, in the best interests of the Company and its shareholders. This scheme was approved by Shareholders at the 2011 Annual General Meeting. The Incentive Scheme is designed to provide sufficient incentives to be competitive in the marketplace and to promote a performance-driven culture throughout the organisation. The Incentive Scheme was approved by Shareholders at the 2011 AGM and is based on the measurement of performance against short and long term targets which align closely with the strategy of the Company. The Board believes that this approach to remuneration, with significant percentages of remuneration being performance related, is the best approach to achieve alignment of employee performance with the corporate goals and the objectives of Shareholders. Following the shift of Molopo’s strategy to focus on North American oil and gas, as communicated to Shareholders in April 2011, the majority of Molopo staff are now located in its Calgary, Alberta corporate office. The remuneration policies and practices therefore reflect a balance between the market practice in Canada where

MOLOPO ENERGY LIMITED DECEMBER 2012 ANNUAL REPORT
17
the majority of Molopo employees now reside, and the norms and practices in Australia, where the Company is domiciled and where the majority of its Shareholders are based. During the year ended 30 June 2012, the Remuneration and Nomination Committee again reviewed the Incentive Scheme and obtained external advice. As a result, minor changes were implemented in June 2012. The revised Scheme was approved by shareholders at the November 2012 AGM. All employees are eligible for participation in the Incentive Scheme. Consultants and Non-Executive Directors are not eligible. The Incentive Scheme has short and long term components:
Component Elements Award type Award/Vesting Schedule
Short Term Incentive Plan (STIP)
Cash STIP Cash
Performance period: 1 January to 31 December of the relevant year. Award is paid during the Jan-Mar Quarter post assessment.
Deferred Equity STIP
Equity in the form of “Performance Share Rights” (PSRs)
Performance period: 1 January – 31 December of the relevant year. Deferred STIP PSRs are issued in the subsequent Jan-Mar Quarter. Deferred STIP PSRs vest in three equal tranches at one, two and three years after the close of the respective STIP performance period.
Long Term Incentive Plan (LTIP) LTIP
Equity in the form of “Performance Rights” (PRs)
Performance period: 36 months from 1 January to 31 December three years later. LTIP PRs are issued at the start of the 36 month LTIP performance period. LTIP PRs are tested and are eligible for vesting in the three months post the close of the LTIP performance period.
Under the Short Term Incentive Plan (STIP), employees have the ability to earn an annual bonus representing a fixed percentage of their base salary dependent on their performance against agreed yearly targets or key performance indicators (KPIs). The maximum bonus percentage available for each employee varies according to the level of seniority of the employee and their principal location of employment. The STIP award comprises two components: Cash and Deferred Equity in the form of Performance Share Rights (PSRs). The intention of the Long Term Incentive Plan (LTIP) is to encourage employees to focus on longer term Company performance in alignment with shareholders’ interests. A key principle of this scheme is that employees at all levels have the ability to influence the overall company performance, to varying degrees dependent on the role. The purpose of the LTIP is also to aid in retention of employees, to further align the interests of employees and the Company and its shareholders, and finally to deliver a competitive remuneration package in line with the Company’s target market position. The LTIP award will be in the form of Performance Rights (PRs) and the performance period will be thirty six months commencing on January 1 of the year it is initially awarded. The PRs are performance tested and vest at the end of this thirty six month period. No re-testing is permitted. Where an employee commences after 1 January in a particular year, an LTIP award is granted upon the commencement of employment for the relevant employee on a pro-rata basis to ensure that all employees are aligned in achieving common goals from commencement. The initial allocation of LTIP PRs to a participating employee will represent the maximum possible number of shares that the employee could receive at the end of the performance period. However, the number of PRs that vest at the end of the performance period will be determined according to future business performance. Each LTIP PR is eligible for vesting into between 0 and 100 shares, dependent upon the extent of satisfaction of performance criteria. The maximum LTIP available for each employee varies according to the level of seniority of the employee and their principal location of employment.

MOLOPO ENERGY LIMITED DECEMBER 2012 ANNUAL REPORT
18
Termination Where an employee resigns or is terminated for any reason, they will retain all equity which has already vested. Where an employee is terminated as a result of redundancy, death or disability or any other reason determined by the Board to be exceptional (deemed to be “Good Leaver”):
• In respect of any unvested sign-on, transitional and/or STI PSRs, the employee will retain that unvested equity which will continue to be subject to the terms of the award, including the vesting periods and performance conditions (other than any performance condition that requires the participant to remain an employee); and
• In respect of LTIP PRs, the number of unvested LTIP PRs outstanding will be pro-rated to reflect the number of months that the participant was employed by the Company during the vesting period. The balance of the unvested LTIP PRs will be cancelled. The remaining unvested LTIP PRs will continue to be subject to the terms of the initial award, including with respect to the vesting periods and performance conditions.
Notwithstanding the above, as approved by shareholders at the 2011 and 2012 AGMs, the Board may accelerate the vesting of some or all unvested PSRs whether or not the performance conditions have been met. Such discretion is not expected to be routinely exercised, and has not been exercised by the Board in respect of any employees. Where an employee resigns from the Company, or is terminated and is not considered to be a Good Leaver, all unvested equity will be cancelled. Change of Control In a change of control scenario, where an employee is offered new or continued employment with the proposed acquirer (whether or not the offer of employment is accepted) and replacement equity is to be provided (or would have been provided had the employee accepted the offer of employment) by the new acquirer upon completion of the transaction, vesting of the relevant employee’s unvested equity will not be accelerated and any unvested equity will be cancelled. Where the above does not transpire, the Board will exercise its discretion to accelerate vesting of unvested sign-on, transitional and deferred STI performance share rights. Performance testing of any outstanding LTIP PRs will be undertaken, and vesting will be accelerated to the extent that the performance conditions are satisfied. As the majority of Molopo’s employees, and all current executive KMP are based in North America, the approach in relation to change of control, including in respect of the long term incentive, is in line with North American practice and is considered by the Board to be required to ensure the Company’s competitiveness to attract and retain talent in that market. Clawback of unvested equity The Board, in its absolute discretion, may cancel any unvested equity of an employee in the event that the employee has engaged in fraud or wilful misconduct which results in or contributes to, a material restatement of Molopo’s reserves or financial results. Dilution limits The Employee Incentive Scheme contains a 5% dilution limit, which mirrors the ASIC Class Order 03/184. However, the exceptions under this Class Order mean that Molopo is unlikely to ever reach the 5% limit, due to majority of its employees being outside of Australia. As a result, Molopo has also introduced a 10% limit on total unvested equity outstanding under the Employee Incentive Scheme compared with the number of shares on issue, with no exceptions to this limit. This limit reflects market practice in North America, where the proportion of remuneration which is paid in equity is significantly higher than market practice in Australia.

MOLOPO ENERGY LIMITED DECEMBER 2012 ANNUAL REPORT
19
Executive KMP: Performance related components in Total Remuneration The CEO and Executive team located in Calgary, Canada and the Performance Related component of their Total Remuneration is shown in the table below. FIXED PERFORMANCE RELATED
Fixed Performance Related Base
Salary STIP –
Cash STIP –
PSRs LTIP – LTIP
PRs CEO Based on achieving
“On Target” 34% 15% 25.5% 25.5% 34% 66%
Based on achieving “Outstanding” (maximum) 25% 17% 29% 29%
25% 75%
Executives Based on achieving “On Target” 43% 17% 20% 20% 43% 57%
Based on achieving “Outstanding” (maximum) 34% 20% 23% 23%
34% 66%
There are no individual incentive limits beyond the maximum bonus potential shown in the table above. Performance Related Pay FY2012
No performance related pay for the calendar year 2012 has been included in the Remuneration Tables that follow as the amounts were not determined or paid prior to 31 December 2012.
Bonuses have been awarded and paid for calendar year 2012 in February 2013 in accordance with the Employee Incentive Scheme and were based on assessed performance against agreed performance measures. There were no discretionary bonuses awarded during the year. Performance was assessed as ranging between 0 and 1.5 in increments of 0.1, with 0.5 representing satisfactory performance, 1 representing good performance and 1.5 reflecting outstanding performance.
The overall STIP award across the Company for the January-December 2012 period was:
2012 Award
Actual award as percentage of
maximum possible award
CEO 0.1 8%Executives 0.3 17%All employees 0.5 37%Overall 0.3 21% STIP Targets - Calendar Year 2012 For calendar year 2012, the STIP targets by which the CEO and senior management performance have been measured were developed by the Remuneration and Nomination Committee with the Executive team and represented stretching yet achievable targets in line with shareholder interests. The calendar year 2012 STIP grid, including the targets and amounts awarded is shown below. Description Weight Target AwardedAnnual Production (BOEPD) 25.0% 1,085 - Operating Costs1 ($ millions) 7.5% 7.4$ 11.3%Net General and Administrative costs ($ millions) 7.5% 14.3$ 11.3%Finding & Development costs (F&D)($/BOE)2 20.0% 30$ 0.0%Relative Total Shareholder Return (Quartile) 25.0% 50th % 0.0%Board Discretion 15.0% TBD 7.5%Total 100.0% 30.1%

MOLOPO ENERGY LIMITED DECEMBER 2012 ANNUAL REPORT
20
1Operating costs are the costs required to operate the producing wells. 2F&D will be based on reserve assignments to the wells at calendar year 2012. Development costs divided by additional reserve volumes added during the year. Performance Targets STIP Targets - Calendar Year 2013 For calendar year 2013, the STIP targets by which the CEO and senior management performance will be measured are still being developed by the Remuneration and Nomination Committee and will be finalised subsequent to completion of the strategic review being undertaken by the Special Committee. LTIP Targets January 2012 - December 2014 The assessment for the LTIP performance period ending December 2014 will be based on two parameters, which are weighted equally:
• Relative Total Shareholder Returns as compared to peers; and • Production Target
Relative Total Shareholder Returns Company’s TSR relative to the TSR of the Comparator Group over the performance period
Performance Measure
<50th percentile 0 50th percentile 0.25 51st - 74th percentile 0.26 to 0.49 on a pro-rata basis >= 75th percentile 0.51
1Note that 0.5 represents outstanding performance (maximum vesting of this portion of LTIP). Relative TSR Comparator Group
The criteria for the selection of the peer group is at least 20 comparator companies listed on the ASX and/or the TSX which are in the same size range as Molopo and have as comparable assets and geographical focus to Molopo as possible.
Where companies in the peer group cease to exist or are no longer peers of Molopo, the Board retains discretion to change the peer group to reflect an appropriate comparison.
For the performance period ending 31 December 2014, the peer group has been determined as:
1. Antares Energy (ASX:AZZ) 11. Storm Resources (TSX:SRV)2. Eureka Energy (ASX:EKA)1 12. Second Wave Petroleum Inc (TSX:SCS)3. DeeThree Exploration (TSX:DTX) 13. Texon Petroleum (ASX:TXN)4. Red Fork Energy (ASX:RFE) 14. Arsenal Energy Inc (TSX:AEI)5. Maverick Drilling (ASX:MAD) 15. Exall Energy Corporation (TSX:EE)6. Nimin Energy Corp (TSX:NNN) 16. Amadeus Energy (ASX:AMU)7. Samson Oil & Gas (ASX:SSN) 17. Crocotta Energy Inc (TSX:CTA)8. Renegade Petroleum (TSX:RPL) 18. Spartan Oil (TSX:STO)9. Rock Energy Inc (TSX:RE) 19. Vero Energy Inc (TSX:VRO)1
10. Sundance Energy (ASX:SEA) 20. Artek Exploration Ltd (TSX:RTK)
1. Eureka Energy and Vero Energy have been taken over subsequent to the list being developed and have been replaced with Austex Oil Limited and Challenger Energy Inc.

MOLOPO ENERGY LIMITED DECEMBER 2012 ANNUAL REPORT
21
Production Target
At this stage of Molopo’s development, the Board and Remuneration and Nomination Committee considered that the critical strategic target for the Company is the transition from an exploration company to an “exploration and production” company. Alignment of the organisation to this strategic objective over the 2012-2014 performance period is considered to be best achieved through setting of a production target as follows: Annualised Production (BOE/D) for CY2014
Performance Measure
< 2,500 boe/d 0 Between 2,500 and 6,000 boe/d 0 to 0.32 = 6,000 boe/d -On target 0.33 Between 6,000 and 7,000 boe/d 0.34 to 0.49 on a pro-rata basis = 7,000 boe/d - Stretch 0.51
1Note that 0.5 represents outstanding performance (maximum vesting of this portion of LTIP) Gateway
The Production Target hurdle is eligible for testing only where Molopo’s average Finding & Development cost over the three year performance period is less than C$30 per boe.
Conditions
The Production Target is based on a three year look forward and includes a number of critical assumptions. It can be adjusted up or down by the Board to reflect the significant changes in the anticipated capital program on which it is based or if a significant merger, acquisition or divestment is completed.
LTIP Targets January 2013 - December 2015 The assessment for the LTIP performance period ending December 2015 will be based on Relative Total Shareholder Returns as compared to peers. Relative Total Shareholder Returns Company’s TSR relative to the TSR of the Comparator Group over the performance period
Performance Measure
<50th percentile 0 50th percentile 0.50 51st - 74th percentile 0.51 to 0.99 on a pro-rata basis >= 75th percentile 1.01
1Note that 1.0 represents outstanding performance (maximum vesting of this portion of LTIP). Relative TSR Comparator Group
The criteria for the selection of the peer group is at least 20 comparator companies listed on the ASX and/or the TSX which are in the same size range as Molopo and have as comparable assets and geographical focus to Molopo as possible.
Where companies in the peer group cease to exist or are no longer peers of Molopo, the Board retains discretion to change the peer group to reflect an appropriate comparison.

MOLOPO ENERGY LIMITED DECEMBER 2012 ANNUAL REPORT
22
For the performance period ending 31 December 2015, the peer group has been determined as:
1. Antares Energy (ASX:AZZ) 11. Storm Resources (TSX:SRV)2. Austex Oil Limited (ASX:AOK) 12. Second Wave Petroleum Inc (TSX:SCS)3. DeeThree Exploration (TSX:DTX) 13. Texon Petroleum (ASX:TXN)4. Red Fork Energy (ASX:RFE) 14. Arsenal Energy Inc (TSX:AEI)5. Maverick Drilling (ASX:MAD) 15. Exall Energy Corporation (TSX:EE)6. Nimin Energy Corp (TSX:NNN) 16. Amadeus Energy (ASX:AMU)7. Samson Oil & Gas (ASX:SSN) 17. Crocotta Energy Inc (TSX:CTA)8. Renegade Petroleum (TSX:RPL) 18. Spartan Oil (TSX:STO)9. Rock Energy Inc (TSX:RE) 19. Challenger Energy Inc (TSX:VRO)10. Sundance Energy (ASX:SEA) 20. Artek Exploration Ltd (TSX:RTK)
Executive Remuneration Executive remuneration packages contain the following key elements:
a) Primary benefits – salary / fees, bonuses and non-monetary benefits;
b) Post-employment benefits including superannuation;
c) Equity including share options and performance share rights granted under employee incentive plans; and
d) Other benefits. Bonuses included in Remuneration During the six months ended 31 December 2012, no bonuses were paid to employees of Molopo. During the year ended 30 June 2012 bonuses were paid to certain employees of Molopo for the 2011 calendar year performance period. The recommendation for the payment of the bonuses and the determination of the amount paid to the employees were approved by the Board and payment was made in February 2012.

MOLOPO ENERGY LIMITED DECEMBER 2012 ANNUAL REPORT
23
Remuneration Table The following table discloses the remuneration of the key management personnel of the Group during the six months ended 31 December 2012: Post-employment Share-based paymentsSix Months ended Short-term benefits benefits Termi- Equity-settled31 December Salary & Other Super - nation Shares & Performance 2012 fees Bonus Benefits3 annuation Other benefits units Share Rights Total
$ $ $ $ $ $ $ $ $Non-Executive DirectorsG. Lewin 95,284 - - 8,576 - - - - 103,860M. Beck1 - - - - - - - - - G. Ross2 43,205 - - 1,616 - - - - 44,821B. Straub 41,544 - - - - - - - 41,544G. Cameron 38,114 - - 3,430 - - - - 41,544D. Engle 41,544 - - - - - - - 41,544Executive DirectorT. Granger 176,120 - 11,976 - - - - - 188,096Officers - P. Belliveau 125,800 - 7,283 - - - - - 133,083S. Ouellette 125,800 - 7,246 - - - - - 133,046Total 687,411 - 26,505 13,622 - - - - 727,538
Notes: 1. M. Beck is entitled to be paid a Director fee however has chosen not to receive this payment for the six months ended 31 December 2012. 2. Mr. Ross was not entitled to be paid a Director fee prior to election on November 22, 2012. Prior to his election, a consulting fee of
A$34,711 was paid (refer to Note 27 for further details on consulting fees). 3. Other Benefits include a perquisite allowance, car parking and mandatory payments required to be made on behalf
of Canadian employees. The following table discloses the remuneration of the key management personnel of the Group during the year ended 30 June 2012:
Post-employment Share-based paymentsYear ended Short-term benefits benefits Termi- Equity-settled30 June Salary & Other Super - nation Shares & Performance 2012 fees Bonus Benefits13 annuation Other benefits units11 Share Rights14 Total
$ $ $ $ $ $ $ $ $Non-Executive DirectorsG. Lewin1 333,495 - - 30,015 - - - - 363,510M. Beck2 - - - - - - - - - G. Ross3 91,397 - - - - - - - 91,397B. Straub 83,088 - - - - - - - 83,088G. Cameron 76,227 - - 6,861 - - - - 83,088D. Engle4 37,300 - - - - - - - 37,300Executive DirectorsT. Granger5,10 174,400 - 11,869 - - - - 152,956 339,225I. Gorman6,12 442,320 165,132 26,289 41,236 - 299,896 - 251,266 1,226,139Officers - P. Belliveau7,10 83,333 - 10,047 - - - - 128,959 222,339S. Ouellette8,10 83,333 - 10,047 - - - - 128,959 222,339S. Arrowsmith9,10,12 340,362 43,380 - 30,039 - 189,852 - 121,864 725,497Total 1,745,255 208,512 58,252 108,151 - 489,748 - 784,004 3,393,922
Notes: 1. G. Lewin received A$200,000 in Director fees and A$150,000 in consulting fees. 2. M. Beck is entitled to be paid a Director fee however has chosen not to receive this payment for the year ended 30 June 2012. 3. G. Ross is not entitled to be paid a Director fee. A consulting fee of A$88,000 was paid.

MOLOPO ENERGY LIMITED DECEMBER 2012 ANNUAL REPORT
24
4. D. Engle was appointed Director on 20 January 2012. 5. T. Granger was appointed Managing Director and CEO on 3 January 2012. 6. I. Gorman ceased as Executive Director and CEO on 2 January 2012. 7. P. Belliveau was appointed Chief Financial Officer on 1 March 2012. 8. S. Ouellette was appointed Chief Operating Officer on 1 March 2012. 9. S. Arrowsmith was appointed as Acting Chief Financial Officer on 15 June 2011 and Chief Financial Officer on 15 August 2011. He
ceased as Chief Financial Officer on 29 February 2012. 10. Performance Share Rights (PSRs) were issued as a sign-on bonus to key management personnel who joined the Company during the
year. These PSRs are not performance tested and will vest at the rate of one-third every 12 months from the date granted. 11. Performance Rights (PRs) were issued under the long term incentive program will be performance tested at December 31, 2014 and will
only vest at that time if certain performance thresholds are achieved. Given the uncertainty of meeting performance thresholds, no value has been assigned at this time.
12. PSRs were awarded to employees and executives in accordance with the 2011 short term portion of the Employee Incentive Scheme and as a one off award to bridge the gap created in adopting a new employee incentive scheme, in light of the fact that any long term incentive would not vest for three years.
13. Other Benefits include a perquisite allowance, spousal travel, car parking and mandatory payments required to be made on behalf of Canadian employees. .
14. The value of the PSRs was determined at grant date based upon the 20 day volume weighted average price of the shares prior to the grant.
Performance Share Rights, Performance Rights and Options granted to Key Management Personnel There were no PSRs, PRs or options granted to the key management personnel of the Group during the six months ended 31 December 2012. The following table discloses the Performance Share Rights and Performance Rights issued to the key management personnel of the Group during the year ended 30 June 2012:
Original Number of
PSRs Granted (Quantity)
Original Value of
PSRs Granted
$
Original Number of
PRs Granted ( Quantity)
PRs Cancelled
Minimum Value of PRs
Granted $
Maximum Value of
PRs Granted $
T. Granger 250,000 152,956 6,435 - - 393,709 I. Gorman 356,459 251,266 - - - - P. Belliveau 180,000 128,959 2,758 - - 168,741 S. Ouellette 180,000 128,959 2,758 - - 168,741 S. Arrowsmith 230,600 153,189 2,016 1,680 - 20,557
Time Vested Performance & Time Vested
No PSRs or PRs were issued prior to 1 July 2011. There were no options granted to the key management personnel of the Group during the year ended 30 June 2012. The key management personnel of the Group did not exercise any options or allow any options to lapse during the period ended 31 December 2012. Contracts of Employment Mr. Steve Cloutier Managing Director and Chief Executive Officer (appointed on 17 January 2013) Mr. Cloutier’s contract is an evergreen contract, and provides that the Company may terminate Mr. Cloutier’s employment for cause at any time without notice or any severance payment. The Company may terminate Mr. Cloutier’s employment without cause by giving six months’ notice of termination or in the alternative, by paying a lump sum amount equivalent to six months’ base salary. Where Mr. Cloutier suffers a material diminution in his functions, powers or duties or a change in his reporting relationship to the Board, he may, within 30 days of such material diminution elect to give 90 days’ notice that the employment is treated as being terminated at the end of that 90 day period. In such a case, the Company must pay Mr. Cloutier the equivalent of six months’ base salary. Mr. Cloutier may resign by giving the Company one month written notice.

MOLOPO ENERGY LIMITED DECEMBER 2012 ANNUAL REPORT
25
Other than Mr. Cloutier, the Company’s Executive Key Management Personnel as at the date of this report are:
• Mr. Paul Belliveau Chief Financial Officer (appointed on 1 March 2012)
• Ms Shannon Ouellette
Chief Operating Officer (appointed on 1 March 2012) The Company has an evergreen contract with each of Mr. Belliveau and Ms. Ouellette which provides that the Company may immediately terminate their employment for cause at any time. In this case, they are not entitled to notice (or payment in lieu of notice) or any severance payment. The Company may terminate their employment without cause by giving six months’ notice of termination or in the alternative, by payment of a lump sum amount equivalent to six months’ base salary plus 20% of that amount. They are required to give the Company one month notice of resignation. As other Executive Key Management Personnel noted in the Remuneration Table are no longer employed at the date of this report, summaries of their employment contracts are not provided. Non-Executive Director Remuneration Structure Non-executive director remuneration consists of base fees, other payments for additional services outside the scope of Board and Committee duties, and statutory superannuation contributions. Non-executive directors do not earn retirement benefits other than superannuation for Australian directors, are not entitled to any form of performance-related remuneration and do not participate in the employee incentive scheme. The remuneration table on page 23 shows the fees paid to non-executive directors during the six months ended 31 December 2012. In addition to these fees, non-executive directors are entitled to reimbursement of reasonable travel, accommodation and other expenses incurred in attending meetings of the Board, committees and shareholders, or while engaged on Molopo business. Non-executive directors are not entitled to compensation on termination of their directorships. Mr. Max Beck elected to waive his director fee during the six months ended 31 December 2012. Molopo’s Non-Executive Director fee cap is A$650,000 as approved by shareholders at the 2010 AGM. During the year ended 30 June 2012, the Chairman was paid a consultancy fee related to organisational design, implementation of Molopo’s revised strategy and the transition of management to North America. This consultancy arrangement and associated fee ceased on 30 June 2012. Prior to 22 November 2012, Mr. Glenn Ross was an alternate director and was not entitled to be paid a director fee by Molopo. A company related to Mr. Glenn Ross provided consultancy services prior to 22 November 2012 and received a fee for the provision of investor relations and associated services to Molopo. Details of the consultancy fees paid are available in the Remuneration Table on page 23 and in Note 27. Executive & Director Shareholdings The Company’s Executives (except the CEO) are required to hold the equivalent of at least 1 year’s base salary in Molopo shares, and the CEO must hold the equivalent of at least 2 years’. The shareholding can be accumulated over a five year period from the later of 1 January 2013 and the relevant executive’s commencement date. Where a holding is not accumulated by the required time, the relevant executive will be required to purchase shares to the minimum level. The minimum holding must be maintained. Directors, officers, employees and their related parties must not enter into transactions in products associated with shares or options in the Company that operate to limit the economic risk of holding the shares or options in the Company during a Prohibited Period, and must not enter into transactions in products associated with shares or options in the Company that operate to limit the economic risk of holding any unvested shares or options in the Company at any time.

MOLOPO ENERGY LIMITED DECEMBER 2012 ANNUAL REPORT
26
Directors, officers, employees and their related parties must not trade in any securities of the Company (including shares, options, contracts for difference, warrants, or derivatives) for speculative reasons or short-term gain. Directors’ Shareholdings The following table sets out each current Director’s relevant interest in shares, debentures, and rights or options in shares or debentures of Molopo or a related body corporate as at the date of this report:
Options Ordinary over Maximumshares ordinary LTI PRissued shares PSRs Shares1
No. No. No. No.G.Lewin 110,000 - - - S. Cloutier - - 500,000 1,029,071 M.Beck 8,403,952 - - - G. Ross 37,143 - - - B. Straub 50,000 - - - G. Cameron 45,000 - - - D. Engle 80,000 - - -
1) 10,291 Performance Rights (PRs) were issued that will vest if certain performance thresholds are achieved over a three year period. The number of shares ultimately issued could be nil to the maximum number.
Executive KMP’s Personal Shareholdings (excluding CEO)
The following table sets out each Executive KMP’s (excluding the CEO) current relevant interest in shares, debentures, and rights or options in shares or debentures of Molopo or a related body corporate as at the date of this report:
Options Ordinary over Maximumshares ordinary LTI PRissued shares PSRs Shares1
No. No. No. No.P. Belliveau 131,600 - 208,206 716,800 S. Ouellette 36,600 - 208,206 716,800
1) 7,168 Performance Rights (PRs) were issued that will vest if certain performance thresholds are achieved over a three year period. The number of shares ultimately issued could be nil to the maximum number.
Use of Remuneration Consultants The Remuneration and Nomination Committee uses external consultants to advise on matters relating to remuneration. However, no external consultants were utilised during the six months ended 31 December 2012. During the year ended 30 June 2012, Molopo utilised Hay Group data for Australia and South Africa and Mercer data for Canada to benchmark the salaries of employees within the Company. Also during the year ended 30 June 2012, Aon Hewitt was appointed by the Remuneration and Nomination Committee (Committee) to provide a recommendation regarding revisions to the LTIP component of Molopo’s Employee Incentive Scheme. Aon Hewitt’s report was provided direct to the Committee through the Committee’s Chairman. Aon Hewitt provided a statement to the Committee that the report had been prepared free from undue influence of any participant in the LTIP scheme. The Board of Directors confirms that it is therefore satisfied that there was no undue influence on the remuneration recommendation by members of Key Management Personnel to whom the recommendation relates.

MOLOPO ENERGY LIMITED DECEMBER 2012 ANNUAL REPORT
27
Signed in accordance with a resolution of the Directors.
Greg Lewin AM Chairman 28 March 2013 Melbourne

MOLOPO ENERGY LIMITED DECEMBER 2012 ANNUAL REPORT
28
Independence Declaration

MOLOPO ENERGY LIMITED DECEMBER 2012 ANNUAL REPORT
29
Independent Auditor’s Report

MOLOPO ENERGY LIMITED DECEMBER 2012 ANNUAL REPORT
30

MOLOPO ENERGY LIMITED DECEMBER 2012 ANNUAL REPORT
31
Consolidated Statement of Financial Position As at 31 December 2012
31 December Restated Restated1
2012 30 June 2012 1 July 2011Note US$000 US$000 US$000
CURRENT ASSETSCash and cash equivalents 18(a) 70,974 67,026 96,094Trade and other receivables 8 7,930 8,639 5,654Non financial assets held for sale 9 - 42,205 65,535TOTAL CURRENT ASSETS 78,904 117,870 167,283
NON-CURRENT ASSETSInvestments 30(f) 310 221 75,050Plant and equipment 10 565 314 374Exploration and evaluation assets 11 54,617 78,976 49,053Oil and gas properties 12 8,099 - - TOTAL NON-CURRENT ASSETS 63,591 79,511 124,477
TOTAL ASSETS 142,495 197,381 291,760
CURRENT LIABILITIESTrade and other payables 14 21,341 14,558 3,656Provisions 15 - 163 417Current tax payable - - 21,963Liabilities associated with non financial assets held for sale 9 - 553 589TOTAL CURRENT LIABILITIES 21,341 15,274 26,625
NON-CURRENT LIABILITIESProvisions 15 978 730 397Deferred tax liabilities 13 - - 8,829TOTAL NON-CURRENT LIABILITIES 978 730 9,226
TOTAL LIABILITIES 22,319 16,004 35,851
NET ASSETS 120,176 181,377 255,909
EQUITYShare capital 16 164,942 164,847 162,981Reserves 17 (55,299) (58,156) (47,473)Retained profits 10,533 74,686 140,401TOTAL EQUITY 120,176 181,377 255,909
Consolidated
(1) With effect from 1 July 2012, the directors of Molopo Energy Limited determined that the presentation currency of the Company and its subsidiaries will be US dollars (See Note 1(c)). As such, a third Consolidated Statement of Financial Position has been presented.
The above Consolidated Statement of Financial Position should be read in conjunction with the accompanying notes.

MOLOPO ENERGY LIMITED DECEMBER 2012 ANNUAL REPORT
32
Consolidated Statement of Comprehensive Income/(Loss) For the period ended 31 December 2012
Six Months RestatedEnded Year Ended
31 December 2012 30 June 2012Note US$000 US$000
Continuing operationsRevenue from the sale of gas and oil produced 4 2,418 - Cost of sales from revenue producing operationsOperating and transportation costs (815) - Gross profit from continuing operations 1,603 -
Interest and other revenue 4 294 2,021Loss on sale of assets 5 - (5,309)Administration expenses (1,506) (4,433)Impairment of assets and depletion 5 (63,048) (36,877)Depreciation expense 5 (50) (103)Salary and employee benefits expense 5 (2,506) (7,218)Legal, management and consulting fees (807) (1,661)Operating lease expense (359) (470)Restoration (finance) costs (11) (69)Share based payments 19(b) - (2,073)LOSS BEFORE INCOME TAX (66,390) (56,192)Income tax benefit from continuing operations 7 2,826 7,450 LOSS FROM CONTINUING OPERATIONS (63,564) (48,742)Discontinued operationLoss from discontinued operation net of income tax 6 (589) (16,973)LOSS FOR THE PERIOD (64,153) (65,715)
Consolidated
OTHER COMPREHENSIVE INCOME/(LOSS), NET OF TAX Foreign currency translation 17 2,868 (10,332)Investment fluctuation reserve 17 84 178Total other comprehensive income/(loss) for the period 2,952 (10,154)TOTAL COMPREHENSIVE LOSS (61,201) (75,869)
Basic loss per share 26 (0.26) (0.27)Diluted loss per share 26 (0.26) (0.27)
Loss Per Share from continuing operationsBasic loss per share 26 (0.26) (0.20)Diluted loss per share 26 (0.26) (0.20)
The above Consolidated Statement of Comprehensive Income/(Loss) should be read in conjunction with the accompanying notes.

Consolidated Statement of Changes in Equity For the period ended 31 December 2012
(US$000) (US$000) (US$000) (US$000) (US$000) (US$000)
At 1 July 2012 164,847 2,527 (29,768) (30,915) 74,686 181,377Loss for the period - - - - (64,153) (64,153)Other comprehensive income - - 2,868 84 - 2,952Total comprehensive income/(loss)for the period - - 2,868 84 (64,153) (61,201)
Transactions with owners intheir capacity as ownersShare based payments - - - - - - Share based payment transferred in/(out) 95 (95) - - - - Balance at 31 December 2012 164,942 2,432 (26,900) (30,831) 10,533 120,176
At 1 July 2011, Restated1 162,981 3,056 (19,436) (31,093) 140,401 255,909Loss for the year - - - - (65,715) (65,715)Other comprehensive income/(loss) - - (10,332) 178 - (10,154)Total comprehensive income/(loss)for the period - - (10,332) 178 (65,715) (75,869)
Transactions with owners intheir capacity as ownersIssue of share capital 153 (49) - - - 104Cancellation of share capital (831) - - - - (831)Share issue costs (9) - - - - (9)Share based payments - 2,073 - - - 2,073Share based payment transferred in/(out) 2,553 (2,553) - - - - Balance at 30 June 2012 164,847 2,527 (29,768) (30,915) 74,686 181,377
Ordinary shares
Share based payment reserve
Foreign currency translation
reserve
Investment fluctuation
reserve
Retained Profits/ (Accumulated
losses) Total equity
(1) With effect from 1 July 2012, the directors of Molopo Energy Limited determined that the presentation currency of the Company and its subsidiaries will be US dollars. Refer to Note 1(c) for further details.
The above Consolidated Statement of Changes in Equity should be read in conjunction with the accompanying notes.

MOLOPO ENERGY LIMITED DECEMBER 2012 ANNUAL REPORT
34
Consolidated Statement of Cash Flows For the period ended 31 December 2012
Six Months Restated
Ended Year Ended31 December 2012 30 June 2012
Note US$000 US$000
CASH FLOWS FROM OPERATING ACTIVITIESReceipts from customers 2,387 978Payments to suppliers and employees (5,756) (16,770)Interest received 229 1,058Interest paid - (13)Income tax recovered 2,826 - Income tax paid - (21,613)NET CASH USED IN OPERATING ACTIVITIES 18(b) (314) (36,360)
CASH FLOWS FROM INVESTING ACTIVITIESPurchase of equity investments - (528)Purchase of plant and equipment (359) (99)Payment for exploration, evaluation and oil and gas properties (38,566) (61,261)Proceeds from disposal of discontinued operations 9 42,583 - Proceeds from sale of equity investments - 73,734NET CASH PROVIDED BY INVESTING ACTIVITIES 3,658 11,846
CASH FLOW FROM FINANCING ACTIVITIESProceeds from share issues - 104Payment for share buyback - (1,035)Capital raising costs - (9)NET CASH USED IN FINANCING ACTIVITIES - (940)
NET INCREASE/(DECREASE) IN CASH HELD 3,344 (25,454)
OPENING CASH AND CASH EQUIVALENTS 67,026 96,094
Effect of exchange rate changes 604 (3,614)
CLOSING CASH AND CASH EQUIVALENTS 18(a) 70,974 67,026
Consolidated
The above Consolidated Statement of Cash Flows should be read in conjunction with the accompanying notes.

MOLOPO ENERGY LIMITED DECEMBER 2012 ANNUAL REPORT
35
Notes to the Consolidated Financial Statements 1. CORPORATE INFORMATION Molopo Energy Limited (“Molopo” or the “Company”) is a company incorporated and domiciled in Australia and listed on the Australian Securities Exchange (“ASX”). The consolidated financial report of the Company as at and for the six months ended 31 December 2012 comprises the Company and its subsidiaries (together referred to as the “Group”). Operations and Principal Activities The Group’s principal activities during the six months continued to be investment in exploration, appraisal, development and production of oil and gas. Registered Office and Principal Place of Business Suite 604, Level 6, 309 Kent Street, Sydney, New South Wales, Australia 2000 2. BASIS OF PREPARATION (a) Statement of compliance
The Financial Report is a general purpose financial report that has been prepared in accordance with the requirements of the Corporations Act 2001, Australian Accounting Standards (including Australian Accounting Interpretations) and other pronouncements of the Australian Accounting Standards Board (“AASB”). The consolidated Financial Report of the Group complies with International Financial Reporting Standards (“IFRS”) and interpretations adopted by the International Accounting Standards Board (“IASB”). The financial statements comprise the consolidated financial statements of the Group. For the purposes of preparing the consolidated financial statements, the Company is a for-profit entity. The Financial Report was authorised for issue on the date of signing the Directors’ Declaration.
(b) Basis of measurement The Financial Report has been prepared on a historical cost basis, except for available for sale non-financial assets, and investments which have been measured at fair value. The Financial Report is presented in United States (US) dollars and rounded to the nearest one thousand dollars.
(c) Changes in accounting policy and disclosures The Company announced on 29 November 2012 that it had elected to change its presentational currency from Australian dollars to US dollars effective 1 July 2012. The majority of the operational activities of the Group are conducted through its US subsidiary and these activities contribute to the majority of the Company’s revenue (other than interest). The majority of the Groups’ operating and capital expenditures are denominated in US dollars. As a result, the Board considers that the change in presentational currency will provide shareholders with a more consistent and meaningful reflection of the Company’s underlying performance. All current and comparative information in the Annual Financial Statements and Notes thereto are presented in US dollars (“$”) unless otherwise noted as being presented in Australian dollars (“A$”). Presentation currency translation differences are recorded as a foreign currency translation reserve within the equity section and the year-over-year differences recognised as other comprehensive income. In accordance with AASB 121, The Effect of Change in Foreign Exchange Rates, comparative figures for prior periods have been restated to the US presentation currency as outlined below:

Notes to the Consolidated Financial Statements (Continued)
MOLOPO ENERGY LIMITED DECEMBER 2012 ANNUAL REPORT
36
Historical assets and liabilities were translated from Australian to US dollars at the closing exchange rate of the corresponding balance sheet date. Contributed equity and retained earnings were translated at 1 July 2011 using the balance sheet rate. Historical retained earnings, income, expense, and cash flow figures were translated to US dollars using historical rates. The translation difference arising from the use of different translation rates is recorded in the foreign currency translation reserve.
(d) Significant Judgments and Key Assumptions The preparation of financial statements requires management to make judgments, estimates and assumptions that affect the application of accounting policies and the reported amounts of assets, liabilities, income and expenses. Actual results may differ from these estimates. Estimates and underlying assumptions are reviewed on an ongoing basis. Revisions to accounting estimates are recognised in the period in which the estimate is revised and in any future periods affected. In particular, information about significant areas of estimation uncertainty and critical judgments in applying accounting policies that have the most significant effect on the amount recognised in the financial statements are described in the following:
• Unit-of-Production Method of Depreciation/Amortisation
The Group uses the unit-of-production basis when depreciating/amortising oil and gas property assets, as described in Note 3, which results in a depreciation/amortisation charge proportional to the depletion of the anticipated remaining life of well production. Each item’s economic life, which is assessed annually, has due regard to both its physical life limitations and to present assessments of economically recoverable reserves of the producing well. These calculations require the use of estimates and assumptions.
• Capitalisation of Exploration and Evaluation Costs The application of the Group’s accounting policy for exploration and evaluation assets, as described in Note 3, requires management to make certain estimates and assumptions as to future events and circumstances, in particular, the assessment of whether economic quantities of reserves will be found. As new information becomes available, any such estimates and assumptions may change.
• Share Based Payments The Group measures the cost of equity settled transactions with employees by reference to the fair value of equity instruments at the date at which they are granted. The fair value is determined using an option pricing model for options, using the assumptions detailed in Note 19, and the twenty day volume weighted average price at the time of grant for performance share rights.
• Provision for Restoration Significant judgement is required in determining the provision for restoration as there are many factors that will affect the ultimate liability payable to rehabilitate wells. Factors that will affect this liability include future disturbances caused by the drilling of further wells, changes in regulations, price increases and changes in discount rates. When these factors change or become known in the future, such differences will impact the provision for restoration in the period in which they change or become known.
• Impairment of Non-Financial Assets The Group assesses whether there are indicators of impairment for each cash-generating unit on a half-yearly basis. Where an indicator of impairment exists, a formal estimate of the recoverable amount is made. These assessments require the use of estimates and assumptions such as discount rates, exchange rates, commodity prices, future operating development and sustaining capital requirements and operating performance. The carrying values are disclosed in Notes 9, 11 and 12.
• Taxation Judgement is required in assessing whether deferred tax assets and certain deferred tax liabilities are

Notes to the Consolidated Financial Statements (Continued)
MOLOPO ENERGY LIMITED DECEMBER 2012 ANNUAL REPORT
37
recognised in the Statement of Financial Position. Deferred tax assets, including those arising from unrecouped tax losses, capital losses and temporary differences, are recognised only where it is considered more likely than not that they will be recovered, which is dependent on the generation of sufficient future taxable profits. Assumptions about the generation of future taxable profits and repatriation of retained earnings depend on management's estimates of future cash flows. These depend on estimates of future production and sales volumes, operating costs, restoration costs, capital expenditure, and other capital management transactions. Judgements are also required about the application of income tax legislation. These judgements and assumptions are subject to risk and uncertainty, hence there is a possibility that changes in circumstances will alter expectations, which may impact the amount of deferred tax assets and deferred tax liabilities recognised on the Statement of Financial Position and the amount of other tax losses and temporary differences not yet recognised. In such circumstances, some or all of the carrying amounts of recognised deferred tax assets and liabilities may require adjustment, resulting in a corresponding credit or charge to the Statement of Comprehensive Income.
(e) New Accounting Standards and Interpretations The Group has chosen not to early-adopt any accounting standards that have been issued, but are not yet effective. Set out below is a summary of issued accounting standards, relevant to the Group, which are not yet effective and a description of their expected effect on the Group’s financial statements (if any).
Reference Title Details of New Standard/Amendment /Interpretation
Impact on
Group
Application date for the Group
AASB 10 Consolidated Financial Statements
Requires a parent to present consolidated financial statements as those of a single economic entity, replacing the requirements previously contained in AASB 127 Consolidated and Separate Financial Statements. The Standard redefines and clarifies the notion of control that is the basis for determining which entities should be incorporated on a line-by-line basis into the consolidated financial statements of a group.
(ii) 1 January 2013
AASB 11 Joint Arrangements Replaces AASB 131 Interests in Joint Ventures. Requires a party to a joint arrangement to determine the type of joint arrangement in which it is involved by assessing its rights and obligations and then account for those rights and obligations in accordance with that type of joint arrangement. Joint arrangements are either joint operations or joint ventures. A joint operation is a joint arrangement whereby the parties that have joint control of the arrangement (joint operators) have rights to the assets, and obligations for the liabilities, relating to the arrangement. Joint operators recognise their assets, liabilities, revenue and expenses in relation to its interest in a joint operation (including their share of any such items arising jointly). A joint venture is a joint arrangement whereby the parties that have joint control of the
(ii) 1 January 2013

Notes to the Consolidated Financial Statements (Continued)
MOLOPO ENERGY LIMITED DECEMBER 2012 ANNUAL REPORT
38
arrangement (joint venturers) have rights to the net assets of the arrangement. A joint venturer applies the equity method of accounting for its investment in a joint venture in accordance with AASB128 Investments in Associates and Joint Ventures (2011). Unlike AASB 131, the use of 'proportionate consolidation' to account for joint ventures is not permitted.
AASB 12 Disclosure of Interests in Other Entities
Requires the extensive disclosure of information that enables users of financial statements to evaluate the nature of, and risks associated with, interests in other entities and the effects of those interests on its financial position, financial performance and cash flows. Focuses on disclosures that would help users better assess the nature and financial effects of an entity’s involvement with other entities, and particularly enhances disclosures about consolidated entities and unconsolidated (off balance sheet) structured entities.
(i) 1 January 2013
AASB 128 Investments in Associates and Joint Ventures
This Standard supersedes AASB 128 Investments in Associates and prescribes the accounting for investments in associates and sets out the requirements for the application of the equity method when accounting for investments in associates and joint ventures. The Standard defines 'significant influence' and provides guidance on how the equity method of accounting is to be applied (including exemptions from applying the equity method in some cases). It also prescribes how investments in associates and joint ventures should be tested for impairment.
(ii)
1 January 2013
AASB 2011-7
Amendments to Australian Accounting Standards arising from the Consolidation and Joint Arrangements Standards
This standard makes amendments to a number of other standards arising from the above new Consolidation and Joint Arrangements Standards.
(ii)
1 January 2013
(i) The adoption of the new standard, amendment or interpretation will not have a material impact on the Group’s financial statements.
(ii) The Group has not yet determined the potential impact of this standard or amendment.
(f) Corporations Act 2001 Amendments
During the six months ended 31 December 2012 there have been no material amendments to the Corporations Act 2001 that the Group was required to adopt.

Notes to the Consolidated Financial Statements (Continued)
MOLOPO ENERGY LIMITED DECEMBER 2012 ANNUAL REPORT
39
3. SIGNIFICANT ACCOUNTING POLICIES (a) Principles of Consolidation
The consolidated financial statements are those of the consolidated entity, comprising Molopo Energy Limited (the parent entity) and all subsidiaries that Molopo Energy Limited controlled for the period ended December 31, 2012. Subsidiaries are all those entities over which the Group has the power to govern the financial and operating policies so as to obtain benefits from their activities. The accounts of the subsidiaries are prepared for the same reporting period as the parent entity, using consistent accounting policies. All intercompany balances and transactions, and unrealised profits arising from intra-consolidated entity transactions, have been eliminated in full. Full details pertaining to all subsidiaries are provided in Note 22. The acquisition of subsidiaries or a group of assets meeting the definition of a business are accounted for using the acquisition method of accounting. The acquisition method of accounting involves recognising at acquisition date, separately from goodwill, the identifiable assets acquired, the liabilities assumed and any non-controlling interest in the acquiree. The identifiable assets acquired and the liabilities assumed are measured at their acquisition date fair values.
(b) Segment Reporting The Group determines and presents operating segments (refer to Note 25) based on the information that is internally provided to the Board of Directors and the Executive Management Team (the chief operating decision makers). An operating segment is a component of an entity that engages in business activities from which it may earn revenues and incur expenses (including revenues and expenses relating to transactions with any of the Group’s other components) whose operating results are regularly reviewed by the entity's chief operating decision makers to make decisions about resources to be allocated to the segment, assess its performance and for which discrete financial information is available. Operating segments that meet the quantitative criteria as prescribed by AASB 8 are reported separately. However, an operating segment that does not meet the quantitative criteria is still reported separately where information about the segment would be useful to users of the financial statements. Information about other business activities and operating segments that are below the quantitative criteria are combined and disclosed in a separate category called “all other segments”.
(c) Foreign Currency Translation (i) Foreign currency transactions The individual financial statements of each group entity are presented in the currency of the primary economic environment in which the entity operates (its functional currency). The functional currency of the parent entity is Australian dollars. For the purpose of consolidated financial statements, the results and financial position of each group entity are expressed in US dollars, which is the presentation currency for the consolidated financial statements. Transactions in foreign currencies on initial recognition in the functional currency are recorded by applying to the foreign currency amount the spot exchange rate at the date of the transaction. At each statement of financial position date: • Foreign currency monetary items are reported using the closing exchange rate; • Non-monetary items which are measured in terms of historical cost in a foreign currency are translated
using the exchange rate at the date of the transaction; and • Non-monetary items which are measured at fair value in a foreign currency are translated using the

Notes to the Consolidated Financial Statements (Continued)
MOLOPO ENERGY LIMITED DECEMBER 2012 ANNUAL REPORT
40
exchange rate at the date when the fair value was determined. Exchange rate differences arising on the settlement of monetary items or on translating monetary items at exchange rates different from those at which they were initially translated during the period, or in previous financial statements, are recognised in profit or loss in the period in which they arise, with the exception of exchange rate differences arising on a monetary item that forms part of the net investment in a foreign operation which are recognised initially in a separate component of equity and recognised in profit or loss on disposal of the net investment. (ii) Foreign operations The following procedures are used in translating the results and financial position of foreign operations from their respective functional currencies to the Group’s presentation currency (US dollars): • Assets and liabilities at the closing rate at the balance sheet date; • Income and expense items at average monthly exchange rates; and • Exchange rate variations resulting from the translation are recognised in the foreign currency
translation reserve in equity.
(d) Cash and Cash Equivalents Cash and cash equivalents in the consolidated Statement of Financial Position comprise cash in hand and short-term deposits with an original maturity of three months or less that are readily convertible to known amounts of cash and which are subject to an insignificant risk of changes in value. For the purposes of the consolidated Statement of Cash Flows, cash and cash equivalents consist of cash and cash equivalents as defined above, net of any outstanding bank overdrafts. Bank overdrafts are included within interest-bearing loans and borrowings in current liabilities on the Statement of Financial Position.
(e) Trade and Other Receivables
Trade receivables are recognised initially at fair value (original invoice amount), less allowance for any uncollectible debts. An estimate for doubtful debts is made when collection of the full amount is no longer probable. Bad debts are written-off as incurred.
(f) Investments and Other Financial Assets
All regular way purchases or sales of financial assets are recognised and derecognised on a trade date basis. Regular way purchases or sales are purchases or sales of financial assets that require delivery of assets within the time frame established by regulation or convention in the marketplace. All recognised financial assets are subsequently measured in their entirety at either amortised cost or fair value, depending on the classification of the financial assets. i. Classification of financial assets Debt instruments that meet the following conditions are subsequently measured at amortised cost less impairment loss (except for debt investments that are designated as at fair value through profit or loss on initial recognition):
• the asset is held within a business model whose objective is to hold assets in order to collect contractual cash flows; and
• the contractual terms of the instrument give rise on specified dates to cash flows that are solely payments of principal and interest on the principal amount outstanding.
All other financial assets are subsequently measured at fair value.

Notes to the Consolidated Financial Statements (Continued)
MOLOPO ENERGY LIMITED DECEMBER 2012 ANNUAL REPORT
41
ii. Amortised cost and effective interest method The effective interest method is a method of calculating the amortised cost of a debt instrument and of allocating interest income over the relevant period. The effective interest rate is the rate that exactly discounts estimated future cash receipts (including all fees and points paid or received that form an integral part of the effective interest rate, transaction costs and other premiums or discounts) through the expected life of the debt instrument, or, where appropriate, a shorter period, to the net carrying amount on initial recognition. Income is recognised on an effective interest basis for debt instruments measured subsequently at amortised cost. Interest income is recognised in profit or loss and is included in the "investment income" line item. iii. Financial assets at fair value through other comprehensive income (“FVTOCI”)
On initial recognition, the Group can make an irrevocable election (on an instrument-by-instrument basis) to designate investments in equity instruments as at FVTOCI. Designation at FVTOCI is not permitted if the equity investment is held for trading.
A financial asset is held for trading if:
• it has been acquired principally for the purpose of selling it in the near term; or
• on initial recognition it is part of a portfolio of identified financial instruments that the Group manages together and has evidence of a recent actual pattern of short-term profit-taking; or
• it is a derivative that is not designated and effective as a hedging instrument or a financial guarantee.
Investments in equity instruments at FVTOCI are initially measured at fair value plus transaction costs. Subsequently, they are measured at fair value with gains and losses arising from changes in fair value recognised in other comprehensive income and accumulated in the investments revaluation reserve. The cumulative gain or loss will not be reclassified to profit or loss on disposal of the investments. The Group has designated all investments in equity instruments that are not held for trading as FVTOCI on initial application of IFRS 9 (see Note 17). Dividends on these investments in equity instruments are recognised in profit or loss when the Group’s right to receive the dividends is established in accordance with IAS 18 Revenue, unless the dividends clearly represent a recovery of part of the cost of the investment. Dividends earned are recognised in profit or loss and are included in the ‘investment income’ line item. iv. Financial assets at fair value through profit or loss (“FVTPL”)
Investments in equity instruments are classified as FVTPL, unless the Group designates an investment that is not held for trading as FVTOCI on initial recognition (see above). Debt instruments that do not meet the amortised cost criteria (see above) are measured at FVTPL. In addition, debt instruments that meet the amortised cost criteria but are designated as FVTPL are measured at FVTPL. A debt instrument may be designated as at FVTPL upon initial recognition if such designation eliminates or significantly reduces a measurement or recognition inconsistency that would arise from measuring assets or liabilities or recognising the gains and losses on them on different bases. The Group has not designated any debt instrument as at FVTPL. Debt instruments are reclassified from amortised cost to FVTPL when the business model is changed such that the amortised cost criteria are no longer met. Reclassification of debt instruments that are designated as FVTPL on initial recognition is not allowed.

Notes to the Consolidated Financial Statements (Continued)
MOLOPO ENERGY LIMITED DECEMBER 2012 ANNUAL REPORT
42
Financial assets at FVTPL are measured at fair value at the end of each reporting period, with any gains or losses arising on re-measurement recognised in profit or loss. The net gain or loss recognised in profit or loss is included in the ‘other comprehensive income and losses’ line item (Note 17) in the consolidated statement of comprehensive income/loss. Interest income on debt instruments as at FVTPL is included in the net gain or loss described above. Dividend income on investments in equity instruments at FVTPL is recognised in profit or loss when the Group’s right to receive the dividends is established in accordance with AASB 118 Revenue and is included in the net gain or loss described above. v. Foreign exchange gains and losses The fair value of financial assets denominated in a foreign currency is determined in that foreign currency and translated at the spot rate at the end of each reporting period. The foreign exchange component forms part of its fair value gain or loss. Therefore,
• for financial assets that are classified as FVTPL, the foreign exchange component is recognised in profit or loss; and
• for financial assets that are designated as FVTOCI, any foreign exchange component is recognised in other comprehensive income.
For foreign currency denominated debt instruments measured at amortised cost at the end of each reporting period, the foreign exchange gains and losses are determined based on the amortised cost of the financial assets and are recognised in the ‘other gains and losses’ line item in the consolidated statement of comprehensive income.
vi. Impairment of financial assets Financial assets that are measured at amortised cost are assessed for impairment at the end of each reporting period. Financial assets are considered to be impaired when there is objective evidence that, as a result of one or more events that occurred after the initial recognition of the financial assets, the estimated future cash flows of the asset have been affected. Objective evidence of impairment could include:
• significant financial difficulty of the issuer or counterparty; or
• breach of contract, such as a default or delinquency in interest or principal payments; or
• it becoming probable that the borrower will enter bankruptcy or financial re-organisation; or
• the disappearance of an active market for that financial asset because of financial difficulties. For certain categories of financial asset, such as trade receivables, that are assessed not to be impaired individually are, in addition, assessed for impairment on a collective basis. Objective evidence of impairment for a portfolio of receivables could include the Group’s past experience of collecting payments, an increase in the number of delayed payments in the portfolio past the average credit period of 60 days, as well as observable changes in national or local economic conditions that correlate with default on receivables. The amount of the impairment loss recognised is the difference between the asset’s carrying amount and the present value of estimated future cash flows reflecting the amount of collateral and guarantee, discounted at the financial asset’s original effective interest rate. The carrying amount of the financial asset is reduced by the impairment loss directly for all financial assets with the exception of trade receivables, where the carrying amount is reduced through the use of an allowance account. When a trade receivable is considered uncollectible, it is written off against the allowance account. Subsequent recoveries of amounts previously written off are credited against the

Notes to the Consolidated Financial Statements (Continued)
MOLOPO ENERGY LIMITED DECEMBER 2012 ANNUAL REPORT
43
allowance account. Changes in the carrying amount of the allowance account are recognised in profit or loss. If, in a subsequent period, the amount of the impairment loss decreases and the decrease can be related objectively to an event occurring after the impairment was recognised, the previously recognised impairment loss is reversed through profit or loss to the extent that the carrying amount of the investment at the date the impairment is reversed does not exceed what the amortised cost would have been had the impairment not been recognised. vii. Derecognition of financial assets The Group derecognises a financial asset only when the contractual rights to the cash flows from the asset expire, or when it transfers the financial asset and substantially all the risks and rewards of ownership of the asset to another entity. If the Group neither transfers nor retains substantially all the risks and rewards of ownership and continues to control the transferred asset, the Group recognises its retained interest in the asset and an associated liability for amounts it may have to pay. If the Group retains substantially all the risks and rewards of ownership of a transferred financial asset, the Group continues to recognise the financial asset and also recognises a collateralised borrowing for the proceeds received. On derecognition of a financial asset measured at amortised cost, the difference between the asset's carrying amount and the sum of the consideration received and receivable is recognised in profit or loss. On derecognition of a financial asset that is classified as FVTOCI, the cumulative gain or loss previously accumulated in the investments revaluation reserve is not reclassified to profit or loss, but is reclassified to retained earnings.
(g) Plant and Equipment Items of plant and equipment are measured at cost less accumulated depreciation and accumulated impairment losses. Cost includes expenditure that is directly attributable to the acquisition of the asset. Depreciation is provided on a straight line basis on all field plant and equipment at rates calculated to allocate the cost or valuation, less estimated residual value at the end of the useful lives of the assets, over those estimated useful lives. Office equipment and furniture & fixtures are provided on a diminishing value basis. The estimated useful lives for the current and comparative periods are as follows:
Plant & equipment 15 - 20 years
Office equipment 3 - 8 years
Furniture and fixtures
Motor Vehicles
3 - 8 years
5 - 8 years
(h) Oil and Gas Properties Oil and gas properties include oil and gas assets in development and predominantly in the production stage. Costs capitalised into this asset category include all costs directly associated with the drilling and completion of production wells. Costs arising from oil and gas property assets relating to an area of interest are carried forward to the extent that such costs, together with any costs arising from exploration and evaluation carried forward in respect of the area of interest, are expected to be recouped through successful exploitation of the area of interest, or alternatively, by its sale. Costs carried forward in respect of an area of interest that is abandoned are written off in the year in which the decision to abandon is made. Amortisation of oil and gas properties is provided using the units-of-production method. The basis of amortisation adopted is applied consistently from financial period to financial period. The rate of amortisation does not lag behind the rate of depletion of the economically recoverable reserves in the area

Notes to the Consolidated Financial Statements (Continued)
MOLOPO ENERGY LIMITED DECEMBER 2012 ANNUAL REPORT
44
of interest. In calculating amortisation charges, economically recoverable reserves and any development costs still to be incurred are reassessed annually. Amortisation charges are treated as forming part of the cost of production. To the extent that costs carried forward have been fully amortised and relate to facilities physically abandoned or of no further use, those costs and the related accumulated amortisation are written off in the appropriate asset and accumulated amortisation accounts.
(i) Non-current assets held for sale Non-current assets and disposal groups are classified as held for sale if their carrying amount will be recovered principally through a sale transaction rather than through continuing use. This condition is regarded as met only when the sale is highly probable and the non-current asset (or disposal group) is available for immediate sale in its present condition. Management must be committed to the sale, which should be expected to qualify for recognition as a completed sale within one year from the date of classification.
When the Group is committed to a sale plan involving loss of control of a subsidiary, all of the assets and liabilities of that subsidiary are classified as available for sale when the criteria described above are met, regardless of whether the Group will retain a non-controlling interest in its former subsidiary after the sale.
Non-current assets (and disposal groups) classified as available-for-sale are measured at the lower of their previous carrying amount and fair value less costs to sell.
(j) Exploration and Evaluation Assets Costs arising from exploration and evaluation activities are carried forward as an asset, when they are incurred in relation to separate areas of interest for which rights of tenure are current and in respect of which:
a. The costs are expected to be recouped through the successful development and exploitation of economically-recoverable reserves, or alternatively, through the sale of the area of interest; or
b. Exploration activities in the areas have not reached a stage that permits an assessment of the existence or otherwise of economically recoverable reserves, and significant operations in, or in relation to, the areas are continuing.
Included within exploration and evaluation assets are intangible exploration rights, which comprise identifiable exploration and evaluation assets acquired as part of a business combination and are recognised at fair value at date of acquisition. Exploration rights are attributable to specific areas of interest. When a decision is made to develop and produce from an area of interest, all past exploration and evaluation expenditure in respect of that area of interest is transferred to oil and gas property assets, where it is amortised over the life of the area of interest to which they relate on a unit-of-production basis. When an area of interest is abandoned or is not commercial viable, any accumulated costs in respect of that area are written off in the year the decision is made. The accumulated costs of each area of interest is reviewed at the end of each reporting period and upon transfer from exploration and evaluation assets to oil and gas property assets and accumulated costs are written off to the extent they are not expected to be recoverable in the future (i.e. considered impaired).
(k) Leased Assets The determination of whether an arrangement is or contains a lease is based on the substance of the arrangement and requires an assessment of whether the fulfilment of the arrangement is dependent on the use of a specific asset or assets and whether the arrangement conveys a right to use the asset. Leases in terms of which the Group assumes substantially all the risk and reward of ownership are classified as finance leases. Upon initial recognition the leased asset is measured at an amount equal to

Notes to the Consolidated Financial Statements (Continued)
MOLOPO ENERGY LIMITED DECEMBER 2012 ANNUAL REPORT
45
the lower of its fair value and the present value of the minimum lease payments. Subsequent to initial recognition, the asset is accounted for in accordance with the accounting policy applicable to the asset. Other leases are operating leases and are not recognised in the Group’s consolidated statement of financial position.
(l) Trade and Other Payables Liabilities for trade creditors and other payables are carried at cost, which is the fair value of the consideration to be paid in the future for the goods and services received, whether or not billed to the consolidated entity. Due to their short term nature they are not discounted. The amounts are unsecured and usually paid within 30 days of recognition. Payables to related parties are recognised and carried at the nominal amount. Interest is not taken up as income on any related party payables.
(m) Employee Benefits (i) Wages, salaries, annual leave and sick leave Liabilities for wages and salaries and annual leave expected to be settled within 12 months of the reporting date are recognised in respect of employees' services up to the reporting date. They are measured at the amounts expected to be paid when the liabilities are settled. Expenses for non-accumulating sick leave are recognised when the leave is taken and are measured at the rates paid or payable. (ii) Long service leave The liability for long service leave is recognised and measured as the present value of expected future payments to be made in respect of services provided by employees up to the reporting date using the projected unit credit method. Consideration is given to expected future wage and salary levels, experience of employee departures, and periods of service. Expected future payments are discounted using market yields at the reporting date on national government bonds with terms to maturity and currencies that match, as closely as possible, the estimated future cash outflows. (iii) Defined contribution superannuation plan Obligations for contributions to defined contribution plans are recognised as an employee benefit expense in the periods during which the services are rendered by employees. (iv) Share based payments The Group provides benefits to employees (including Executive Director) in the form of share based compensation, whereby employees render services in exchange for rights over shares. The Remuneration and Nomination Committee has approved the grant of options, performance share rights and performance rights as incentives to attract executives and to maintain their long term commitment to the Company. These benefits were awarded at the discretion of the board (equity-settled transactions). The costs of these equity-settled transactions are measured by reference to the fair value of the equity instruments at the date on which they are granted. The fair value of performance share rights granted is determined using the twenty day volume weighted average price (VWAP) of the Company’s shares immediately prior to grant date. The fair value of options granted is determined by using a Black-Scholes option pricing technique. The fair value of performance rights granted is also determined using the VWAP of the Company’s shares immediately prior to grant date. However, since a performance right can ultimately vest into nil to 100

Notes to the Consolidated Financial Statements (Continued)
MOLOPO ENERGY LIMITED DECEMBER 2012 ANNUAL REPORT
46
shares, an additional consideration is the current best estimate of the number of shares that will ultimately vest in three years based on performance factors. The costs of these equity-settled transactions is recognised, together with a corresponding increase in equity, over the period in which the performance and/or service conditions are fulfilled (the Vesting Period), ending on the date on which the relevant employees become fully entitled to the equity instrument (Vesting Date). At each subsequent reporting date until vesting, the cumulative charge to the income statement is the product of (i) the fair value at grant date of the award; (ii) the current best estimate of the number of equity instruments that will vest, taking into account such factors as the likelihood of employee turnover during the Vesting Period and the likelihood of non-market performance conditions being met and (iii) the expired portion of the Vesting Period. The charge to the income statement for the period is the cumulative amount as calculated above less the amounts already charged in previous periods. There is a corresponding credit to equity. Until an equity instrument has vested, any amounts recorded are contingent and will be adjusted if more or fewer equity instruments vest than were originally anticipated to do so. Any equity instrument subject to a market condition is considered to vest irrespective of whether or not that market condition is fulfilled, provided that all other conditions are satisfied. If the terms of an equity-settled award are modified, as a minimum, an expense is recognised as if the terms had not been modified. An additional expense is recognised for any modification that increases the total fair value of the share based payment arrangement, or is otherwise beneficial to the recipient of the award, as measured at the date of modification. If an equity-settled transaction is cancelled (other than a grant cancelled by forfeiture when the vesting conditions are not satisfied), it is treated as if it had vested on the date of cancellation, and any expense not yet recognised for the award is recognised immediately. However, if a new equity instrument is substituted for the cancelled award and designated as a replacement award on the date that it is granted, the cancelled and new equity instrument are treated as if they were a modification of the original award, as described in the preceding paragraph. The dilutive effect, if any, of outstanding options and performance share rights and performance rights is reflected as additional share dilution in the computation of diluted earnings per share.
(n) Provision for Restoration The Group recognises the present value of the estimated cost of legal and constructive obligations to restore operating locations in the period in which the obligation is incurred. Typically the obligation arises when the ground/environment is disturbed at the well location and is calculated on a site by site basis with reference to the actual work required. When the liability is initially recorded, the present value of the estimated cost is capitalised by increasing the carrying amount of the related oil and gas property asset. Over time, the discounted liability is increased for the change in the present value based on the discount rates that reflect the current market assessments and the risks specific to the liability. Additional disturbances or changes in rehabilitation costs will be recognised as additions or changes to the corresponding asset and rehabilitation liability when incurred. The unwinding of the effect of discounting the provision is recorded as a finance cost in the profit and loss section of the consolidated statement of comprehensive income/(loss). The carrying amount capitalised as a part of oil and gas properties is depreciated/amortised over the life of the related well.
(o) Issued capital Issued and paid up capital is recognised at the fair value of the consideration received by the Company.

Notes to the Consolidated Financial Statements (Continued)
MOLOPO ENERGY LIMITED DECEMBER 2012 ANNUAL REPORT
47
Transaction costs arising on the issue of ordinary shares are recognised directly in equity as a reduction of the share proceeds received.
(p) Revenue recognition Revenue is recognised and measured at the fair value of the consideration received or receivable to the extent that it is probable that the economic benefits will flow to the entity and the revenue can be reliably measured. The following specific recognition criteria must also be met before revenue is recognised: (i) Oil
Sales of oil relate to on-shore oil production in North America. Emulsion (water and oil) is produced directly from the oil wells and until the emulsion is treated at a battery, there is no saleable product. Once the emulsion is treated, the oil is trucked and sold to third parties at the oil plant. Revenue from oil sales is recognised when title and the risk and reward of ownership have been transferred to the customer at the oil plant.
(ii) Sales of Gas and Natural Gas Liquids (NGL’s) Sales of gas and NGL’s are recognised when title and the risk and reward of ownership have been transferred to a third party’s pipeline.
(iii) Interest Interest revenue is recognised on an accrual basis using the effective interest rate method.
(q) Income Tax
(i) Income Tax Income tax expense is comprised of current and deferred tax. Current and deferred taxes are recognised in profit or loss except to the extent that it relates to a business combination, or items recognised directly in equity or in other comprehensive income. Current tax is the expected tax payable or receivable on the taxable income or loss for the year, using tax rates enacted or substantively enacted at the reporting date, and any adjustment to tax payable in respect of previous years. Deferred tax is recognised in respect of temporary differences between the carrying amounts of assets and liabilities for financial reporting purposes and the amounts used for taxation purposes. Deferred tax is not recognised for the following temporary differences:
• The initial recognition of assets or liabilities in a transaction that is not a business combination and that affects neither accounting nor taxable profit or loss;
• Differences relating to investments in subsidiaries and associates and jointly controlled entities to the extent that it is probable that they will not reverse in the foreseeable future; and
• Taxable temporary differences arising on the initial recognition of goodwill.
Deferred tax assets are recognised for deductible temporary differences and carry-forward unused tax losses and unused tax credits, to the extent that it is probable that taxable amounts will be available against which the deductible temporary differences, carry-forward unused tax losses and unused tax credits can be utilised. The carrying amount of deferred tax assets is reviewed at each reporting date and reduced to the extent that it is no longer probable that sufficient taxable amounts will be available to allow all or part of the deferred tax asset to be utilised. Deferred tax assets may be subsequently recognised or past reductions reversed to the extent that it becomes probable that there will be sufficient taxable amounts to utilise the

Notes to the Consolidated Financial Statements (Continued)
MOLOPO ENERGY LIMITED DECEMBER 2012 ANNUAL REPORT
48
deferred tax asset. Deferred tax assets and liabilities are measured at the tax rates that are expected to apply to the period when the asset is realised or the liability is settled, based on tax rates and tax laws that have been enacted or substantively enacted at the reporting date. Deferred tax assets and deferred tax liabilities are offset only if a legally enforceable right exists to set off current tax assets against current tax liabilities and the deferred tax assets and liabilities relate to the same taxable entity and the same taxation authority. (ii) Tax consolidation legislation The Company and all its wholly-owned Australian resident entities, are part of a tax-consolidated group under Australian taxation law. As a consequence, all members of the tax-consolidated group are taxed as a single entity. Molopo Energy Limited is the head entity within the tax-consolidated group. Tax expense/income, deferred tax assets and deferred tax liabilities arising from temporary differences of the members of the tax-consolidated group are recognised in the separate financial statements of the members of the tax-consolidated group using the ‘separate taxpayer within group’ approach by reference to the carrying amounts in the separate financial statements of each entity and the tax values applying under consolidation. Current tax assets and liabilities and deferred tax assets and liabilities arising from unused tax losses and relevant tax credits of the members of the tax-consolidated group are recognised by the Company (as head entity of the tax-consolidated group). (iii) Tax funding arrangement
The head entity, in conjunction with other members of the tax-consolidated group, has entered into a tax funding arrangement which sets out the funding obligations of members of the tax-consolidated group in respect of tax amounts. Amounts are recognised as payable to or receivable by, the head entity and each member of the group in relation to any tax liability/asset assumed by the head entity.
(r) Goods and Services Tax (GST) Revenues, expenses and assets are recognised net of the amount of GST except:
i. where the GST incurred on a purchase of goods is not recoverable from the taxation authority, in which case the GST is recognised as part of the cost of acquisition of the asset or as an expense item as applicable; and
ii. receivables and payables are stated with the amount of the GST included.
The net amount of GST recoverable from, or payable to, the taxation authority is included as part of receivables or payables in the Consolidated Statement of Financial Position.
Cash flows are included in the Consolidated Statement of Cash Flows on a gross basis and the GST component of cash flows arising from investing and financing activities, which is recoverable from, or payable to, the taxation authority, are classified as operating cash flows. Commitments and contingencies are disclosed net of the amount of GST recoverable from, or payable to, the taxation authority.
(s) Earnings per share Basic earnings per share (EPS) is calculated by dividing the profit or loss attributable to ordinary shareholders of the Company by the weighted average number of ordinary shares outstanding during the period. Diluted EPS is determined by adjusting the profit or loss attributable to ordinary shareholders and the weighted average number of ordinary shares outstanding, adjusted for the effects of all dilutive potential

Notes to the Consolidated Financial Statements (Continued)
MOLOPO ENERGY LIMITED DECEMBER 2012 ANNUAL REPORT
49
ordinary shares, which comprise share options, Performance Share Rights and Performance Rights granted to employees.
(t) Impairment of Non-Financial Assets The carrying amounts of the Group’s non-financial assets are reviewed at each reporting date to determine whether there is an indicator of impairment. The Group conducts an annual internal review of asset values at each reporting period, which is used as a source of information to assess for any indicators of impairment. External factors, such as changes in expected economic conditions, are also monitored to assess for indicators of impairment. If any indication of impairment exists, an estimate of the asset's recoverable amount is calculated. For goodwill and intangible assets that have indefinite useful lives or that are not yet available for use, the recoverable amount is estimated each year at the same time. The recoverable amount is the higher of an asset's fair value less costs to sell and value in use. In assessing value in use, the estimated future cash flows are discounted to their present value using a discount rate that reflects the current market assessments of the time value of money and the risks specific to the asset. For the purposes of assessing impairment, assets are grouped at the lowest levels for which there are separately identifiable cash inflows that are largely independent of the cash inflows from other assets or groups of assets (cash-generating units, “CGU”). An impairment loss is recognised for the amount by which the carrying amount of an asset or its CGU exceeds its estimated recoverable amount. Impairment losses are recognised in the statement of comprehensive income/loss. Impairment losses in respect of CGUs are allocated first to reduce the carrying amount of any goodwill allocated to the units, and then to reduce the carrying amounts of the other assets in the unit on a pro-rata basis. Non-financial assets other than goodwill that suffered impairment are tested for possible reversal of the impairment whenever events or changes in circumstances indicate that the impairment may have reversed.
4. INTEREST AND OTHER INCOMESix Months Restated
Ended Year Ended31 December 2012 30 June 2012
US$000 US$000
Revenue from operating activitiesProceeds from the sale of gas produced1,2 1,211 - Proceeds from the sale of oil produced2 1,207 -
2,418 -
Other revenueInterest revenue 240 1,017Sundry income - 204Unrealised foreign exchange gain 54 800
294 2,021
Total revenues 2,712 2,021
Consolidated
Notes: 1. The Group's Queensland Bowen Basin gas assets and liabilities were reclassified as available-for-sale in 2011 and effective 1 July 2011, revenue and expense associated with these assets are presented as a discontinued operation. 2. During the year ended 30 June 2012, net production revenue (production revenue less royalties and operating costs), of $3.7 million was applied against exploration and evaluation expenditures as the properties in Saskatchewan and Texas were still in the evaluation stage. During the period ended December 31, 2012, net production revenue of $2.0 million was applied against exploration and evaluation expenditures related to the Texas properties that are still in the evaluation stage.

Notes to the Consolidated Financial Statements (Continued)
MOLOPO ENERGY LIMITED DECEMBER 2012 ANNUAL REPORT
50
5. EXPENSES AND LOSSESSix Months Restated
Ended Year Ended31 December 2012 30 June 2012
US$000 US$000
ExpensesAmortization of non-current assets 1,157 - Impairment - exploration assets1,2 61,891 36,877
63,048 36,877Depreciation of non-current assets: - Office furniture & equipment 50 86 - Plant & equipment - 17
50 103
Director and employee benefits expenses:Salaries and wages 2,062 5,246Superannuation 50 424Work-cover - 14Payments on cessation of employment 394 1,534
2,506 7,218
Share based payments - 2,073Total director and employee benefits expenses 2,506 9,291
LossesNet loss on sale assets - (5,309)
Consolidated
Notes: 1. At 31 December 2012 and 30 June 2012, the Company performed assessments as to whether any petroleum and natural gas assets had indicators of impairment. When indicators of impairment are identified, Molopo assesses the recoverable amount of the asset which is based on the estimated fair value, less cost to sell, as at the reporting date. The estimated fair value, less costs to sell, takes into account the most recent commodity price forecasts, expected future production and estimated costs of development. For the six months ended 31 December 2012, the Company recorded an impairment charge of $55.0 million related to its Wolfcamp shale oil play located in west Texas. The impairment charge was mainly due to poorer well performance than anticipated and high costs of drilling horizontal wells into the productive zones. For the six months ended 31 December 2012, the Company recorded an impairment charge of $6.9 million related to its biogenic gas play located in the Free State province of South Africa. The Company was granted a Production Right in November 2012 which requires $15 million of expenditures over the next three years. Although additional evaluation of the opportunity will be undertaken before the acreage is relinquished, the Company has determined that the project is uneconomic to develop at this time. 2. For the year ended 30 June 2012, the Company recorded an impairment charge of $36.9 million related to its Bakken unconventional oil play located in south east Saskatchewan. The impairment charges resulted from the determination that a significant amount of the Company’s acreage not being located in the economic Bakken oil sands.

Notes to the Consolidated Financial Statements (Continued)
MOLOPO ENERGY LIMITED DECEMBER 2012 ANNUAL REPORT
51
6. DISCONTINUED OPERATIONS In line with the Group’s strategy announced in April 2011, Molopo commenced the development of monetisation options of non-core assets. The Group’s Queensland Bowen Basin gas assets and liabilities were reclassified as held for sale in 2011 and effective 1 July 2011 is presented as a discontinued operation.
Six Months RestatedEnded Year Ended
31 December 2012 30 June 2012US$000 US$000
Results of discontinued operationRevenue - 744 Expenses - (1,051)Impairment expense of non financial assets held for sale - (23,809)Loss from operating activities - (24,116)Income tax benefit - 7,143Loss from operating activities, net of tax - (16,973)
Loss on sale of discontinued operation (589) - Income tax on loss on sale of discontinued operation - - Loss for the period (589) (16,973)
Cash flows used in discontinued operationsNet cash used in operating activities - (226)Net cash used in investing activities - (1,972)Net cash used in financing activities - - Net cash flows for the period - (2,198)
Consolidated

Notes to the Consolidated Financial Statements (Continued)
MOLOPO ENERGY LIMITED DECEMBER 2012 ANNUAL REPORT
52
7. INCOME TAX Six Months Restated
Ended Year Ended31 December 2012 30 June 2012
US$000 US$000
(a) Income Tax BenefitCurrent income tax benefit (2,826) (7,286)Adjustments for prior periods - 1,237
(2,826) (6,049)Deferred tax expense
- (8,544)Total Income Tax Benefit (2,826) (14,593)
Attributable to:Income tax benefit from continuing operations (2,826) (7,450)Income tax benefit from discontinued operations - (7,143)Total Income Tax Benefit (2,826) (14,593)
(b) Reconciliation between tax (benefit)/expense and pre-tax accounting profit
Loss from continuing operation (66,390) (56,192)Loss from discontinued operation - (24,116)Loss before income tax (66,390) (80,308)
Prima facie tax benefit on loss at 30% (30 June 2012: 30%) (19,917) (24,092)
- Non deductible expenses 7,249 2,123 - Deductions available under s40-880 of ITAA 1997 - (420)Effect of different tax rates of subsidiaries operating in other jurisdications - 1,173Recognition of previously unrecognised tax losses (2,826) - Adjustments recognised in the current year in relation to the current and deferred tax of prior years - 1,094Effect of change in unrecognised deferred taxes 12,668 5,287Other - 242Income tax benefit (2,826) (14,593)
Consolidated
Origination and reversal and recognition of temporary differences
Tax effect of items which are not deductible/(taxable) for income tax purposes:
Tax Consolidation Molopo Energy Limited and its Australian resident wholly-owned subsidiaries formed a tax consolidated group with effect from 1 July 2003. Molopo Energy Limited is the head entity of the tax consolidated group. Members of the tax consolidated group have entered into a tax sharing agreement that provides for the allocation of income tax liabilities between the entities should the head entity default on its tax payment obligations. No amounts have been recognised in the consolidated financial statements in respect of this agreement on the basis that the possibility of default is remote.

Notes to the Consolidated Financial Statements (Continued)
MOLOPO ENERGY LIMITED DECEMBER 2012 ANNUAL REPORT
53
8. TRADE AND OTHER RECEIVABLES31 December Restated Restated
2012 30 June 2012 1 July 2011US$000 US$000 US$000
Trade receivables 1,348 1,359 927Income taxes receivable 5,948 5,836 - Cash calls receivable from joint venture partners 44 51 - Interest and other receivables 6 924 3,941Prepayments 504 398 326GST and VAT credits 80 71 460
7,930 8,639 5,654
Consolidated
The Group’s exposure to credit and currency risk and impairment losses to trade and other receivables are disclosed in Note 30. 9. NON FINANCIAL ASSETS HELD FOR SALE In line with the Group's strategy announced in April 2011, Molopo commenced the development of monetisation options of non-core assets. The Group's Queensland, Bowen Basin gas assets and liabilities were reclassified as available-for-sale in 2011. On 1 November 2012, the Group completed the sale of its Queensland, Bowen Basin gas assets to a subsidiary of PetroChina International Investment Company Limited for proceeds of $42.6 million plus a working capital adjustment of $2.5 million. The carrying value of the Group's Queensland gas asset plus cost of disposal was $65.6 million. As a result, a $23.8 million impairment was recognised at 30 June 2012.
31 December Restated Restated2012 30 June 2012 1 July 2011
US$000 US$000 US$000
Non financial assets classified as held for salePlant and equipment - 4,133 4,311Oil and gas properties - 41,603 43,005Exploration and evaluation assets - 17,879 18,219
- 63,615 65,535Disposal costs - 2,021 -
- 65,636 65,535Impairment expense - (23,809) - Net exchange difference 378 -
- 42,205 65,535Liabilites associated non financial assets held for saleProvision for restoration - 553 589
- 553 589
Sales proceeds 42,583 - - Net carrying value (41,652) - - Net exchange difference (1,520) - - Loss on sale (589) - -
Consolidated

Notes to the Consolidated Financial Statements (Continued)
MOLOPO ENERGY LIMITED DECEMBER 2012 ANNUAL REPORT
54
10. PLANT AND EQUIPMENTFurniture & Office Plant &
Fixtures Equipment Equipment TotalUS$000 US$000 US$000 US$000
At 1 July 2011 RestatedGross carrying amount 78 517 105 700Accumulated depreciation (22) (246) (58) (326)Net book value 56 271 47 374
Year ended 30 June 2012Opening net book value 56 271 47 374Additions 42 56 - 98Disposal of assets - (8) - (8)Depreciation charge1 (20) (83) (17) (120)Net exchange difference (4) (18) (8) (30)Closing net book value 74 218 22 314
At 30 June 2012 RestatedGross carrying amount 115 501 87 703Accumulated depreciation (41) (283) (65) (389)Net book value 74 218 22 314
Period ended 31 December 2012Opening net book value 74 218 22 314Additions 295 67 - 362Disposal of assets (6) (51) - (57)Depreciation charge1 (19) (32) (8) (59)Net exchange difference 2 4 (1) 5Closing net book value 346 206 13 565
At 31 December 2012Gross carrying amount 406 521 86 1,013Accumulated depreciation (60) (315) (73) (448)Net book value 346 206 13 565
Note: 1. Of this expense $8,432 (30 June 2012: $16,144) has been capitalised to exploration expenditure.

Notes to the Consolidated Financial Statements (Continued)
MOLOPO ENERGY LIMITED DECEMBER 2012 ANNUAL REPORT
55
11. EXPLORATION AND EVALUATION ASSETS31 December Restated
2012 30 June 2012US$000 US$000
Carrying amount at 1 July Restated 78,976 49,053Additions 45,159 59,985Acquisition of exploration and evaluation assets - 10,071Impairment (61,891) (36,877)Assets transferred to Oil and Gas Properties (8,341) - Net exchange difference 714 (3,256)Carrying amount at end of period 54,617 78,976
The ultimate recoupment of costs carried forw ard for exploration and evaluation activities is dependent on the successful development and commercial exploitation or sale of the respective area.
Consolidated
At 31 December 2012 and 30 June 2012, the Company performed assessments as to whether any exploration and evaluation assets had indicators of impairment. When indicators of impairment are identified, Molopo assesses the recoverable amount of the asset which is based on the estimated fair value, less cost to sell, as at the reporting date. The estimated fair value, less costs to sell, takes into account the most recent commodity price forecasts, expected future production and estimated costs of development. For the six months ended 31 December 2012, the Company recorded an impairment charge of $6.9 million related to its South Africa biogenic gas play located in the Free State province of South Africa. The Company was granted a Production Right in November 2012 which requires expenditures of $15 million of over the next three years. Although additional evaluation of the opportunity will be undertaken before the acreage is relinquished, the Company has determined that the project is uneconomical to develop at this time. For the six months ended 31 December 2012, the Company recorded an impairment charge of $55.0 million related to its Wolfcamp shale oil play located in west Texas. The impairment charge was mainly due to poorer well performance than anticipated and high costs of drilling horizontal wells into the productive zones. The Company assessed the recoverable amount of the applicable CGU based on the estimated fair value less costs to sell as at December 31, 2012. For the year ended 30 June 2012, the Company recorded an impairment charge of $36.9 million related to its Bakken unconventional oil play located in south east Saskatchewan. The impairment charges resulted from the determination that a significant amount of the Company’s acreage not being located in the economic Bakken oil sands.

Notes to the Consolidated Financial Statements (Continued)
MOLOPO ENERGY LIMITED DECEMBER 2012 ANNUAL REPORT
56
12. OIL AND GAS PROPERTIES31 December Restated
2012 30 June 2012US$000 US$000
Cost 9,256 - Accumulated amortisation and impairment (1,157) -
8,099 -
Carrying amount at 1 July - - Assets transferred from Exploration and Evaluation 8,341 - Additions 743 - Amortisation charge (1,157) - Impairment - - Net exchange difference 172 - Carrying amount at end of period 8,099 -
Consolidated
13. DEFERRED TAX ASSETS AND LIABILITIES Deferred Tax Assets and Liabilities are attributable to the following: Consolidated
31 December Restated 31 December Restated 31 December Restated2012 30 June 2012 2012 30 June 2012 2012 30 June 2012
US$000 US$000 US$000 US$000 US$000 US$000Receivables - - - - - - Prepayments - - - - - - Production costs (at cost) - - - - - - Exploration and evaluation assets - 914 - (11,463) - (10,549)Intangible exploration rights - - - - - - Payables - - - - - - Provisions - - - - - - Recognised tax losses - 10,549 - - - 10,549Other - - - - - - Net tax assets/(liabilities) - 11,463 - (11,463) - -
Assets Liabilities Net
Unrecognised deferred tax assets In relation to foreign subsidiaries in South Africa and USA, deferred tax assets arising from tax losses have not been recognised. Franking account
31 December Restated Restated2012 30 June 2012 1 July 2011
US$000 US$000 US$000
15,246 15,014 15,575The balance of the Company's franking account is a franking credit balance of:
Consolidated

Notes to the Consolidated Financial Statements (Continued)
MOLOPO ENERGY LIMITED DECEMBER 2012 ANNUAL REPORT
57
14. TRADE AND OTHER PAYABLES31 December Restated Restated
2012 30 June 2012 1 July 2011US$000 US$000 US$000
Trade creditors 7,673 2,814 1,827Other creditors & accruals 12,972 11,737 1,730GST & Withholding tax payable 696 7 99
21,341 14,558 3,656
Terms & Conditions:Trade creditors are non-interest bearing and are normally settled on 30 day terms.
Consolidated
15. PROVISIONS
31 December Restated Restated2012 30 June 2012 1 July 2011
US$000 US$000 US$000
CURRENTEmployee entitlements - 163 417
NON-CURRENTEmployee entitlements - 4 116Provision for restoration 978 726 281
978 730 397
Provision for restoration (Non-Current)Opening balance 726 270 1,690Additional restoration provision 241 387 1,066Accretion 11 69 34Well rehabilitation disposed - - (1,740)Liabilities transferred to non-financial assets held for sale - - (572)Finance costs - - (18)Net exchange difference - - (190)Closing balance 978 726 270
Consolidated
The provision for restoration costs are specific estimates of costs the Group is likely to incur on a per well basis. The nature of restoration costs anticipated to be incurred include rig hire costs, cement costs for plugging wells, earthworks and general landscaping costs. The estimated costs of rehabilitating each well are indexed for inflation over the projected life of each well. The resultant estimates are then discounted back to their present value using a risk free rate. These estimates take into account the depths of each individual well drilled to date.
These payments are expected to be made over the next 15 years with the majority of costs to be incurred between 2024 and 2030. At December 31, 2012, a risk-free rate of 2.3 percent (June 30, 2012 – 2.7 percent) and an inflation rate of 2 percent were used to calculate the net present value of the restoration provision.

Notes to the Consolidated Financial Statements (Continued)
MOLOPO ENERGY LIMITED DECEMBER 2012 ANNUAL REPORT
58
16. SHARE CAPITAL31 December Restated
2012 30 June 2012US$000 US$000
(a) Issued and paid-up capitalOrdinary shares fully paid 164,942 164,847
(b) Movements in shares on issueBalance at beginning of the period 164,847 162,981PSRs vested and issued 95 - Options exercised at a price of $0.334 - 104PSRs vested but settled in cash - 49PSRs voided - (49)On market share buyback - cancellation of shares - (782)Share based payment reserve transferred in - 2,553Less cost of capital raising - (9)
164,942 164,847
(c) Share Capital Movement (Number of Shares)
On Issue 1 July 245,579,810 246,225,729PSRs vested and issued 269,901 - Exercise of share options - 300,000Cancellation of shares - (945,919)On Issue 245,849,711 245,579,810
Consolidated
(d) Terms and conditions of contributed equity Ordinary shares - There are 245,849,711 ordinary fully paid shares on issue (30 June 2012: 245,579,810). The Company has unlimited authorised capital with no par value. Ordinary shares entitle the holder to the right to receive dividends as declared and, in the event of winding up the Company, to participate in the proceeds from the sale of all surplus assets in proportion to the number of and amounts paid up on shares held. Ordinary shares entitle their holder to one vote, either in person or by proxy, at a meeting of the Company. (e) Share Options and Performance Share Rights In relation to share options and performance share rights over ordinary shares refer to Note 19 for full details of the unlisted Employee Incentive Options, Performance Share Rights and Performance Rights held at the end of the financial period.

Notes to the Consolidated Financial Statements (Continued)
MOLOPO ENERGY LIMITED DECEMBER 2012 ANNUAL REPORT
59
17. RESERVES
(US$000) (US$000) (US$000) (US$000)
At 1 July 2012 2,527 (29,768) (30,915) (58,156)
Other comprehensive income/(loss) - 2,868 84 2,952Share based payment reserve transferred out (95) - - (95)
Balance at 31 December 2012 2,432 (26,900) (30,831) (55,299)
At 1 July 2011 Restated 3,056 (19,436) (31,093) (47,473)
Other comprehensive income/(loss) - (10,332) 178 (10,154)Issue of share capital (49) - - (49)Share based payments 2,073 - - 2,073
(2,553) - - (2,553)Balance at 30 June 2012 2,527 (29,768) (30,915) (58,156)
Share based payment reserve
Foreign currency
translation reserve Total
Investment fluctuation
reserve
Share based payment reserve transferred out
Share Based Payment Reserve The share based payment reserve comprises all vested but unexercised options and an amortised portion of the PSRs and PRs granted. Foreign Currency Translation Reserve The foreign currency translation reserve comprises all foreign currency differences, net of any tax, arising from the translation of the financial statements of foreign operations. During the financial period, variations between the US dollar and the Canadian and Australian dollars caused a decrease in the foreign currency translation reserve. Investment Fluctuation Reserve The investment fluctuation reserve comprises both market and currency movements and all present impairments or gains and losses on investments in equity instruments that are not held for trading. Dividends earned from such investments are recognised in profit or loss unless dividends clearly represent a recovery of part of the cost of the investment. For the period ended 31 December 2012 Change in Tax
Value (expenses) Net ofPrevious Period Note 30(f) benefit tax
(US$000) (US$000) (US$000) (US$000)
Shares held in Legacy Oil + Gas Inc.(1) (30,074) - - (30,074)Other investments (841) 84 - (757)
(30,915) 84 - (30,831)
For the year ended 30 June 2012 Restated
Shares held in Legacy Oil + Gas Inc. (29,401) (673) - (30,074)Other investments (1,692) 698 153 (841)
(31,093) 25 153 (30,915) (1) The Company disposed of its shares of Legacy Oil + Gas Inc. in February 2011.

Notes to the Consolidated Financial Statements (Continued)
MOLOPO ENERGY LIMITED DECEMBER 2012 ANNUAL REPORT
60
18. CASH FLOW STATEMENTSix Months Restated
Ended Year Ended31 December 2012 30 June 2012
US$000 US$000
(a) Reconciliation of cash
Cash balance comprises: - Cash at bank 70,823 66,880 - Short-term deposits 151 146Closing cash balance 70,974 67,026
(b) Reconciliation of the operating profit after tax to the netcash flows from operationsLoss after tax (64,153) (65,715)
Non-Cash ItemsLoss on sale of assets 589 5,309Amortisation of oil and gas properties 1,157 - Depreciation expense 50 103Unrealised foreign exchange (gains)/losses 54 (799)Share based payments - 2,073Impairment expense of exploration assets 61,891 60,686Non-cash expense/(income) - (100)
Adjust for changes in assets and liabilities(Increase)/decrease in trade and sundry debtors (3,544) (5,515)(Increase)/decrease in prepayments 158 (276)Increase/(decrease) in trade and sundry creditors 364 (285)Increase/(decrease) in accruals 3,635 (1,342)Increase/(decrease) in employee entitlements (316) (344)Increase/(decrease) in restoration 238 456Increase/(decrease) in current tax liability - (21,060)Increase/(decrease) in deferred tax liabilities - (8,946)Effect of exchange rate changes (437) (605)Net cash flows used in operating activities (314) (36,360)
Consolidated
19. SHARE BASED PAYMENTS (a) Employee Performance Share Rights and Performance Rights Scheme The Group has an ownership-based compensation scheme for employees. In accordance with the provisions of the scheme, the consolidated entity’s employees may be awarded Performance Share Rights (PSRs) and Performance Rights (PRs) in accordance with the rules of the Company’s Employee Incentive Scheme. Each PSR entitles the holder to one ordinary share upon the satisfaction of specified performance criteria. Each PR entitles the holder to up to 100 ordinary shares upon the satisfaction of specified performance criteria. PSR and PR holders do not have any right, by virtue of the performance share right, to participate in any share issue of Molopo or any related body corporate.

Notes to the Consolidated Financial Statements (Continued)
MOLOPO ENERGY LIMITED DECEMBER 2012 ANNUAL REPORT
61
Performance Share Rights There were no PSRs granted during the six months ended 31 December 2012. The following table discloses the number, nature and status of the PSRs outstanding during the six months ended 31 December 2012:
PSRs Outstanding
30 June 2012 PSRs Granted PSRs Vested PSRs Expired or Cancelled
PSRs Outstanding
31 December 2012
Transitional 423,620 - - (6,625) 416,995 Sign-on 1,615,717 - (132,041) (69,929) 1,413,747
867,494 - - (8,000) 859,494
Total 2,906,831 - (132,041) (84,554) 2,690,236
2011 Deferred Short Term Incentive
The following table discloses the number, nature and status of the PSRs offered during the year ended 30 June 2012:
PSRs Outstanding 1 July 2011 PSRs Granted PSRs Vested
PSRs Expired or Cancelled
PSRs Outstanding
30 June 2012Transitional - 784,747 (197,131) (163,996) 423,620 Sign-on - 1,615,717 - - 1,615,717
- 900,830 - (33,336) 867,494
Total - 3,301,294 (197,131) (197,332) 2,906,831
2011 Deferred Short Term Incentive
Transitional PSRs On 30 June 2011 the Board approved the offering of PSRs to all employees and executives as a one off award to bridge the gap created in adopting a new employee incentive scheme, in light of the fact that any long term incentive would not vest for three years. One third of the PSRs awarded to each employee or executive vested on 30 June 2012, with the remaining two thirds to vest equally on 30 June 2013 and 30 June 2014 provided the relevant employee or executive meets certain performance criteria in respect of each tranche and either remains an employee of the Company or is otherwise deemed to be a ‘good leaver’. Sign-on PSRs During the year ended June 30, 2012, the Board approved sign-on performance share rights to certain new employees and executives hired during the year. One third of the PSRs awarded will vest every 12 months from each employee’s or executive’s sign-on date. Deferred Short Term PSRs During the year ended 30 June 2012, the Board approved PSRs for employees and executives in accordance with the short term portion of the Employee Incentive Scheme. One third of the PSR’s awarded to each employee or executive will vest on each of 31 December 2012, 31 December 2013 and 31 December 2014 provided the relevant employee or executive meets certain performance criteria in respect of each tranche and either remains an employee of the Company or is otherwise deemed to be a ‘good leaver’.

Notes to the Consolidated Financial Statements (Continued)
MOLOPO ENERGY LIMITED DECEMBER 2012 ANNUAL REPORT
62
There were no PSRs granted during the six months ended 31 December 2012. The following PSR-based transactions occurred during the period ended 31 December 2012: 31 December 2012 Number Closing Fair Value
Date Vesting Opening Number Forefeited Balance at GrantGranted Date Balance Vested /Expired (Number) Date A$
Key Management PersonnelT. Granger 03/01/2012 03/01/2013 83,333 - - 83,333 0.61
03/01/2012 03/01/2014 83,333 - - 83,333 0.6103/01/2012 03/01/2015 83,334 - - 83,334 0.61
P. Belliveau 05/03/2012 05/03/2013 60,000 - - 60,000 0.72 05/03/2012 05/03/2014 60,000 - - 60,000 0.72
05/03/2012 05/03/2015 60,000 - - 60,000 0.72- -
S. Ouellette 01/03/2012 01/03/2013 60,000 - - 60,000 0.72 01/03/2012 01/03/2014 60,000 - - 60,000 0.72
01/03/2012 01/03/2015 60,000 - - 60,000 0.72-
I. Gorman 02/09/2011 30/06/2012 - - - - 0.7702/09/2011 30/06/2013 71,820 - - 71,820 0.7702/09/2011 30/06/2014 71,820 - - 71,820 0.7731/12/2011 31/12/2012 47,000 - - 47,000 0.6131/12/2011 31/12/2013 46,999 - - 46,999 0.6131/12/2011 31/12/2014 46,999 - - 46,999 0.61
S.Arrowsmith 15/08/2011 15/08/2012 59,800 59,800 - - 0.68
15/08/2011 15/08/2013 59,800 - - 59,800 0.6815/08/2011 15/08/2014 59,800 - - 59,800 0.6831/12/2011 31/12/2012 17,067 - - 17,067 0.6131/12/2011 31/12/2013 17,067 - - 17,067 0.6131/12/2011 31/12/2014 17,066 - - 17,066 0.61
1,125,238 59,800 - 1,065,438

Notes to the Consolidated Financial Statements (Continued)
MOLOPO ENERGY LIMITED DECEMBER 2012 ANNUAL REPORT
63
Other Personnel01/07/2011 30/06/2013 139,995 - 3,313 136,682 0.77
01/07/2011 30/06/2014 139,985 - 3,312 136,673 0.7701/07/2011 04/07/2012 18,729 18,729 - - 0.7701/07/2011 04/07/2013 18,728 - - 18,728 0.7701/07/2011 04/07/2014 18,728 - - 18,728 0.7718/07/2011 18/07/2012 53,512 53,512 - - 0.7618/07/2011 18/07/2013 53,512 - - 53,512 0.7618/07/2011 18/07/2014 53,511 - - 53,511 0.7631/12/2011 31/12/2012 225,105 - 2,667 222,438 0.6131/12/2011 31/12/2013 225,100 - 2,667 222,433 0.6131/12/2011 31/12/2014 225,091 - 2,666 222,425 0.6101/01/2012 01/01/2013 23,155 - - 23,155 0.6101/01/2012 01/01/2014 23,155 - - 23,155 0.6101/01/2012 01/01/2015 23,154 - - 23,154 0.6101/03/2012 01/03/2013 40,711 - - 40,711 0.7201/03/2012 01/03/2014 40,711 - - 40,711 0.7201/03/2012 01/03/2015 40,709 - - 40,709 0.7205/03/2012 05/03/2013 78,199 - 7,500 70,699 0.7205/03/2012 05/03/2014 78,198 - 7,500 70,698 0.7205/03/2012 05/03/2015 78,198 - 7,500 70,698 0.7211/04/2012 11/04/2013 15,810 - 15,810 - 0.6611/04/2012 11/04/2014 15,810 - 15,810 - 0.6611/04/2012 11/04/2015 15,809 - 15,809 - 0.6601/05/2012 01/05/2013 20,714 - - 20,714 0.6601/05/2012 01/05/2014 20,714 - - 20,714 0.6601/05/2012 01/05/2015 20,714 - - 20,714 0.6628/05/2012 28/05/2013 24,612 - - 24,612 0.5828/05/2012 28/05/2014 24,612 - - 24,612 0.5828/05/2012 28/05/2015 24,612 - - 24,612 0.58
Total Other Personnel 1,781,593 72,241 84,554 1,624,798
Total All Personnel 2,906,831 132,041 84,554 2,690,236 Performance Rights During the six months, the Board approved PRs for employees and executives in accordance with the 2012 long term portion of the Employee Incentive Scheme. These PRs will vest on 31 December 2014 provided the Company and the relevant employee or executive meets certain performance criteria in respect of each tranche, and remains an employee of the Company or is a ‘good leaver’. The following table discloses the number, nature and status of the PRs offered during the six months ended 31 December 2012:
PRs Outstanding
30 June 2012 PRs Granted PRs Vested PRs Expired or Cancelled
PRs Outstanding
31 December 2012
2012 Long Term Incentive 28,610 4,170 - (3,019) 29,761

Notes to the Consolidated Financial Statements (Continued)
MOLOPO ENERGY LIMITED DECEMBER 2012 ANNUAL REPORT
64
The following table discloses the number, nature and status of the PRs offered during the year ended June 30 2012:
PRs Outstanding 1 July 2011 PRs Granted PRs Vested
PRs Expired or Cancelled
PRs Outstanding
30 June 20122012 Long Term Incentive - 33,687 - (5,077) 28,610 The following table discloses the number, nature and status of the PRs, included in the above tables, held by Key Management Personnel and outstanding during the six month period ended 31 December 2012:
Maximum Number of
PRs Granted ( Quantity) PRs Granted
PRs Cancelled
Minimum Value of PRs
Granted $
Maximum Value of PRs Outstanding
$T. Granger 6,435 - - - 393,709 I. Gorman - - - - P. Belliveau 2,758 - - - 168,741 S. Ouellette 2,758 - - - 168,741 S. Arrowsmith 2,016 - (1,680) - 20,557 (b) Employee Option Scheme The Group has an ownership-based compensation scheme for employees. In accordance with the provisions of the scheme, the consolidated entity’s employees may be granted options to purchase parcels of ordinary shares at an exercise price which is determined by the Remuneration and Nomination Committee at the time the option is granted. The options cannot be transferred and are not quoted on the ASX. Each employee share option converts into one ordinary share of the Company on exercise. No amounts are paid or payable by the recipient on receipt of the option. The options carry neither rights to dividends nor voting rights. Options may be exercised at any time from the date of vesting to the date of their expiry. The number of options granted is recommended by the CEO and Managing Director and approved by the Remuneration and Nomination Committee. Major factors which determine the number of options granted comprise the extent of the Group’s and the individual’s achievements, and the level of seniority of the individual. Generally the options granted expire three or five years from the date that they are granted, or six months after the resignation of the employee, whichever is earlier.

Notes to the Consolidated Financial Statements (Continued)
MOLOPO ENERGY LIMITED DECEMBER 2012 ANNUAL REPORT
65
The following table reconciles the outstanding share options granted under the employee share option plan at the beginning and end of the financial period:
Weighted Weighted average averageexercise exercise
Number of price Number of priceoptions A$ options A$
Balance at beginning of the period 1,145,000 $1.22 5,000,002 $1.36Granted during the period - - 450,000 $0.74Forefeited or lapsed during the period (655,000) 1.28 (4,005,002) $1.40Exercised during the period - - (300,000) $0.33Balance at end of the period 490,000 $0.96 1,145,000 $1.22Exercisable at end of the period 290,000 845,000
Restated
31 December 2012 30 June 2012Six Months Ended Year Ended
Exercise price range The share options outstanding as at 31 December 2012 have an exercise price in the range of A$0.675 to A$1.46 (30 June 2012: A$0.675 to A$1.63). Weighted average remaining contractual life The weighted average remaining contractual life of the share options outstanding at 31 December 2012 is 2.40 years (30 June 2012: 2.45 years). Weighted average fair value The weighted average fair value of options granted during the six months ended 31 December 2012 was $nil (30 June 2012: A$0.94). The following options-based transactions occurred during the six months ended 31 December 2012:
31 December 2012 Opening Number Closing Exercise Fair ValueDate Date Expiry Balance Number Number Forefeited Balance Price at Grant
Granted Vested Date (Number) Granted Exercised /Expired (Number) A$ A$
03/10/2011 02/10/2012 03/10/2016 100,000 - - - 100,000 0.70 0.4603/10/2011 02/10/2013 03/10/2016 100,000 - - - 100,000 0.70 0.4603/10/2011 02/10/2014 03/10/2016 100,000 - - - 100,000 0.70 0.4618/12/2009 18/12/2010 17/12/2012 100,000 - - (100,000) - 1.60 0.7318/12/2009 18/12/2010 17/12/2012 150,000 - - (150,000) - 1.46 0.7626/03/2010 26/03/2011 25/03/2013 100,000 - - - 100,000 1.45 0.6802/04/2010 02/04/2011 01/04/2013 35,000 - - - 35,000 1.45 0.5727/05/2010 22/12/2010 21/12/2012 150,000 - - (150,000) - 1.23 0.5529/06/2010 15/04/2011 14/04/2013 55,000 - - - 55,000 1.46 0.4929/07/2010 29/07/2011 28/07/2013 95,000 - - (95,000) - 1.22 0.6007/12/2010 07/12/2011 06/12/2013 160,000 - - (160,000) - 1.17 0.55
Total 1,145,000 - - (655,000) 490,000

Notes to the Consolidated Financial Statements (Continued)
MOLOPO ENERGY LIMITED DECEMBER 2012 ANNUAL REPORT
66
The following options-based transactions occurred during the year ended 30 June 2012:
30 June 2012 Opening Number Closing Exercise Fair ValueDate Date Expiry Balance Number Number Forefeited Balance Price at Grant
Granted Vested Date (Number) Granted Exercised /Expired (Number) A$ A$Key Management Personnel
D. Beard39,050 39,050 40,853 300,000 - (300,000) - - 0.25 0.08
A. Bishop 39,633 39,633 40,727 800,000 - - (800,000) - 1.84 1.05 M. Bowers 40,269 40,530 41,260 800,000 - - (800,000) - 1.56 0.55 Total Key Management Personnel 1,900,000 - (300,000) (1,600,000) -
Other Personnel40,819 41,184 42,646 - 100,000 - - 100,000 0.46 0.46 40,819 41,549 42,646 - 100,000 - - 100,000 0.46 0.46 40,819 41,914 42,646 - 100,000 - - 100,000 0.46 0.46 39,202 39,202 40,297 - - - - 0.25 0.38 40,731 41,096 42,520 - 50,000 - (50,000) - 0.33 0.87 40,731 41,461 42,520 - 50,000 - (50,000) - 0.51 0.78
40,731 41,461 42,520 - 50,000 - (50,000) - 1.46 0.78 39,834 40,198 40,928 400,000 - - (400,000) - 0.85 0.36 39,990 40,355 41,085 250,000 - - (250,000) - 1.29 0.58 40,092 40,092 41,187 - - - - - 1.56 0.73 40,092 40,092 41,187 - - - - - 1.56 0.76 40,092 40,092 41,187 - - - - - 1.42 0.73 40,165 40,530 41,260 100,000 - - - 100,000 1.41 0.57 40,165 40,530 41,260 150,000 - - - 150,000 1.45 0.57 40,253 40,618 41,348 115,000 - - (115,000) - 1.66 0.53 40,263 40,464 41,358 - - - - - 1.21 0.65 40,263 40,628 41,358 100,000 - - - 100,000 1.50 0.68 40,269 40,530 41,260 200,000 - - (200,000) - 1.63 0.50 40,270 40,635 41,365 35,000 - - - 35,000 1.45 0.50 40,297 40,603 41,333 425,000 - - (425,000) - 1.46 0.49 40,325 40,534 41,264 150,000 - - - 150,000 1.23 0.55 40,358 40,648 41,378 135,000 - - (80,000) 55,000 1.45 0.50 40,358 40,652 41,382 140,000 - - (140,000) - 1.46 0.49 40,358 40,695 41,425 280,000 - - (280,000) - 1.23 0.55 40,388 40,753 41,483 95,000 - - - 95,000 1.22 0.60 40,519 40,884 41,614 160,000 - - - 160,000 1.17 0.55 40,638 41,004 41,733 115,000 - - (115,000) - 1.04 0.50 40,695 41,060 42,520 83,334 - - (83,334) - 0.80 0.60 40,695 41,425 42,520 83,334 - - (83,334) - 0.80 0.60 40,695 41,790 42,520 83,334 - - (83,334) - 0.80 0.60
Total Other Personnel 3,100,002 450,000 - (2,405,002) 1,145,000
Total All Personnel 5,000,002 450,000 (300,000) (4,005,002) 1,145,000 Notes: (a) Options cannot be exercised for a period of at least 12 months from grant date. (b) The options vest in line with the individual’s employment agreement and are exercisable at any time between vesting and expiry date.

Notes to the Consolidated Financial Statements (Continued)
MOLOPO ENERGY LIMITED DECEMBER 2012 ANNUAL REPORT
67
The following table summarises the key input variables used to value the Company’s outstanding options.
Grant DateExpiry Date
Exercise Price
Share Price on Grant Date
Time To Maturity
Market Volatility
Risk Free Rate
Fair Value of Option on Grant Date
A$ A$ Years Beta A$26/03/2010 25/03/2013 1.409 1.100 3.0 0.8590 0.0541 0.5702/04/2010 01/04/2013 1.209 1.150 3.0 0.8590 0.0584 0.6529/06/2010 18/04/2013 1.460 1.030 2.8 0.8630 0.0514 0.4929/07/2010 28/07/2013 1.220 1.080 3.0 0.8630 0.0524 0.6007/12/2010 06/12/2013 1.170 1.010 3.0 0.8630 0.0501 0.5503/10/2011 01/10/2016 0.675 0.675 5.0 0.8039 0.0383 0.46
When issued, options are valued using the Black-Scholes (1973) equation, a valuation technique which takes into consideration share price volatility, the risk free rate, the option exercise price, the term of the option before expiry and the share price on grant date. Expected volatility is based on the historical annualised share price volatility over the past four years and it is assumed that options will be exercised just prior to their expiry date. The risk free rate is based on the ten year government bond yield at grant date. The total value of options granted, exercised and lapsed is calculated based on the following:
• Fair value of the options at grant date multiplied by the number of options granted during the year; plus
• Fair value of the option at the time it is exercised multiplied by the number of options exercised during the year; plus
• Fair value of the option at the time of lapse multiplied by the number of options lapsed during the year.
The total value of options included in remuneration for the year is calculated in accordance with Accounting Standard AASB 124 “Related Party Disclosures”. This requires the following:
• The value of the options is determined at grant date, and is included in remuneration on a proportionate basis from grant date to vesting date. Where the options immediately vest the full value of the option is recognised in remuneration in the current year; and
• All options vest at the date of issue unless otherwise disclosed.
(b) Expenses arising from option and share-based payment transactions Total expenses arising from share-based payment transactions recognised during the period as part of director and employee benefit expenses are detailed below:
Six Months RestatedEnded Year Ended
31 December 30 June2012 2012
US$000 US$000
(i) Option premium reserve Total equity-settled options based payments recognised as anexpense during the period - 76 (ii) Share-based paymentsTotal equity-settled share-based payments recognised as anexpense during the period - 1,997 Total option and share-based payments recognised as anexpense during the year - 2,073
Consolidated

Notes to the Consolidated Financial Statements (Continued)
MOLOPO ENERGY LIMITED DECEMBER 2012 ANNUAL REPORT
68
20. JOINT VENTURES Interests in joint venture operations The Group’s interests in joint venture operations as at 31 December 2012 are summarised below: Name Principal Activity Ownership
Interest
31
December 2012
30
June 2012
Pooled Interests, Saskatchewan, Canada Tight Oil 25% 25%
Mason County, West Virginia, USA Conventional and CBM Gas and shale gas
50% 50%
There are no contingent liabilities associated with the joint venture operations.
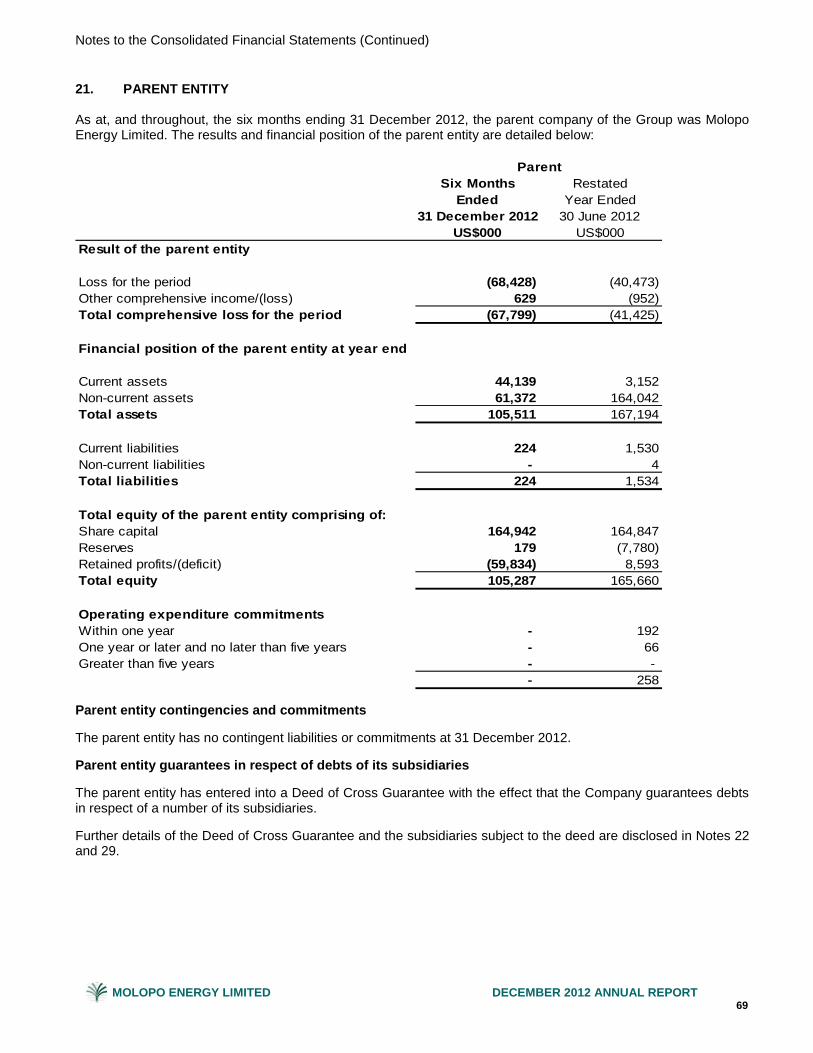
Notes to the Consolidated Financial Statements (Continued)
MOLOPO ENERGY LIMITED DECEMBER 2012 ANNUAL REPORT
69
21. PARENT ENTITY As at, and throughout, the six months ending 31 December 2012, the parent company of the Group was Molopo Energy Limited. The results and financial position of the parent entity are detailed below:
Six Months RestatedEnded Year Ended
31 December 2012 30 June 2012US$000 US$000
Result of the parent entity
Loss for the period (68,428) (40,473)Other comprehensive income/(loss) 629 (952)Total comprehensive loss for the period (67,799) (41,425)
Financial position of the parent entity at year end
Current assets 44,139 3,152Non-current assets 61,372 164,042Total assets 105,511 167,194
Current liabilities 224 1,530Non-current liabilities - 4Total liabilities 224 1,534
Total equity of the parent entity comprising of:Share capital 164,942 164,847Reserves 179 (7,780)Retained profits/(deficit) (59,834) 8,593Total equity 105,287 165,660
Operating expenditure commitmentsWithin one year - 192One year or later and no later than five years - 66Greater than five years - -
- 258
Parent
Parent entity contingencies and commitments The parent entity has no contingent liabilities or commitments at 31 December 2012. Parent entity guarantees in respect of debts of its subsidiaries The parent entity has entered into a Deed of Cross Guarantee with the effect that the Company guarantees debts in respect of a number of its subsidiaries. Further details of the Deed of Cross Guarantee and the subsidiaries subject to the deed are disclosed in Notes 22 and 29.

Notes to the Consolidated Financial Statements (Continued)
MOLOPO ENERGY LIMITED DECEMBER 2012 ANNUAL REPORT
70
22. CONTROLLED ENTITIES
The following table lists the details of controlled entities as at 31 December 2012:
Name of controlled entity Country of incorporation Class of share Percentage Holding
% 31 Dec 30 June
2012
2012
Molopo Energy Limited (parent entity) Australia1 Ordinary Lowell Petroleum N.L.2 Australia1 Ordinary - 100
Lowell Petroleum (China) Pty Ltd Australia1 Ordinary 100 100
Lowell Petroleum (Australia) Pty Ltd Australia1 Ordinary 100 100
Resources Development Pty Ltd Australia1 Ordinary 100 100
Molopo Generation Pty Ltd2 Australia1 Ordinary - 100
Molopo (Queensland) LLC2 USA Ordinary - 100
Molopo USA LLC Molopo Energy Texas LLC
USA
USA
Ordinary
Ordinary
100
100
100
100
Molopo Energy Holdings Ltd Canada Ordinary 100 100
Molopo Energy Canada Ltd Canada Ordinary 100 100
Molopo Canada Callco Ltd Canada Ordinary 100 100
Molopo South Africa Exploration & Production (Pty ) Ltd (formally Highland Exploration and Production (Pty) Ltd)
South Africa Ordinary 100 100
Molopo Evander Exploration and Production (Pty) Ltd
South Africa Ordinary 100 100
Molopo Virginia Exploration and Production (Pty) Ltd
South Africa Ordinary 100 100
Metord Company Mongolia Reg. capital 100 100
TOTAL Notes:
1. Parties to the Deed of Cross Guarantee. 2. On 1 November 2012 the Group completed the sale of its Queensland, Bowen Basin gas assets to a subsidiary of PetroChina International
Investment Company Limited. The transaction was a share sale agreement for the sale of the shares of three wholly-owned subsidiaries; Lowell Petroleum NL, Molopo Generation Pty Ltd and Molopo (Queensland) LLC.

Notes to the Consolidated Financial Statements (Continued)
MOLOPO ENERGY LIMITED DECEMBER 2012 ANNUAL REPORT
71
23. CONTINGENT LIABILITIES On 7 March 2011, Molopo Energy Canada Ltd (“MECL”), a wholly owned subsidiary of Molopo Energy Ltd, was served with a statement of claim by a joint venture partner (“JV Partner”) in the Spearfish project. The JV Partner is seeking various court orders, declarations and specified damages of $36 million plus further un-quantified damages. MECL had previously issued a notice of default to the JV Partner and intends to vigorously defend the statement of claim. On 8 April 2011, MECL filed a statement of defence in respect of the above matter with the Court of Queen's Bench of Alberta, Canada, defending its position against the JV Partner. On 12 March 2013, the Company became aware that the JV Partner had filed a statement of claim (“Claim”) in the Court of Queen’s Bench of Alberta naming the purchaser of the Spearfish project (“Purchaser”) as a defendant. The Claim seeks several forms of relief, including punitive and aggravated damages of C$1 million and general damages of C$90 million. As at 12 March 2013, the Claim had not been served on the Purchaser and no action is required until it is served. On 12 March 2013, the Purchaser advised MECL that they would seek indemnity from MECL should the JV Partner advance the claim in accordance with various agreements related to the sale of the Spearfish project. Should the Claim be served and indemnification from the Purchaser be requested, the Company believes it is without merit and will vigorously defend the action. Additionally, the Company believes that the filing of the Claim is of no consequence as the amount claimed grossly exaggerates the value of any claim that would be awarded in the circumstances. 24. EXPENDITURE COMMITMENTS The following table represents the expenditure commitments as at 31 December 2012:
31 December Restated2012 30 June 2012
US$000 US$000Exploration and Development Expenditure CommitmentsWithin one year 1,500 7,958 One year or later and no later than five years - - Greater than five years - -
1,500 7,958
Operating Lease CommitmentsWithin one year 666 708 One year or later and no later than five years 2,734 3,576 Greater than five years 3,379 3,112
6,779 7,396
Consolidated
The commitments for exploration and development represent non-discretionary expenditure only. Additional expenditure to these amounts is likely to be required in order to maintain title in those oil and gas properties considered prospective, but such expenditure is at the discretion of the Company. Operating lease commitments relate to office leases in Australia, Canada and South Africa plus a number of leases over office equipment.

Notes to the Consolidated Financial Statements (Continued)
MOLOPO ENERGY LIMITED DECEMBER 2012 ANNUAL REPORT
72
25. SEGMENT INFORMATION Identification of reportable segments The predominant activity of the Group is petroleum exploration, appraisal, development and production. Geographically, the Group operates in four countries. The head office and management activities of the Group take place predominantly in Canada. Exploration, appraisal, development and production activities for petroleum predominantly take place in Australia, Canada, USA and South Africa. Operating segments are reported in a manner that is consistent with the internal reporting provided to the Board of Directors and the Executive Management Team (the chief operating decision makers). The operating segments have been determined based on a geographical perspective and the following reportable segments have been identified: • Australia; • Canada; • South Africa; • USA
Segment information is prepared in conformity with the consolidated entity’s policies described in Note 3. There were no inter-segment sales. Six months ended 31 December 2012 Australia Canada South Africa USA Total
US$000 US$000 US$000 US$000 US$000
External revenues - 2,418 - - 2,418Interest revenue 142 98 - - 240Depreciation and amortisation 17 1,187 3 - 1,207Income tax benefit - (2,826) - - (2,826)Reportable segment loss after tax (2,194) 311 (7,073) (55,197) (64,153)
Reportable segment assets 44,614 48,971 311 48,599 142,495Reportable segment liabilities 225 6,764 31 15,299 22,319
Capital expenditure 2 743 60 45,099 45,904
Other material non-cash itemsImpairment loss (Note 11) - - (6,855) (55,036) (61,891)

Notes to the Consolidated Financial Statements (Continued)
MOLOPO ENERGY LIMITED DECEMBER 2012 ANNUAL REPORT
73
Year ended 30 June 2012 Australia Canada South Africa USA TotalUS$000 US$000 US$000 US$000 US$000
External revenues 204 - - - 204
Interest revenue 482 535 - - 1,017Depreciation and amortisation 69 34 - - 103Income tax benefit (3,421) (11,172) - - (14,593)Reportable segment loss after tax (27,008) (35,956) (2,555) (196) (65,715)
Reportable segment assets 47,780 88,984 7,171 53,446 197,381Reportable segment liabilities 2,149 7,775 87 5,993 16,004
Capital expenditure 866 22,451 1,431 46,251 70,999
Other material non-cash itemsImpairment loss (23,809) (36,877) - - (60,686)
Product segments Information is also reported to the chief operating decision makers based on a commodity basis, being oil versus gas. For revenue, oil and gas follow the geographic basis disclosed above (i.e. all sales revenue from USA is oil and gas, Canada is for oil and gas revenue is derived from Australia). All Australian and South African segment assets and liabilities relate to gas. In the USA and Canada, of the segment assets, all of them are associated with oil and gas operations. Segment liabilities in Canada and the United States are associated with oil and gas operations. Major customers The Group has a number of customers to which it provides products. In relation to revenue from the sale of gas and NGLs, sales to four customers account for essentially 100% of external revenue (2011: three customers accounted for 99.5%). In relation to revenue from the sale of oil, sales to two customers account for essentially 100% of external revenue (2011: one customer accounted for 99.5%).

Notes to the Consolidated Financial Statements (Continued)
MOLOPO ENERGY LIMITED DECEMBER 2012 ANNUAL REPORT
74
26. EARNINGS PER SHARESix Months Restated
Ended Year Ended31 December 2012 30 June 2012
US$000 US$000
The following reflects the loss and share data used in the calculation of basic and diluted loss per share:Net loss (64,153) (65,715)
Weighted average number of ordinary shares on issue used in the calculation of basic loss per share: 245,829,063 245,583,377
Effect of DilutionShare options and Performance Share Rights - dilutive - - Weighted average number of ordinary shares adjusted for the effect of dilution 245,829,063 245,583,377
Basic loss per share (dollars per share) (0.26) (0.27)Diluted loss per share (dollars per share) (0.26) (0.27)
Earnings Per Share from continuing operationsBasic loss per share (dollars per share) (0.26) (0.20)Diluted loss per share (dollars per share) (0.26) (0.20)
Consolidated
In the six months ended 31 December 2012 and the year ended 30 June 2012, stock options, PSRs and PRs have not been included in dilutive loss per share as they are anti-dilutive in nature. Apart from as mentioned above, there have been no other transactions involving ordinary shares or potential ordinary shares that would significantly change the number of ordinary or potential ordinary shares outstanding between the reporting date and the date of completion of these financial statements. 27. RELATED PARTY INFORMATION (a) Key management personnel Details of key management personnel The key management personnel of the Group during the financial six months were:
• G. Lewin (Chairman, Non-Executive);
• T. Granger (Chief Executive Officer and Managing Director);
• M. Beck (Non-Executive Director);
• G. Ross (Non-Executive Director);
• B. Straub (Non-Executive Director);
• G. Cameron (Non-Executive Director);
• D. Engle (Non-Executive Director);
• P. Belliveau (Chief Financial Officer); and
• S. Ouellette (Chief Operating Officer).

Notes to the Consolidated Financial Statements (Continued)
MOLOPO ENERGY LIMITED DECEMBER 2012 ANNUAL REPORT
75
Key management personnel compensation The aggregate compensation of the Group’s key management personnel is set out below. Refer to the Remuneration Report within the Directors’ Report for individual details.
2012 201231 December 30 June
US$000 US$000Short-term employee benefits 716 2,012Post-employment benefits 12 108Other long-term benefits - - Cessation of employment benefits - 490Share-based payments - 785
728 3,394
Consolidated
Other transactions with key management personnel (and their related parties) The Group paid $37,089 (year ended 30 June 2012: $90,842) to a company related to Mr. G. Ross for investor relations consulting services, provided on normal commercial terms, to Molopo Energy Limited. This arrangement ceased upon Mr. Ross being elected as a Non-executive Director on 22 November 2012. Loans with key management personnel (and their related parties) During the financial six months there have been no loans by the Group to key management personnel. Key management personnel share holdings Fully paid ordinary shares of Molopo Energy Limited
31 December 2012 Issued onBalance at exercise of Balance at 1 July 2012 Granted options Purchase Sales Other 31 December 2012
No. No. No. No. No. No. No.G.Lewin 110,000 - - - - - 110,000T.Granger - - - 350,000 - - 350,000M.Beck 8,303,952 - - 100,000 - - 8,403,952G. Ross 27,143 - - 10,000 - - 37,143B. Straub 20,000 - - 30,000 - - 50,000G. Cameron 15,000 - - 30,000 - - 45,000D. Engle - - - 80,000 - - 80,000Officers P. Belliveau N/A - - 95,000 - - 95,000S. Ouellette N/A - - - - - - Total 8,476,095 - - 695,000 - - 9,171,095

Notes to the Consolidated Financial Statements (Continued)
MOLOPO ENERGY LIMITED DECEMBER 2012 ANNUAL REPORT
76
Fully paid ordinary shares of Molopo Energy Limited
30 June 2012 Issued onBalance at exercise of Balance at1 July 2011 Granted options Purchase Sales Other 30 June 2012
No. No. No. No. No. No. No.G.Lewin 110,000 - - - - - 110,000T.Granger1 N/A - - - - - - M.Beck 8,303,952 - - - - - 8,303,952G. Ross 27,143 - - - - - 27,143B. Straub - - - 20,000 - - 20,000G. Cameron 15,000 - - - - - 15,000D. Engle2 N/A - - - - - - I. Gorman 727,599 - - - - (727,599) N/AOfficers - S. Arrowsmith3 N/A - - - - - N/AP. Belliveau4 N/A - - - - - - S. Ouellette5 N/A - - - - - - Total 9,183,694 - - 20,000 - (727,599) 8,476,095 Notes: 1. T. Granger was appointed Managing Director and CEO on 3 January 2012. 2. D. Engle was appointed Director on 20 January 2012. 3. S. Arrowsmith was appointed as Acting Chief Financial Officer on 15 June 2011 and Chief Financial Officer on 15 August 2011. He ceased
as Chief Financial Officer on 29 February 2012. 4. P. Belliveau was appointed Chief Financial Officer on 1 March 2012. 5. S. Ouellette was appointed Chief Operating Officer on 1 March 2012. Key management personnel options holdings As of 31 December 2012, no directors or officers hold any unlisted options of Molopo Energy Limited. (b) Equity interests in related parties Equity interests in subsidiaries Details of the percentage of ordinary shares held in subsidiaries are disclosed in Note 22 to the financial statements. Equity interests in associates and joint ventures Details of interests in Joint Ventures are disclosed in Note 20 to the financial statements. (c) Wholly owned group transactions Information relating to controlled entities is set out in Note 22. During the six months, there were no transactions with controlled entities, other than movements in the respective inter-company loan accounts and management fees. As at 31 December 2012, Molopo Energy Limited loan balances with its subsidiary companies were: Lowell Petroleum N.L. $Nil (30 June 2012: $33,740,492); Molopo (Queensland) LLC $Nil (30 June 2012: $2,516,574); Molopo Generation Pty Ltd $Nil (30 June 2012: $3,246); Highland Exploration Pty Ltd $Nil (30 June 2012: $9,927,696); Molopo USA LLC $211,945 less provision of $203,590 (30 June 2012: $207,612 less provision of $199,428), Molopo Energy Texas LLC $33,663,918 (30 June 2012: $48,494,782); Molopo Energy Holdings Ltd $19,729,338 (30 June 2012: $19,326,039); and Molopo Energy Canada Ltd $1,462,943 (30 June 2012: $41,583,026); for costs in relation to operation of the respective areas. As at 31 December 2012 Molopo Energy Limited had $328 (30 June 2012: $328) owing to Lowell Petroleum (China) Pty Ltd. During the period an amount of $Nil (30 June 2012: $283,695) was charged by the parent entity to the subsidiary

Notes to the Consolidated Financial Statements (Continued)
MOLOPO ENERGY LIMITED DECEMBER 2012 ANNUAL REPORT
77
companies for services provided. These charges have been eliminated in the consolidated entity. All loans have been provided on an interest free basis and have no fixed repayment date. 28. AUDITORS REMUNERATION
Six Months RestatedEnded Year Ended
31 December 2012 30 June 2012US$000 US$000
Audit Services:Amounts received or due and receivable:- audit or review of the financial report 127 196- other audit services - 36
127 232
Taxation Services:Tax compliance services 20 323Tax advice in respect of asset disposals and acquisitions - 24Other tax services 53 50
73 397
Consolidated
29. DEED OF CROSS GUARANTEE Pursuant to ASIC Class Order 98/1418 (as amended) dated 30 August 1998, the wholly owned Australian subsidiaries listed in Note 22, are relieved from the Corporations Act 2001 requirements for preparation, audit, and lodgement of Financial Reports, and the Directors’ Report. It is a condition of the Class Order that the Company and each of the subsidiaries enter into a Deed of Cross Guarantee. The effect of the Deed is that the Company guarantees to each creditor payment in full of any debt in the event of winding up of any of the subsidiaries under certain provisions of the Corporations Act 2001. If a winding up occurs under other provisions of the Corporations Act 2001, the Company will only be liable in the event that after six months any creditor has not been paid in full. The subsidiaries have also given similar guarantees in the event that the Company is wound up. On 1 November 2012 the Group completed the sale of its shares in two wholly-owned subsidiaries; Lowell Petroleum NL and Molopo Generation Pty Ltd, which owned Queensland Bowen Basin gas assets. The remaining subsidiaries that are a party to the Deed of Cross Guarantee are dormant have no assets or liabilities as at 31 December 2012. 30. FINANCIAL RISK MANAGEMENT The Group's activities expose it to a variety of financial risks, market risk (including interest rate risk, commodity price risk, equity price risk and currency risk), credit risk and liquidity risk. This note presents information about the Group’s exposure to each of the above risks, their objectives, policies and processes for measuring and managing risk, and their management of capital. Risk management framework To manage and limit the effects of financial risks the Board of Directors has approved the Risk Management Policy. The Group’s overall risk management program focuses on the unpredictability of financial markets and seeks to minimise potential adverse effects on the financial performance of the Group. The Group at present does

Notes to the Consolidated Financial Statements (Continued)
MOLOPO ENERGY LIMITED DECEMBER 2012 ANNUAL REPORT
78
not use derivative financial instruments. The Group uses different methods to measure different types of risk to which it is exposed. These methods include sensitivity analysis in the case of interest rates and foreign exchange, and ageing analysis for credit risk. The policies approved at balance date are outlined below. Financial risk management is carried out by the Chief Executive Officer and Chief Financial Officer under policies approved by the Board of Directors. The Chief Financial Officer identifies, evaluates and manages the financial risks of the Company. The Board provides written policies which also cover specific areas, such as foreign exchange risk, interest rate risk and credit risk. (a) Market Risk Market risk is the risk that the fair value or future cash flows of financial instruments will fluctuate due to changes in market prices, such as interest rates, commodity prices, equity prices and foreign exchange rates. (i) Interest rate risk The Group does not have any borrowings and therefore no significant exposure to interest rate risk. No interest is currently charged in relation to receivables or payables balances. (ii) Price risk Commodity price risk
The Group’s revenue is exposed to commodity price fluctuations, in particular to gas and oil prices. In relation to oil prices and gas prices, the Group is exposed to price fluctuations as sales are at spot prices. In relation to financial assets and liabilities held at balance sheet date, the price risk is immaterial in terms of a possible impact on profit and loss and as such a sensitivity analysis has not been completed. (iii) Currency risk The Group undertakes transactions denominated in foreign currencies, hence exposures to exchange rate fluctuations arise. The Group has exposure to the Australian Dollar, Canadian Dollar, US dollar and the South African Rand. Measuring the exposure to foreign exchange risk is achieved by monitoring and performing sensitivity analysis on the Group’s financial position. Currency risk exposure The carrying amounts of the Group’s foreign currency denominated financial assets and liabilities in entities which do not have the corresponding functional currency at the reporting date are as follows:
CAD(000) USD(000) 31 December 2012Cash and cash equivalents - 31,273 Receivables - - Payables - -
30 June 2012Cash and cash equivalents 5 40,197 Receivables - - Payables - -

Notes to the Consolidated Financial Statements (Continued)
MOLOPO ENERGY LIMITED DECEMBER 2012 ANNUAL REPORT
79
Sensitivity Analysis A 10 percent change of the Australian dollar against the USD at 31 December 2012 would have increased/(decreased) profit or loss by the amounts shown below. This analysis assumes that all other variables remain constant.
31 December 30 June 31 December 30 June2012 2012 2012 2012
US$000 US$000 US$000 US$000
AUD/USD +10% (3,127) (2,472) (3,127) (2,472)AUD/USD -10% 3,127 1,679 3,127 1,679
Higher/(Lower) Higher/(Lower)
Impact on Post Tax Profit Other Comprehensive Income
Significant assumptions used in the foreign currency exposure sensitivity analysis above include: • Reasonably possible movements in foreign exchange rates were determined based on a review of the last five
years historical movements.
• The reasonably possible movement of 10% was calculated by taking the foreign currency spot rates as at balance date, moving this spot rate by 10% and then re-converting the foreign currency into AUD with the “new spot-rate”. This methodology reflects the translation methodology undertaken by the Group.
• The net exposure at balance date is representative of what the Group was and is expecting to be exposed to
in the next twelve months from balance date.
• The sensitivity analysis includes only the impact on the balance of financial assets and financial liabilities at balance date.
(b) Credit Risk Credit risk refers to the risk that a counter party will default on its contractual obligations resulting in financial loss to the consolidated entity. Credit risk is managed on a Group basis. The credit risk of the Group arises from cash and cash equivalents, deposits with banks and financial institutions, available-for-sale financial assets, as well as credit exposure to customers, including outstanding receivables. For banks and financial institutions, only independently rated parties with a minimum Standard & Poor’s credit rating of A (or equivalent) are accepted. The consolidated entity's maximum exposures to credit risk at balance date in relation to each class of recognised financial assets is the carrying amount of those assets as indicated in the statement of financial position.

Notes to the Consolidated Financial Statements (Continued)
MOLOPO ENERGY LIMITED DECEMBER 2012 ANNUAL REPORT
80
31 December Restated2012 30 June 2012
US$000 US$000Terms & Conditions:Trade receivables are non-interest bearing and generally on 30-day terms. A portion of the trade receivables balance was past due but not considered impaired (PDNI). The ageing of these receivables is as follows:
0 - 30 days 1,348 1,32531 - 60 days (PDNI) - - 61 - 90 days (PDNI) - - + 90 days (PDNI) - 34
1,348 1,359
(i) Fair value and credit riskDue to the short term nature of these receivables, their carrying value is assumed to approximate their fairvalue. The maximum exposure to credit risk at the reporting date is the fair value of each class ofreceivable mentioned above. No significant concentration of credit risk is present as at 31 December 2012 orat 30 June 2012.
Consolidated
(c) Liquidity Risk Prudent liquidity risk management implies maintaining sufficient cash and the availability of funding to settle transactions on the due date. The Group does not have any borrowings and therefore does not have any exposure to meeting external borrowing commitments. Management monitors rolling cash forecasts to ensure it can meet operational and investment requirements. (d) Net Fair Values The table below analyses financial instruments carried at fair value, by valuation method. The different levels have been defined as follows: Level
Valuation method
Level 1 Quoted prices (unadjusted) in active markets for identical assets or liabilities. Level 2 Inputs other than quoted prices included within Level 1 that are observable for the asset or
liability, either directly (i.e. as prices) or indirectly (i.e. derived from prices). Level 3 Inputs for the asset or liability that are not based on observable market data (unobservable
inputs).

Notes to the Consolidated Financial Statements (Continued)
MOLOPO ENERGY LIMITED DECEMBER 2012 ANNUAL REPORT
81
The following methods and assumptions are used to determine the net fair values of financial assets and liabilities: Financial asset or liability
Fair value method
Cash, cash equivalents and short-term deposits The carrying amount approximates fair value because of their short-term to maturity (Level: n/a).
Receivables and Payables
The carrying amounts approximate fair value (Level: n/a).
Investments The fair value is calculated using quoted prices in active markets (Level 1).
Other Investments (term-deposits) The carrying amount approximates fair value because their term to maturity is only 12 months (Level: n/a).
(e) Capital Management The Group’s objectives when managing capital are to maintain a strong capital base capable of withstanding significant cash flow variability, whilst providing the flexibility to pursue its growth aspirations. The Group aims to maintain an optimal capital structure to reduce the cost of capital and maximise shareholder returns. The capital structure of the Group currently consists of cash and cash equivalents and equity. The Group will balance its overall capital structure through the issue of new shares, or the issue of new debt where considered appropriate. The Group is not subject to any externally imposed capital requirements. (f) Equity investments – fair value In relation to the equity investments, the table below discloses the cost, and fair value of the investments and how the fair value movement has been accounted for:
Six Months RestatedEnded Year Ended
31 December 2012 30 June 2012US$000 US$000
Equity investments at cost 530 519Fair value movement (220) (298)Carrying amount 310 221
Fair value movement consists of:Balance at 1 July 221 35,020Dispositions - (34,121)Other receivable - - Change in fair value: other comprehensive income (Note 17) 84 (298)Effect of exchange rate changes 5 (380)Balance at end of period 310 221
Consolidated

Notes to the Consolidated Financial Statements (Continued)
MOLOPO ENERGY LIMITED DECEMBER 2012 ANNUAL REPORT
82
31. SUBSEQUENT EVENTS a) On 8 April 2011, the Company filed a counterclaim in respect of the matter identified in Note 23 with the
Court of Queen's Bench of Alberta, Canada. The counterclaim dealt with matters that were addressed in the initial notice of default served by MECL on the joint venture partner, and generally relates to an outstanding amount the Company believed was owing to it by the joint venture partner. During January, 2013 the Company received C$3.4 million from the joint venture partner as full settlement of the above counterclaim, which has been withdrawn.
b) On 17 January 2013, the Board appointed Mr. Steven Cloutier as Molopo’s Chief Executive Officer and
Managing Director, replacing Mr. Tim Granger. On the same date, the Board formed a Special Committee to oversee and assist Mr. Cloutier in developing and implementing a strategic review to enhance shareholder value. This committee is chaired by Mr. Don Engle, with Mr. Garry Cameron, Mr. Brian Straub, Mr. Glenn Ross and Mr. Steven Cloutier as members.
c) As more fully described in Note 23, on 12 March 2013, the Company became aware that a joint venture
partner in the Spearfish project had filed a statement of claim in the Court of Queen’s Bench of Alberta naming the purchaser of the project as a defendant.

MOLOPO ENERGY LIMITED DECEMBER 2012 ANNUAL REPORT
83
Directors’ Declaration The Directors of Molopo Energy Limited declare that:
a) In the Director’s opinion the financial statements and notes and the Remuneration report in the Director’s Report set out on pages16 to 27 are in accordance with the Corporations Act 2001, including:
i) Giving a true and fair view of the Group’s financial position as at 31 December 2012 and of its performance, for the financial six months ended on that date; and
ii) Complying with Australian Accounting Standards (including the Australian Accounting Interpretations) and Corporations Regulations 2001;
b) The financial report also complies with International Financial Reporting Standards issued by the International Accounting Standards Board, as disclosed in Note 2; and
c) There are reasonable grounds to believe that the company will be able to pay its debts and when they become due and payable.
At the date of this declaration there are reasonable grounds to believe that the company and the group entities identified in Note 22 will be able to meet any obligations or liabilities to which they are or may become subject to by virtue of the Deed of Cross Guarantee described in Note 29 between the company and those group entities pursuant to ASIC Class Order 98/1418.
The Directors have been given the declarations required by Section 295A of the Corporations Act 2001 by the Chief Executive Officer and Chief Financial Officer for the six months ended 31 December 2012.
Signed in accordance with a resolution of the Directors.
Dated at Melbourne this 28th day of March 2013.
Greg Lewin AM Director

MOLOPO ENERGY LIMITED DECEMBER 2012 ANNUAL REPORT
84
Corporate Governance Statement Foundations for Management and Oversight The Board of Directors (the “Board)” has the overall responsibility to shareholders for all governance matters of the Group. In accordance with ASX Council’s published guidelines as set out in its Principles of Good Corporate Governance and Best Practice Recommendations (“Recommendation”), the Board remains primarily responsible for the strategic direction and financial aspirations of the Group, whilst delegating the responsibilities of management to the Managing Director and Chief Executive Officer and the senior management team (Recommendation 1.1). The Board aims to fulfil its responsibilities by creating value for all stakeholders that is sustainable and beneficial. Stakeholders include shareholders, employees, customers, the community and the environment. The Board has adopted a Charter (“Board Charter”) which includes, amongst other items, the specific roles and responsibilities of the Board. Without limiting the Board’s function, its specific responsibilities include:
• Approving objectives, strategies and financial plans and monitoring Molopo’s performance against these plans;
• Appointment of the Chief Executive Officer and reviewing his performance and remuneration;
• Establishing the responsibilities of the Chief Executive Officer and Chief Financial Officer;
• Monitoring compliance with regulatory requirements, and ensuring all Group employees act with integrity and diligence in the interests of the Group and stakeholders; and
• Reviewing and approving all significant policies and procedures across the Group.
The Board Charter can be located on Molopo’s website at http://www.molopo.com.au/company/corporate-governance/. Board Structure As at 31 December 2012, the Board comprised seven directors, six of whom are independent non-executive directors. The structure of the Board met all Recommendations in Principle 2 for the six months ended 31 December 2012, as a majority of the Board are independent directors (Recommendation 2.1), the Chairman is an independent director (Recommendation 2.2), the roles of Chairman and Chief Executive Officer are not exercised by the same individual (Recommendation 2.3), and there is a Remuneration and Nomination Committee (Recommendation 2.4). Name & Qualifications Position Term in Office GREGORY LEWIN AM BE (Chem), MBA, FREng, FIChemE
Non-Executive Chairman Member of HSE & Technical Committee. Former Chairman of Remuneration and Nomination Committee
Appointed 15 February 2011, less than 2 years.
MAXWELL BECK AM Non-Executive Director Former Member of Remuneration and Nomination Committee
Appointed 15 February 2011, less than 2 years.
TIM GRANGER
Chief Executive Officer and Managing Director
Appointed Managing Director and Chief Executive Officer on 3 January 2012, less than 1 year.
BRIAN STRAUB BSc - Petroleum Engineering
Non-Executive Director Chairman of HSE & Technical Committee, Member of Audit & Risk Committee
Appointed 17 March 2011, less than 2 years.

MOLOPO ENERGY LIMITED DECEMBER 2012 ANNUAL REPORT
85
GARRY CAMERON PSM B.Bus (A/c), B.Eco. (Hons.), M.Eco, FAICD, FCPA
Non-Executive Director Chairman of Audit & Risk Committee, Member of Remuneration and Nomination Committee
Appointed 30 March 2011, less than 2 years.
DON ENGLE Non-Executive Director Chairman of Remuneration and Nomination Committee, Member of Audit & Risk Committee and HSE & Technical Committee
Appointed 20 January 2012, less than 1 year.
GLENN ROSS Non-Executive Director Member of Remuneration and Nomination Committee
Appointed 22 November 2012, less than 1 year.
The Directors are appointed in accordance with the constitution of Molopo which provides for a term of three years, at the conclusion of which re-appointment may be sought. Earlier re-appointment may be required as at least one director must stand for re-election at each Annual General Meeting. The Board regularly reviews the skills and experience which it requires to fulfil its obligations, and appoints as directors persons who possess and can apply those skills and experience. The experience of Directors is recorded in the Directors’ Report. Each Director is required to disclose any interest which might create a potential conflict of interest with their duties as a director of Molopo or which would affect their independence. In accordance with the Recommendations, the Board has met the guideline that no independent director holds more than 5% of the total shares on issue.
The Board has reviewed the position of all current directors in light of Molopo’s adopted definition of independence. This definition is consistent with the guidelines provided by the Recommendations. The results of this review are set out in the following table:
Director
Capacity Office held from
G. Lewin Independent Non-Executive
15 February 2011
M. Beck Independent Non-Executive
15 February 2011
B. Straub Independent Non-Executive
17 March 2011
G. Cameron Independent Non-Executive
30 March 2011
D. Engle Independent Non-Executive
20 January 2012
G. Ross Independent Non-Executive
22 November 2012
S. Cloutier Executive 17 January 2013
J. Schwarz Independent Non-Executive
18 March 2013

MOLOPO ENERGY LIMITED DECEMBER 2012 ANNUAL REPORT
86
Independent Professional Advice The Non-Executive Directors have the right to seek independent professional advice in the furtherance of their duties as Directors at Molopo’s expense. The request must first be discussed with the Chairman who will facilitate obtaining the advice. Performance of the Board, Chairman, Directors and Senior Executives
The Non-Executive Directors are responsible for reviewing the performance of the Chairman. It is the responsibility of the Chairman to assess the performance of each of the Non-Executive Directors. The Chairman will review the performance of the CEO, and the CEO will review the senior executives, with recommendations provided to the Remuneration and Nomination Committee which in turn makes recommendations to the Board. The Board has a formal performance review process which involves open and constructive dialogue between the respective parties, taking account the objectives and measurable results that have been achieved. The policy ensures that Molopo complies with Recommendations 1.2 and 2.5.
As performance is assessed on a calendar year basis, performance evaluations of the Board, the Chairman, Directors and Senior Executives were not performed during the six months ended 31 December 2012.
The performance evaluation policy can be located on Molopo’s website at http://www.molopo.com.au/company/corporate-governance/. Board Committee Structure The Board’s function is to address issues in their broadest context. It is through the committee structure that specific areas of detail are examined. As at 31 December 2012, there were three committees in place. Audit and Risk Committee The Audit and Risk Committee is responsible for risk management and oversight of Molopo’s financial reporting policies and other operational risk areas. The Committee monitors the internal controls and the integrity of Molopo’s financial statements in compliance with regulatory requirements. The Committee is also responsible for the appointment, evaluation and oversight of the external auditor, and ensuring that the independence of the external assurance function is maintained. The Committee has a formal charter which complies with Recommendation 4.3, and sets out that membership will only comprise non-executive directors, a majority of which must be independent. The Committee shall appoint an independent chairman who is not the Chairman of the Board. The Committee shall comprise of a minimum of three members and shall include at least one member who is a “financial expert” (FE) as defined by the Board. All members are required to be financially literate. In accordance with Recommendation 4.4, the Charter also sets out information on procedures for the selection and appointment of the external auditor, and for the rotation of external audit partner engagement. The Chairman of the Audit and Risk Committee is Mr. Garry Cameron (Non-Executive Director) and Brian Straub (Non-Executive Director) and Don Engle (Non-Executive Director) are members. As at 31 December 2012, Molopo’s structure to independently verify and safeguard the integrity of its financial reporting meets the requirements of Recommendations 4.1 to 4.4. Remuneration and Nomination Committee The Committee is responsible for making recommendations to the Board with respect to Molopo’s compensation policies, including equity-based programmes. The Committee reviews, considers and evaluates the remuneration and performance of Executive Directors and senior management. In accordance with Recommendation 2.6, this Committee has been responsible for the identification of suitable candidates for appointment to the Board, succession planning in respect of the Chairman and CEO and the assessment of performance of individual directors and the endorsement of retiring directors

MOLOPO ENERGY LIMITED DECEMBER 2012 ANNUAL REPORT
87
seeking election. In accordance with Recommendation 8.2, the Committee’s Charter sets out that membership should comprise of at least three members, who are all non-executive directors, the majority of which must be independent. The Board is responsible for appointing a Committee Chairman. The Chairman of the Remuneration and Nomination Committee is Mr. Don Engle, with Mr. Glenn Ross (Non-Executive Director) and Mr. Garry Cameron (Non-Executive Director) as members. Mr. Engle replaced Mr. Lewin as Chairman of the Committee on 30 July 2012. Mr. Ross replaced Mr. Beck as a member of the Committee on 13 December 2012. Molopo was compliant with Recommendations 8.1 and 2.4 during the six months ended 31 December 2012. HSE & Technical Committee The HSE & Technical Committee is responsible for assisting the Board in working with management on HSE and Technical issues, overseeing and monitoring HSE & technical aspects of the operational performance of Molopo, overseeing and reporting to the Board on HSE performance and the quality of technical work carried out by Molopo and, where appropriate, making recommendations for improvement, as well as reporting to the Board on HSE & technical matters, including reserves. The Committee is to consist of at least three members, a majority of which must be independent non-executive directors, and all members must have an appropriate level of knowledge of HSE, Oil & Gas exploration, production and technical matters, including reserves determination. The Committee is chaired by Mr Brian Straub (Non-Executive Director), with Mr. Greg Lewin (Non-Executive Chairman) and Mr. Don Engle (Non-Executive Director) as members. Policies and Procedures A summary of Molopo’s key policies and procedures is provided below. Code of Conduct This policy is compliant with Recommendation 3.1 and sets out the ethical standards that govern the conduct of all directors, officers and employees. Molopo recognises the interests of all stakeholders in the community and their role in creating shareholder value. Every director and employee is required, at all times, to conduct themselves in a manner consistent with the principles of honesty and integrity.
The Code requires directors, officers and employees, amongst other things, to comply with the law, to disclose relevant interests that they may have, and to act in the best interests of the Group. The Code also covers confidentiality of information and respect of privacy.
This policy is available on Molopo’s website at http://www.molopo.com.au/company/corporate-governance/.
Diversity Policy
Molopo was an early adopter of diversity related Recommendations. In accordance with Recommendation 3.2, Molopo established a diversity policy in May 2011.
The Policy recognises that given the industry in which Molopo operates, together with the small number of employees within Molopo, it is difficult to provide meaningful percentage targets for female participation and where this can be done, it is further recognised that the departure or hire of as little as one staff member may have a significant impact on the gender balance.
In accordance with Recommendation 3.3, Molopo seeks to have at least one female director on the Board by 2014 subject to the particular skills and gaps on the Board at the relevant time. In relation to senior management gender diversity, Molopo aims to have 25% female representation at the senior executive level over the longer term, recognising that there may be fluctuations at times. The Company also aims for the proportion of females in Molopo as a whole to be greater than 30%.

MOLOPO ENERGY LIMITED DECEMBER 2012 ANNUAL REPORT
88
As required by Recommendation 3.4, Molopo highlights that as at 31 December 2012, there were no female directors on the Board, the proportion of females in senior executive levels was 43%, and 50% of the Company as a whole comprised female employees. The Company therefore exceeds its target in relation to female representation at both senior executive and the organisational level, and will continue to work towards its target of having a female Board member by 2014. The Diversity Policy is available on Molopo’s website at http://www.molopo.com.au/company/corporate-governance/. Continuous Disclosure and Shareholder Communication Policy The Company recognises the importance of timely disclosure of the Group’s activities to shareholders and the market, in accordance with its legal and regulatory obligations. This policy sets out the principles that guide Molopo in fulfilling its responsibilities to act with integrity, to satisfy the disclosure and effective communication requirements of the ASX and the Corporations Act. The Company’s Continuous Disclosure and Communication Policy meets the requirements of Recommendations 5.1 and 6.1. It requires communication with shareholders and provides that Molopo must undertake to update its website on a regular basis to provide all material announcements and information. In addition, Molopo attempts to respond to shareholder queries as soon as practicable when such queries are raised. This policy is available on Molopo’s website at http://www.molopo.com.au/company/corporate-governance/. Dealing in Securities Policy
This Policy sets out the obligations of all directors, officers and employees dealing in the securities of Molopo and entities with which it transacts or may transact. The Policy is compliant with Recommendation 3.2 and prohibits trading by all persons aware of price sensitive information about the Group.
In accordance with Recommendation 8.4, Molopo’s Dealing in Securities Policy prohibits directors, officers, employees and their related parties from entering into transactions in products associated with shares or options in Molopo that operate to limit the economic risk of holding any unvested shares or options in Molopo at any time.
This policy is available on Molopo’s website at http://www.molopo.com.au/company/corporate-governance/. Significant Accounting Policies Details of significant accounting policies are set out in Note 3 to this Financial Report. Risk Management Oversight of the Risk Management System The Board oversees the establishment, implementation, and annual review of Molopo’s Risk Management System. Management has established a Risk Management System for assessing, monitoring and managing all risk, including material business risks for the Group (including sustainability risk), in line with Recommendation 7.1. In accordance with Recommendation 7.3, the Chief Executive Officer and Chief Financial Officer have provided an assurance, in writing to the Board, that the financial reporting risk management and associated compliance and controls have been assessed and found to be operating effectively. Pursuant to Recommendations 7.2 and 7.4, the operational and other risk management compliance and controls have also been assessed and found to be operating effectively. Risk Profile Material business risks for Molopo may arise from such matters as actions by competitors, Federal and State government policy changes, inherent risks associated with petroleum exploration and development, impact of price changes of oil and gas, inherent risks in estimating quantities of reserves, environment, occupational health and safety, property, financial reporting and the use of information systems.

MOLOPO ENERGY LIMITED DECEMBER 2012 ANNUAL REPORT
89
Risks are continually assessed, monitored and managed at management level. Any areas of significant risk are dealt with at the Board level. Details of Molopo’s Risk Management Policy are available on Molopo’s website at http://www.molopo.com.au/company/corporate-governance/. Risk Management, Compliance and Control The Board is responsible for the overall internal control framework, but recognises that no cost-effective internal control system will preclude all errors and irregularities. To manage Molopo’s risk profile, the Board has established an internal control framework as follows:
• Financial reporting accuracy and compliance with the financial reporting regulatory framework; • Limits of authority specifying delegated authority and limits of authority in areas of operational and capital
expenditure; • Monitoring and review of occupational health and safety standards in order to achieve high standards of
performance and compliance with regulations; • Authorisation of business transactions to ensure proper execution; and • Monitoring and review of environmental performance to ensure compliance with environmental
regulations (refer to Directors’ report).
Further details are available on Molopo’s website at http://www.molopo.com.au/company/corporate-governance/. Remuneration Structure The Company complies with Recommendation 8.3 as Non-Executive Directors are not entitled to participate in Molopo’s incentive scheme.

MOLOPO ENERGY LIMITED DECEMBER 2012 ANNUAL REPORT
90
ASX Additional Information Additional information required by the Listing Rules of the Australian Stock Exchange Limited and which is not disclosed elsewhere in the Annual Report is as follows. The information is as at 15 March 2013. Shareholder Distribution
The number of investors holding less than a marketable parcel of 1,786 shares (at $0.28 on 15/03/2013) is 1,169 and they hold 1,007,082 securities. Category (number of securities) Ordinary Shares (listed) Number of holders Number of shares Percentage (%) 1 -1,000
755 439,998 0.18 1,001 - 5,000 2,082 6,120,258 2.48 5,001 -10,000 1,079 8,476,214 3.44 10,001 -100,000 1,960 61,187,405 24.84 100,001 - and over 233 170,148,019 69.06
TOTAL 6,109 246,371,894 100.00 Twenty Largest Shareholders as at 15 March 2013
The names of the 20 largest holders of quoted shares are: Listed Ordinary Shares Shareholder Number Percentage
CITICORP NOMINEES PTY LIMITED 36,583,165 14.85% GIBRALT CAPITAL CORPORATION 15,739,757 6.39% HOLBROOK CORPORATION PTY LTD 8,303,952 3.37% J P MORGAN NOMINEES AUSTRALIA LIMITED 8,279,551 3.36% HSBC CUSTODY NOMINEES (AUSTRALIA) LIMITED-GSCO ECA 6,227,139 2.53% JP MORGAN NOMINEES AUSTRALIA LIMITED 4,519,028 1.83% HSBC CUSTODY NOMINEES (AUSTRALIA) LIMITED 3,575,134 1.45% DARTALE PTY LTD 3,500,000 1.42% HOCHLUNCH PTY LTD 3,425,000 1.39% ABN AMRO CLEARING SYDNEY NOMINEES PTY LTD 3,296,088 1.34% NATIONAL NOMINEES LIMITED 3,250,853 1.32% ARRAS PTY LTD 2,300,000 0.93% BNP PARIBAS NOMS PTY LTD 2,138,503 0.87% BETA GAMMA PTY LTD 1,731,224 0.70% RUBI HOLDINGS PTY LTD 1,700,000 0.69% R & R CORBETT PTY LTD 1,657,715 0.67% MERRILL LYNCH (AUSTRALIA) NOMINEES PTY LIMITED 1,631,866 0.66% AVATAR EQUITIES PTY LTD 1,416,620 0.57% MUTUAL TRUST PTY LTD 1,337,255 0.54% DILAN CORP PTY LTD 1,200,000 0.49%
Total 111,812,850 45.38%

MOLOPO ENERGY LIMITED DECEMBER 2012 ANNUAL REPORT
91
Substantial Holders Gibralt Capital is a substantial holder in the Company, with a holding of 21,313,208 shares. Scoggin LLC is a substantial holder in the Company, with a holding of 17,492,535 shares. Voting Rights On a show of hands every shareholder present in person or by proxy holding ordinary shares in the Company shall have one vote and upon a poll each share shall have one vote. There are no voting rights attached to the options, performance share rights or performance rights. Number of Restricted Securities As at 15 March 2013, there were no restricted securities. Incentive Options As at 15 March 2013, the Group had 455,000 Incentive Options on issue under the Molopo Energy Limited Employee Incentive Scheme, which are not quoted on the Australian Securities Exchange. These Incentive Options are held by 3 holders. Optionholder Distribution
Category (number of securities) Unquoted Options Number of holders Number of options Percentage of total
(%) 1 -1,000 -
-
- 1,001 - 5,000 -
-
- 5,001 -10,000 -
-
- 10,001 -100,000 2
155,000
34.1
100,001 - and over 1
300,000
65.9
TOTAL 3 455,000 100.0
Performance Share Rights As at 15 March 2013, the Group had 3,155,602 Performance Share Rights on issue under the Molopo Energy Limited Employee Incentive Scheme, which are not quoted on the Australian Securities Exchange. These Performance Share Rights are held by 43 holders. Performance Share Rights Distribution Category (number of securities) Unquoted Performance Share Rights Number of holders Number of PSRs Percentage of total
(%) 1 -1,000 1
534
-
1,001 - 5,000 3
6,520
0.2 5,001 -10,000 6
46,456
1.5
10,001 -100,000 22
970,310
30.7 100,001 - and over 11
2,131,782
67.6
TOTAL 43 3,155,602 100.0

MOLOPO ENERGY LIMITED DECEMBER 2012 ANNUAL REPORT
92
Performance Rights As at 15 March 2013, the Group had 71,982 Performance Rights on issue under the Molopo Energy Limited Employee Incentive Scheme, which are not quoted on the Australian Securities Exchange. These Performance Rights are held by 37 holders.
Performance Rights Distribution Category (number of securities)
Unquoted Performance Rights
Number of holders
Number of PRs
Maximum Number of Shares
Percentage of total (%)
1 -1,000 -
-
-
- 1,001 - 5,000 8
209
20,900
0.3
5,001 -10,000 3
207
20,700
0.3 10,001 -100,000 9
3,638
363,800
5.1
100,001 - and over 17
67,928
6,792,800
94.4
TOTAL 37 71,982 7,198,200 100.0 Resource Tenements As at 15 March 2013, the Group had an interest in the following mining tenements/licenses:
Prospect State, Country Equity interest Mining Tenement
USA Texas 100% Various
USA West Virginia 50% Various
Canada Quebec 100% Various
Canada Saskatchewan 100% Various
South Africa Free State Province 100% Various

MOLOPO ENERGY LIMITED DECEMBER 2012 ANNUAL REPORT
93
Glossary of Terms “ASX” means the Australian Securities Exchange.
“Board of Directors” means board of directors of the Company.
“COGE Handbook” means the Canadian Oil and Gas Evaluation Handbook prepared jointly by the Society of Petroleum Evaluation Engineers (Calgary chapter) and the Canadian Institute of Mining, Metallurgy & Petroleum.
“Corporations Act” means the Corporations Act 2001 (Cth) (Australia) as amended from time to time, including the regulations promulgated thereunder.
“Development costs” means costs incurred to obtain access to reserves and to provide facilities for extracting, treating, gathering and storing the oil and gas from the reserves. More specifically, development costs, including applicable operating costs of support equipment and facilities and other costs of development activities, are costs incurred to:
(a) gain access to and prepare well locations for drilling, including surveying and acquiring well locations for the purpose of determining specific development drilling sites, clearing ground, draining, road building, and relocating public roads, gas lines and power lines, to the extent necessary in developing the reserves;
(b) drill and equip development wells, development type stratigraphic test wells and service wells, including the costs of platforms and of well equipment such as casing, tubing, pumping equipment and the wellhead assembly;
(c) acquire, construct and install production facilities such as flow lines, separators, treaters, heaters, manifolds, measuring devices and production storage tanks, natural gas cycling and processing plants, and central utility and waste disposal systems; and
(d) provide improved recovery systems.
“Development well” means a well drilled inside the established limits of an oil or gas reservoir, or in close proximity to the edge of the reservoir, to the depth of a stratigraphic horizon known to be productive.
“Exploration costs” means costs incurred in identifying areas that may warrant examination and in examining pecific areas that are considered to have prospects that may contain oil and gas reserves, including costs of drilling exploratory wells and exploratory type stratigraphic test wells. Exploration costs may be incurred both before acquiring the related property (sometimes referred to in part as “prospecting costs”) and after acquiring the property. Exploration costs, which include applicable operating costs of support equipment and facilities and other costs of exploration activities, are:
(a) costs of topographical, geochemical, geological and geophysical studies, rights of access to properties to conduct those studies, and salaries and other expenses of geologists, geophysical crews and others conducting those studies (collectively sometimes referred to as “geological and geophysical costs”);
(b) costs of carrying and retaining unproved properties, such as delay rentals, taxes (other than income and capital taxes) on properties, legal costs for title defence, and the maintenance of land and lease records;
(c) dry hole contributions and bottom hole contributions;
(d) costs of drilling and equipping exploratory wells; and
(e) costs of drilling exploratory type stratigraphic test wells.
“Exploratory well” means a well that is not a development well, a service well or a stratigraphic test well.
“Fracture” means a break in a rock that can serve as both a migration pathway and a reservoir for gas, oil or water.

MOLOPO ENERGY LIMITED DECEMBER 2012 ANNUAL REPORT
94
“Forecast prices and costs” means future prices and costs that are:
(a) generally accepted as being a reasonable outlook of the future; and
(b) if, and only to the extent that, there are fixed or presently determinable future prices or costs to which the Company is legally bound by a contractual or other obligation to supply a physical product, including those for an extension period of a contract that is likely to be extended, those prices or costs rather than the prices and costs referred to in paragraph (a).
“Gross” or “gross” means:
(a) in relation to the Company's interest in production and reserves which are the Company's working interest (operating and non-operating) share before deduction of royalties and without including any royalty interest of the Company;
(b) in relation to wells, the total number of wells in which the Company has an interest; and
(c) in relation to properties, the total area of properties in which the Company has an interest.
“Hydrocarbons” means any liquid or gas made up of an appreciable volume of combustible organic compounds.
“IFRS” means International Financial Reporting Standards as adopted by the International Accounting Standards Board from time to time.
“Molopo” or the “Company” means Molopo Energy Limited, a Company incorporated under the Corporations Act.
“Natural gas” as described in the COGE Handbook means a mixture of lighter hydrocarbons that exist either in the gaseous phase or in solution in crude oil in reservoirs but are gaseous at atmospheric conditions. Natural gas may contain sulphur or other non-hydrocarbon compounds.
“Natural gas liquids” or “NGLs” as described in the COGE Handbook means those hydrocarbon components that can be recovered from natural gas as liquids including, but not limited to, ethane, propane, butanes, pentanes plus, condensate and small quantities of non-hydrocarbons.
“Net” or “net” means:
(a) in relation to the Company's interest in production and reserves, the Company's working interest (operating and non-operating) share after deduction of royalty obligations, plus the Company's royalty interests in production or reserves;
(b) in relation to wells, the number of wells obtained by aggregating the Company's working interest in each of its gross wells; and
(c) in relation to the Company's interest in a property, the total area in which the Company has an interest multiplied by the working interest owned by the Company.
“Operator” means the party that runs the day to day hydrocarbon exploration and production programme on behalf of the working interest holders in the project.
“Operating costs” or “Production costs” means costs incurred to operate and maintain wells and related equipment and facilities, including applicable operating costs of support equipment and facilities and other costs of operating and maintaining those wells and related equipment and facilities.
“Ordinary Share” or “Ordinary Shares” means, respectively, one or more ordinary shares in the capital of Molopo.
“Play” means a trend within a prospective basin that has common geologic elements.

MOLOPO ENERGY LIMITED DECEMBER 2012 ANNUAL REPORT
95
“Probable reserves” means reserves that are less certain to be recovered than proved reserves. It is equally like that the actual remaining quantities recovered will greater or less than the sum of the estimated probable reserves.
“Production Right” means the right to produce natural gas in South Africa.
“Property” includes:
(a) fee ownership or a lease, concession, agreement, permit, license or other interest representing the right to extract oil or gas subject to such terms as may be imposed by the conveyance of that interest;
(b) royalty interests, production payments payable in oil or gas, and other non-operating interests in properties operated by others; and
(c) an agreement with a foreign government or authority under which a reporting issuer participates in the operation of properties or otherwise serves as “producer” of the underlying reserves (in contrast to being an independent purchaser, broker, dealer or importer);
but does not include supply agreements, or contracts that represent a right to purchase, rather than extract, oil or gas;
“Proved property” means a property or part of a property to which reserves have been specifically attributed;
“Proved reserves” means reserves that can be estimated with a high degree of certainty to be recoverable. It is likely that the actual remaining quantities recovered will exceed the estimated proved reserves. Proved reserves may be divided into developed and undeveloped:
a) “Developed reserves” means those reserves that are expected to be recovered from existing wells and installed facilities or, if facilities have not been installed, that would involve a low expenditure (for example, when compared to the cost of drilling a well) to put the reserves on production. The developed category may be subdivided into producing and non-producing;
1) “Developed producing reserves” means those reserves that are expected to be recovered from
completion intervals open at the time of the estimate. These reserves may be currently producing or, if shut-in, they must have previously been on production, and the date of resumption of production must be known with reasonable certainty;
2) “Developed non-producing reserves” means those reserves that either have not been on
production, or have previously been on production, but are shut-in, and the date of resumption of production is unknown; and
b) “Undeveloped reserves” means those reserves expected to be recovered from known accumulations where a significant expenditure (for example, when compared to the cost of drilling a well) is required to render them capable of production. They must fully meet the requirements of the reserves classification (proved, probable) to which they are assigned.
“Shale Gas” means natural gas (methane) that is produced from reservoirs predominantly composed of shale with lessor amounts of other fine grained rocks;
“Sproule” means Sproule Associates Limited;
“Tight Oil” means oil from low permeability rocks.

MOLOPO ENERGY LIMITED DECEMBER 2012 ANNUAL REPORT
96
Abbreviations
“Bbl” Barrel – a volumetric unit of measurement equivalent to 0.159 cubic metres or 159 litres
“Boe” barrels of oil equivalent
“Bbl/d” barrels per day
“Boe/d” barrels of oil equivalent per day
“Mbbl” thousand Bbl
“Mboe” thousand boe
“Mcf” thousand cubic feet
“Mmcf” millions cubic feet
“Mcf/d” thousand cubic feet per day
“Mmcf/d” millions cubic feet per day
.

MOLOPO ENERGY LIMITED DECEMBER 2012 ANNUAL REPORT
97
Molopo Energy Limited www.molopo.com.au