money demand and inflation in switzerland: an …s l~miiowirs annoiini’ed path i he ruble at 1978...
TRANSCRIPT

43
Tobias F. Rotheli
Tobias F. ROtheli, an economist at the Swiss National Bank inZurich, was a visiting scholar at theFederal Reserve Bank of St.Louis. Laura A. Prives providedresearch assistance.
Money Demand and Inflation inSwitzerland: An Application ofthe Pascal Lag Technique
N 1973, the Swiss National hank ceased peggingthe Swiss franc to the U.S. dollar. In so doing, theSwiss monetary authorities gained control over’the domestic money stock. ‘I’his article describesthe m’ole of money demand estimates in the newmonetaty policy. It then assesses this foundationof policy by developing a statistical model for’money demimand tailored to Ike current exchange
rate and monetary conttol regime.
SWISS MONETARY POLICY
Under the Br’etton Woods system, Switzer-landwas one of many countries to experience thetransmission of U.S. intlation to its economy. Be-cause the Swiss National Bank pegged the cx-change rate of the Swiss franc against the U.S. dol-
lam’, there was a close connection between U.S. andSwiss inflation. Ar-bitrage saw to it that changes in
the dollar prices of internationally traded goodswere matched by proportional changes in corre-sponding Swiss franc prices. Competition causedthe prices of Swiss domestic goods to keep pace
with the prices of internationally traded goods.Meanwhile, the public adjusted the Swiss moneystock to the rising price level, in order to hold realmoney balances at the desired level.’
The Determination of MonetaryTargets
The beginning of 1973 marked a change in themonetaty regime. With the transition to flexible
exchange rates, the Swiss monetary authorities
‘This does not mean that inflation is not amonetary phenome-non. Under fixed exchangerates, inflation in a particular coun-try is not caused by the money growth of that country, but bythe combined money growth of all countries participating in thismonetary arrangement. In such an environment, a small coun-try is a price taker, with virtually no influence on the world pricelevel, When the exogeneous price level rises, domestic resi-dents restore their real balances by accumulating foreign
exchange (dollars) through current account surpluses. Theseearnings are then converted to domestic currency (Swissfrancs) by the central bank (the Swiss National Bank) which isready to make any transaction at the given exchange rate.

44
Monetary Targets and Monetary GrowthAt the c’iicl ot l9-I. rim Swiss Nail ,omiai Bank ruoIur~growl Ii ~ as univ 0.1 I ni’r’t’i~’Ithigiwr
SNR’ announced the lust nmunt’Lar’ target.’ than the t,in~c’tml~altu’.t nIii llJ7M \l I taigr’ls \~I’i’eus’cl liic’si’ rar’gtiIs
i.vc’rc’ ri’ansialed into o1wiatioiuil taigi’t&. or liii’ IVionetary Growth: Targeted andnlolleiai’ ii,jsc’. ‘icr acc’cjrir1,hsh tIns a \-nulnlr Effectivemodel ttii’c’rasriilg the iiitittipliiii rln’ jul 1cm be—
lween Mt and tlrc’ husi’ nas dn-eloprd.— lu’ TargetVariabie’ Targev Effective’
~UtS niiplenie ited niainiv through lou- ~.. — - .
Vigil t’\chanr4n purUlthsPS and saks. 1975 M 6 4.41976 M 6 77
hip zu’tuai r’otrrSc’ tit hi imioiiev stoi’I~cliii not 1977 M 5 55alwa~s l~miiowirs annoiini’ed path I he ruble at 1978 M 5 16.2right sirca~stim iargittc’d and c’lii’c’lhv WOOV\ 1979 —. ——
growth nitt’~LIJI to IWW. 1 tic’ Sw~sN,rtiuirat 1981 M 4 05Rank tried. iiuairil~in liii’ sc’vi’umtii’,,. to clauirin’n 1982 M 3 26
trial’ movnric’nts ol the exi hunge rule to 1983 M 3 36
11)78. For’ esample. thi’ Swiss Iram appnc’iat.’d 1984 M 3 25stror’ugl~against Itit, clolIm’. as a result Swiss 1985 M 3 2.2c’sports oFgranl’, Zulu st’fl 1(1’S ap~iuusinatel~ to
perc’c’.nl ol gross national int’onmc’ dtc’hric’cI Ii) This t.’ihe is upda—od Iron Kohli and Rich f1986~inn vol Inn ttlc’l ilt)Pl’(’(’iltlOil cii the Sn iss fi’,tnt’ M covers cL’ro’rcy otrts:de the fode’al aovernrrent ar.d
the I 101 ie I in atit hor i t\ ~‘ rid t’d t t W munu ‘~‘ the conlmercia! ~arkt. as weV as oonnanrc ceposits ofSwiss nonbarks with the post’a qro system and the
~nppi~ I it hr ~cm’ndliii t ii ~i I I in 010111 t ri \ c,ur”rrncrcial barks M s’ards4rr the a jsted “ioret’~y
I argu :1 ton I ~i7$ \~Is at ian cloiIi‘ci i ri ~ t en ii 11W base fceposns of private secto’ wIn Inc SNB and
hire n as no tur’MeI Fur rtri arid si it’ i outstanding cant notes k-’ss Inc nrnnlh pin buge ri SNB-‘ credit to the commorcia bants)
iargu’ts trW rht’ adItIsted nionetun.’ ba~ehau’ Average of rrorith:y yPar-on-year rates of changebeen irsed) The target for 1980 was delined as the average
- ‘ ‘ percentage increase in M over tee eve ot Nover.ber%\ hi ii’ eM’hangc i a U’ cc unsrdc’rat ions led to ‘979 For eacn month of 1980. the oetentag~ ircroase
I r lar kr ‘d di’~i,it ii ins horn liii Pu ci ‘tIll 11101 ifl’ over the level of Novemoer 1979 was calcu a:ec. Thepal ii these cle~i;itions \‘ t’r~t’ni’ ii iali,’,c’il in thu morthly growth rates were in tim cornpou.nced in orcc’roctarn annua.ized rates The etfect’vc rate or 0 6long ru . I)u a~c’i’agit I Au ‘r the I t Vi ‘a “4 liii percent ropreser’s The average of the -ar.’iuali/s’d growtn
which targels ~ i’t’it annount’c’rI, tile annual rates.
‘Kohr and Rich i1986~proviae a survey of the Swiss expen- treatment of Inc relation between the money suop:y ano realment of monetary control For a comparisonof U S and Swiss exchange tate fluctuations.experience wrlh monetary targeting. see Rich 119871 Rich and Beguolini 1985; give deia”ed .nforma!ion on buth
‘See Battier et al 119791 on the muitiplier model Mi arid base targetng and reasons 1or the transition to the
‘See Nieharts f19841 chacters fl and 13 for an in-depth af,er.
i’or.ricl rlr’ti’rini ic donirstic nInonu’\ grnnth and samples \t’c’oid rig In Iiri’~t’sludrr5 the ch’liatedirttlatiorr iridipr’iic!i’ritl~ lulcmIIit,ru ,ii4i4ii,gZltI’s ti ni liii’ lilninelan IIZLS( tim
iii’ ~~i’il r’1mi;ii ii’tt liv Inc ~,Hai,Ies: tIn’\loni’tar’~ targets pl~ni’cla i’entn,ui nil.’ ri tIlt’ - - -
‘ . . . ‘ uuitr’m’,t rate and n,itiumn,ui iiicnrtwiinpiemc’ntatrnn ml till’ lien ~)OliI’\ sri’instil ,iiicrw I lit’ S~~rss\ationai ihuik relied iii lrrn~—nunu~nalo! Sniss nrorii’tan p~h~is
stnuigl~ liii nriimmn’~demand i’slmi,ilt’s in rstdmlkh piii’u ic’~eisIalniit~.in radii to ,irhii’u’ tlus dill.irig ttlcd’.c’ targets \in l’auI_\ c’rrmnorni’Iric’ stnd~ cit tIn’ nominal niionn stork his tot nc’rr’asr’ h~asS~\i’,sluurlld’\ uIc’iii,uirii ~\ls itnhilisli.’ci li~ Sclri’liii’i’t uiitrr’h as thu gruntit ii) liii’ denii,inirl liii real tnmiiiev
Ii ttjt~’ Iii latin tc’sl’~uIr’hl.~lulli 11178 Kohlr ltIM.i . haiainrt’s ibis is nhrn’ Ill’ minnii’~di’mnanci i’sti
ciii t~iihli tori h’irh t9,Mli pooled data mom time ni,ites enlr’r’ tue prrhrv riiZlkiiig p10155. 5111ev ri
fixed and the flexible exchange rate period in theii terest m’ate changes are hardly predictable, they are

45
not taken into consideration when formulating themonetary target. This leaves the income elasticity
of money demand as the decisive coefficient. Mul-tiplying the income elasticity by the expectedgrowth of real income provides an estimate of the
growth of the money supply consistent with astable price level,
The statistical findings indicate that the incomeelasticities of the demand for base money and Mlare close to unity. This leads to the rule of thumbthat price level stability can be achieved if moneygrowth is equal to the growth of real income, Thegrowth potential of the Swiss real income is esti-mated to be around 2 percent per year.2 Accord-ingly, the Swiss monetary targets have been gradu-ally lowered over time to 2 percent in 1986.
.Mdnetan~Regime and Money DemandEstimation
With the change to flexible exchange rates, theestimation of the money demand function mustbe reconsidered Under the current regime ofmonetary control, the nominal money supply isexogenous. Consequently, price level movementsmust bring aggregate real money balances in linewith the desired level, The Chow money demand
specification, the one most widely used in Swissmoney demand estimates, does not adequately
capture this adjustment process.2 This problemappears in empirical findings: Hen (1986) reports
that the explanatory power of a Chow specification decreases substantially when the samplecontains data only from the flexible-exchange-rateperiod.
The present article develops a model of pricelevel adjustment to estimate Swiss money demandfor the period from 1/1973 to IV/1986. Since we areinterested in accurate measurements of the in-come and interest rate elasticities, an estimationprocedure is chosen that considers a broad rangeof dynamic adjustments of the price level.
ESTIMATING THE MONEY DEMANDFUNCTION FOR THEFLEXIBLIUEXCHANGE-WtTEPERIOD
We start with a long-run demand for moneyfunction:
(1) M~= f)Z),
where M~.’denotes real money balances demanded,and Z is a set of variables, usually including a mea-
sure of real income and one or more interest rates.Equilibrium requires that equation 2 holds:
(2) M/P4=
The nominal money stock, M, is exogenous. There-fore, this equation determines the equilibrium
price level ~ The actual price level, P, does notalways equal P4. Laidler (1985) elaborates:
When aflexible price economy is pushed off itstong-run demand-for-money function, it movesback by way of the influence of price level changeson the stock of reat balances. If the price level isperfectly flexible, such adjustment is instantane-ous, and only a long-run aggregate demand-for-money function is observable. However, if pricesmove less than instantaneously, we would observethe economy moving slowly to equilibrium overtime byway of price level changes influencing thequantity of real balances.~
To illustrate this point, consider the followingexperiment: We start with the price level in equi-librium (at P~J,Now) the quantity of money is in-creased. At the prevailing price level, real balances
are above their equilibrium value, which inducespeople to increase their spending and investment,In an economy close to full employment, the in-creased demand will drive up prices.
In this process, existing contracts are renegoti-ated over time. Hence, the price level does not
jump to the new equilibrium (P~immediately;instead, it adjusts gradually. Figure la shows twopossible shapes of this adjustment process.5 In its
2For an up-to-date study of the Swiss potential real incomegrowth, see Buttlem, Ettlin and Ruoss (1987).
~Chow(1966) introduced the following adjustment specificationfor money demand estimates:
M,,—M,,, = ~(Mf,—M,~4) O<I3~1,
where M, denotes real money balances, and M~isthe long-runmoney demand. Laidler (1985), pp. 111—12, points out that this“meal adjustment” version coincideswith a price adjustmentversion based on the partial-adjustment hypothesis only if themoney supply is invariant over time.
‘Laidler (1985), p. 111.5The notion that the real money stock can deviate from thedesired money stockand that this discrepancy is only slowlydiminished through price level changes has recently beencalled the ‘buffer stockconcept” of money. Laidler (1987)gives adescription of buffer stockmoney and the transmissionmechanism.

46
Figure laAdjustment Paths of the PriceLevel
Figure lbLag Weights for the Price LevelAdjustment
general form, the adjustment pm’ocess can be writ-ten as
(31 p, = ~ w,P~1,,i=Q
with ~ w,=1i=O
Figure lb shows the pattern of lag weights (wi thatcorrespond to the two adjustment paths in figureIa.’ The lag weights are also called the speed ofadjustment since they measure the adjustment ofthe price level per unit of time. The Koyck lag, the
simplest case, is denoted by the solid line. It canbe derived from a partial-adjustment hypothesiswhich states that the gap between P and P~isclosed by a constant fraction (~1pci-unit of time.This implies that the adjustment speed of theprice level is highest at the beginning and dimin-ishes steadily thereafter. Because of its simplicity,this adjustment specification has been the mostpopular form of capturing the dynamic aspects ofmoney demand?
Laidler questions the application of the partialadjustment hypothesis to the behavior of the pricelevel - He writes:
)W(e would have to argue that it is possible tocapture in one simple parameter ~ the entiretransmission mechanism whereby the price levelresponds to discrepancies between the supplyand demand for nominal money. This might hepossible, though it seems implausible to say theleast?
Laidler concludes that if we are, suspicious of thevalidity of the partial-adjustment hypothesis, thenwe must also be suspicious of all other parameters(for example, income and interest rate elasticities)estimated with a partial-adjustment specification.
Estimates for’ Switzerland suggest that the re-
sponse of the prce level to changes in the moneystock resembles the pattern shown by the dashedline in figures Ia and lb.” This adjustment is char-
acterized by a slowly increasing adjustment speedin the initial stage of the process; it takes time for’the price level movement to build momentum. To
get accurate estimates of income and interest rateelasticities, it is therefore wom’thwhile to consider a
‘Equations2 and 3 ensure that aconstant growth rate of moneyeventually leads to a rate of inflation equal to the rate of moneygrowth.
‘See Thornton (1985) for a concise overview of applications ofthepartial-adjustment hypothesis in money demand estimates.
‘Laidler (1985), p. 111.
‘SeeWasserfallen (1985) andZenger (1985).
P WI
47
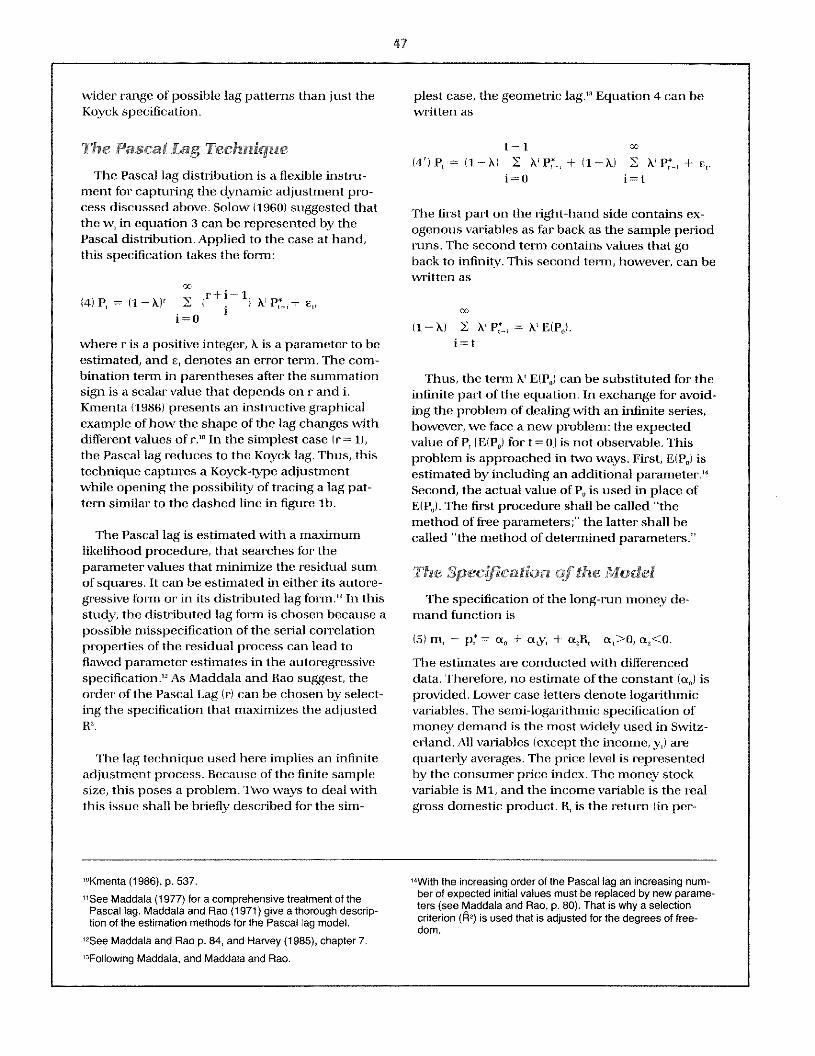
wider range of possible lag patterns than just theKoyck specification.
The Pascal Lag Technique
The Pascal lag distribution is a flexible instru-ment for capturing the dynamic adjustment pro-cess discussed above. Solow (1960) suggested thatthe w, in equation 3 can be represented by thePascal distribution. Applied to the case at hand,this specification takes the form:
(4)P, = (I—k)’(r+I1( k’P~,+ s,
i=0
where r is a positive integer, K is a parameter to beestimated, and e, denotes an error term. The com-bination term in parentheses after the summationsign is a scalar value that depends on r and i.Kmnenta (1986) presents an instructive graphicalexample of how the shape of the lag changes withdifferent values of r.’°In the simplest case )r= 1),the Pascal lag reduces to the Koyck lag. Thus, this
technique captures a Koyck-type adjustmentwhile opening the possibility of tracing a lag pat-tern similar to the dashed line in figure ib.
The Pascal lag is estimated with a maximum
likelihood procedure, that searches for theparameter values that minimize the residual sumof squares. It can be estimated in either’ its autore-gressive form or in its distributed lag form.” In thisstudy, the distributed lag form is chosen because apossible mnisspeciflcation of the serial con-elationproperties of the residual process can lead toflawed parameter estimates in the autoregressivespecification.” As Maddala and Rao suggest, theorder of the Pascal Lag fri can be chosen by select-ing the specification that maximizes the adjusted
The lag technique used here implies an infinite
adjustment process. Because of the finite samplesize, this poses a problem. Two ways to deal withthis issue shall be briefly described for the sim-
plest case, the geometric lag.’~Equation 4 can bewritten as
t—l14’) P = (1—k) E KP~L,+ )1’—k) ~ X!P~,+ e,.
i=0 i=t
The first part on the right-hand side contains ex-ogenous variables as far back as the sample periodruns. The second term contains values that goback to infinity. This second term, however, can bewritten as
00
(i—K) ~ K’P~= KElP,).i=t
Thus, the term K’ El PO) can be substituted for theinfinite part of the equation. In exchange for avoid-ing the problem of dealing with an infinite series,however, we face a new problem: the expectedvalue of P, [ElP,) for’ t = 0] is not observable. Thisproblem is approached in two ways. First, El P,) isestimated by including an additional parameter.”Second, the actual value of P, is used in place ofEl P,). The first procedure shall be called “themethod of free parameters;” the latter shall becalled “the method of determined parameters.”
The Spec~cation of the Model
The specification of the long-run money de-mand function is
IS) m, — p’ = a, + a,y, + a,R, a,>0, a,<0.
The estimates are conducted with differenced
data. Therefore, no estimate of the constant (a,) isprovided. Lower case letters denote logarithmicvariables. The semi-logarithmic specification of
money demand is the most widely used in Switz-erland. All variables (except the income, y,) arequarterly averages. The price level is representedby the consumer price index. The money stockvariable is Mi, and the income variable is the realgross domestic product. R, is the return (in per-
‘°Kmenta(1986), p. 537.~lSee Maddala (1977) for a comprehensive treatment of the
Pascal lag. Maddala and Rao (1971) give athorough descrip-tion of the estimation methods for the Pascal lag model.
“See Maddala and Rao p. 84, and Harvey (1985), chapter 7.
‘4With the increasing order of the Pascal lag an increasing num-ber of expected initial values must be replaced by new parame-ters (see Maddala and Rao, p. 80). That is why aselectioncriterion (A’) is used that is adjusted for the degrees of free-dom.
“Following Maddala, and Maddala and Rao.

48
centage points) on three-month Euro-deposits inSwiss francs.”
Estimation Results
The first round of estimates is conducted by usingthe method of free parameters. The equilibriumprice level in equation 4 is replaced by its determi-nants according to equation 5-The following equa-
tion is then estimated:
(13) Asp, =
(I —K)’ ~ )r+ii( K Iám,, — a,Ay,~ —
+ C,.
i=0
Table 1 contains the il’s and the estimates of K fororder’s of the Pascal lag ranging from one to four.The K estimates, which range from 0.77 to 0.97,indicate that the empirical adjustment is ratherslow; fast adjustment would imply a K close tozero. The lag distribution implied by the estimatesof K are shown in chart 1. Since the maximum R’ isachieved with the r = 2 specification, the estimatesreject the Koyck lag )t-= 1) as the best specificationof the adjustment process. Visible for the optimalcase )r’ = 2) is a small adjustment of the price levelwithin the quarter of the disturbance. In contrastto the Koyck lag, w, t-eaches its maximum valueonly six quarters after the disturbance and thenslowly decreases. It takes approximately 10 quar-ters for the price level to adjust by 50 percent to-
ward a new equilibrium value. This is much closerto the 12 quarters that both Wasserfallen andZenger report than the 19 quarters implied by theKoyck estimate. Chart 2, the empirical counterpartto figure la, shows the adjustment paths of theprice level implied by the Pascal lag estimates forr = i and r = 2. The chart assumes an increase inthe equilibrium price level from one to two in pe-riod one. The two adjustment paths show a simi-lar response of the price level only over the firstyear.
Table 1fl2 Statistics and X Estimates forPascal Lag Estimates of DifferentOrder (r): I/1973—IV/1986
r
1 0 3834 0 96632 0 4469 0 66773 0 4443 0 80254 04433 07741
I able 2 contains the parameter estimates ,tndvarious statistics for the r= 2 case. The two a coef-ficients have the expected signs. The interest semi-elasticity is very close to the corresponding esti-mate reported in Kohli and Rich (1986). Theincome elasticity, however, is substantially smallerthan in previous estimates and not significantlydiffer’ent from zero. As the appendix points out,however’, using the method of free parametersimplicitly involves the estimation of time trends,which can affect the reported results.
The method of determined parameters is usedto generate an alternative set of estimates. The II’
criterion again leads to the choice of the r’= 2 caseas the best dynamic specification; the results are
presented in table 3. The income coefficient is0.83; this time, it is significantly different fromzero. The other estimated coefficients are veryclose to the estimates obtained from the firstmethod.
The method of determined parameters dependsheavily on the starting values of the sample period.The model is correctly specified only when theinitial values of P are equal or nearly equal) to theexpected values for which they at-e substituted. Ifthis condition is not met, the estimate suffers frommisspeciflcation.16 This flaw is likely to produce a
“Data on the gross domestic product (GDP) are released quar-terly. The consumerprice index, published monthly, is a bettermeasure of Swiss inflation than the GDP deflator. ThenominalGOP, and hence the deflator, are subject to larger revisionsthan the deflatedGOP. The A’s of the estimates decreasesubstantially when the consumer price index is replaced by theGOP deflator. Although the estimated coefficients remainvirtually unchangedwhen the GOP is deflated with the con-sumerprice index, theA’s of the estimates decrease. There-fore, the officiallydeflated series for the GOP is used in thisstudy. The interest rate for Euro-deposits in Swiss francs is
consideredthe best indicator for the return on money marketinstruments in Switzerland. Published domestic rates areapplicable to small investors; large investors are able to getEuromarket rates(about half a percentagepoint more than thedomestic rate) even if they deposit their funds with a domesticbank.
“Thiscan be seen with the terminology used in the appendix:while the method of free parameters searches tory values thatminimize theresidual sum of squares, the method of deter-mined parameters imposes arbitrary ‘y values.

49
Chart 1Pascal Lag Estimates of Lag Weights for the PriceLevel Adjustment
Chart 2Pascal Lag Estimates of the Adjustment Pathof the Price Level
1.00
w0.07
0.06
0.05
•0.04
0.03
0.02
0.00
0 1 2 3 4 5 6 7 8 9 10 II 12 13 14 15 16 17 18 19 20 21 22 23 24
‘(Quarters)
0.01
2.’p
1.75
1.50
1 .25
2.00
1 .75
1.50
0.75
1.25
1.00
750 1 2 3 4 5 6 7 8 9 10 11 12 13 14 IS 16 17 18 19 20 21 22 23 24
t fouarters)

50
/ N
Tablb3
<~iheMethOflffletermine4Pararn$ern.CI/t~Z3tttflS*
N // //
\,/\~\ N/~\>~/\/\ ~
~/1 /W
// //t*
/ / / ~‘
/ ~‘ //////~/ /,/~/, ~ //i/j”~>, /N•••
~ ~a~!c~e ~ ràtlev*
N /
poor fit and significant autocorrelation of the re-siduals. To get a feel for the magnitude of thisproblem, the model is reestimated with eight newstar’ting points ranging from 1973.2 to 1975.1. Table4 shows the outcome. The adjusted coefficient ofdeteimination (B’)varies widely with the startingvalue of the estimate. Six estimates show signifi-cant autocorrelation of the residuals. Only twoestimates pass a Durbin-Watson test for- misspeci-
fication; these two, with starting points 1973.2 and1975.1, have the highest B’s in this series of esti-mates. Finally, the parameter estimates in thesetwo cases are in line with those in tables 2 and 3.
Thus, while both methods of applying the Pas-cal lag to a relatively small data sample have theirlimitations, their estimates of the parameters oflong-run money demand, as well as the dynamicadjustment process, are consistent.

SUMMARY AND CONCLUSIONS
‘t’his article deals with the estimation of moneydemand in Switzeiland. During the period of mon-etarv control since 1973, the public has adjusted
real money balances to its desired level by meansof price level changes. Thus, the estimation ofmoney demand is tantamount to statisticallytracking variations in the price level.
The Pascal lag technique frees the adjustmentdynamics from the rigid corset of the partial ad-justment process so frequently used in money
demand studies. The statistical findings show thatthe partial adjustment process does not accu-rately desctibe how the pi-ice level adjusts to
changes in its determinants. It takes approxi-mately one and a half years for the adjustmentspeed of the price level to reach its maximum and
about one rTrole year before half of the necessaryadjustment is completed.
Among the.estimates that pass a test of misspec-ification no income coefficient of money demand
is statistically significantly different from one. Nev-ertheless, all point estimates are less than one.This result suggests that pr-ice level stability inSwitzei-land is more likely to be achieved with anMl growth somewhat less than real incomegt-owth.
REFERENCES
Bottler, H. J., J. F. Gorgerat, H. Schiltknecht, and K.Schiltknecht. “A Multiplier Model for Controlling the MoneyStock,” Journal of Monetary Economics (July 1979), pp. 327—41.
BOttler, H. J., F. Efflin, and E. Ruoss. “Empirische Schatzungdes Wachstums der potentiellen Produktion in der Schweiz,”Quartalsheft der Schweizerischen Nationalbank (March 1987),
pp. 61—71.Chow, Gregory C. “On the Long-Run and Short-Run Oemand
for Money,’ Journalof Political Economy (April 1966) pp. 111..-
51
Harvey, Andrew C. The EconometricAnalysis of Time Series(Philip Allan, 1985).
Hen, Erwin W. Die Geldnachfrage: Theorie und empirischeErgebnisse für die Schweiz (Springer, 1986).
Kmenta, Jan, Elements of Econometrics (Macmillan, 1986).
Kohli, Ulrich. “La demande de monnaieen Suisse,” BulletinTrimestriel deja Banque Nationale Suisse (June 1985), pp.64—70.
Kohli, Ulnich, and Georq Rich. “Monetary Control: The SwissExperience,” Cato Journal (Winter 1986), pp. 911—26.
Laidler, Oavid E. W. The Demand for Money (Harper and Row,1985).
_________ “‘Buffer Stock Money’ andthe TransmissionMechanism,” Federal Reserve Bank of Atlanta EconomicReview (March/April 1987), pp.11—23.
Maddala, G. S. Econometrics (McGraw-Hill, 1977).
Maddala, G. S., and A. S. Rao. “Maximum Likelihood Estima-tion of Solow’s and Jorgenson’s Oistributed Lag Models,” TheReviewof Economics and Statistics (February 1971), pp. 80—88.
Niehans, Jurg. International Monetary Economics (TheJohnsHopkins University Press, 1984).
Rich, Georg. ‘Swiss and United States Monetary Policy: HasMonetarism Failed?” Federal Reserve Bank of RichmondEconomicReview (May/June 1987), pp. 3—16.
Rich, Georg, and Jean-Pierre Beguelin. “Swiss MonetaryPolicy in the 1970s and 1980s: An Experiment in PragmaticMonetarism,” in Karl Brunner, ed, Monetary Policy and Mone-tary Regimes, Center Symposium Series C-i 7 (Center forResearch in GovernmentPolicy and Business, UniversityofRochester, 1985).
Schelbert-Sytrig, Heidi. Empirische Untersuchungen über dieGeldnachfrage in der Scfrweiz (Polygraphischer Verlag,1967).
Solow, Robert, M. “On a Family of Lag Oistributions,” Econo-metrica (April1960), pp. 393—406.
Thornton, Oaniel, L. “Money Oemand Oynamics: Some NewEvidence,” this Review (March 1985), pp. 14—23.
Vital, Christian. Geldnachfragegleichungen für die Schweiz(Verlag Industrielle Organisation, 1978).
Wasserfallen, Walter. Makrobkonomische Untersuchungen mitRationalen Erwartungen. Empirische Analysen tUr die Schweiz(Verlag Paul Haupt, 1985).
Zenger, Christian. “Bestimmungsgrunde der SchweizerischenKonjunktur-und lntlationsentwicklung,’ mimeo (Schweize-rische Bankgesellschatt. 1985).31.

52
AppendixImplicit Time Trends in the Pascal Lag EstimationUsing the Method of Free Parameters
This appendix demonstrates that using themethod of free parameters to apply the Pascal lagto a finite sample size implies the estimation oftime trends. ‘the Pascal lag of order 2 serves as anexample. The initial equation for this
case is
=
cc
II —K)’ ~ (i+1) K (Am,, — cx, ~y_, — a.
+ E,
i=0
The infinite part of the equation is omitted byrewriting this equation as
=
t—2(1—K)’ ~ (i+1) K(Am, — cx, ay,, —
i=0
— )t—1) K E)Ap,) + tK’’ E(Ap,) + e,.
Using the method of free parameters means esti-mating this equation in the form:
=
ti—K)’ ~ li+l) K’ tSm, — a ~y, — a,i=0
The estimation procedure is not designed to gen-
erate values of &, and &, that are equal to the cor-responding El~plvalues. Instead, the maximumlikelihood procedure will find values of these ‘free
parameters” that minimize the sum of squaredresiduals:
= EIAp,,) + ~,.
= EIAp,) + ~,.
Hence, implicitly, the method of free parametersrespecifles the initial equation to
=
cc
(1—K)’ ~ )i+1) K(Am,, — a, Ay,1 —
i=0
+ ~, )1—t) K’ + y tK’’ + s,.
The term thus added to the basic equation.y, (1 —t) K + -y. tK’’, is a time trend. The form ofthis time trend is limited: after a positive or nega-tive value at the beginning of the sample, it eventu-
ally goes toward zero. The trend parameteis. ~,and ~,, however, cannot be estimated explicitly.— )t—1)K’a, + tK’’a4 + s,.