monte carlo simulation of irradiation and killing in three...
TRANSCRIPT

International Journal of Radiation Biology, January–February 2012; 88(1–2): 115–122© 2012 Informa UK, Ltd.ISSN: 0955-3002 print / ISSN 1362-3095 onlineDOI: 10.3109/09553002.2011.602379
Monte Carlo simulation of irradiation and killing in three-dimensional cell populations with lognormal cellular uptake of radioactivity
Roger W. Howell1, Didier Rajon2 & Wesley E. Bolch3
1Department of Radiology, Division of Radiation Research, University of Medicine & Dentistry of New Jersey-New Jersey Medical School Cancer Center, Newark, NJ, and Departments of 2Neurosurgery and 3Biomedical Engineering, University of Florida, Gainesville, FL, USA
Correspondence: Prof. Roger W. Howell, Department of Radiology, UMDNJ-NJMS Cancer Center, F-1208, 205 S. Orange Avenue, Newark, NJ 07103, USA. Tel: 1 973 972 5067. Fax: 1 973 972 6474. E-mail: [email protected]
(Received 3 January 2011; revised 10 May 2011; accepted 25 June 2011)
Introduction
Prediction of radiation risks in diagnostic nuclear medicine and tumor response in therapeutic nuclear medicine rely largely on calculation of absorbed dose. Foreseeing this need, a general formalism was developed by the Medical Internal Radiation Dose (MIRD) Committee of the Society
115
AbstractPurpose: The biological response of tissue exposed to radiations emitted by internal radioactivity is often correlated with the mean absorbed dose to a tissue element. However, experimental studies show that even when the mean absorbed dose to the tissue element is constant, the response of the cell population within the tissue element can vary significantly depending on the distribution of radioactivity at the cellular and multicellular levels. The present work develops theoretical models to simulate these observations.Materials and methods: Two theoretical models were created to simulate experimental three-dimensional cell culture models with homogeneous and inhomogeneous tissue environments. The cells were assigned activities according to lognormal distributions of an alpha particle emitter or a monoenergetic electron emitter. Absorbed doses to the cell nuclei were assessed with point-kernel geometric-factor and Electron Gamma Shower version nrc (EGSnrc) Monte Carlo radiation transport simulations, respectively. The self- and cross-dose to individual cell nuclei were calculated and a Monte Carlo method was used to determine their fate. Survival curves were produced after tallying the live and dead cells.Results: Both percent cells labeled and breadth of lognormal distribution affected the dose distribution at the cellular level, which in turn, influenced the shape of the cell survival curves.Conclusions: Multicellular Monte Carlo dosimetry-models offer improved capacity to predict response to radiopharmaceu-ticals compared to approaches based on mean absorbed dose to the tissue.
Keywords: Multicellular dosimetry, radionuclide, electron, polonium-210
of Nuclear Medicine to calculate absorbed doses from tissue incorporated radioactivity (Loevinger and Berman 1968). The Committee recognized that internal dosimetry is compli-cated by the heterogeneous composition of the human body and that Monte Carlo techniques offered a powerful new approach to circumvent these complications (Brownell et al. 1968, Snyder et al. 1975). In fact, early efforts by members of the MIRD Committee were amongst the first uses of Monte Carlo techniques for radiation dosimetry (Ellett et al. 1964, 1965). Conventional organ absorbed dose estimates assume that radioactivity is distributed uniformly throughout the organ and the mean absorbed dose to the organ is calculated (Snyder et al. 1975). However, there have been dramatic improvements in MIRD dosimetry models that reflect the substructure of organs as well as tissue elements within them (Bolch et al. 1999, Bouchet et al. 1999, 2003). These and other models rely on improved nuclear medicine imaging capabili-ties that facilitate determination of activity within the voxels that represent tissue elements with volumes of about 0.2–1 cm3 (Rajon et al. 2000, de Carlan et al. 2003, Guy et al. 2003, Ljungberg et al. 2003, McKay 2003, Stabin 2003, Sgouros et al. 2004). However, even these improved approaches assume that all cells within the tissue element receive essen-tially the same absorbed dose. The tissue element may be comprised of a variety of cells having very different radiosen-sitivities (Oakberg 1971), and sometimes, depending on the radiopharmaceutical, very different degrees of incorporation of radioactivity (Makrigiorgos et al. 1990a, 1990b, Jönsson et al. 1992). Accordingly, the absorbed dose delivered to the various cells in the tissue element may differ markedly, as well as the corresponding biological response of the cells (National Council on Radiation Protection and Measurements [NCRP] 1979, Wessels and Griffith 1986, Humm and Cobb 1990, Humm et al. 1993, Feinendegen et al. 1994). Therefore, a combi-nation of dosimetry at the voxel, multicellular, and cellular levels will be required to predict response to nonuniform distributions of radioactivity. Toward this end, cellular dosimetry tools have been published as a MIRD monograph (Goddu et al. 1997).
Int J
Rad
iat B
iol D
ownl
oade
d fr
om in
form
ahea
lthca
re.c
om b
y U
nive
rsity
of
Med
icin
e &
Den
tistr
y on
01/
04/1
2Fo
r pe
rson
al u
se o
nly.

116 R. W. Howell et al.
Multicellular dosimetry is a growing field of study that has recently led to improvements in our capacity to predict the biological effects of non-uniform distributions of radioactiv-ity that are inherent in radiopharmaceutical delivery (Goddu et al. 1994, Charlton 2000, Kvinnsland et al. 2001, Howell and Bishayee 2002, Malaroda et al. 2003, 2005, Neti and Howell 2003, 2004, 2006, 2007, 2008, Howell and Neti 2005, Spaic et al. 2005, Howell et al. 2006, Kalogianni et al. 2007, Pinto and Howell 2007, Uusijarvi et al. 2008, Cai et al. 2010). A semi-empirical approach, that considers the mean cellular self-dose (Dself), the mean cellular cross-dose (Dcross), and the fraction of cells labeled f, has been used to predict cell kill-ing in multicellular clusters wherein 1%, 10%, or 100% of the cells were labeled with the beta-particle emitter 131I (Howell and Neti 2005) or the alpha-particle emitter 210Po (Neti and Howell 2007). While its predictive capacity was good for 131I down to about 1% survival, it was unable to match the satu-ration of the experimental survival curve that was observed at higher doses. Furthermore, the semi-empirical approach had very limited capacity to predict cell killing that was observed experimentally in multicellular clusters containing 210Po (Neti and Howell 2007). Thus, there is a need to further develop experimentally validated dosimetry and biological response models.
The present work describes new theoretical Monte Carlo approaches to multicellular dosimetry and biologi-cal response modeling for soft tissue environments and inhomogeneous tissue environments such as trabecular bone. These approaches, which are designed around our experimental multicellular cluster (Neti and Howell 2003, 2004, 2007) and Cytomatrix™ (Cell Sciences PTE, Singa-pore) models (Pinto et al. 2006, 2010, Pinto and Howell 2007), take account of lognormal distributions of radio-activity. They account for some of the key variables in these three-dimensional (3D) experimental models which showed that cell survival dose-response curves depend on differences in percentage of labeled cells, differences in relative biological effectiveness (RBE) between cellular self- and cross-dose, and activity distribution among the labeled cells.
Materials and methods
Multicellular cluster modelThe experimental conditions for our well-established multicellular cluster model are published (Bishayee et al. 2001, Howell and Bishayee 2002, Neti and Howell 2003, 2004, 2007). Briefly, the cluster consists of 4 106 Chinese hamster V79 cells, labeled with radioactivity, and tightly packed into a pellet at the bottom of a 400 ml microcentri-fuge tube. Cell clusters, containing various quantities of radioactivity, were maintained in these tubes at 10.5°C for a period of 72 h to accumulate decays. The clusters were then dismantled, serial dilutions of the cells were seeded into culture dishes for the colony forming assay. After incubating the culture dishes for one week at 37°C, 5% CO2 and 95% air, the colonies were washed, fixed, stained, and scored. The surviving fraction of initially seeded cells compared to controls was calculated and plotted as
a function of mean activity per cell a. Calculation of the radiation absorbed doses received by individual cells in the cluster requires spatial dimensions of the cells and the multicellular cluster, mass of the cluster, and how the activity is distributed among the cells.
Experimental measurement of cell dimensionsMeasurement of the dimensions of the cell and cell nucleus of V79 cells in multicellular clusters were determined using two methods. First, confocal microscopy was used to measure the diameters in situ. Cells were labeled with Molecular Probes® Vybrant™ carboxyfluorescein diacetate succinimidyl ester (CFDA SE) cell tracer kit (Invitrogen, Carlsbad, CA, USA) and clusters were assembled with the dyed cells according to our published procedures (Bishayee et al. 2001). The clusters were maintained at 10.5°C for 72 h and then delicately teased from the tube to minimize dis-ruption of the cluster. The cluster was placed on a slide and immediately placed into a Zeiss (Carl Zeiss, Thornwood, NJ, USA) Laser Scan Microscope LSM 410 invert with ArKr laser (488/568/647 nm). Slices (2-mm thick) were acquired by exciting at 488 nm and passage of the resulting CFDA SE fluorescence through a 515–545 band pass filter. A 3D rendering of the cluster geometry was obtained. The Zeiss software package was used to measure diameters of the cell and cell nucleus of about 50 cells. The mean diameters and standard deviations of the cell and cell nucleus were 11 1 and 8 1 mm, respectively. Additional measurements were made by disassociating the cluster in culture medium and measuring cell diameters with a Nikon (Melville, NY, USA) Labophot II upright microscope equipped with a calibrated eyepiece reticule. These measurements resulted in diam-eters of 13 2 and 8 1, for the cell and cell nucleus, respectively. Given the limitations of each approach, the averages of the diameters from the two methods were used, being 12 and 8 mm, respectively.
Geometry of the experimental multicellular cluster modelPrevious measurements yielded a cluster mass of 7.9 0.1 mg (Neti and Howell 2003); using this mass, the cell size measurements above, and assuming that cells are unit density spheres, the cell packing density can be calculated to be about 0.5. This roughly corresponds to the pack-ing density of a cubic lattice (0.5234; Conway and Sloane 1999) which is considerably looser than our earlier com-putational models that assumed hexagonal close-packed geometry with a packing density of 0.74 (Sastry et al. 1985, Goddu et al. 1994).
Theoretical multicellular cluster modelA Fortran 90 program, operating on a Sun Solaris (Oracle, Redwood Shores, CA, USA) platform, was written to theo-retically model the multicellular cluster consisting of V79 cells labeled with 210Po-citrate. The cell and cell nucleus were represented as concentric spheres of unit density mat-ter with diameters of 12 and 8 mm, respectively. The cells were packed as a cubic lattice within a cone (height 3.74 mm, diameter 3.74 mm) that represented the pellet assembled in the 400 ml microcentrifuge tube. When the
Int J
Rad
iat B
iol D
ownl
oade
d fr
om in
form
ahea
lthca
re.c
om b
y U
nive
rsity
of
Med
icin
e &
Den
tistr
y on
01/
04/1
2Fo
r pe
rson
al u
se o
nly.

Monte Carlo simulation of irradiation and cell killing 117
center of every cell was required to lie within the cone, a total of 3,934,536 cells could be packed. Cells were each assigned an initial activity a (mBq) according to a log-normal distribution:
f aa
ea
a a
( ),
( )
=>
< >
1
2 0
2 2
2
2
2
σ π
σ
σ
– – –In In
(1)
where a is the experimentally measured initial mean activity per cell and σ is the lognormal shape parameter (Neti and Howell 2006, 2008). The NAG (Numerical Algorithms Group, Oxford, UK) Fortran Library was used to implement the lognormal distribution in a manner that ensured the highest statistical standards. Cellular activity was assumed to be localized in the cytoplasm. Cells containing any amount of activity were considered source cells.
Calculation of the absorbed dose to each of the nearly 4 million cells requires a very large amount of time for a computer’s central processing unit (CPU). Accordingly, the absorbed dose to a select number of target cells was cal-culated. The number of target cells sampled corresponded to the number of cells that are plated during a typical clonogenic survival assay of our experimental multicellular clusters (Neti and Howell 2007). For example, 200,000 cells are seeded when the cell survival fraction is anticipated to be roughly between 0.001 and 0.01. Thus, N cells were randomly selected from the cluster and the cellular self-dose Dself
k and cross-dose Dkcross was calculated individually
for each target cell k.
D D Dk kself
kcross (2)
D a Skself
k kself kt ← (3)
D a Skcross
i k icross
i
N
t ←∑1
(4)
where N 200,000. When source and target cell coincide, the self-dose to the kth target cell per unit cumulated activity in the kth target cell Sk k
self← was taken from the MIRD Cellular
S Values monograph (Goddu et al. 1997). For cross-doses, the absorbed dose to the kth target cell per unit cumulated activity in the ith source cell Sk i
cross← was calculated using
the point-kernel geometric-factor approach described by Goddu et al. (1994), except that stopping powers for alpha particles were obtained from Report 49 of the International Commission on Radiation Units and Measurements (ICRU 1993). These same cross-dose S values can be obtained at: http://njms.umdnj.edu/departments/division_radiation/multi_dosimetry.cfm. In all cases, the cell nucleus was taken as the target region. In keeping with our experimental mul-ticellular cluster data for 210Po-citrate, the residence time t for the cellular activity is 94.5 h (Neti and Howell 2007). This residence time includes contributions from intracellular decays that occur during the uptake period, the 72 h main-tenance period at 10.5°C, and the colony-forming period. The cumulated activity (number of disintegrations) in the ith source cell is given by ãi ai t.
Monte Carlo modeling of cell survivalThe probability for the kth target cell to survive, Pk, was assumed to depend on the self- and cross-doses received. The survival probability for labeled and unlabeled cells was assumed to be given by
P e eklabeled
D
D
D
Dkself
37,selfkcross
37,cross
– –
(5)
P ekunlabeled
D
Dkcross
37,cross
– (6)
The values of D37,self and D37,cross are defined as the self- and cross-doses required to achieve 37% survival, respectively. These were both assigned a value of 0.64 Gy which corresponds to the experimental dose required to achieve 37% survival (D37) when 100% of the cells were labeled with 210Po-citrate, an emitter of 5.3 MeV alpha-particles (Neti and Howell 2007). The assumption of D37,self D37,cross derives from our previous studies which showed equivalent RBE values for intranu-clearly and cytoplasmically localized alpha emitters (Azure et al. 1994). A Monte Carlo method was used to determine whether a given target cell suffered radiation-induced cell death (Rajon et al. 2011). For each target cell, a random number (RAND) was generated between zero and unity. If RAND Pk the target cell was considered dead; otherwise, it was scored as a survivor. This process was carried out for each target cell and the surviving fraction of target cells was calculated as: SF (number of survivors) ÷ (number of target cells).
CytomatrixTM modelA second 3D multicellular dosimetry model was created to represent our Cytomatrix™ experimental radiobiology model (Pinto et al. 2006, 2010, Pinto and Howell 2007). This model was composed of an inhomogeneous mixture of materials that represented the Cytomatrix™ carbon scaffold, cell nuclei ran-domly distributed in the pores of the scaffold, and medium that fills the remaining space. As in the multicellular cluster model described above, the relative activity in each cell was assigned according to a lognormal probability distribution (Equation 1). However, in this case, the Electron Gamma Shower version nrc (EGSnrc) Monte Carlo radiation transport code (Kawra-kow 2000) was used to assess both the self- and the cross-dose for each target cell nucleus. Details of this theoretical model are published elsewhere (Rajon et al. 2011).
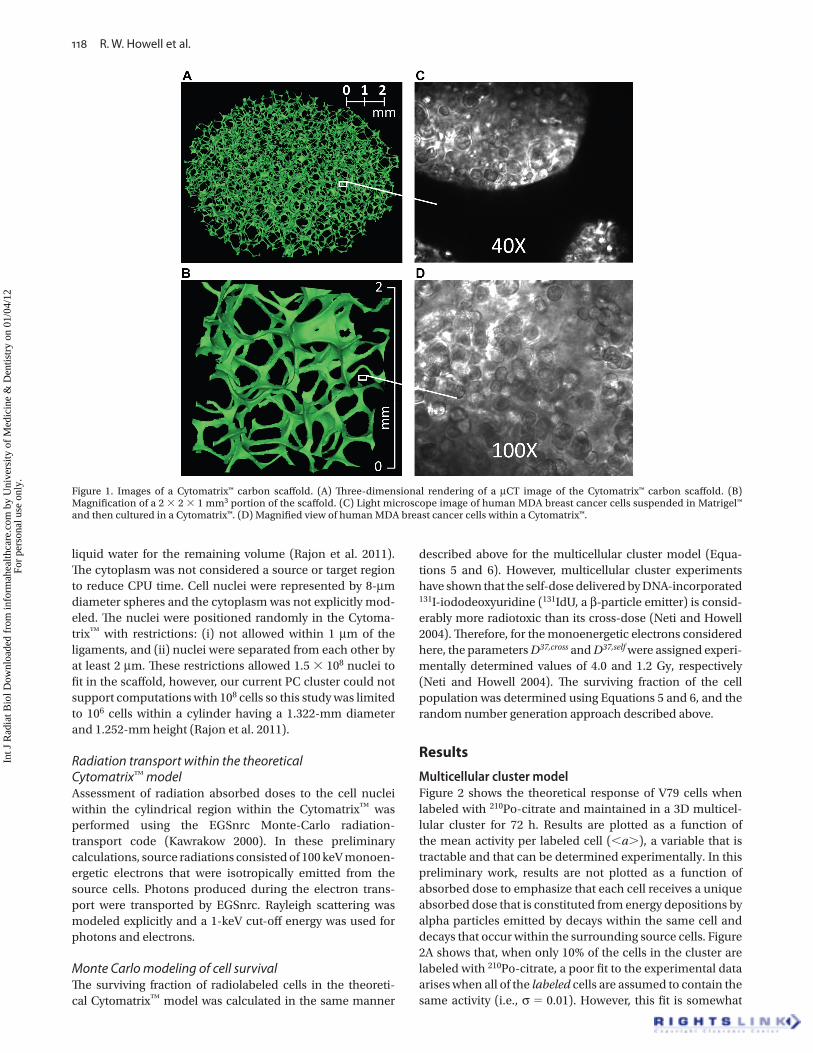
Geometry of the experimental Cytomatrix™ modelThe geometry of the experimental Cytomatrix™ model was obtained by image processing of microscopic computed tomography (mCT) images as previously described (Rajon et al. 2011). Figure 1 is a 3D rendering of mCT-images of the Cytomatrix™, a disk with diameter 8.5-mm and thickness 2-mm. Image analysis gave an average pore diameter ∼0.7 mm, ligament diameter ∼50–100 mm, and ligaments occupy 4.1% of the total volume.
Geometry of the theoretical Cytomatrix™ modelThe compositions of the components of the model were assumed to be carbon graphite with 2.0-g/cm3 density for the ligaments, cell nuclei as defined by ICRU (ICRU 1989), and
Int J
Rad
iat B
iol D
ownl
oade
d fr
om in
form
ahea
lthca
re.c
om b
y U
nive
rsity
of
Med
icin
e &
Den
tistr
y on
01/
04/1
2Fo
r pe
rson
al u
se o
nly.
118 R. W. Howell et al.
Figure 1. Images of a Cytomatrix™ carbon scaffold. (A) Three-dimensional rendering of a mCT image of the Cytomatrix™ carbon scaffold. (B) Magnification of a 2 2 1 mm3 portion of the scaffold. (C) Light microscope image of human MDA breast cancer cells suspended in Matrigel™ and then cultured in a Cytomatrix™. (D) Magnified view of human MDA breast cancer cells within a Cytomatrix™.
liquid water for the remaining volume (Rajon et al. 2011). The cytoplasm was not considered a source or target region to reduce CPU time. Cell nuclei were represented by 8-mm diameter spheres and the cytoplasm was not explicitly mod-eled. The nuclei were positioned randomly in the Cytoma-trix™ with restrictions: (i) not allowed within 1 mm of the ligaments, and (ii) nuclei were separated from each other by at least 2 mm. These restrictions allowed 1.5 108 nuclei to fit in the scaffold, however, our current PC cluster could not support computations with 108 cells so this study was limited to 106 cells within a cylinder having a 1.322-mm diameter and 1.252-mm height (Rajon et al. 2011).
Radiation transport within the theoretical Cytomatrix™ modelAssessment of radiation absorbed doses to the cell nuclei within the cylindrical region within the Cytomatrix™ was performed using the EGSnrc Monte-Carlo radiation-transport code (Kawrakow 2000). In these preliminary calculations, source radiations consisted of 100 keV monoen-ergetic electrons that were isotropically emitted from the source cells. Photons produced during the electron trans-port were transported by EGSnrc. Rayleigh scattering was modeled explicitly and a 1-keV cut-off energy was used for photons and electrons.
Monte Carlo modeling of cell survivalThe surviving fraction of radiolabeled cells in the theoreti-cal Cytomatrix™ model was calculated in the same manner
described above for the multicellular cluster model (Equa-tions 5 and 6). However, multicellular cluster experiments have shown that the self-dose delivered by DNA-incorporated 131I-iododeoxyuridine (131IdU, a b-particle emitter) is consid-erably more radiotoxic than its cross-dose (Neti and Howell 2004). Therefore, for the monoenergetic electrons considered here, the parameters D37,cross and D37,self were assigned experi-mentally determined values of 4.0 and 1.2 Gy, respectively (Neti and Howell 2004). The surviving fraction of the cell population was determined using Equations 5 and 6, and the random number generation approach described above.
Results
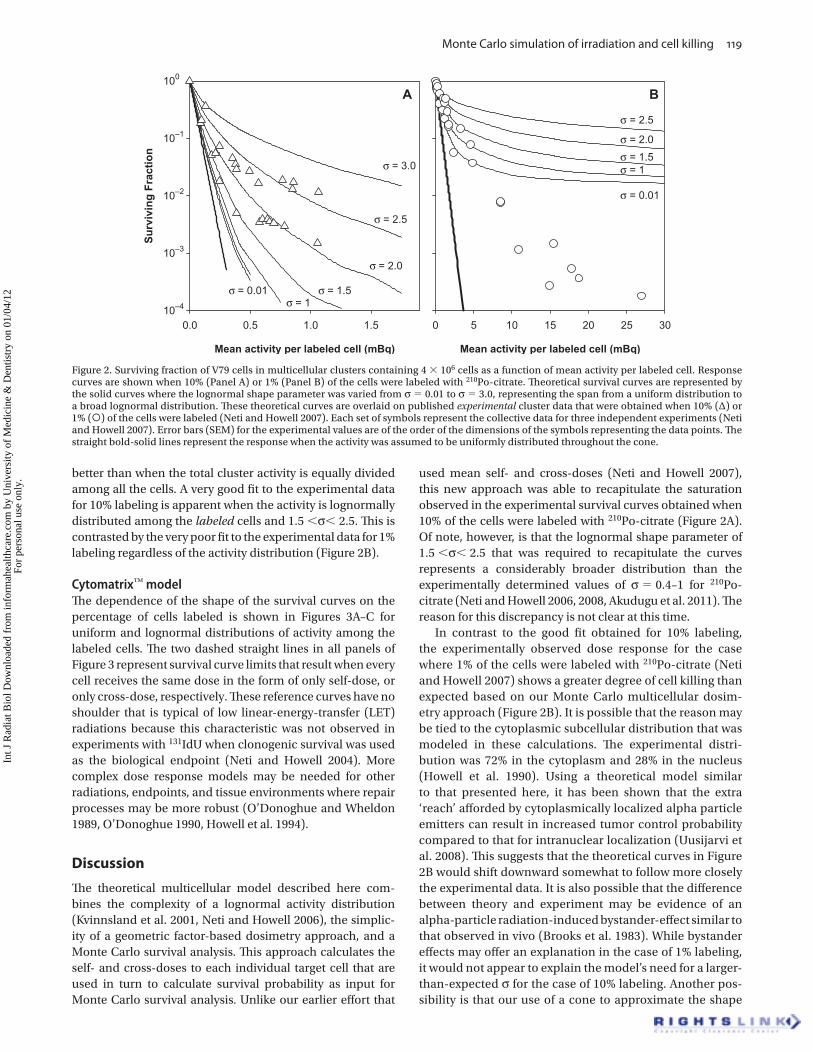
Multicellular cluster modelFigure 2 shows the theoretical response of V79 cells when labeled with 210Po-citrate and maintained in a 3D multicel-lular cluster for 72 h. Results are plotted as a function of the mean activity per labeled cell (a), a variable that is tractable and that can be determined experimentally. In this preliminary work, results are not plotted as a function of absorbed dose to emphasize that each cell receives a unique absorbed dose that is constituted from energy depositions by alpha particles emitted by decays within the same cell and decays that occur within the surrounding source cells. Figure 2A shows that, when only 10% of the cells in the cluster are labeled with 210Po-citrate, a poor fit to the experimental data arises when all of the labeled cells are assumed to contain the same activity (i.e., σ 0.01). However, this fit is somewhat
Int J
Rad
iat B
iol D
ownl
oade
d fr
om in
form
ahea
lthca
re.c
om b
y U
nive
rsity
of
Med
icin
e &
Den
tistr
y on
01/
04/1
2Fo
r pe
rson
al u
se o
nly.
Monte Carlo simulation of irradiation and cell killing 119
Mean activity per labeled cell (mBq)
0.0 0.5 1.0 1.5
Su
rv
iv
in
g F
ra
ctio
n
10–4
10–3
10–2
10–1
A B
100
Mean activity per labeled cell (mBq)
0 5 10 15 20 25 30
σ = 3.0
σ = 2.5
σ = 2.0
σ = 1.5 σ = 1
σ = 0.01
σ = 2.5
σ = 2.0σ = 1.5σ = 1
σ = 0.01
Figure 2. Surviving fraction of V79 cells in multicellular clusters containing 4 106 cells as a function of mean activity per labeled cell. Response curves are shown when 10% (Panel A) or 1% (Panel B) of the cells were labeled with 210Po-citrate. Theoretical survival curves are represented by the solid curves where the lognormal shape parameter was varied from σ 0.01 to σ 3.0, representing the span from a uniform distribution to a broad lognormal distribution. These theoretical curves are overlaid on published experimental cluster data that were obtained when 10% (∆) or 1% () of the cells were labeled (Neti and Howell 2007). Each set of symbols represent the collective data for three independent experiments (Neti and Howell 2007). Error bars (SEM) for the experimental values are of the order of the dimensions of the symbols representing the data points. The straight bold-solid lines represent the response when the activity was assumed to be uniformly distributed throughout the cone.
better than when the total cluster activity is equally divided among all the cells. A very good fit to the experimental data for 10% labeling is apparent when the activity is lognormally distributed among the labeled cells and 1.5 σ 2.5. This is contrasted by the very poor fit to the experimental data for 1% labeling regardless of the activity distribution (Figure 2B).
Cytomatrix™ modelThe dependence of the shape of the survival curves on the percentage of cells labeled is shown in Figures 3A–C for uniform and lognormal distributions of activity among the labeled cells. The two dashed straight lines in all panels of Figure 3 represent survival curve limits that result when every cell receives the same dose in the form of only self-dose, or only cross-dose, respectively. These reference curves have no shoulder that is typical of low linear-energy-transfer (LET) radiations because this characteristic was not observed in experiments with 131IdU when clonogenic survival was used as the biological endpoint (Neti and Howell 2004). More complex dose response models may be needed for other radiations, endpoints, and tissue environments where repair processes may be more robust (O’Donoghue and Wheldon 1989, O’Donoghue 1990, Howell et al. 1994).
Discussion
The theoretical multicellular model described here com-bines the complexity of a lognormal activity distribution (Kvinnsland et al. 2001, Neti and Howell 2006), the simplic-ity of a geometric factor-based dosimetry approach, and a Monte Carlo survival analysis. This approach calculates the self- and cross-doses to each individual target cell that are used in turn to calculate survival probability as input for Monte Carlo survival analysis. Unlike our earlier effort that
used mean self- and cross-doses (Neti and Howell 2007), this new approach was able to recapitulate the saturation observed in the experimental survival curves obtained when 10% of the cells were labeled with 210Po-citrate (Figure 2A). Of note, however, is that the lognormal shape parameter of 1.5 σ 2.5 that was required to recapitulate the curves represents a considerably broader distribution than the experimentally determined values of σ 0.4–1 for 210Po-citrate (Neti and Howell 2006, 2008, Akudugu et al. 2011). The reason for this discrepancy is not clear at this time.
In contrast to the good fit obtained for 10% labeling, the experimentally observed dose response for the case where 1% of the cells were labeled with 210Po-citrate (Neti and Howell 2007) shows a greater degree of cell killing than expected based on our Monte Carlo multicellular dosim-etry approach (Figure 2B). It is possible that the reason may be tied to the cytoplasmic subcellular distribution that was modeled in these calculations. The experimental distri-bution was 72% in the cytoplasm and 28% in the nucleus (Howell et al. 1990). Using a theoretical model similar to that presented here, it has been shown that the extra ‘reach’ afforded by cytoplasmically localized alpha particle emitters can result in increased tumor control probability compared to that for intranuclear localization (Uusijarvi et al. 2008). This suggests that the theoretical curves in Figure 2B would shift downward somewhat to follow more closely the experimental data. It is also possible that the difference between theory and experiment may be evidence of an alpha-particle radiation-induced bystander-effect similar to that observed in vivo (Brooks et al. 1983). While bystander effects may offer an explanation in the case of 1% labeling, it would not appear to explain the model’s need for a larger-than-expected σ for the case of 10% labeling. Another pos-sibility is that our use of a cone to approximate the shape
Int J
Rad
iat B
iol D
ownl
oade
d fr
om in
form
ahea
lthca
re.c
om b
y U
nive
rsity
of
Med
icin
e &
Den
tistr
y on
01/
04/1
2Fo
r pe
rson
al u
se o
nly.

120 R. W. Howell et al.
Surv
ivin
g fra
ctio
n
10–5
10–4
10–3
10–2
10–1
100
10–5
10–4
10–3
10–2
10–1
100
10–5
10–4
10–3
10–2
10–1
100
100% labeled10% labeled1% labeled
AUniform (σ = 0.0)Su
rviv
ing
fract
ion
Mean dose to nucleus (Gy)
0 10 20 30 40 50 60 70 80 90 100
Surv
ivin
g fra
ctio
n
Lognormal (σ = 1.0)
Lognormal (σ = 2.0) C
B
Figure 3. Surviving fraction as a function of mean absorbed dose to the cell nucleus, obtained with the theoretical Cytomatrix™ model wherein cells are labeled with a hypothetical radionuclide that emits 100 keV electrons. Dependence of survival curve on percentage of cells labeled (100%, 10%, or 1%). Three different activity distributions among the labeled cells are considered: (A) uniform, (B) lognormal with σ 1.0, and (C) lognormal with 2.0. The red and blue dashed lines represent exponential survival curves with D37 D37,self 1.2 Gy and D37 D37,cross 4.0 Gy, respectively.
of the cluster may have a significant impact on the distri-bution of doses received by the cell population. Additional measurements with a calibrated eyepiece reticule mounted on a dissecting microscope indicate that the cluster can be described as a paraboloid capped with a cylindrical wedge. The paraboloid is 3.2 mm high with a top diameter of 3.2 mm. The cylindrical wedge is 0.8 mm high. Future inves-tigations will examine whether the cluster geometry has a significant impact on the shape of the survival curve. Other possibilities for the differences between theory and experi-ment may be related to variations in shape and sizes of cells in the population (Nettleton and Lawson 1996, Charlton 2000, Kvinnsland et al. 2001, Malaroda et al. 2005, Uusijarvi et al. 2008). Finally, considering that only about two com-plete alpha-particle traversals of the nucleus are usually required for cell inactivation, the stochastic nature of alpha-particle irradiation by incorporated radionuclides may also be playing a role in the shape of the survival curves for cells
labeled with 210Po. The present model, which uses S values for determination of absorbed dose, does not address these aspects which lie within the purview of microdosimetry (Charlton 2000, Roeske et al. 2008, Sgouros et al. 2010).
The theoretical multicellular cluster model provides new insights into the effects of nonuniform distributions of radioactivity in a homogeneous tissue environment. Our experimental and theoretical Cytomatrix™ models offer a new window to study the impact of both nonuniform activity distributions and inhomogeneous tissue environments on the biological effects of incorporated radionuclides. The the-oretical model uses Monte Carlo techniques for both radia-tion transport and radiation-induced cell killing. Figure 3 shows that increasing the breadth of lognormal distributions of electron or beta-particle emitters can have a substantial effect on the shape of the survival curve, even when 100% of the cells are labeled. This effect is exacerbated when only a fraction of the cells are labeled with radioactivity (e.g., 10% or 1% labeled). These data in Figure 3 are for 100 keV elec-trons. Not shown in Figure 3 is how electron energy affects the dose-response curves. However, our previous efforts for 100% labeling conditions clearly show that survival curves corresponding to irradiation with low energy electrons (10 and 30 keV) showed a high degree of saturation, whereas little saturation was obtained for high energy electrons (i.e., 300 and 1000 keV) (Rajon et al. 2011). It is anticipated that reducing the percentage of labeled cells to 10% or 1% will increase the level of saturation. Studies are presently under-way to quantify the effect of these and other variables on dose-response curves.
Acknowledgements
We would like to express our appreciation to Jeffrey Gardner and Anupam Bishayee for their confocal microscopic mea-surements of the V79 cells. We thank Scanco (Basserdorf, Switzerland) for acquiring mCT images. Microscope images were provided by John Akudugu. This paper was supported in part by National Institutes of Health Grant Nos. R01CA83838 (RWH) and R01CA116743 (WEB). The content is solely the responsibility of the authors and does not necessarily repre-sent the official views of the National Cancer Institute or the National Institutes of Health.
Declaration of interest
The authors report no conflicts of interest. The authors alone are responsible for the content and writing of the paper.
ReferencesAkudugu JM, Neti PVSV, Howell RW. 2011. Changes in lognormal
shape parameter guide design of patient-specific radiochemother-apy cocktails. Journal of Nuclear Medicine 52:642–649.
Azure MT, Archer RD, Sastry KSR, Rao DV, Howell RW. 1994. Biologic effect of 212Pb localized in the nucleus of mammalian cells: Role of recoil energy in the radiotoxicity of internal alpha emitters. Radia-tion Research 140:276–283.
Bishayee A, Hill HZ, Stein D, Rao DV, Howell RW. 2001. Free-radical initiated and gap junction-mediated bystander effect due to non-uniform distribution of incorporated radioactivity in a three-dimen-sional tissue culture model. Radiation Research 155:335–344.
Int J
Rad
iat B
iol D
ownl
oade
d fr
om in
form
ahea
lthca
re.c
om b
y U
nive
rsity
of
Med
icin
e &
Den
tistr
y on
01/
04/1
2Fo
r pe
rson
al u
se o
nly.

Monte Carlo simulation of irradiation and cell killing 121
International Commission on Radiation Units and Measurements (ICRU). 1993. Stopping powers and ranges for protons and alpha particles. Bethesda, MD: ICRU. Report 49.
Jönsson B-A, Strand S-E, Larsson BS. 1992. A quantitative autoradio-graphic study of the heterogeneous activity distribution of different indium-111-labeled radiopharmaceuticals in rat tissues. Journal of Nuclear Medicine 33:1825–1832.
Kalogianni E, Flux GD, Malaroda A. 2007. The use of BED and EUD concepts in heterogeneous radioactivity distributions on a multicel-lular scale for targeted radionuclide therapy. Cancer Biotherapy and Radiopharmceuticals 22:143–150.
Kawrakow I. 2000. Accurate condensed history Monte Carlo simula-tion of electron transport. I. EGSnrc, the new EGS4 version. Medical Physics 27:485–498.
Kvinnsland Y, Stokke T, Aurlien E. 2001. Radioimmunotherapy with alpha-particle emitters: microdosimetry of cells with a heteroge-neous antigen expression and with various diameters of cells and nuclei. Radiation Research 155:288–296.
Ljungberg M, Frey E, Sjogreen K, Liu X, Dewaraja Y, Strand SE. 2003. 3D absorbed dose calculations based on SPECT: Evaluation for 111In/90Y therapy using Monte Carlo simulations. Cancer Biotherapy and Radiopharmaceuticals 18:99–107.
Loevinger R, Berman M. 1968. A schema for absorbed-dose calcula-tions for biologically-distributed radionuclides. MIRD Pamphlet No. 1. Journal of Nuclear Medicine 9(Suppl. 1):7–14.
Makrigiorgos GM, Adelstein SJ, Kassis AI. 1990a. Cellular radiation dosimetry and its implications for estimation of radiation risks. Illustrative results with technetium-99m-labeled microspheres and macroaggregates. Journal of the American Medical Association 264:592–595.
Makrigiorgos GM, Ito S, Baranowska-Kortylewicz J, Vinter DW, Iqbal A, Van den Abbeele AD, Adelstein SJ, Kassis AI. 1990b. Inhomogeneous deposition of radiopharmaceuticals at the cellular level: Experimen-tal evidence and dosimetric implications. Journal of Nuclear Medi-cine 31:1358–1363.
Malaroda A, Flux G, Ott R. 2005. The application of dose-rate volume histograms and survival fractions to multicellular dosimetry. Cancer Biotherapy and Radiopharmaceuticals 20:58–65.
Malaroda A, Flux GD, Buffa FM, Ott RJ. 2003. Multicellular dosimetry in voxel geometry for targeted radionuclide therapy. Cancer Bio-therapy and Radiopharmaceuticals 18:451–461.
McKay E. 2003. A software tool for specifying voxel models for dosim-etry estimation. Cancer Biotherapy and Radiopharmaceuticals 18:379–392.
National Council on Radiation Protection and Measurements (NCRP). 1979. Tritium and other radionuclide labelled organic compounds incorporated in genetic material. Bethesda, MD: NCRP. Report 63.
Neti PV, Howell RW. 2003. When may a nonuniform distribution of 131I be considered uniform? An experimental basis for multicellular dosimetry. Journal of Nuclear Medicine 44:2019–2026.
Neti PV, Howell RW. 2004. Isolating effects of microscopic nonuni-form distributions of 131I on labeled and unlabeled cells. Journal of Nuclear Medicine 45:1050–1058.
Neti PV, Howell RW. 2006. Log normal distribution of cellular uptake of radioactivity: implications for biologic responses to radiopharma-ceuticals. Journal of Nuclear Medicine 47:1049–1058.
Neti PV, Howell RW. 2008. Lognormal distribution of cellular uptake of radioactivity: statistical analysis of alpha-particle track autoradiog-raphy. Journal of Nuclear Medicine 49:1009–1016.
Neti PVSV, Howell RW. 2007. Biological response to nonuniform dis-tributions of 210Po in multicellular clusters. Radiation Research 168:332–340.
Nettleton JS, Lawson R. 1996. Cellular dosimetry of diagnostic radio-nuclides for spherical and ellipsoidal geometry. Physics in Medicine and Biology 41:1845–1854.
O’Donoghue JA. 1990. Isoeffect relationships for fractionated biologi-cally targeted radiotherapy. Radiotherapy and Oncology 19:257–265.
O’Donoghue JA, Wheldon TE. 1989. Dose-rate effects in biologically targeted radiotherapy. International Journal of Radiation Biology 56:745–749.
Oakberg EF. 1971. Spermatogonial stem-cell renewal in the mouse. The Anatomical Record 169:515–532.
Pinto M, Howell RW. 2007. Concomitant quantification of targeted drug delivery and biological response in individual cells. Biotech-niques 43(64):66–71.
Pinto M, Azzam EI, Howell RW. 2006. Bystander responses in three-dimensional cultures containing radiolabeled and unlabeled human cells. Radiation Protection Dosimetry 122:252–255.
Bolch WE, Bouchet LG, Robertson JS, Wessels BW, Siegel JA, Howell RW, Erdi AK, Aydogan B, Costes S, Watson EE. 1999. MIRD Pam-phlet No. 17: The dosimetry of nonuniform activity distributions – radionuclide S values at the voxel level. Journal of Nuclear Medicine 40:11S–36S.
Bouchet LG, Bolch WE, Weber DA, Atkins HL, Poston JW Sr. 1999. MIRD Pamphlet No. 15: Radionuclide S values in a revised model of the adult head and brain. Journal of Nuclear Medicine 40:62S–101S.
Bouchet LG, Bolch WE, Blanco HP, Wessels BW, Siegel JA, Rajon DA, Clairand I, Sgouros G. 2003. MIRD Pamphlet No 19: Absorbed frac-tions and radionuclide S values for six age-dependent multiregion models of the kidney. Journal of Nuclear Medicine 44:1113–1147.
Brooks AL, Benjamin SA, Hahn FF, Brownstein DG, Griffith WC, McClellan RO. 1983. The induction of liver tumors by 239Pu citrate or 239PuO2 particles in the Chinese hamster. Radiation Research 96:135–151.
Brownell GL, Ellet WH, Reddy AR. 1968. Absorbed fractions for pho-ton dosimetry. MIRD Pamphlet No. 3. Journal of Nuclear Medicine 9(suppl. 1):27–39.
Cai Z, Pignol JP, Chan C, Reilly RM. 2010. Cellular dosimetry of 111In using Monte Carlo N-particle computer code: Comparison with analytic methods and correlation with in vitro cytotoxicity. Journal of Nuclear Medicine 51:462–470.
Charlton DE. 2000. Radiation effects in spheroids of cells exposed to alpha emitters. International Journal of Radiation Biology 76:1555–1564.
Conway JH, Sloane NJA. 1999. Sphere packings, lattices, and groups. 3rd ed. New York: Springer. 703 p.
de Carlan L, Aubineau-Laniece I, Lemosquet A, Borissov N, Jourdain JR, Jeanbourquin D, Le Guen B, Franck D. 2003. Application of new imaging and calculation techniques to activity and dose assessment in the case of a 106Ru contaminated wound. Radiation Protection Dosimetry 105:219–223.
Ellett WH, Callahan AB, Brownell GL. 1964. Gamma-ray dosimetry of internal emitters. I. Monte Carlo calculations of absorbed dose from point sources. British Journal of Radiology 37:45–52.
Ellett WH, Callahan AB, Brownell GL. 1965. Gamma-ray dosimetry of internal emitters. II. Monte Carlo calculations of absorbed dose from uniform sources. British Journal of Radiology 38:541–544.
Feinendegen LE, Bond VP, Booz J. 1994. The quantification of physical events within tissue at low levels of exposure to ionizing radiation. ICRU News (December): 9–12.
Goddu SM, Rao DV, Howell RW. 1994. Multicellular dosimetry for micrometastases: dependence of self-dose versus cross-dose to cell nuclei on type and energy of radiation and subcellular distribution of radionuclides. Journal of Nuclear Medicine 35:521–530.
Goddu SM, Howell RW, Bouchet LG, Bolch WE, Rao DV. 1997. MIRD Cellular S values: Self-absorbed dose per unit cumulated activity for selected radionuclides and monoenergetic electron and alpha par-ticle emitters incorporated into different cell compartments. Reston, VA: Society of Nuclear Medicine. 183 p.
Guy MJ, Flux GD, Papavasileiou P, Flower MA, Ott RJ. 2003. RMDP: A dedicated package for 131I SPECT quantification, registration and patient-specific dosimetry. Cancer Biotherapy and Radiopharma-ceuticals 18:61–69.
Howell RW, Bishayee A. 2002. Bystander effects caused by nonuniform distributions of DNA-incorporated 125I. Micron 33:127–132.
Howell RW, Neti PV. 2005. Modeling multicellular response to nonuni-form distributions of radioactivity: Differences in cellular response to self-dose and cross-dose. Radiation Research 163:216–221.
Howell RW, Goddu SM, Rao DV. 1994. Application of the linear- quadratic model to radioimmunotherapy: Further support for the advantage of longer-lived radionuclides. Journal of Nuclear Medi-cine 35:1861–1869.
Howell RW, Narra VR, Rao DV, Sastry KSR. 1990. Radiobiological effects of intracellular polonium-210 alpha emissions: A comparison with Auger-emitters. Radiation Protection Dosimetry 31:325–328.
Howell RW, Neti PV, Pinto M, Gerashchenko BI, Narra VR, Azzam EI. 2006. Challenges and progress in predicting biological responses to incorporated radioactivity. Radiation Protection Dosimetry 122: 521–527.
Humm JL, Cobb LM. 1990. Nonuniformity of tumor dose in radioim-munotherapy. Journal of Nuclear Medicine 31:75–83.
Humm JL, Macklis RM, Bump K, Cobb LM, Chin LM. 1993. Internal dosimetry using data derived from autoradiographs. Journal of Nuclear Medicine 34:1811–1817.
International Commission on Radiation Units and Measurements (ICRU). 1989. Tissue substitutes in radiation dosimetry and mea-surement. Bethesda, MD: ICRU. Report 44.
Int J
Rad
iat B
iol D
ownl
oade
d fr
om in
form
ahea
lthca
re.c
om b
y U
nive
rsity
of
Med
icin
e &
Den
tistr
y on
01/
04/1
2Fo
r pe
rson
al u
se o
nly.

122 R. W. Howell et al.
Sgouros G, Roeske JC, McDevitt MR, Palm S, Allen BJ, Fisher DR, Brill AB, Song H, Howell RW, Akabani G, et al. 2010. MIRD Pamphlet No. 22 (abridged): Radiobiology and dosimetry of alpha-particle emit-ters for targeted radionuclide therapy. Journal of Nuclear Medicine 51:311–328.
Snyder WS, Ford MR, Warner GG, Watson SB. 1975. ‘S’ absorbed dose per unit cumulated activity for selected radionuclides and organs. New York: Society of Nuclear Medicine.
Spaic R, Ilic R, Dragovic M, Petrovic B. 2005. Generation of dose-vol-ume histograms using Monte Carlo simulations on a multicellular model in radionuclide therapy. Cancer Biotherapy and Radiophar-maceuticals 20:320–324.
Stabin MG. 2003. Developments in the internal dosimetry of radiop-harmaceuticals. Radiation Protection Dosimetry 105:575–580.
Uusijarvi H, Bernhardt P, Forssell-Aronsson E. 2008. Tumour control probability (TCP) for non-uniform activity distribution in radionuclide therapy. Physics in Medicine and Biology 53: 4369–4381.
Wessels BW, Griffith MH. 1986. Miniature thermoluminescent dosim-eter absorbed dose measurements in tumor phantom models. Journal of Nuclear Medicine 27:1308–1314.
Pinto M, Azzam EI, Howell RW. 2010. Investigation of adaptive responses in bystander cells in 3D cultures containing tritium-labeled and unla-beled normal human fibroblasts. Radiation Research 174:216–227.
Rajon D, Bolch WE, Howell RW. 2011. Lognormal distribution of cellular uptake of radioactivity: Monte-Carlo simulation of irradiation and cell killing in 3-dimensional populations in carbon scaffolds. Journal of Nuclear Medicine 52:926–933.
Rajon DA, Jokisch DW, Patton PW, Shah AP, Bolch WE. 2000. Voxel size effects in three-dimensional nuclear magnetic resonance micros-copy performed for trabecular bone dosimetry. Medical Physics 27:2624–2635.
Roeske JC, Aydogan B, Bardies M, Humm JL. 2008. Small-scale dosim-etry: Challenges and future directions. Seminars in Nuclear Medi-cine 38:367–383.
Sastry KSR, Haydock C, Basha AM, Rao DV. 1985. Electron dosimetry for radioimmunotherapy: Optimal electron energy. Radiation Pro-tection Dosimetry 13:249–252.
Sgouros G, Kolbert KS, Sheikh A, Pentlow KS, Mun EF, Barth A, Rob-bins RJ, Larson SM. 2004. Patient-specific dosimetry for 131I thyroid cancer therapy using 124I PET and 3-dimensional-internal dosimetry (3D-ID) software. Journal of Nuclear Medicine 45:1366–1372.
Int J
Rad
iat B
iol D
ownl
oade
d fr
om in
form
ahea
lthca
re.c
om b
y U
nive
rsity
of
Med
icin
e &
Den
tistr
y on
01/
04/1
2Fo
r pe
rson
al u
se o
nly.