monthly dmh report to mental health oversight … reform oversight... · programs are expected to...
TRANSCRIPT

1
State of Vermont Agency of Human Services Department of Mental Health Commissioner’s Office 280 State Drive, NOB 2 North [phone] 802-241-0090 Waterbury, VT 05671-2010 [fax] 802-241-0100 http://mentalhealth.vermont.gov/ [tty] 800-253-0191
MEMORANDUM
TO: Health Reform Oversight Committee
FROM: Frank Reed, Commissioner
Department of Mental Health
DATE: April 15, 2016
RE: March 2016 Monthly DMH Report to the Health Reform Oversight Committee
Attached please find the Department of Mental Health’s March 2016 report to the Health Reform
Oversight Committee.
The report consists of the following graphs:
Utilization of Inpatient and Crisis Beds
Level 1 Inpatient Capacity Utilization Statewide and by Hospital
People with Involuntary Admissions, Comparison of Level 1 and Non-Level 1
Involuntary Non-Level 1 and Level 1 bed days
Average Numbers of People Waiting Inpatient Placement
Vermont State Hospital and Designated Hospitals, Emergency and Forensic Admissions
Adult Inpatient Utilzation and Bed Closures
Wait Times in Hours for Involuntary Inpatient Admission
Daily Number of Involuntary Adults Awaiting Inpatient Placement
Daily Number of Voluntary Adults Awaiting Inpatient Placement and Closed System Beds
Sheriff Supervisions in Emergency Departments
Average Distance to Psychiatric Inpatient Care
Hospital Admissions, Length of Stay, and Readmissions
Vermont Department of Mental Health System Snapshot (2013-2016)
Please direct any inquiries for additional data collection or report content development to Frank Reed,
Commissioner of the Department of Mental Health; [email protected].
Respectfully submitted,
Frank Reed
Commissioner
Department of Mental Health

2
Health Reform Oversight Committee Department of Mental Health – March 2016 Report
Utilization of Inpatient and Crisis Beds (January 2014 – March 2016)
Based on data reported to the Vermont Department of Mental Health (DMH) by crisis bed programs and inpatient facil ities for adult care using the electronic bed boards system. Programs are expected to report to electronic bed boards a minimum of once per day to
update their census. State averages are adjusted to exclude programs on days where there were no updates submitted to the bed board.
Utilization of Inpatient and Crisis Beds
88%91%
84%86%
88% 88% 87% 86%89%
80%77%
72%76%
79%
76% 76% 75%72%
0%
10%
20%
30%
40%
50%
60%
70%
80%
90%
100%
Jan - Mar2014
Apr - Jun2014
Jul - Sep2014
Oct - Dec2014
Jan - Mar2015
Apr - Jun2015
Jul - Sep2015
Oct - Dec2015
Jan - Mar2016
Pe
rce
nt
Occ
up
ancy
Quarter
Inpatient Beds Crisis Beds
3
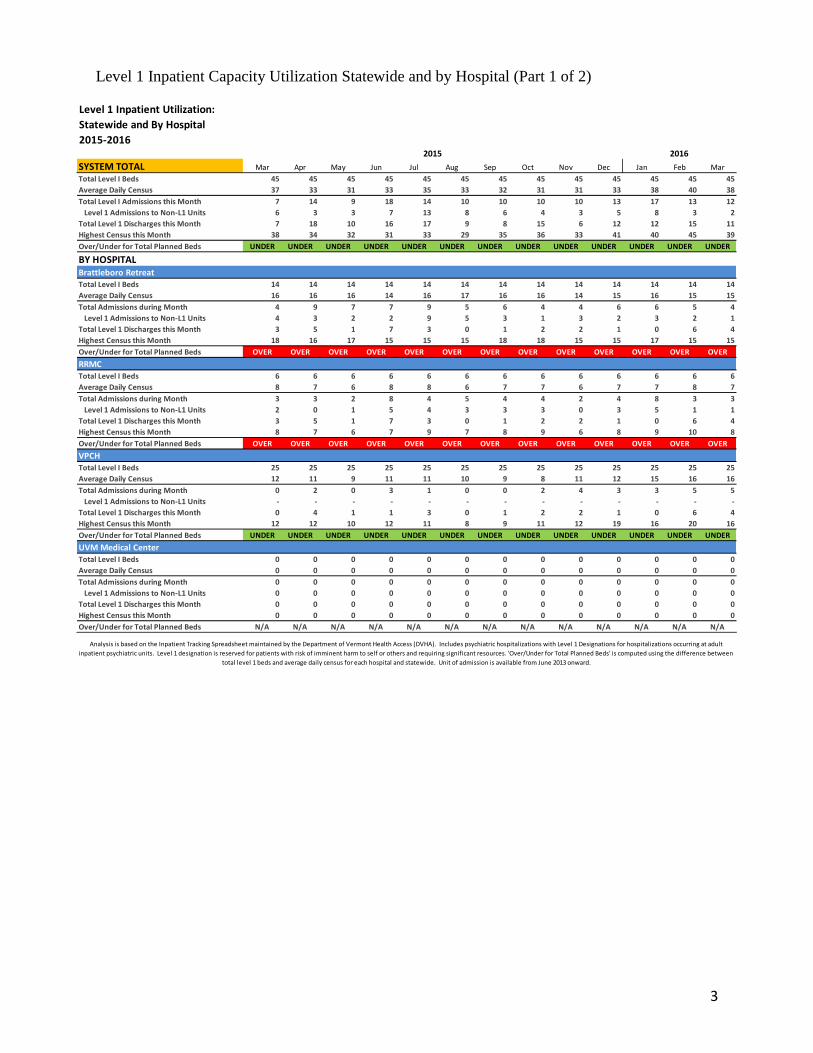
Level 1 Inpatient Capacity Utilization Statewide and by Hospital (Part 1 of 2)
SYSTEM TOTAL Mar Apr May Jun Jul Aug Sep Oct Nov Dec Jan Feb Mar
Total Level I Beds 45 45 45 45 45 45 45 45 45 45 45 45 45
Average Daily Census 37 33 31 33 35 33 32 31 31 33 38 40 38
Total Level I Admissions this Month 7 14 9 18 14 10 10 10 10 13 17 13 12
Level 1 Admissions to Non-L1 Units 6 3 3 7 13 8 6 4 3 5 8 3 2
Total Level 1 Discharges this Month 7 18 10 16 17 9 8 15 6 12 12 15 11
Highest Census this Month 38 34 32 31 33 29 35 36 33 41 40 45 39
Over/Under for Total Planned Beds UNDER UNDER UNDER UNDER UNDER UNDER UNDER UNDER UNDER UNDER UNDER UNDER UNDER
BY HOSPITALBrattleboro Retreat
Total Level I Beds 14 14 14 14 14 14 14 14 14 14 14 14 14
Average Daily Census 16 16 16 14 16 17 16 16 14 15 16 15 15
Total Admissions during Month 4 9 7 7 9 5 6 4 4 6 6 5 4
Level 1 Admissions to Non-L1 Units 4 3 2 2 9 5 3 1 3 2 3 2 1
Total Level 1 Discharges this Month 3 5 1 7 3 0 1 2 2 1 0 6 4
Highest Census this Month 18 16 17 15 15 15 18 18 15 15 17 15 15
Over/Under for Total Planned Beds OVER OVER OVER OVER OVER OVER OVER OVER OVER OVER OVER OVER OVER
RRMC
Total Level I Beds 6 6 6 6 6 6 6 6 6 6 6 6 6
Average Daily Census 8 7 6 8 8 6 7 7 6 7 7 8 7
Total Admissions during Month 3 3 2 8 4 5 4 4 2 4 8 3 3
Level 1 Admissions to Non-L1 Units 2 0 1 5 4 3 3 3 0 3 5 1 1
Total Level 1 Discharges this Month 3 5 1 7 3 0 1 2 2 1 0 6 4
Highest Census this Month 8 7 6 7 9 7 8 9 6 8 9 10 8
Over/Under for Total Planned Beds OVER OVER OVER OVER OVER OVER OVER OVER OVER OVER OVER OVER OVER
VPCH
Total Level I Beds 25 25 25 25 25 25 25 25 25 25 25 25 25
Average Daily Census 12 11 9 11 11 10 9 8 11 12 15 16 16
Total Admissions during Month 0 2 0 3 1 0 0 2 4 3 3 5 5
Level 1 Admissions to Non-L1 Units - - - - - - - - - - - - -
Total Level 1 Discharges this Month 0 4 1 1 3 0 1 2 2 1 0 6 4
Highest Census this Month 12 12 10 12 11 8 9 11 12 19 16 20 16
Over/Under for Total Planned Beds UNDER UNDER UNDER UNDER UNDER UNDER UNDER UNDER UNDER UNDER UNDER UNDER UNDER
UVM Medical CenterTotal Level I Beds 0 0 0 0 0 0 0 0 0 0 0 0 0
Average Daily Census 0 0 0 0 0 0 0 0 0 0 0 0 0
Total Admissions during Month 0 0 0 0 0 0 0 0 0 0 0 0 0
Level 1 Admissions to Non-L1 Units 0 0 0 0 0 0 0 0 0 0 0 0 0
Total Level 1 Discharges this Month 0 0 0 0 0 0 0 0 0 0 0 0 0
Highest Census this Month 0 0 0 0 0 0 0 0 0 0 0 0 0
Over/Under for Total Planned Beds N/A N/A N/A N/A N/A N/A N/A N/A N/A N/A N/A N/A N/A
Level 1 Inpatient Utilization:
Statewide and By Hospital
2015-20162015
Analysis is based on the Inpatient Tracking Spreadsheet maintained by the Department of Vermont Health Access (DVHA). Includes psychiatric hospitalizations with Level 1 Designations for hospitalizations occurring at adult
inpatient psychiatric units. Level 1 designation is reserved for patients with risk of imminent harm to self or others and requiring significant resources. 'Over/Under for Total Planned Beds' is computed using the difference between
total level 1 beds and average daily census for each hospital and statewide. Unit of admission is available from June 2013 onward.
2016
4
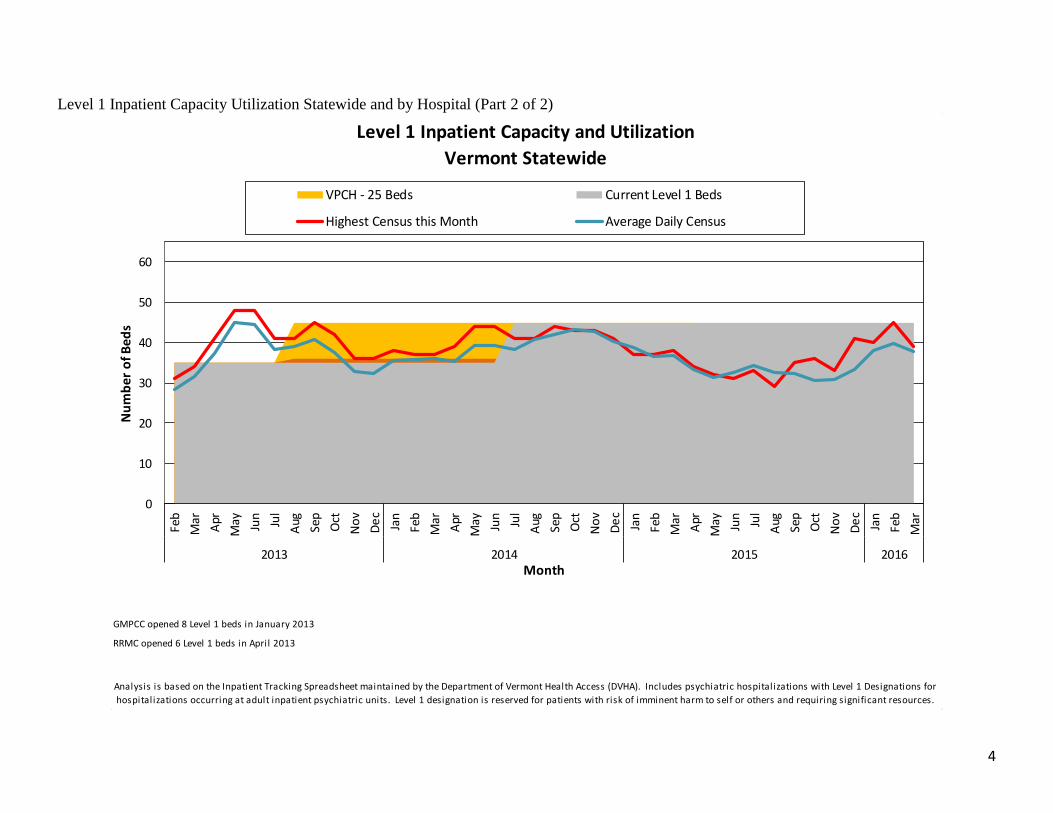
Level 1 Inpatient Capacity Utilization Statewide and by Hospital (Part 2 of 2)
GMPCC opened 8 Level 1 beds in January 2013
RRMC opened 6 Level 1 beds in April 2013
Analysis is based on the Inpatient Tracking Spreadsheet maintained by the Department of Vermont Health Access (DVHA). Includes psychiatric hospitalizations with Level 1 Designations for
hospitalizations occurring at adult inpatient psychiatric units. Level 1 designation is reserved for patients with risk of imminent harm to self or others and requiring significant resources.
Level 1 Inpatient Capacity and Utilization
Vermont Statewide
0
10
20
30
40
50
60
Feb
Mar
Apr
May Jun
Jul
Aug Sep
Oct
No
v
De
c
Jan
Feb
Mar
Apr
May Jun
Jul
Aug Sep
Oct
No
v
De
c
Jan
Feb
Mar
Apr
May Jun
Jul
Aug Sep
Oct
No
v
De
c
Jan
Feb
Mar
2013 2014 2015 2016
Nu
mb
er o
f Bed
s
Month
VPCH - 25 Beds Current Level 1 Beds
Highest Census this Month Average Daily Census
5
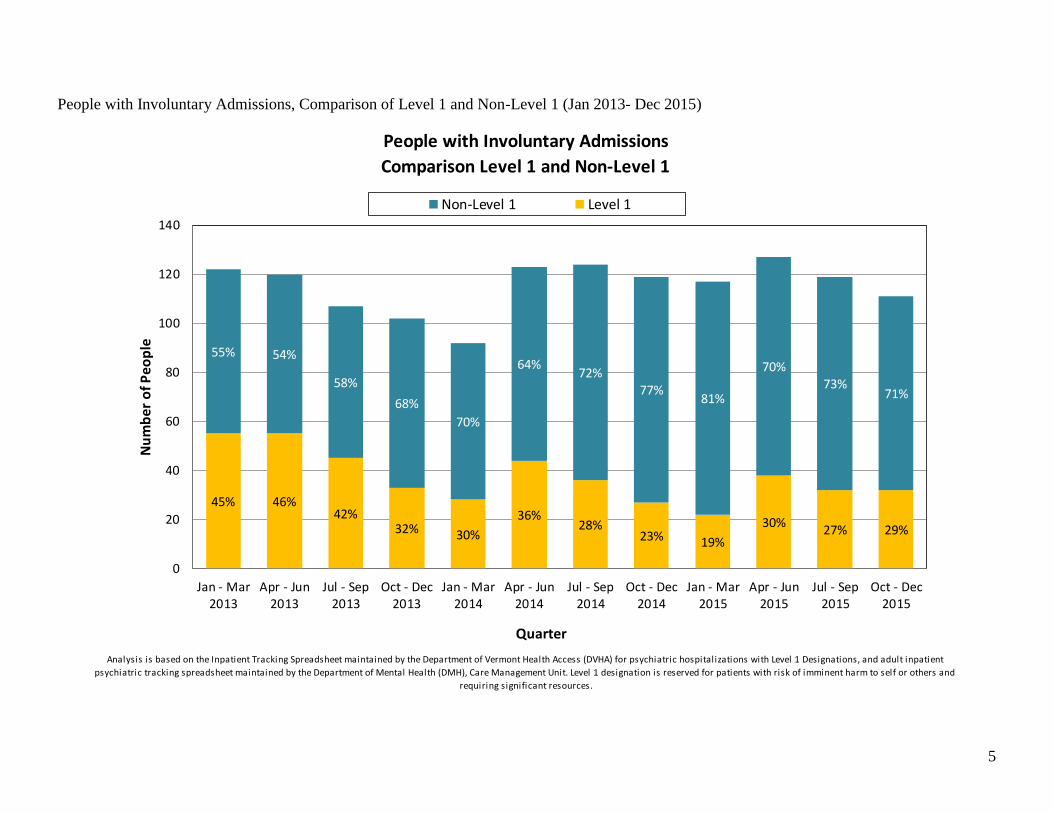
People with Involuntary Admissions, Comparison of Level 1 and Non-Level 1 (Jan 2013- Dec 2015)
People with Involuntary Admissions
Comparison Level 1 and Non-Level 1
Analysis is based on the Inpatient Tracking Spreadsheet maintained by the Department of Vermont Health Access (DVHA) for psychiatric hospitalizations with Level 1 Designations, and adult inpatient
psychiatric tracking spreadsheet maintained by the Department of Mental Health (DMH), Care Management Unit. Level 1 designation is reserved for patients with risk of imminent harm to self or others and
requiring significant resources.
45% 46%42%
32% 30%
36%28%
23% 19%
30%27% 29%
55% 54%
58%
68%
70%
64%72%
77%81%
70%73%
71%
0
20
40
60
80
100
120
140
Jan - Mar2013
Apr - Jun2013
Jul - Sep2013
Oct - Dec2013
Jan - Mar2014
Apr - Jun2014
Jul - Sep2014
Oct - Dec2014
Jan - Mar2015
Apr - Jun2015
Jul - Sep2015
Oct - Dec2015
Nu
mb
er
of
Pe
op
le
Quarter
Non-Level 1 Level 1

6
Involuntary Non-Level 1 and Level 1 bed days (Jan 2013 – Dec 2015)
People with Involuntary Admissions: Bed Days
Comparison Level 1 and Non-Level 1
Analysis is based on the Inpatient Tracking Spreadsheet maintained by the Department of Vermont Health Access (DVHA) for psychiatric hospitalizations with Level 1 Designations, and adult inpatient
psychiatric tracking spreadsheet maintained by the Department of Mental Health (DMH), Care Management Unit. Level 1 designation is reserved for patients with risk of imminent harm to self or others and
requiring significant resources. Bed days for Level 1 stays can include inpatient days before the Level 1 determination was made due to the payment structure of Level 1 inpatient stays.
60%73% 73% 62% 64% 65% 62% 58% 48% 47% 48% 45%
40%
27% 27% 38% 36% 35%38%
42% 52%53% 52% 55%
0
1,000
2,000
3,000
4,000
5,000
6,000
7,000
8,000
9,000
10,000
11,000
12,000
13,000
14,000
15,000
Jan - Mar2013
Apr - Jun2013
Jul - Sep2013
Oct - Dec2013
Jan - Mar2014
Apr - Jun2014
Jul - Sep2014
Oct - Dec2014
Jan - Mar2015
Apr - Jun2015
Jul - Sep2015
Oct - Dec2015
Bed
Day
s
Quarter
Non-Level 1 Level 1
7
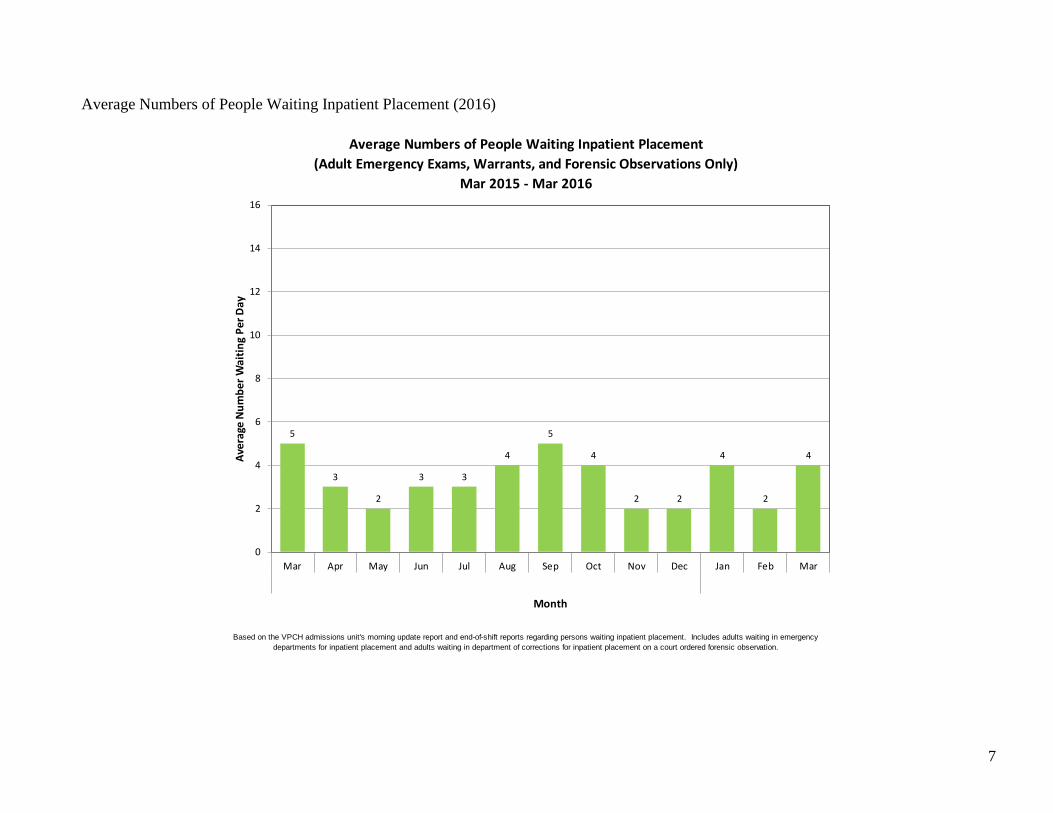
Average Numbers of People Waiting Inpatient Placement (2016)
Average Numbers of People Waiting Inpatient Placement
(Adult Emergency Exams, Warrants, and Forensic Observations Only)
Mar 2015 - Mar 2016
Based on the VPCH admissions unit's morning update report and end-of-shift reports regarding persons waiting inpatient placement. Includes adults waiting in emergency
departments for inpatient placement and adults waiting in department of corrections for inpatient placement on a court ordered forensic observation.
5
3
2
3 3
4
5
4
2 2
4
2
4
0
2
4
6
8
10
12
14
16
Mar Apr May Jun Jul Aug Sep Oct Nov Dec Jan Feb Mar
Ave
rage
Nu
mb
er W
aiti
ng
Per
Day
Month
8
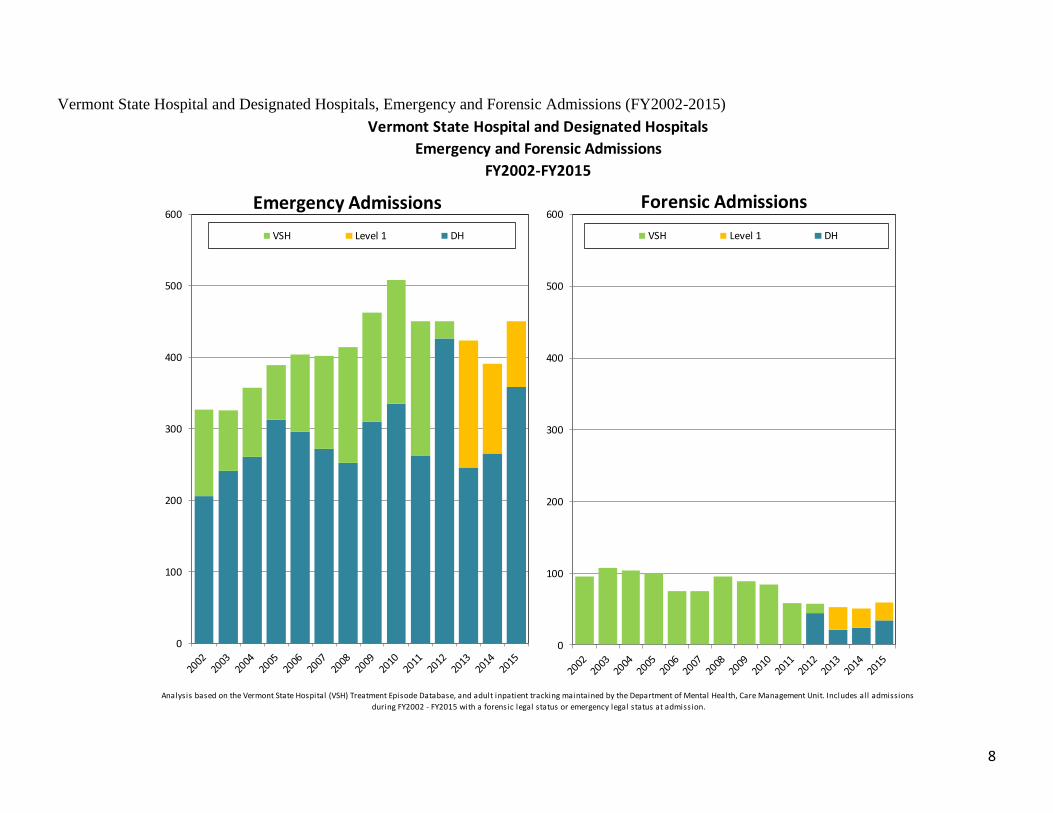
Vermont State Hospital and Designated Hospitals, Emergency and Forensic Admissions (FY2002-2015)
Vermont State Hospital and Designated Hospitals
Emergency and Forensic Admissions
FY2002-FY2015
Analysis based on the Vermont State Hospital (VSH) Treatment Episode Database, and adult inpatient tracking maintained by the Department of Mental Health, Care Management Unit. Includes all admissions
during FY2002 - FY2015 with a forensic legal status or emergency legal status at admission.
0
100
200
300
400
500
600Emergency Admissions
VSH Level 1 DH
0
100
200
300
400
500
600Forensic Admissions
VSH Level 1 DH
9
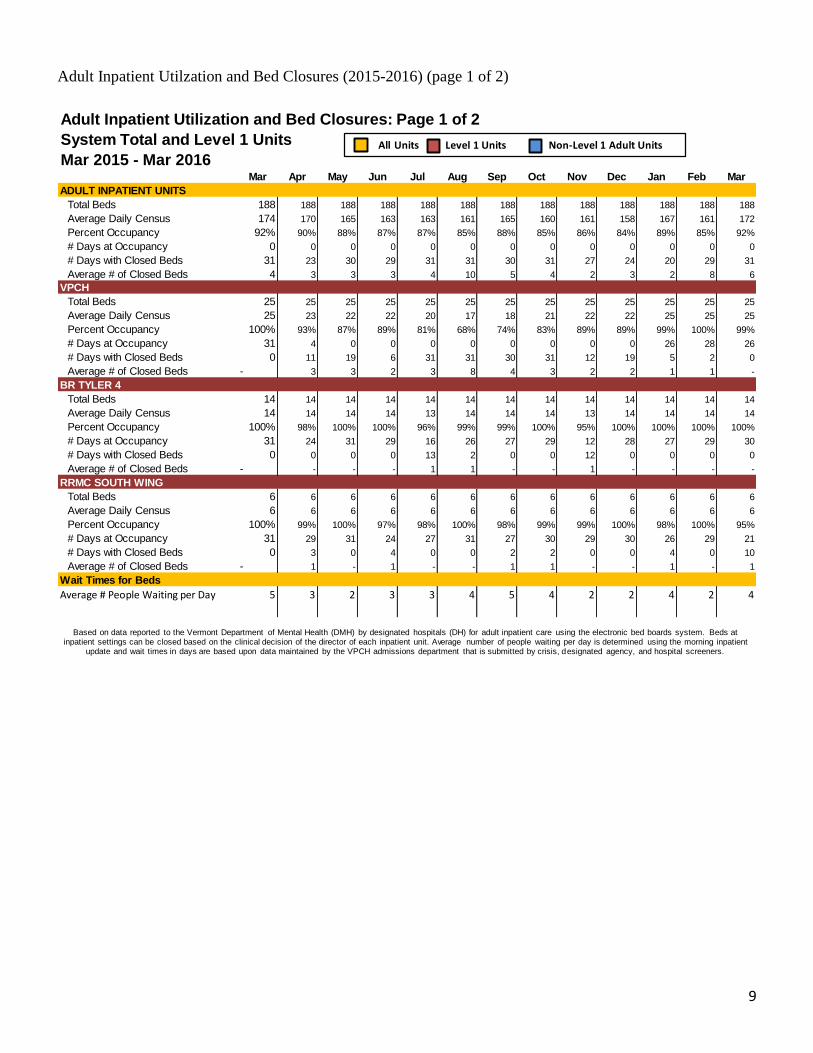
Adult Inpatient Utilzation and Bed Closures (2015-2016) (page 1 of 2)
Mar 2015 - Mar 2016Mar Apr May Jun Jul Aug Sep Oct Nov Dec Jan Feb Mar
ADULT INPATIENT UNITS
Total Beds 188 188 188 188 188 188 188 188 188 188 188 188 188
Average Daily Census 174 170 165 163 163 161 165 160 161 158 167 161 172
Percent Occupancy 92% 90% 88% 87% 87% 85% 88% 85% 86% 84% 89% 85% 92%
# Days at Occupancy 0 0 0 0 0 0 0 0 0 0 0 0 0
# Days with Closed Beds 31 23 30 29 31 31 30 31 27 24 20 29 31
Average # of Closed Beds 4 3 3 3 4 10 5 4 2 3 2 8 6
VPCH
Total Beds 25 25 25 25 25 25 25 25 25 25 25 25 25
Average Daily Census 25 23 22 22 20 17 18 21 22 22 25 25 25
Percent Occupancy 100% 93% 87% 89% 81% 68% 74% 83% 89% 89% 99% 100% 99%
# Days at Occupancy 31 4 0 0 0 0 0 0 0 0 26 28 26
# Days with Closed Beds 0 11 19 6 31 31 30 31 12 19 5 2 0
Average # of Closed Beds - 3 3 2 3 8 4 3 2 2 1 1 -
BR TYLER 4
Total Beds 14 14 14 14 14 14 14 14 14 14 14 14 14
Average Daily Census 14 14 14 14 13 14 14 14 13 14 14 14 14
Percent Occupancy 100% 98% 100% 100% 96% 99% 99% 100% 95% 100% 100% 100% 100%
# Days at Occupancy 31 24 31 29 16 26 27 29 12 28 27 29 30
# Days with Closed Beds 0 0 0 0 13 2 0 0 12 0 0 0 0
Average # of Closed Beds - - - - 1 1 - - 1 - - - -
RRMC SOUTH WING
Total Beds 6 6 6 6 6 6 6 6 6 6 6 6 6
Average Daily Census 6 6 6 6 6 6 6 6 6 6 6 6 6
Percent Occupancy 100% 99% 100% 97% 98% 100% 98% 99% 99% 100% 98% 100% 95%
# Days at Occupancy 31 29 31 24 27 31 27 30 29 30 26 29 21
# Days with Closed Beds 0 3 0 4 0 0 2 2 0 0 4 0 10
Average # of Closed Beds - 1 - 1 - - 1 1 - - 1 - 1
Wait Times for Beds
Average # People Waiting per Day 5 3 2 3 3 4 5 4 2 2 4 2 4
Adult Inpatient Utilization and Bed Closures: Page 1 of 2
System Total and Level 1 Units
Based on data reported to the Vermont Department of Mental Health (DMH) by designated hospitals (DH) for adult inpatient care using the electronic bed boards system. Beds at inpatient settings can be closed based on the clinical decision of the director of each inpatient unit. Average number of people waiting per day is determined using the morning inpatient
update and wait times in days are based upon data maintained by the VPCH admissions department that is submitted by crisis, designated agency, and hospital screeners.
All Units Level 1 Units Non-Level 1 Adult Units
10
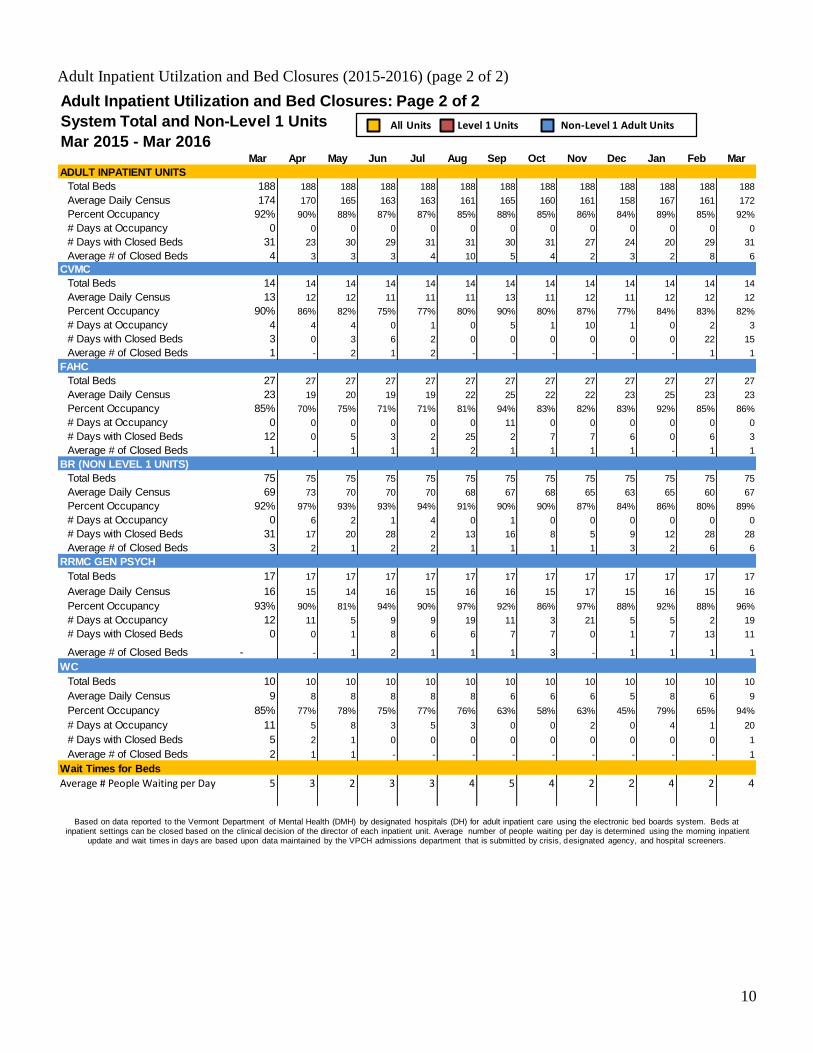
Adult Inpatient Utilzation and Bed Closures (2015-2016) (page 2 of 2)
Mar 2015 - Mar 2016Mar Apr May Jun Jul Aug Sep Oct Nov Dec Jan Feb Mar
ADULT INPATIENT UNITS
Total Beds 188 188 188 188 188 188 188 188 188 188 188 188 188
Average Daily Census 174 170 165 163 163 161 165 160 161 158 167 161 172
Percent Occupancy 92% 90% 88% 87% 87% 85% 88% 85% 86% 84% 89% 85% 92%
# Days at Occupancy 0 0 0 0 0 0 0 0 0 0 0 0 0
# Days with Closed Beds 31 23 30 29 31 31 30 31 27 24 20 29 31
Average # of Closed Beds 4 3 3 3 4 10 5 4 2 3 2 8 6
CVMC
Total Beds 14 14 14 14 14 14 14 14 14 14 14 14 14
Average Daily Census 13 12 12 11 11 11 13 11 12 11 12 12 12
Percent Occupancy 90% 86% 82% 75% 77% 80% 90% 80% 87% 77% 84% 83% 82%
# Days at Occupancy 4 4 4 0 1 0 5 1 10 1 0 2 3
# Days with Closed Beds 3 0 3 6 2 0 0 0 0 0 0 22 15
Average # of Closed Beds 1 - 2 1 2 - - - - - - 1 1
FAHC
Total Beds 27 27 27 27 27 27 27 27 27 27 27 27 27
Average Daily Census 23 19 20 19 19 22 25 22 22 23 25 23 23
Percent Occupancy 85% 70% 75% 71% 71% 81% 94% 83% 82% 83% 92% 85% 86%
# Days at Occupancy 0 0 0 0 0 0 11 0 0 0 0 0 0
# Days with Closed Beds 12 0 5 3 2 25 2 7 7 6 0 6 3
Average # of Closed Beds 1 - 1 1 1 2 1 1 1 1 - 1 1
BR (NON LEVEL 1 UNITS)
Total Beds 75 75 75 75 75 75 75 75 75 75 75 75 75
Average Daily Census 69 73 70 70 70 68 67 68 65 63 65 60 67
Percent Occupancy 92% 97% 93% 93% 94% 91% 90% 90% 87% 84% 86% 80% 89%
# Days at Occupancy 0 6 2 1 4 0 1 0 0 0 0 0 0
# Days with Closed Beds 31 17 20 28 2 13 16 8 5 9 12 28 28
Average # of Closed Beds 3 2 1 2 2 1 1 1 1 3 2 6 6
RRMC GEN PSYCH
Total Beds 17 17 17 17 17 17 17 17 17 17 17 17 17
Average Daily Census 16 15 14 16 15 16 16 15 17 15 16 15 16
Percent Occupancy 93% 90% 81% 94% 90% 97% 92% 86% 97% 88% 92% 88% 96%
# Days at Occupancy 12 11 5 9 9 19 11 3 21 5 5 2 19
# Days with Closed Beds 0 0 1 8 6 6 7 7 0 1 7 13 11
Average # of Closed Beds - - 1 2 1 1 1 3 - 1 1 1 1
WC
Total Beds 10 10 10 10 10 10 10 10 10 10 10 10 10
Average Daily Census 9 8 8 8 8 8 6 6 6 5 8 6 9
Percent Occupancy 85% 77% 78% 75% 77% 76% 63% 58% 63% 45% 79% 65% 94%
# Days at Occupancy 11 5 8 3 5 3 0 0 2 0 4 1 20
# Days with Closed Beds 5 2 1 0 0 0 0 0 0 0 0 0 1
Average # of Closed Beds 2 1 1 - - - - - - - - - 1
Wait Times for Beds
Average # People Waiting per Day 5 3 2 3 3 4 5 4 2 2 4 2 4
Adult Inpatient Utilization and Bed Closures: Page 2 of 2
System Total and Non-Level 1 Units
Based on data reported to the Vermont Department of Mental Health (DMH) by designated hospitals (DH) for adult inpatient care using the electronic bed boards system. Beds at inpatient settings can be closed based on the clinical decision of the director of each inpatient unit. Average number of people waiting per day is determined using the morning inpatient
update and wait times in days are based upon data maintained by the VPCH admissions department that is submitted by crisis, designated agency, and hospital screeners.
All Units Level 1 Units Non-Level 1 Adult Units
11
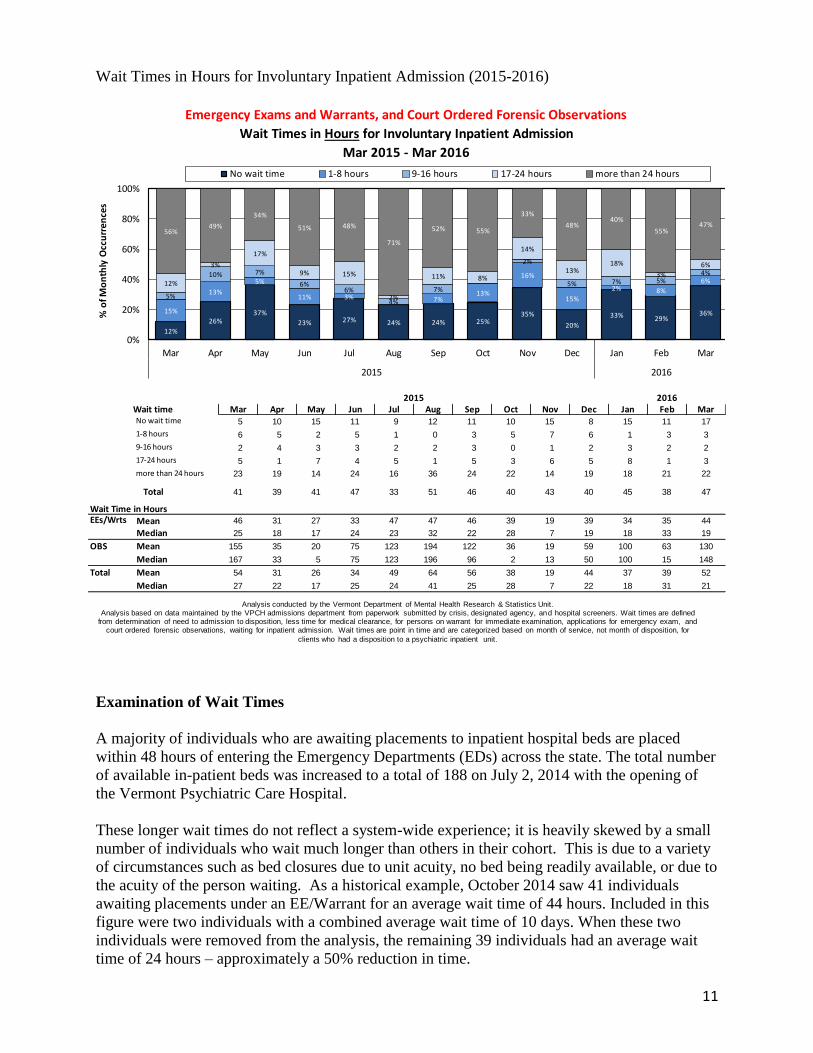
Wait Times in Hours for Involuntary Inpatient Admission (2015-2016)
Examination of Wait Times
A majority of individuals who are awaiting placements to inpatient hospital beds are placed
within 48 hours of entering the Emergency Departments (EDs) across the state. The total number
of available in-patient beds was increased to a total of 188 on July 2, 2014 with the opening of
the Vermont Psychiatric Care Hospital.
These longer wait times do not reflect a system-wide experience; it is heavily skewed by a small
number of individuals who wait much longer than others in their cohort. This is due to a variety
of circumstances such as bed closures due to unit acuity, no bed being readily available, or due to
the acuity of the person waiting. As a historical example, October 2014 saw 41 individuals
awaiting placements under an EE/Warrant for an average wait time of 44 hours. Included in this
figure were two individuals with a combined average wait time of 10 days. When these two
individuals were removed from the analysis, the remaining 39 individuals had an average wait
time of 24 hours – approximately a 50% reduction in time.
Mar Apr May Jun Jul Aug Sep Oct Nov Dec Jan Feb MarNo wait time 5 10 15 11 9 12 11 10 15 8 15 11 17
1-8 hours 6 5 2 5 1 0 3 5 7 6 1 3 3
9-16 hours 2 4 3 3 2 2 3 0 1 2 3 2 2
17-24 hours 5 1 7 4 5 1 5 3 6 5 8 1 3
more than 24 hours 23 19 14 24 16 36 24 22 14 19 18 21 22
41 39 41 47 33 51 46 40 43 40 45 38 47
EEs/Wrts Mean 46 31 27 33 47 47 46 39 19 39 34 35 44
Median 25 18 17 24 23 32 22 28 7 19 18 33 19
OBS Mean 155 35 20 75 123 194 122 36 19 59 100 63 130
Median 167 33 5 75 123 196 96 2 13 50 100 15 148
Total Mean 54 31 26 34 49 64 56 38 19 44 37 39 52
Median 27 22 17 25 24 41 25 28 7 22 18 31 21
Wait time
Total
Wait Time in Hours
Emergency Exams and Warrants, and Court Ordered Forensic Observations
Wait Times in Hours for Involuntary Inpatient Admission
Mar 2015 - Mar 2016
2015 2016
12%
26%37%
23% 27% 24% 24% 25%35%
20%
33% 29%36%15%
13%
5%
11% 3% 7%13%
16%
15%
2% 8%
6%
5%
10% 7%
6%6%
4%
7%
2%
5% 7% 5%4%
12%
3%
17%
9% 15%
2%
11% 8%
14%
13%18%
3%
6%
56%49%
34%
51% 48%
71%
52% 55%
33%
48%40%
55%47%
0%
20%
40%
60%
80%
100%
Mar Apr May Jun Jul Aug Sep Oct Nov Dec Jan Feb Mar
2015 2016
% o
f Mo
nth
ly O
ccu
rren
ces
No wait time 1-8 hours 9-16 hours 17-24 hours more than 24 hours
Analysis conducted by the Vermont Department of Mental Health Research & Statistics Unit. Analysis based on data maintained by the VPCH admissions department from paperwork submitted by crisis, designated agency, and hospital screeners. Wait times are defined
from determination of need to admission to disposition, less time for medical clearance, for persons on warrant for immediate examination, applications for emergency exam, and court ordered forensic observations, waiting for inpatient admission. Wait times are point in time and are categorized based on month of service, not month of disposition, for
clients who had a disposition to a psychiatric inpatient unit.

12
Beginning January 2015, the reporting of ED wait times focused primarily on adults in the care
and custody of the Commissioner who are held on EE/warrants or being held for forensic
observation due to the unique circumstances involved with placements of Level 1 and
individuals involved with the courts. Individuals experiencing longer wait times have
complicating factors that are systemic (need for Level 1 bed and significant medical
complications) as well as individual (comorbid issues with dementia, TBI, med refusals, etc.).
Our goal continues to be placing individuals in appropriate beds as soon as they are available and
patient acuity is appropriate for the inpatient placement.
DMH has a cadre of experienced care managers (Care Management Team), who work with each
of the Designated Hospitals, the Designated Agencies Emergency Services teams, and the
hospital Emergency Departments statewide. Their function is to work with individual cases and
the relevant action systems, to move people needing care through the system. The system is
comprised of several points along a continuum which represent appropriate levels of care. Since
our acute mental health treatment system became decentralized, placement considerations have
become more complex. A significant reason for this lack of accessibility is due to some number
of these beds being utilized by longer term patients, who either need longer treatment stays due
to their acuity or for whom community based placements are difficult to organize and staff. The
Care Management Team also works on longer term planning for these individuals, monitoring
availability of placements in various levels of community care across the state.
13
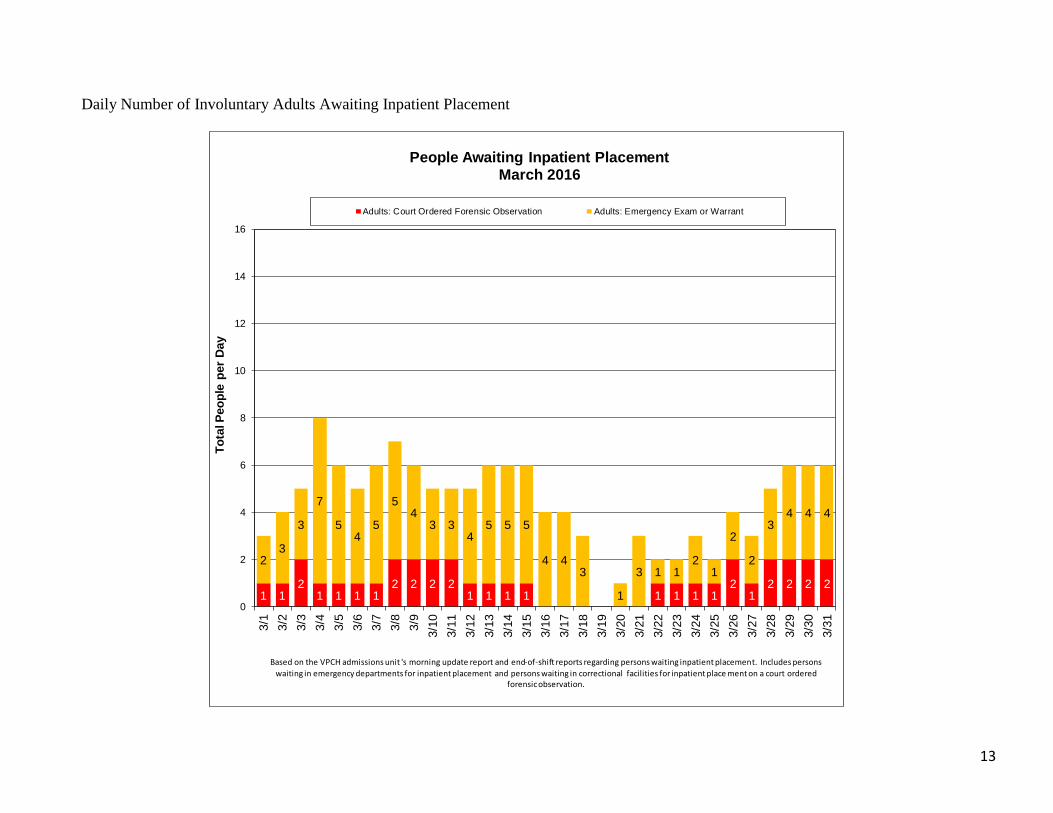
Daily Number of Involuntary Adults Awaiting Inpatient Placement
1 12
1 1 1 12 2 2 2
1 1 1 1 1 1 1 12
12 2 2 2
23
3
7
54
5
54
3 34
5 5 5
4 43
1
3 1 12
1
2
2
34 4 4
0
2
4
6
8
10
12
14
16
3/1
3/2
3/3
3/4
3/5
3/6
3/7
3/8
3/9
3/1
0
3/1
1
3/1
2
3/1
3
3/1
4
3/1
5
3/1
6
3/1
7
3/1
8
3/1
9
3/2
0
3/2
1
3/2
2
3/2
3
3/2
4
3/2
5
3/2
6
3/2
7
3/2
8
3/2
9
3/3
0
3/3
1
To
tal P
eo
ple
per
Day
People Awaiting Inpatient PlacementMarch 2016
Adults: Court Ordered Forensic Observation Adults: Emergency Exam or Warrant
Based on the VPCH admissions unit 's morning update report and end-of-shift reports regarding persons waiting inpatient placement. Includes persons
waiting in emergency departments for inpatient placement and persons waiting in correctional facilities for inpatient place ment on a court ordered forensic observation.
14
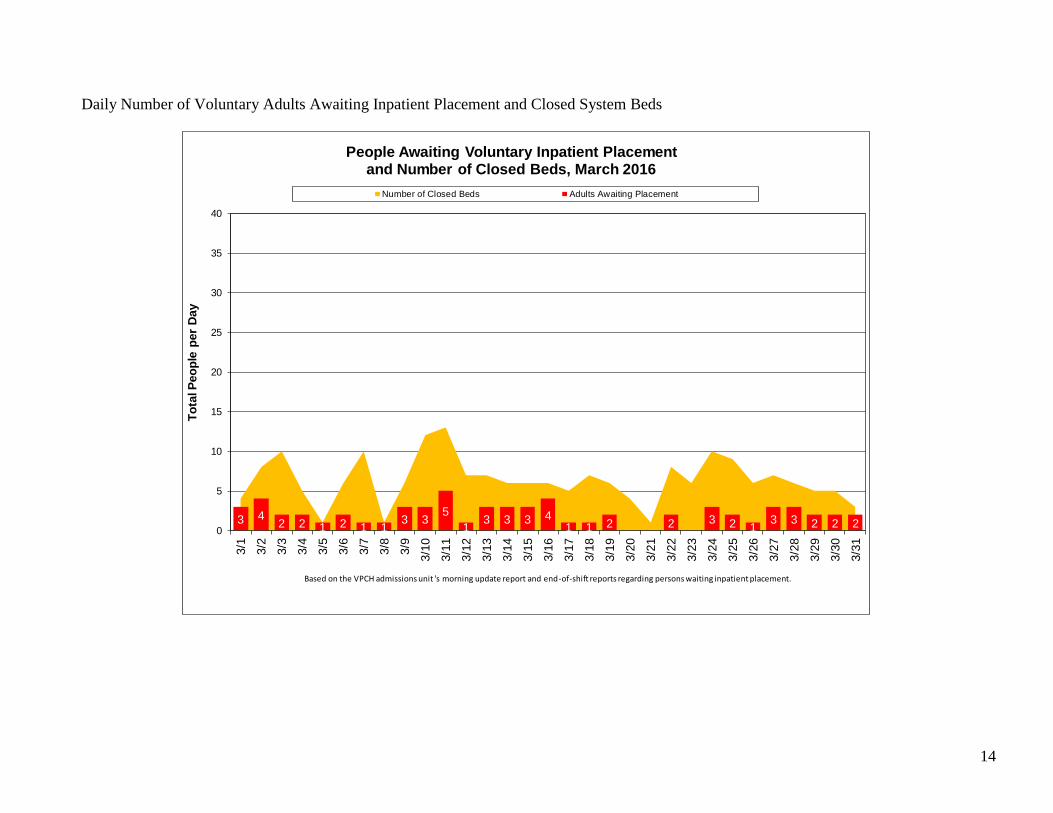
Daily Number of Voluntary Adults Awaiting Inpatient Placement and Closed System Beds
3 42 2 1 2 1 1
3 35
13 3 3 4
1 1 2 2 3 2 13 3 2 2 2
0
5
10
15
20
25
30
35
40
3/1
3/2
3/3
3/4
3/5
3/6
3/7
3/8
3/9
3/1
0
3/1
1
3/1
2
3/1
3
3/1
4
3/1
5
3/1
6
3/1
7
3/1
8
3/1
9
3/2
0
3/2
1
3/2
2
3/2
3
3/2
4
3/2
5
3/2
6
3/2
7
3/2
8
3/2
9
3/3
0
3/3
1
To
tal P
eo
ple
per
Day
People Awaiting Voluntary Inpatient Placementand Number of Closed Beds, March 2016
Number of Closed Beds Adults Awaiting Placement
Based on the VPCH admissions unit 's morning update report and end-of-shift reports regarding persons waiting inpatient placement.
15
Additional Reporting Requests
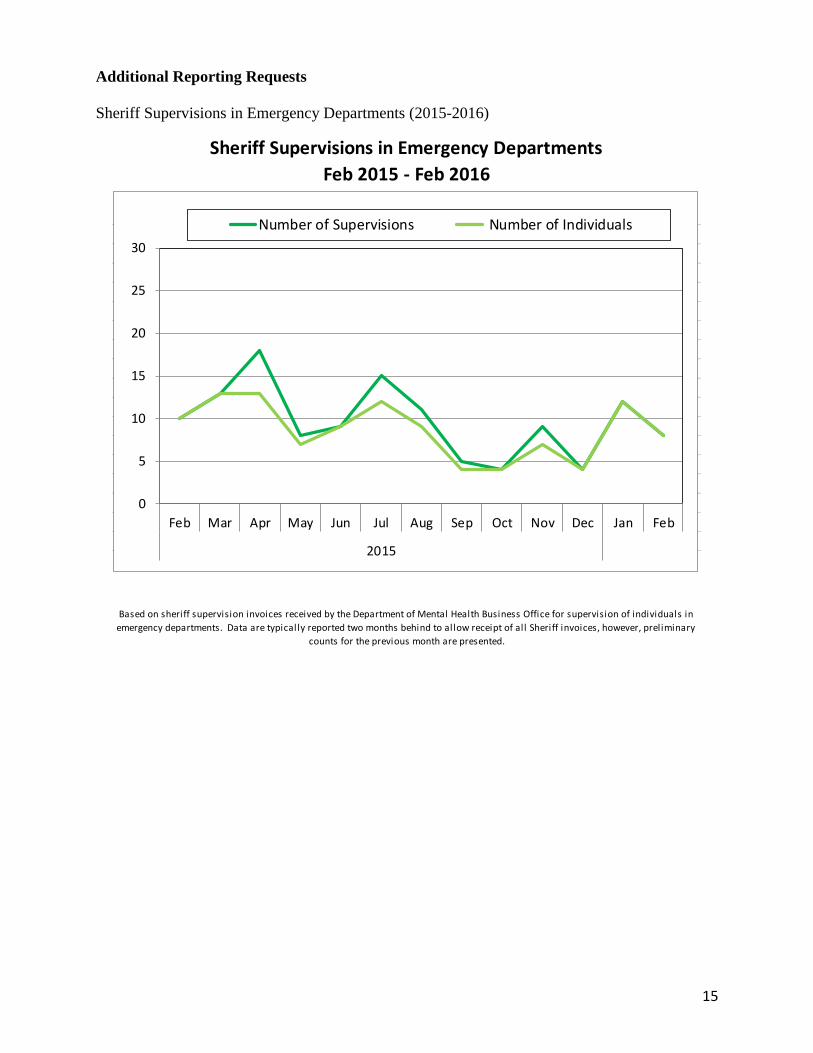
Sheriff Supervisions in Emergency Departments (2015-2016)
Sheriff Supervisions in Emergency Departments
Feb 2015 - Feb 2016
Based on sheriff supervision invoices received by the Department of Mental Health Business Office for supervision of individuals in
emergency departments. Data are typically reported two months behind to allow receipt of all Sheriff invoices, however, preliminary
counts for the previous month are presented.
0
5
10
15
20
25
30
Feb Mar Apr May Jun Jul Aug Sep Oct Nov Dec Jan Feb
2015
Number of Supervisions Number of Individuals
16
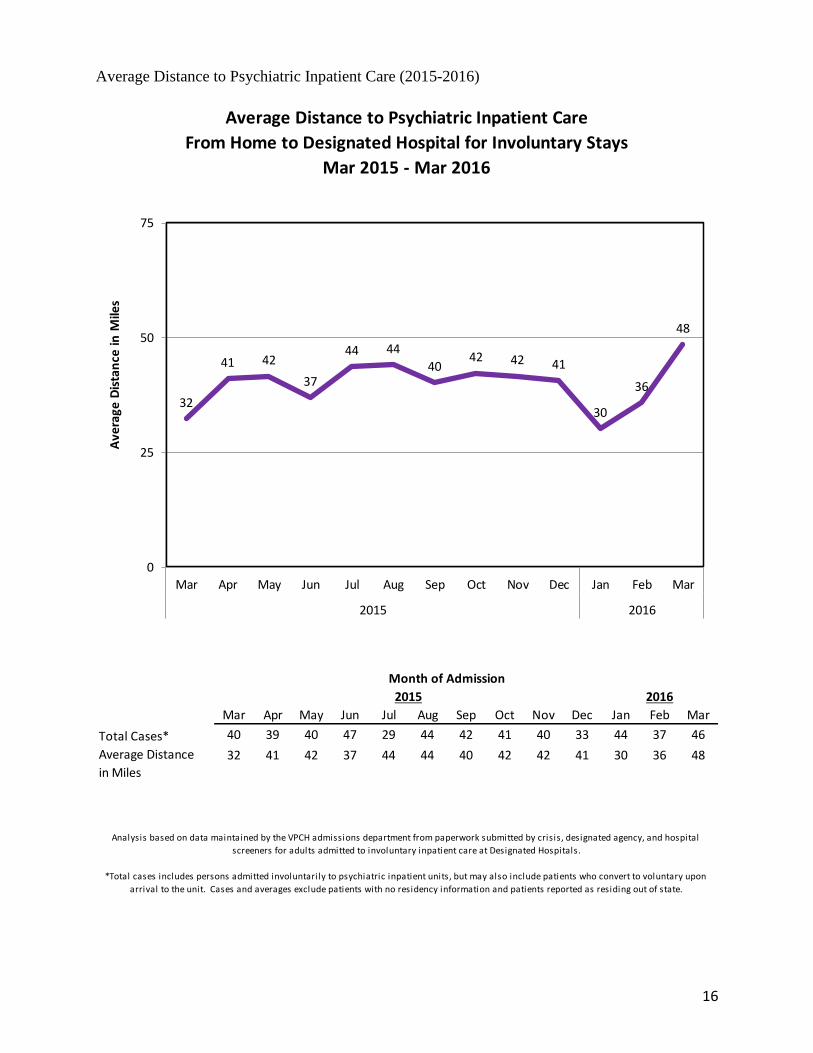
Average Distance to Psychiatric Inpatient Care (2015-2016)
Mar Apr May Jun Jul Aug Sep Oct Nov Dec Jan Feb Mar
Total Cases* 40 39 40 47 29 44 42 41 40 33 44 37 46
32 41 42 37 44 44 40 42 42 41 30 36 48
Analysis based on data maintained by the VPCH admissions department from paperwork submitted by crisis, designated agency, and hospital
screeners for adults admitted to involuntary inpatient care at Designated Hospitals.
*Total cases includes persons admitted involuntarily to psychiatric inpatient units, but may also include patients who convert to voluntary upon
arrival to the unit. Cases and averages exclude patients with no residency information and patients reported as residing out of state.
2015 2016
Average Distance to Psychiatric Inpatient Care
From Home to Designated Hospital for Involuntary Stays
Mar 2015 - Mar 2016
Month of Admission
Average Distance
in Miles
32
41 42
37
44 44
4042 42 41
30
36
48
0
25
50
75
Mar Apr May Jun Jul Aug Sep Oct Nov Dec Jan Feb Mar
2015 2016
Av
era
ge
Dis
tan
ce i
n M
iles
17
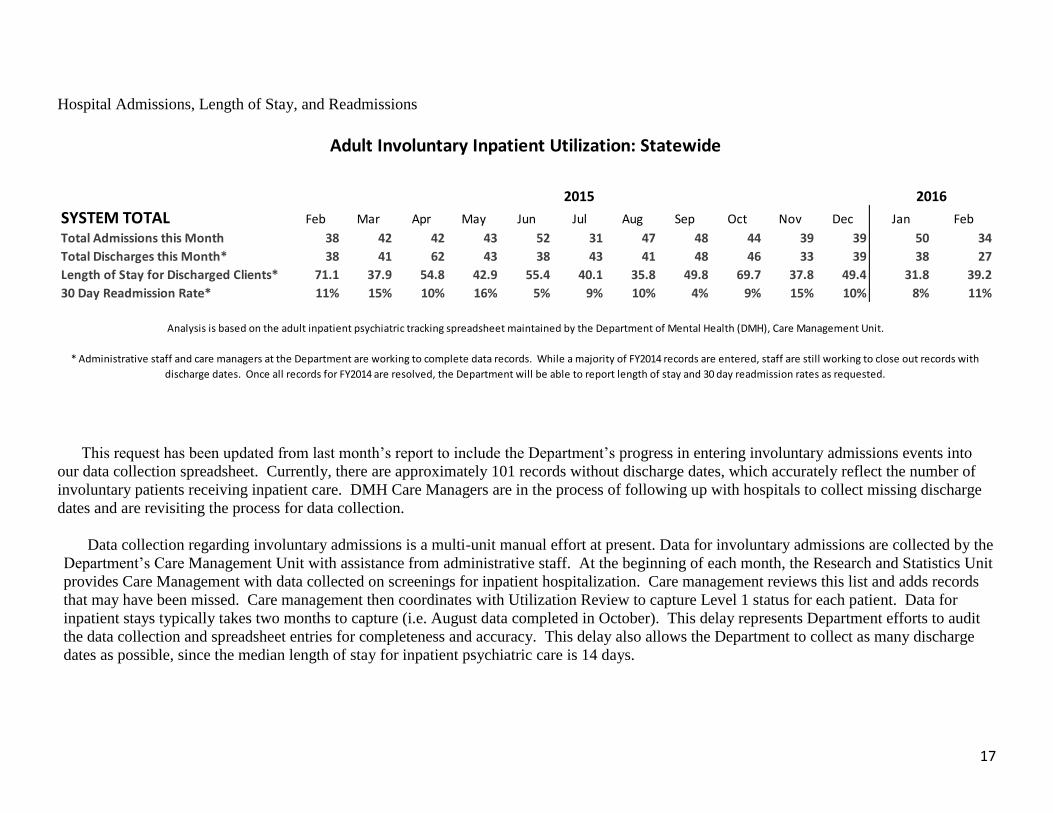
Hospital Admissions, Length of Stay, and Readmissions
This request has been updated from last month’s report to include the Department’s progress in entering involuntary admissions events into
our data collection spreadsheet. Currently, there are approximately 101 records without discharge dates, which accurately reflect the number of
involuntary patients receiving inpatient care. DMH Care Managers are in the process of following up with hospitals to collect missing discharge
dates and are revisiting the process for data collection.
Data collection regarding involuntary admissions is a multi-unit manual effort at present. Data for involuntary admissions are collected by the
Department’s Care Management Unit with assistance from administrative staff. At the beginning of each month, the Research and Statistics Unit
provides Care Management with data collected on screenings for inpatient hospitalization. Care management reviews this list and adds records
that may have been missed. Care management then coordinates with Utilization Review to capture Level 1 status for each patient. Data for
inpatient stays typically takes two months to capture (i.e. August data completed in October). This delay represents Department efforts to audit
the data collection and spreadsheet entries for completeness and accuracy. This delay also allows the Department to collect as many discharge
dates as possible, since the median length of stay for inpatient psychiatric care is 14 days.
SYSTEM TOTAL Feb Mar Apr May Jun Jul Aug Sep Oct Nov Dec Jan Feb
Total Admissions this Month 38 42 42 43 52 31 47 48 44 39 39 50 34
Total Discharges this Month* 38 41 62 43 38 43 41 48 46 33 39 38 27
Length of Stay for Discharged Clients* 71.1 37.9 54.8 42.9 55.4 40.1 35.8 49.8 69.7 37.8 49.4 31.8 39.2
30 Day Readmission Rate* 11% 15% 10% 16% 5% 9% 10% 4% 9% 15% 10% 8% 11%
2015 2016
Analysis is based on the adult inpatient psychiatric tracking spreadsheet maintained by the Department of Mental Health (DMH), Care Management Unit.
* Administrative staff and care managers at the Department are working to complete data records. While a majority of FY2014 records are entered, staff are still working to close out records with
discharge dates. Once all records for FY2014 are resolved, the Department will be able to report length of stay and 30 day readmission rates as requested.
Adult Involuntary Inpatient Utilization: Statewide
18
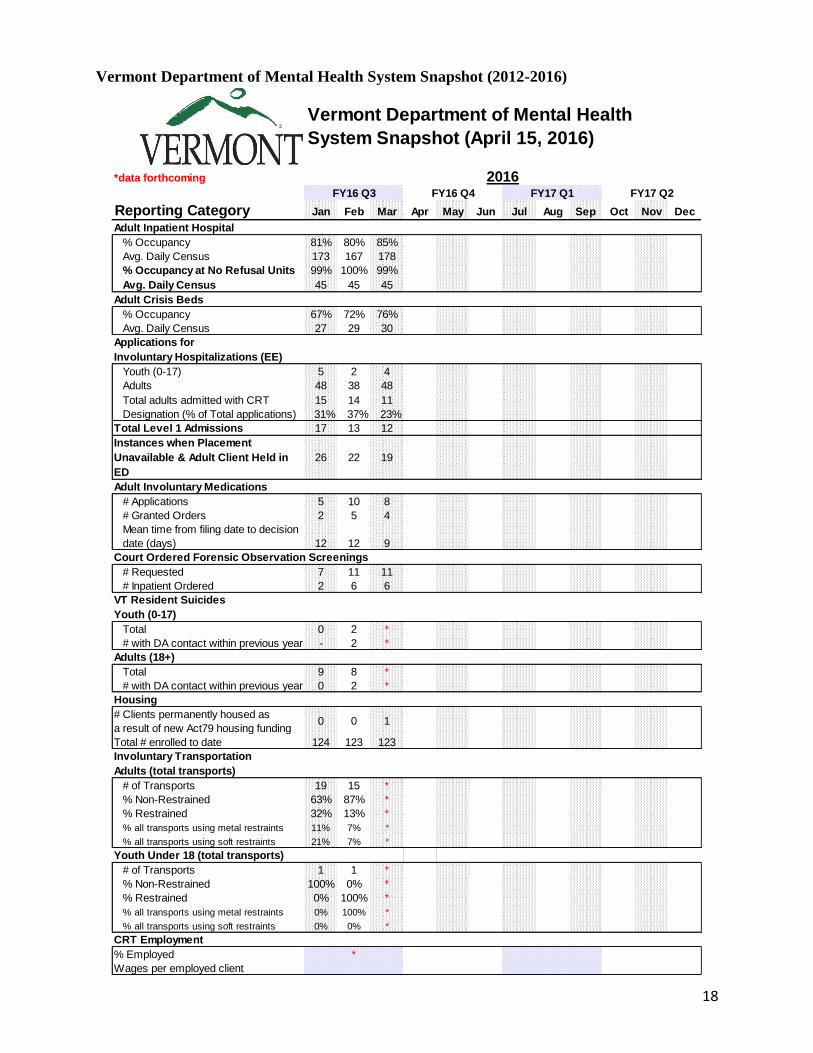
Vermont Department of Mental Health System Snapshot (2012-2016)
*data forthcoming
Reporting Category Jan Feb Mar Apr May Jun Jul Aug Sep Oct Nov Dec
Adult Inpatient Hospital
% Occupancy 81% 80% 85%
Avg. Daily Census 173 167 178
% Occupancy at No Refusal Units 99% 100% 99%
Avg. Daily Census 45 45 45
Adult Crisis Beds
% Occupancy 67% 72% 76%
Avg. Daily Census 27 29 30
Applications for
Involuntary Hospitalizations (EE)
Youth (0-17) 5 2 4
Adults 48 38 48
15 14 11
31% 37% 23%
Total Level 1 Admissions 17 13 12
Instances when Placement
Unavailable & Adult Client Held in
ED
26 22 19
Adult Involuntary Medications
# Applications 5 10 8
# Granted Orders 2 5 4
Mean time from filing date to decision
date (days) 12 12 9
Court Ordered Forensic Observation Screenings
# Requested 7 11 11
# Inpatient Ordered 2 6 6
VT Resident Suicides
Youth (0-17)
Total 0 2 *
# with DA contact within previous year - 2 *
Adults (18+)
Total 9 8 *
# with DA contact within previous year 0 2 *
Housing
# Clients permanently housed as
a result of new Act79 housing funding0 0 1
Total # enrolled to date 124 123 123
Involuntary Transportation
Adults (total transports)
# of Transports 19 15 *
% Non-Restrained 63% 87% *
% Restrained 32% 13% *
% all transports using metal restraints 11% 7% *
% all transports using soft restraints 21% 7% *
Youth Under 18 (total transports)
# of Transports 1 1 *
% Non-Restrained 100% 0% *
% Restrained 0% 100% *
% all transports using metal restraints 0% 100% *
% all transports using soft restraints 0% 0% *
CRT Employment
% Employed
Wages per employed client
Total adults admitted with CRT
Designation (% of Total applications)
*
Vermont Department of Mental Health
System Snapshot (April 15, 2016)
2016FY16 Q3 FY16 Q4 FY17 Q1 FY17 Q2
19
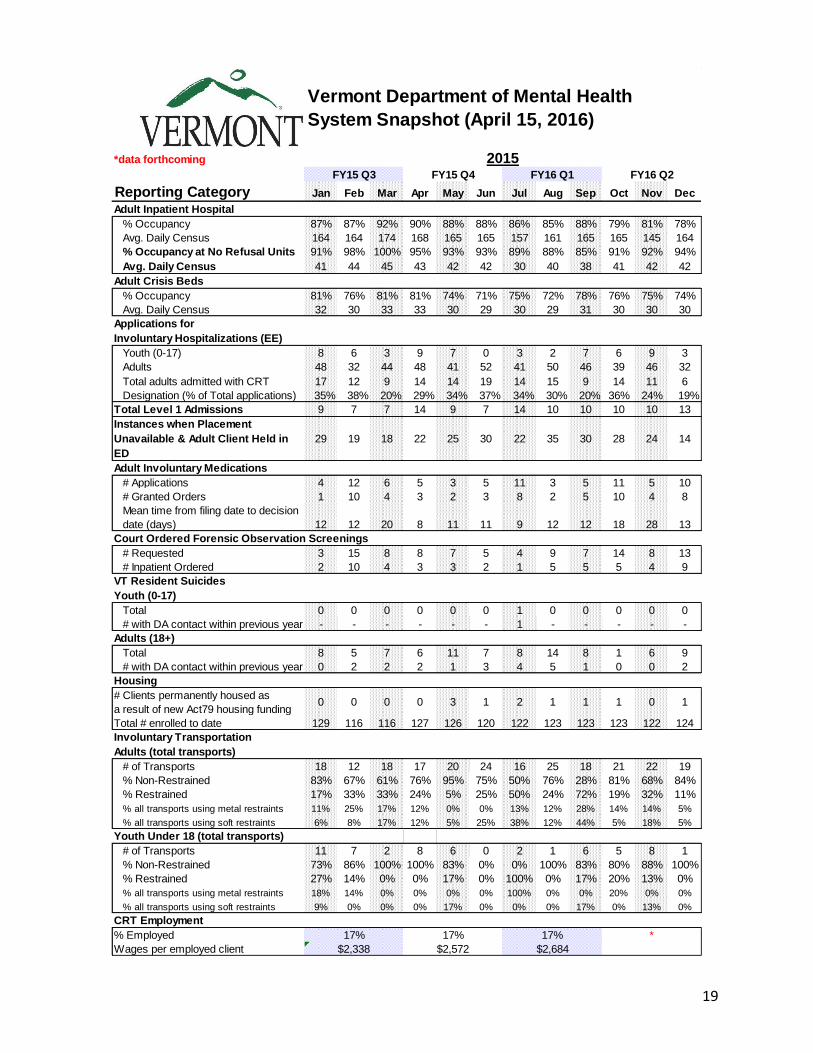
*data forthcoming
Reporting Category Jan Feb Mar Apr May Jun Jul Aug Sep Oct Nov Dec
Adult Inpatient Hospital
% Occupancy 87% 87% 92% 90% 88% 88% 86% 85% 88% 79% 81% 78%
Avg. Daily Census 164 164 174 168 165 165 157 161 165 165 145 164
% Occupancy at No Refusal Units 91% 98% 100% 95% 93% 93% 89% 88% 85% 91% 92% 94%
Avg. Daily Census 41 44 45 43 42 42 30 40 38 41 42 42
Adult Crisis Beds
% Occupancy 81% 76% 81% 81% 74% 71% 75% 72% 78% 76% 75% 74%
Avg. Daily Census 32 30 33 33 30 29 30 29 31 30 30 30
Applications for
Involuntary Hospitalizations (EE)
Youth (0-17) 8 6 3 9 7 0 3 2 7 6 9 3
Adults 48 32 44 48 41 52 41 50 46 39 46 32
17 12 9 14 14 19 14 15 9 14 11 6
35% 38% 20% 29% 34% 37% 34% 30% 20% 36% 24% 19%
Total Level 1 Admissions 9 7 7 14 9 7 14 10 10 10 10 13
Instances when Placement
Unavailable & Adult Client Held in
ED
29 19 18 22 25 30 22 35 30 28 24 14
Adult Involuntary Medications
# Applications 4 12 6 5 3 5 11 3 5 11 5 10
# Granted Orders 1 10 4 3 2 3 8 2 5 10 4 8
Mean time from filing date to decision
date (days) 12 12 20 8 11 11 9 12 12 18 28 13
Court Ordered Forensic Observation Screenings
# Requested 3 15 8 8 7 5 4 9 7 14 8 13
# Inpatient Ordered 2 10 4 3 3 2 1 5 5 5 4 9
VT Resident Suicides
Youth (0-17)
Total 0 0 0 0 0 0 1 0 0 0 0 0
# with DA contact within previous year - - - - - - 1 - - - - -
Adults (18+)
Total 8 5 7 6 11 7 8 14 8 1 6 9
# with DA contact within previous year 0 2 2 2 1 3 4 5 1 0 0 2
Housing
# Clients permanently housed as
a result of new Act79 housing funding0 0 0 0 3 1 2 1 1 1 0 1
Total # enrolled to date 129 116 116 127 126 120 122 123 123 123 122 124
Involuntary Transportation
Adults (total transports)
# of Transports 18 12 18 17 20 24 16 25 18 21 22 19
% Non-Restrained 83% 67% 61% 76% 95% 75% 50% 76% 28% 81% 68% 84%
% Restrained 17% 33% 33% 24% 5% 25% 50% 24% 72% 19% 32% 11%
% all transports using metal restraints 11% 25% 17% 12% 0% 0% 13% 12% 28% 14% 14% 5%
% all transports using soft restraints 6% 8% 17% 12% 5% 25% 38% 12% 44% 5% 18% 5%
Youth Under 18 (total transports)
# of Transports 11 7 2 8 6 0 2 1 6 5 8 1
% Non-Restrained 73% 86% 100% 100% 83% 0% 0% 100% 83% 80% 88% 100%
% Restrained 27% 14% 0% 0% 17% 0% 100% 0% 17% 20% 13% 0%
% all transports using metal restraints 18% 14% 0% 0% 0% 0% 100% 0% 0% 20% 0% 0%
% all transports using soft restraints 9% 0% 0% 0% 17% 0% 0% 0% 17% 0% 13% 0%
CRT Employment
% Employed
Wages per employed client
Total adults admitted with CRT
Designation (% of Total applications)
17% 17% 17% *
$2,338 $2,572 $2,684
Vermont Department of Mental Health
System Snapshot (April 15, 2016)
2015FY15 Q3 FY15 Q4 FY16 Q1 FY16 Q2
20
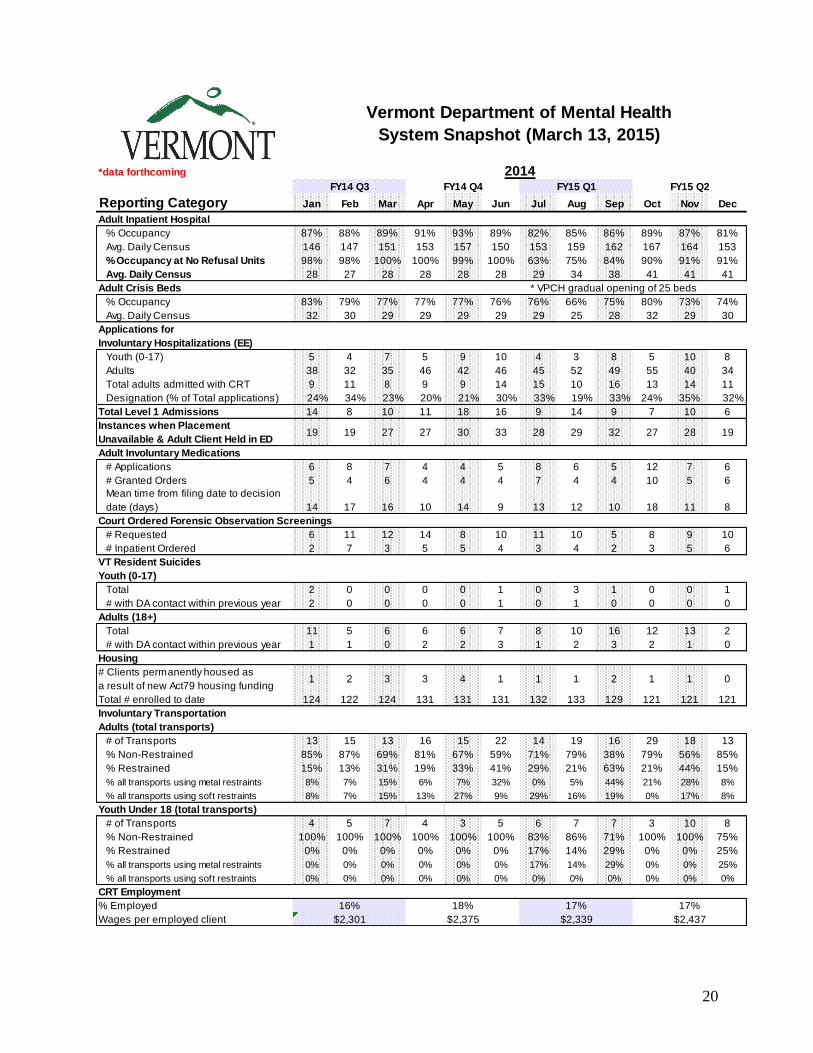
*data forthcoming
Reporting Category Jan Feb Mar Apr May Jun Jul Aug Sep Oct Nov Dec
Adult Inpatient Hospital
% Occupancy 87% 88% 89% 91% 93% 89% 82% 85% 86% 89% 87% 81%
Avg. Daily Census 146 147 151 153 157 150 153 159 162 167 164 153
% Occupancy at No Refusal Units 98% 98% 100% 100% 99% 100% 63% 75% 84% 90% 91% 91%
Avg. Daily Census 28 27 28 28 28 28 29 34 38 41 41 41
Adult Crisis Beds * VPCH gradual opening of 25 beds
% Occupancy 83% 79% 77% 77% 77% 76% 76% 66% 75% 80% 73% 74%
Avg. Daily Census 32 30 29 29 29 29 29 25 28 32 29 30
Applications for
Involuntary Hospitalizations (EE)
Youth (0-17) 5 4 7 5 9 10 4 3 8 5 10 8
Adults 38 32 35 46 42 46 45 52 49 55 40 34
9 11 8 9 9 14 15 10 16 13 14 11
24% 34% 23% 20% 21% 30% 33% 19% 33% 24% 35% 32%
Total Level 1 Admissions 14 8 10 11 18 16 9 14 9 7 10 6
Instances when Placement
Unavailable & Adult Client Held in ED19 19 27 27 30 33 28 29 32 27 28 19
Adult Involuntary Medications
# Applications 6 8 7 4 4 5 8 6 5 12 7 6
# Granted Orders 5 4 6 4 4 4 7 4 4 10 5 6
Mean time from filing date to decision
date (days) 14 17 16 10 14 9 13 12 10 18 11 8
Court Ordered Forensic Observation Screenings
# Requested 6 11 12 14 8 10 11 10 5 8 9 10
# Inpatient Ordered 2 7 3 5 5 4 3 4 2 3 5 6
VT Resident Suicides
Youth (0-17)
Total 2 0 0 0 0 1 0 3 1 0 0 1
# with DA contact within previous year 2 0 0 0 0 1 0 1 0 0 0 0
Adults (18+)
Total 11 5 6 6 6 7 8 10 16 12 13 2
# with DA contact within previous year 1 1 0 2 2 3 1 2 3 2 1 0
Housing
# Clients permanently housed as
a result of new Act79 housing funding1 2 3 3 4 1 1 1 2 1 1 0
Total # enrolled to date 124 122 124 131 131 131 132 133 129 121 121 121
Involuntary Transportation
Adults (total transports)
# of Transports 13 15 13 16 15 22 14 19 16 29 18 13
% Non-Restrained 85% 87% 69% 81% 67% 59% 71% 79% 38% 79% 56% 85%
% Restrained 15% 13% 31% 19% 33% 41% 29% 21% 63% 21% 44% 15%
% all transports using metal restraints 8% 7% 15% 6% 7% 32% 0% 5% 44% 21% 28% 8%
% all transports using soft restraints 8% 7% 15% 13% 27% 9% 29% 16% 19% 0% 17% 8%
Youth Under 18 (total transports)
# of Transports 4 5 7 4 3 5 6 7 7 3 10 8
% Non-Restrained 100% 100% 100% 100% 100% 100% 83% 86% 71% 100% 100% 75%
% Restrained 0% 0% 0% 0% 0% 0% 17% 14% 29% 0% 0% 25%
% all transports using metal restraints 0% 0% 0% 0% 0% 0% 17% 14% 29% 0% 0% 25%
% all transports using soft restraints 0% 0% 0% 0% 0% 0% 0% 0% 0% 0% 0% 0%
CRT Employment
% Employed
Wages per employed client $2,301 $2,375 $2,339 $2,437
2014FY14 Q3 FY14 Q4 FY15 Q1 FY15 Q2
Vermont Department of Mental Health
System Snapshot (March 13, 2015)
Total adults admitted with CRT
Designation (% of Total applications)
16% 18% 17% 17%

21
*data forthcoming
Reporting Category Jan Feb Mar Apr May Jun Jul Aug Sep Oct Nov Dec
Adult Inpatient Hospital
% Occupancy 94% 91% 92% 84% 87% 93% 88% 89% 89% 89% 90% 83%
Avg. Daily Census 137 132 136 134 135 146 138 139 139 143 149 137
% Occupancy at No Refusal Units 100% 96% 99% 99% 99% 98%
Avg. Daily Census 28 27 28 28 28 27
Adult Crisis Beds
% Occupancy 77% 79% 83% 82% 84% 85% 82% 81% 79% 81% 83% 79%
Avg. Daily Census 27 28 29 29 31 31 30 31 31 31 32 31
Applications for
Involuntary Hospitalizations (EE)
Youth (0-17) - - - 9 10 6 9 7 15 6 4 2
Adults 50 32 55 41 55 39 65 32 43 43 37 39
13 13 27 19 14 11 15 12 9 7 11 19
26% 41% 49% 46% 25% 28% 23% 38% 21% 16% 30% 49%
Total Level 1 Admissions 22 13 20 22 26 10 19 18 13 11 7 14
Instances when Placement
Unavailable & Adult Client Held in ED27 21 43 27 38 24 38 16 34 29 30 23
Adult Involuntary Medications
# Applications 2 3 3 2 9 4 5 7 5 10 9 4
# Granted Orders 2 3 2 2 5 3 5 6 3 4 6 3
Mean time from filing date to decision
date (days) 22 12 20 27 19 17 20 14 12 17 9 10
Court Ordered Forensic Observation Screenings
# Requested 11 13 9 10 11 11 22 20 19 16 13 9
# Inpatient Ordered 3 7 5 5 6 6 11 8 7 5 6 5
VT Resident Suicides
Youth (0-17)
Total 0 0 0 0 0 2 0 0 0 1 0 1
# with DA contact within previous year - - - - - 1 - - - 0 - 1
Adults (18+)
Total 4 6 10 8 10 5 8 10 14 13 8 6
# with DA contact within previous year 0 3 2 2 1 0 2 1 4 4 1 1
Housing
# Clients permanently housed as
a result of new Act79 housing funding18 21 14 11 14 5 0 5 0 2 0 0
Total # enrolled to date 98 119 133 144 158 169 169 176 176 168 123 123
Involuntary Transportation
Adults (total transports)
# of Transports 19 17 18 11 18 13 18 12 18 15 17 17
% Non-Restrained 58% 94% 61% 82% 78% 85% 72% 75% 83% 100% 94% 65%
% Restrained 42% 6% 39% 18% 22% 15% 28% 25% 17% 0% 6% 35%
% all transports using metal restraints 16% 6% 6% 9% 6% 8% 17% 25% 17% 0% 6% 18%
% all transports using soft restraints 26% 0% 33% 9% 17% 8% 11% 0% 0% 0% 0% 18%
Youth Under 10 (total transports)
# of Transports 3 3 0 0 0 0 0 0 2 0 0 0
% Non-Restrained 100% 100% - - - - - - 100% - - -
% Restrained 0% 0% - - - - - - 0% - - -
% all transports using metal restraints 0% 0% - - - - - - 0% - - -
% all transports using soft restraints 0% 0% - - - - - - 0% - - -
CRT Employment
% Employed
Wages per employed client
Vermont Department of Mental Health
System Snapshot (January 14, 2014)
2013
Total adults admitted with CRT
Designation (% of Total applications)
FY13 Q3 FY13 Q4 FY14 Q1 FY14 Q2
15% 16% 17% 15%
$2,318 $2,457 $2,298 $2,456
22
Definitions
Inpatient Hospital
Designated Agency Crisis Bed
Court-ordered Forensic
Observations
Emergency Examination (EE)
Restrained Transport
(formerly called Secure)
Non-Restrained Transport
(formerly called Non-Secure)
VT Resident Suicides
Vermont Department of Mental Health
System Snapshot
Based on the number of applications approved, in the months the program
has been operating and the total approved to date. Enrollment to date
numbers do not necessarily sum to total numbers housed. Data cleaning is
on-going.
Housing
Based on PRELIMINARY data from the Vital Statistics System maintained by
Vermont Department of Health and Monthly Service Report (MSR) data
provided by the Department of Mental Health (DMH). Cross-sector data
analysis was conducted using LinkPlus, a probabilistic statistical linkage
software developed by the CDC for linking records across databases. MSR
data includes services provided by community designated agencies for
clients served by DAs within the year prior to death. Primary Program is
defined as the primary program assignment on the client's last service with
DMH. Monthly counts are subject to change as more information is made
available.
Transport not utilizing restraints; this can include plain clothed law
enforcement, Designated Agency transport teams, or other means of
transport such as family members.
Transport via law enforcement utilizing either metal or soft restraints.
An application for emergency examination has been completed for
involuntarily admission (§7508 of 18 VSA) to a designated hospital for
psychiatric treatment (danger to self or others) subsequent to an evaluation by
community mental health agency screener & medical doctor.
Forensic patients are designated when there is criminal justice involvement
and when there are questions concerning competency/sanity of an individual
being arraigned. A screening is requested by a community mental health
agency pursuant to §4815 13 VSA. Numbers represent a point in time count
mid-month.
Emergency Services beds intended to provide crisis intervention, respite, or
hospital diversion that are staffed by and under the supervision of a
designated community mental health agency (DA). Statewide averages are
adjusted to exclude programs on days where there were no updates
submitted to the bed board.
The hospitals designated by the Commissioner of Mental Health for
involuntary psychiatric treatment: Brattleboro Retreat (BR), Central Vermont
Medical Center (CVMC), Fletcher Allen Health Care (FAHC), Rutland Regional
Medical Center (RRMC), Windham Center at Springfield Hospital (WC), and
Vermont Psychiatric Care Hospital (VPCH). Adult Inpatient Units at VPCH,
RRMC - South Wing, and Brattleboro Retreat - Tyler 4.The units designated as
no refusal units: BR - Tyler 4, RRMC - South Wing, VPCH.