monthly network operations report - eurocontrol · nm network operations report – analysis –...
TRANSCRIPT

Analysis - June 2014
Monthly Network Operations Report

NM Network Operations Report – Analysis – June 2014 1
Contents
1. TOTAL TRAFFIC ..................................... .................................................................................. 2
2. ATFM DELAY AND ATTRIBUTIONS ....................... ................................................................. 5
3. EN-ROUTE ATFM DELAYS .............................. ........................................................................ 6
EN-ROUTE ATFM DELAY PER LOCATION ............................................................................................................ 6 EN-ROUTE ATFM DELAY PER DELAY GROUP .................................................................................................... 7 EN-ROUTE ATFM DELAY PER FLIGHT ................................................................................................................. 8 EN-ROUTE ATFM DELAY YEAR-TO-DATE ............................................................................................................ 9
4. AIRPORT/TMA ATFM DELAYS ........................... ................................................................... 10
AIRPORT/TMA ATFM DELAY PER LOCATION .................................................................................................... 10 AIRPORT/TMA ATFM DELAY PER DELAY GROUPS .......................................................................................... 10 AIRPORT/TMA ATFM DELAY PER FLIGHT .......................................................................................................... 11 AIRPORT/TMA ATFM DELAY YEAR-TO-DATE .................................................................................................... 11
5. DAILY EVOLUTION ................................... .............................................................................. 11
6. ALL AIR TRANSPORT DELAYS (SOURCE: CODA) ........... .................................................. 12
7. ATFM SLOT ADHERENCE ............................... ...................................................................... 13
8. SIGNIFICANT EVENTS AND ISSUES ..................... ............................................................... 13
PLANNED EVENTS ................................................................................................................................................ 13 DISRUPTIONS ........................................................................................................................................................ 14
9. NM ADDED VALUE .................................... ............................................................................. 15
RRP DIRECT DELAY SAVINGS ............................................................................................................................ 15 FLIGHTS WITH DELAY > 30’ ................................................................................................................................. 15
The table below shows the colour coding used in the report charts. The grouping of regulation reasons into the categories is explained in the Reporting Assumptions and Descriptions document.
ENROUTE CAPACITY (ATC) AIRPORT CAPACITY (ATC)
ENROUTE STAFFING (ATC) AIRPORT STAFFING (ATC)
ENROUTE DISRUPTIONS (ATC) AIRPORT DISRUPTIONS (ATC)
ENROUTE CAPACITY AIRPORT CAPACITY
ENROUTE DISRUPTIONS AIRPORT DISRUPTIONS
ENROUTE EVENTS AIRPORT EVENTS
ENROUTE WEATHER AIRPORT WEATHER
NOTICE: All figures presented in this report are for the geographical area that is within Network Manager’s responsibility (NM area). See ACC coverage on page 4.

NM Network Operations Report – Analysis – June 2014 2
1. TOTAL TRAFFIC
Traffic increased by 2.4% in June 2014 compared to June 2013. June 2014 saw the highest June traffic level for the last five
years.
The traffic increase of 2.4% is above the high forecast for June 2014. Italy, France and Bulgaria were the new contributors to local traffic1 on the European network in June 2014 with France shifting from 45 fewer daily flights in May to plus 55 daily flights in June. Italy added 90 daily flights and Bulgaria added 30 daily flights to the network. Turkey remained the top contributor to growth and added over 230 daily flights. Traffic in Ukraine continued to fall with 231 fewer daily flights in June or a decrease of 40% in the state’s local traffic compared with June 2013. Re-routings resulting from the situation over Crimea led to ongoing increases of overflights for Bulgaria (+26%), Romania (+21%) and Turkey (+12%) and a decrease of 24% for Moldova compared with June last year. The Low-Cost market segment’s growth was steady with an increase of 7.3% in June 2014 compared with the same period last year. Traditional Scheduled remained positive with a 1% increase. The Charter segment reduced its decrease to -3.1% in June from -7.2% in May. The other two segments, Business Aviation and All-Cargo were down -0.8% and -0.9% respectively.
This graph shows the variation in average daily traffic for the last 12-month period relative to previous 12-months. The average daily traffic from July 2013 to June 2014 was 1.2% higher than the average from July 2012 to June 2013. The trend shows a continuous recovery in traffic that dates back to April 2013.
For more information on EUROCONTROL Forecasts, go to http://www.eurocontrol.int/articles/forecasts
1 Domestic flights, international arrivals/departures; excluding overflights.

NM Network Operations Report – Analysis – June 2014 3
Eight of the top 10 airports recorded positive traffic growth compared to June 2013. The largest traffic increases in June 2014 were at Istanbul Sabiha Gokcen, Tel Aviv Ben Gurion, Athens, Ibiza, Istanbul Ataturk and London Luton airports. The largest decreases in traffic were at Lyon Saint Exupery, Edinburgh, Marseille Provence and Venice airports. Four of the top 10 aircraft operators (Ryanair, Lufthansa, Air France and Air Berlin) had less traffic compared to June 2013. The operators with the highest traffic growth were Germanwings, Aegean Airlines, Wideroe, Vueling, Pegasus, Air Europa, Wizz Air, Norwegian Air Shuttle and Qatar Airways. LOT Polish Airlines, Flybe and Lufthansa recorded the highest traffic reduction compared to June 2013. Turkish Airlines continues to see increases in flights following the growth of its fleet. Changes in domestic operations from Istanbul Sabiha Gokcen with its SunExpress subsidiary operating flights under the THY callsign have also contributed to this increase. The transfer of certain Lufthansa flights to Germanwings and from Olympic to Aegean Airlines accounts for variations seen in these carriers. Pegasus continued to record an increase in flights compared to June 2013 following an increase in fleet size.
N º A D EP A D EP N A M E 201406 % 1 EDDF FRANKFURT M AIN 699 -0,4%2 LFPG PARIS CH DE GAULLE 696 3,3%3 EGLL LONDON/HEATHROW 673 0,6%4 EHAM AM STERDAM /SCHIPHOL 665 2,8%5 LTBA ISTANBUL-ATATURK 618 9,8%6 EDDM M UENCHEN 549 -2,8%7 LEM D M ADRID BARAJAS 502 5,5%8 LIRF ROM E FIUM ICINO 482 4,8%9 LEBL BARCELONA 456 4,4%10 EGKK LONDON/GATWICK 400 2,8%11 EKCH COPENHAGEN KASTRUP 384 3,2%12 LSZH ZURICH 383 3,0%13 LOWW WIEN SCHWECHAT 377 1,9%14 ENGM OSLO/GARDERM OEN 376 4,7%15 LTAI ANTALYA 370 6,0%16 LEPA PALM A DE M ALLORCA 357 4,4%17 EBBR BRUSSELS NATIONAL 348 8,1%18 LFPO PARIS ORLY 343 1,2%19 ESSA STOCKHOLM -ARLANDA 337 8,7%20 EDDL DUESSELDORF 318 -1,9%21 EGCC M ANCHESTER 274 1,9%22 EDDT TEGEL-BERLIN 271 3,0%23 EIDW DUBLIN 270 3,1%24 LTFJ ISTANBUL-SABIHA 266 22,0%25 LSGG GENEVE COINTRIN 259 2,4%26 LIM C M ILANO M ALPENSA 254 2,8%27 LGAV ATHINAI/ELEFTHERIOS VENIZELOS 242 11,5%28 EFHK HELSINKI-VANTAA 240 0,0%29 EGSS LONDON/STANSTED 234 8,8%30 LFM N NICE 230 -1,7%31 LPPT LISBOA 230 8,0%32 EDDH HAM BURG 218 4,8%33 EPWA CHOPINA W WARSZAWIE 215 -2,3%34 LKPR PRAHA RUZYNE 199 -2,5%35 EDDK KOELN-BONN 182 1,7%36 EDDS STUTTGART 181 0,0%37 LEM G M ALAGA 177 4,1%38 EGGW LONDON/LUTON 168 9,1%39 EGPH EDINBURGH 166 -4,1%40 LIM L M ILANO LINATE 165 -1,2%41 LFLL LYON SAINT-EXUPERY 163 -4,1%42 LLBG TEL AVIV/BEN GURION 163 15,6%43 EGBB BIRM INGHAM 152 1,3%44 LFM L M ARSEILLE PROVENCE 146 -3,3%45 ENBR BERGEN/FLESLAND 145 0,0%46 LROP OTOPENI-INTL. 140 0,0%47 LFBO TOULOUSE BLAGNAC 134 0,8%48 LIPZ VENEZIA TESSERA 134 -2,9%49 LEIB IBIZA 133 9,9%50 LHBP FERIHEGY-BUDAPEST 132 6,5%
15216 50,1%T OT A LS and % T OT A L T R A F F ICT o p 50 D eparture A irpo rts with average daily t ra f f i c and percentage co mpared to same perio d o f previo us year
N º IC A O A IR OP ER A T OR 201406 % 1 RYR RYANAIR 1668 -0,4%2 DLH DEUTSCHE LUFTHANSA 1545 -14,9%3 EZY EASYJET 1216 7,1%4 THY TURKISH AIRLINES 1184 10,8%5 AFR AIR FRANCE 1014 -2,3%6 SAS SCANDINAVIAN AIRLINES SYSTEM 921 3,8%7 BAW BRITISH AIRWAYS 708 2,8%8 BER AIR BERLIN, INC. 671 -0,3%9 KLM KLM ROYAL DUTCH AIRL 652 3,7%10 NAX NORWEGIAN AIR SHUTTLE 546 15,2%11 AZA ALITALIA 544 2,3%12 VLG VUELING AIRLINES SA 504 24,4%13 GWI GERM AN WINGS 456 80,2%14 SWR SWISS INTERNATIONAL 415 0,7%15 WIF WIDEROE 373 3,6%16 AUA AUSTRIAN AIRLINES 369 -2,9%17 PGT PEGASUS HAVA TASI. 361 19,5%18 BEE JERSEY EUROPEAN T/A FLYBE 356 -13,4%19 TAP TAP/AIR PORTUGAL 316 1,9%20 WZZ WIZZ AIR 293 17,7%21 AEE AEGEAN AIRLINES 292 65,9%22 AFL AEROFLOT-RUSSIAN 249 -6,7%23 EIN AER LINGUS TEORANTA 225 3,2%24 AEA AIR EUROPA 225 19,1%25 IBE IBERIA 221 3,3%26 TOM THOM SON FLY LTD 218 -7,2%27 BEL BRUSSELS AIRLINES 216 5,4%28 LOT LOT-POLISH AIRLINES 214 -8,2%29 ANE AIR NOSTRUM 213 -0,9%30 EXS JET2.COM 195 11,4%31 RAM ROYAL AIR M AROC 186 10,7%32 TRA TRANSAVIA.COM 167 1,8%33 M ON M ONARCH AIRLINES LTD 163 9,4%34 NJE NETJETS 158 -4,8%35 FIN FINNAIR O/Y 155 5,4%36 DAL DELTA AIR LINES INC. 153 0,0%37 UAL UNITED AIRLINES INC. 153 1,3%38 FCM FINNISH COM M UTER AIRLINES OY(RENAM E)152 -3,8%39 EZS EASY JET SWITZERLAND 150 6,4%40 TSO TRANSAERO AIRLINES 149 2,1%41 UAE EM IRATES 138 -4,8%42 TVS TRAVEL SERVIS 133 3,9%43 BTI AIR BALTIC CORPORAT. 132 -3,7%44 CFG CONDOR FLUGDIENST 132 5,6%45 TCX THOM AS COOK AIT LTD 127 0,0%46 BCS EUROPEAN AIR TRANSP. 123 4,2%47 QTR QATAR AIRWAYS COM P. 122 14,0%48 SXS SUNEXPRESS AIRLINES 118 6,3%49 ISS M ERIDIANA S.P.A. 115 -6,5%50 SHT BAW SHUTTLE 115 0,0%
19221 63,3%
N º IC A O A IR OP ER A T OR 201406 % Unidentified 2884 1,2%
T o p 50 A ir Operato rs with average da ily t ra f f ic and percentage co mpared to same perio d o f previo us year
A verage da ily t ra ff ic and percentage co mpared to sa me perio d o f previo us year fo r a ll f lights where A ir Opera to rs c an' t be ident if ied
T OT A LS and % T OT A L T R A F F IC

NM Network Operations Report – Analysis – June 2014 4
N º A SP ID A SP N A M E 201406 % N º A SP ID A SP N A M E 201406 %1 EBBUACC BRUSSELS CANAC 1725 3,9% 35 LFBBALL BORDEAUX ALL ACC 2722 4,9%
2 EDGGALL LANGEN ACC 3686 -0,5% 36 LFEEACC REIM S U/ACC 2890 5,8%
3 EDM M ACC M UNCHEN ACC 3142 -1,8% 37 LFFFALL PARIS ALL ACC 3484 4,2%
4 EDUUUAC KARLSRUHE UAC 5316 2,5% 38 LFM M ACC M ARSEILLE ACC 3298 0,1%
5 EDWWACC BREM EN ACC 1875 1,5% 39 LFRRACC BREST U/ACC 2973 6,3%
6 EDYYUAC M AASTRICHT UAC 5166 2,7% 40 LGGGACC ATHINAI CONTROL 1732 6,4%
7 EETTACC TALLIN ACC 568 1,8% 41 LGM DACC M AKEDONIA CONTROL 1432 8,7%
8 EFESACC TAM PERE ACC 471 3,7% 42 LHCCACC BUDAPEST ACC 2071 6,3%9 EGGXOCA SHANWICK OACC 1322 4,0% 43 LIBBACC BRINDISI ACC 891 -7,5%
10 EGPXALL SCOTTISH ACC 2683 -3,5% 44 LIM M ACC M ILANO ACC 2534 40,2%
11 EGTTACC LONDON ACC 5806 2,9% 45 LIPPACC PADOVA ACC 2339 2,0%
12 EGTTTC LONDON TM A TC 3883 3,2% 46 LIRRACC ROM A ACC 2532 -18,5%
13 EHAAACC AM STERDAM ACC(245-) 1567 1,9% 47 LJLAACC LJUBLJANA ACC 958 5,7%
14 EIDWACC DUBLIN ACC 600 3,0% 48 LKAAACC PRAGUE ACC 2172 3,0%
15 EISNACC SHANNON ACC 1351 8,7% 49 LM M M ACC M ALTA ACC 334 3,2%
16 EKDKACC COPENHAGEN ACC 1627 -0,5% 50 LOVVACC WIEN ACC 2455 5,9%
17 ENBDACC BODO ACC 625 2,4% 51 LPPCACC LISBOA ACC/UAC 1265 9,1%
18 ENOSACC OSLO ATCC 1072 1,4% 52 LPPOOAC SANTA M ARIA OACC 310 -3,0%
19 ENSVACC STAVANGER ATCC 742 2,1% 53 LRBBACC BUCURESTI ACC 2063 17,9%20 EPWWACC WARSZAWA ACC 2177 -0,2% 54 LSAGACC GENEVA ACC 1917 3,6%
21 ESM M ACC M ALM O ACC 1577 2,6% 55 LSAZACC ZURICH ACC 2277 0,8%
22 ESOSACC STOCKHOLM ACC 1162 4,8% 56 LTAAACC ANKARA ACC 2583 10,1%
23 EVRRACC RIGA ACC 758 3,0% 57 LTBBACC ISTANBUL ACC 2953 12,7%
24 EYVCACC VILNIUS ACC 673 2,6% 58 LUUUACC CHISINAU ACC 216 -18,1%
25 GCCCACC CANARIAS ACC/FIC 708 9,1% 59 LWSSACC SKOPJE ACC 568 26,2%
26 GM M M ACC CASABLANCA ACC 938 8,3% 60 LYBAACC BEOGRADE ACC 1931 4,7%
27 LAAAACC TIRANA ACC 686 -4,1% 61 LZBBACC BRATISLAVA ACC 1405 4,9%
28 LBSRACC SOFIA ACC 2420 24,4% 62 UDDDACC YEREVAN ACC 140 3,6%
29 LCCCACC NICOSIA ACC 934 9,4% 63 UGGGACC TBILISI ACC 290 0,0%30 LDZOACC ZAGREB ACC 1778 5,3% 64 UKBVACC KIEV ACC 813 -3,3%
31 LECBACC BARCELONA ACC 2636 2,9% 65 UKDVACC DNIPROPETROVSK ACC 83 -85,4%
32 LECM ALL M ADRID ALL ACC 2687 6,5% 66 UKLVACC L'VIV ACC 532 -10,3%
33 LECPACC PALM A ACC 1086 5,0% 67 UKOVACC ODESSA ACC 113 -74,0%
34 LECSACC SEVILLA ACC 972 0,3% Traffic in the Ukraine has reduced significantly since February 2014. The Ukrainian ACCs show a similar trend whilst neighbouring ACCs (Sofia and Bucharest) show significant increases. Due to re-sectorisation between Milano and Roma ACCs, Milano traffic increased by 40.2% while Roma decreased by 18.5% compared to June 2013. Turkey continues to be the biggest contributor of traffic growth to the European network.

NM Network Operations Report – Analysis – June 2014 5
2. ATFM DELAY AND ATTRIBUTIONS
Total ATFM delays in June 2014 decreased by 7.5% compared to June 2013; note that both months saw significant delays due to industrial action.
En-route ATFM delays decreased by 8% and airport ATFM delays decreased by 6% compared to June 2013.
ATFM delays over the last 12 months were down significantly except for June 2013 (ATC industrial action), December 2013 (exceptional airport weather) and April/May 2014. The 12-month trend is now at -15%.
En-route disruptions (ATC) (27%), en-route capacity (ATC) (26.7%), airport weather (11.2%) and airport capacity (8.2%) were the main causes of network delay in June.
These are the top 20 delay generating locations for the reporting month with respect to total ATFM delays . Figures are the average daily delays in minutes for the individual locations.
• The French industrial action on 24-26 June generated significant delays in Marseille, Brest, Bordeaux and Paris ACCs. • There were significant delays due to traffic onloading during the 24-26 June industrial action at Karlsruhe, Maastricht, Madrid
ACCs and Tunisia. • Warsaw, Maastricht, Reims and Marseille had significant en-route capacity (ATC) delays. • Maastricht, Langen and Karlsruhe experienced en-route weather delays. • The PSS implemetation at Langen ACC generated delays. • Istanbul Ataturk, Zurich and Frankfurt airports were impacted the most by weather. • There was delay due to environmental constraints at Zurich airport. • Antalya airport experienced radar display problems on several days in June.

NM Network Operations Report – Analysis – June 2014 6
3. EN-ROUTE ATFM DELAYS EN-ROUTE ATFM DELAY PER LOCATION
These are the top 20 en -route delay generating locations for the reporting month with respect to total ATFM delays. Figures are the average daily delays in minutes for the ind ividual locations. The top 20 en-route delay locations generated 68.6% of the monthly total (network) ATFM delay. The top 5 en-route delay locations generated 45.5% of the monthly total (network) ATFM delay.

NM Network Operations Report – Analysis – June 2014 7
EN-ROUTE ATFM DELAY PER DELAY GROUP
En-route delays accounted for 73.7% of all ATFM delays. En-route disruptions delays were recorded in Karlsruhe, Maastricht, Madrid, Tunisia and other ACCs (see section 8) as a direct consequence of strikes. In Ankara delays were due to increased separation on the Iraqi border. En-route staffing (ATC) delays occurred in Warsaw, Athens, Langen and Karlsruhe ACCs. The PSS implementation in Langen continues to generate delay as en-route events.
Warsaw, Maastricht, Reims, and Marseille ACCs recorded the highest en-route capacity (ATC) delays. Reims, Maastricht, Barcelona, Marseille and Karlsruhe ACCs increased significantly compared to the previous month while delays in Nicosia and Brest decreased significantly. Warsaw entered the top 10 with the highest delays. London and Langen also entered the top 10.
En-route Disruptions (ATC) occurred between 24 and 26 June mainly in Marseille, Brest, Bordeaux and Paris ACCs due to the French Industrial action. On the 25 and 26 Brussels also recorded delays due to industrial action.
En-route weather delays occurred in Maastricht, Langen, Karlsruhe, Barcelona and Paris ACCs due to seasonal weather: thunderstorms.
An average of 844 flights per day received an en-route delay of at least 15 mins in June 2014. The corresponding figure for June 2013 was 815 flights. This is a direct impact from the strikes experienced in June 2013 and 2014.

NM Network Operations Report – Analysis – June 2014 8
EN-ROUTE ATFM DELAY PER FLIGHT
These are the top 20 average en -route delay per flight generating locations for the reporting month with respect to total ATFM delays. Figures are the average en-route delay per flight in minutes for the individual locations. The average en-route delay per flight increased significantly compared to the previous month in Marseille and Brest ACCs due to the French strike, in Warsaw ACC due to en-route (ATC) capacity issues and in Maastricht UAC mainly due to en-route capacity (ATC) plus disruptions due to a direct impact from the French strike and thunderstorms activity. Nicosia ACC continued to improve significantly compared to the previous month, the average en-route delay decreased from 0.89 mins/flight in May to 0.49 mins/flight in June 2014.

NM Network Operations Report – Analysis – June 2014 9
EN-ROUTE ATFM DELAY YEAR-TO-DATE
These are the top 20 en -route delay locations for 2014 with respect to the total ATFM delay . Figures are the average daily en -route delay in minutes for the individual locations . The top 20 en-route delay locations generated 60.6% of the total ATFM (network) delay. The top 5 en-route delay locations generated 36.5% of the total ATFM (network) delay.
Reporting month: In June, the average en-route delay per flight in the NM area was 1.26 min/flt, which is above the corresponding monthly guideline* value of 0.79 min/flt.
Year to date: The average en-route delay per flight in the NM area in 2014 to date is 0.60 min/flt which is above the corresponding guideline value of 0.39 min/flt.
An average of 380 flights per day had an ATFM delay of at least 15 minutes during the reported period. The corresponding figure in June 2013 was 297 flights per day. Both periods saw high disruption due to industrial action.
* NM’s calculation that provides the guideline en-route delay (min) requirements to achieve the annual target (0.5 min/flight).
NM Network Operations Report – Analysis – June 2014 10
4. AIRPORT/TMA ATFM DELAYS AIRPORT/TMA ATFM DELAY PER LOCATION
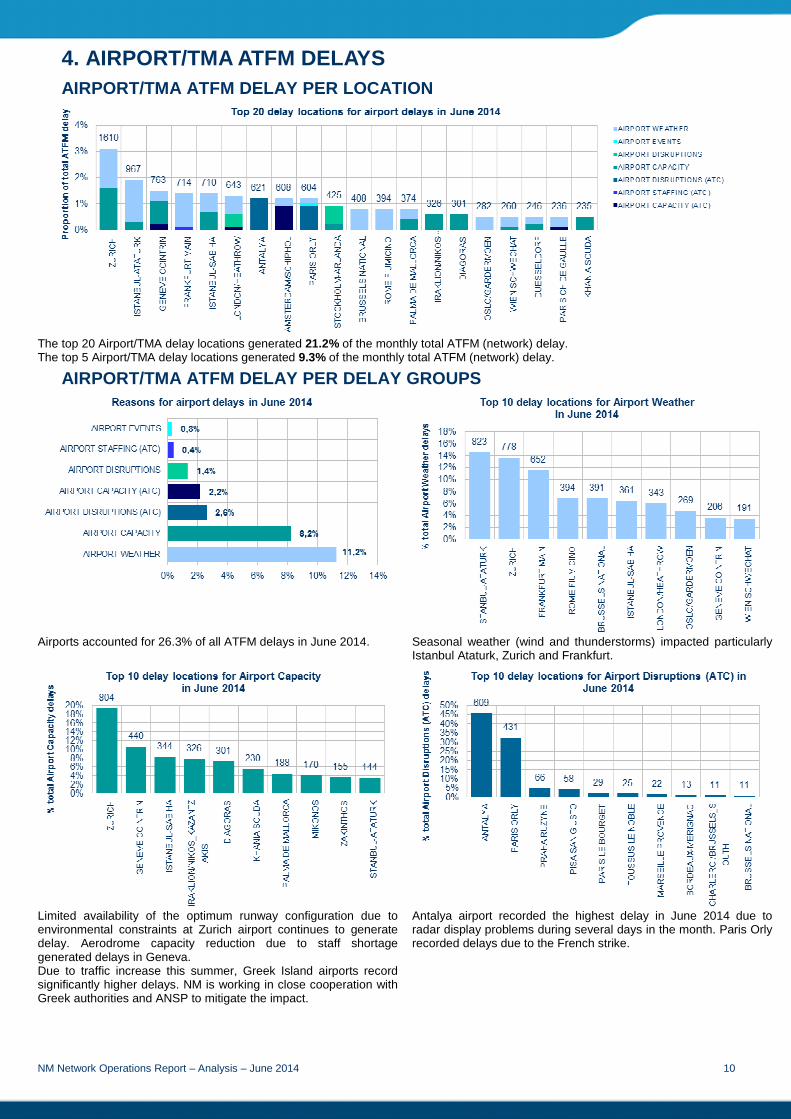
The top 20 Airport/TMA delay locations generated 21.2% of the monthly total ATFM (network) delay. The top 5 Airport/TMA delay locations generated 9.3% of the monthly total ATFM (network) delay.
AIRPORT/TMA ATFM DELAY PER DELAY GROUPS
Airports accounted for 26.3% of all ATFM delays in June 2014. Seasonal weather (wind and thunderstorms) impacted particularly
Istanbul Ataturk, Zurich and Frankfurt.
Limited availability of the optimum runway configuration due to environmental constraints at Zurich airport continues to generate delay. Aerodrome capacity reduction due to staff shortage generated delays in Geneva. Due to traffic increase this summer, Greek Island airports record significantly higher delays. NM is working in close cooperation with Greek authorities and ANSP to mitigate the impact.
Antalya airport recorded the highest delay in June 2014 due to radar display problems during several days in the month. Paris Orly recorded delays due to the French strike.

NM Network Operations Report – Analysis – June 2014 11
AIRPORT/TMA ATFM DELAY PER FLIGHT
Average airport/TMA delay per flight decreased from 0.48 min/flt in June 2013 to 0.44 min/flt in June 2014.
Mikonos, Zurich and Khania Souda (Crete) airports had the highest delay per flight in June 2014. Diagoras (Rhodes), Iraklion and Geneva also recorded significant delay per flight.
AIRPORT/TMA ATFM DELAY YEAR-TO-DATE
The top 20 Airport/TMA delay locations generated 26.9% of the total ATFM (network) delay in 2014. The top 5 Airport/TMA delay locations generated 14.9% of the total ATFM (network) delay in 2014.
5. DAILY EVOLUTION
In June 2014, there w ere three days with an average delay per flight at 2 minutes or above.
On Tuesday 24 June and Wednesday 25 June 73.69% of the delays were attributable to the ATC industrial action in France and Belgium impacting Marseille, Brest, Paris, Bordeaux and Brussels ACCs, as well as Paris Orly, Marseille Provence and a number of other French airports.
Protective measures related to the French ATC industrial action were also applied in Maastricht, Karlsruhe, Madrid, Tunisia, Barcelona, Langen and London ACCs which generated delays.
On Sunday 29 June Marseille, Warsaw, Palma, Reims and Langen ACCs recorded significant en-route capacity (ATC) delays. Palma de Mallorca, Istanbul Sabiha, Diagoras (Rhodes) and Istanbul Ataturk airports generated airport capacity delays. Frankfurt, Vienna, Zurich and Nice airports were affected by airport weather (wind and thunderstorms). There were en-route weather delays in Paris, Bratislava and Barcelona ACCs.

NM Network Operations Report – Analysis – June 2014 12
6. ALL AIR TRANSPORT DELAYS (Source: CODA) This section presents the all air transport delay situation as seen from the airlines by using the data collected by Central Office for Delay Analysis (CODA) from the airlines. Data coverage is 60% of the commercial flights in the ECAC region for May 2014. ATFM delays reported by airlines may be lower than the NM calculated ATFM delays due to difference in methods: ATFM delays of NM are the (flight) planned “delays”; the airlines report the “actual” experienced ATFM delay on departure. For instance, a flight with an ATFM delay may also have a handling delay absorbed within the ATFM delay. For the airline, a part of this delay is the ATFM delay and the rest is the handling delay.
Based on airline data, the average departure delay per flight from “All Causes” was 8.8 minutes per flight, this was an increase of 13% in comparison to 7.8 minutes per flight in May 2013. Within all air transport delays, en-route ATFM delays were 0.4 minutes/flight in May 2014. Primary delays counted for 56% (or 4.9 min/flt ) of which 0.4 min/flight was attributed to en-route ATFM delays, with reactionary delays representing the remaining share of 44% at (3.9 min/flt).
Further analysis of airline data shows that the average en-route ATFM delay was 0.4 minutes per flight. This was slightly lower than the NM reported average en-route ATFM delay of 0.6 minutes per flight.
The percentage of flights subject to long ATFM restrictions (those exceeding 15 & 30 minutes) saw slight increases in May 2014 when compared to May 2013. Flights with restrictions exceeding 15 minutes increased by 0.6 percentage points to 2.4% (the detail shows a split between 0.9% caused by airport arrival and 1.5% by en-route ATFM restrictions). The percentage of flights delayed from all-causes (exceeding 15 minutes) decreased by 1.5 percentage points to 16.0% and those (exceeding 30 minutes) decreased by 2.9 points to 7.2%.

NM Network Operations Report – Analysis – June 2014 13
7. ATFM SLOT ADHERENCE
In June the percentage of late departures increased compared to the previous month and early departures continued to decrease slightly compared to the previous months.
The chart below shows the airports that have more than 300 regulated flights during the month with their average daily number and proportion of regulated flights that departed outside of the Slot Tolerance Window (STW). Any airport above the red line is non-compliant with the threshold (20%). Those airports with a significant number of departures outside the slot tolerance window can reduce network predictability.
8. SIGNIFICANT EVENTS AND ISSUES PLANNED EVENTS
ACCs: • Langen ACC - Implementation of stripless system (PSS) in EBG 03/04 sector families.
Planned: Transition started in April and had been planned for completion on 17 May with the capacity reductions between 10 and 20%. Actual: Transition phase has been extended until the end of June. Delays generated by the project transition phase in June were 12026 minutes, which represented 20% of total delay generated by Langen ACC during the same month. (The project transition generated 22768 min of delay in May).
Airports:
Special events in June:
• Le Mans car race (1992 minutes of delay) • Basel – Arts Festival (Impact: No impact had been anticipated by the airport during the planning stage, but measures
were applied and 1,329 minutes of delay recorded)
Local plans in June:
A number of airports undertook infrastructure and technical system improvement work during June. These improvements either impacted airport operations or were successfully implemented with no or minor negative impact. Completed

NM Network Operations Report – Analysis – June 2014 14
• Maneuvering area (runway and/or taxiways) improvements were completed in Amsterdam Schiphol, Budapest, Frankfurt and Helsinki;
• Terminal area improvements were completed in Budapest and London Heathrow; • Re-opening of Bergamo airport after finalizing the third phase of runway maintenance. Milano Malpensa back to regular
traffic level after the increase due to the traffic switch from Bergamo. On going
• Maneuvering area (runway, taxiways and/or apron) improvements on going in Barcelona, Bologna, Dublin, Frankfurt, Gran Canaria, Helsinki, Katowice, Copenhagen, Krakow Balice, London Heathrow, Munich, Nurnberg, Palma de Mallorca, Paris CDG, Stuttgart, Valencia, Warszawa and Zurich;
• Terminal building(s) improvements in Gran Canaria, Krakow Balice and Munich; • Minimum Departure intervals reduction in Dublin; • ILS maintenance in Valencia; • New runway construction on going in Katowice; • Closure of Bergamo airport until the 2nd June due to runway maintenance. Re-opened in June with fourth phase of
maintenance on-going (no LVP operations allowed in June); • Runway closure from 1900 on 25/06 until 0900 on 26/06 preceding construction and maintenance works in Oslo
Gardermoen; minor delays experienced; CATII and CATIII not available for that runway; • Capacity limitations in Stockholm due to runway maintenance; high delays recorded due to closure of runway in
combination with adverse weather.
DISRUPTIONS ATC Industrial Action There was ATC industrial over the period 24-26 June in France and Belgium. The French action lasted for the whole period and had a significant impact on network operations. The Belgian action was three periods of two hours or less. Around 2500-3000 flights were cancelled or did not fly due to the strikes. There were 401,575 minutes of delay due directly to the strikes and 98,709 minutes of indirect delay due to onloading of surrounding airspace - half a million minutes of delay in total.
ACC Direct delays (mins)
Marseille 197091
Brest 145698
Bordeaux 35721
Paris 18820
Reims 363
Total (France) 397693
Belgium 3882
Total strikes 401575
ACC Indirect delays (mins)
Karlsruhe 21542
Maastricht 29607
Madrid 19601
Tunisia 15033
London 6308
Langen 4628
Algeria 703
Barcelona 710
Manchester 577
Total 98709
Over the strike period a total of at least 3672 flights rerouted leading to an extra 348,215 miles being across the network.
Technical � Antalya – Radar disruption (Impact: Delays recorded on 7 and 8 June: 3,289 and 1,507 minutes respectively) � Frankfurt – Power failure on 10 June (Impact: Regulation which was cancelled after 20 minutes) � Pisa – Weather and radar maintenance issues on 30 June
Other � The transfer of responsibility from Simferopol ACC to Dnipropetrovsk and Odessa ACCs on 11 March 2014, and the
route closures on 28 March 2014 continue to affect the traffic in the region. Following an ICAO State letter (ref EUR/NAT 14-0243.TEC (FOL/CUP), issued 2 April 2014) NM issued an advisory bulletin on 2 April 2014 advising airspace users to avoid the airspace and circumnavigate the Simferopol FIR. See the NM NOP Network Operations Portal for the latest information.
� London Heathrow – Medical emergency landing on 16 June (Impact: Arrival regulation). � Zurich –Air show in vicinity of airport on 20 June – airspace management (Impact: 1,788 minutes of delay) � Delays occurred on the Turkish/Iraqi border (NINVA) due to increased traffic demand and the need to provide increased
longitudinal separation in Iraqi airspace.

NM Network Operations Report – Analysis – June 2014 15
9. NM ADDED VALUE RRP DIRECT DELAY SAVINGS
In June 2014, NM proposed alternative routes to an average of 29 flights per day of which 16 were accepted. This saved 546 minutes of daily delay at a cost of 171 extra nautical miles. This graph shows the actual daily averages for the previous 13 months period.
FLIGHTS WITH DELAY > 30’
The number of flights that had more than 30 mins of ATFM delay decreased from 436 flts/day in June 2013 to 400 flts/day in June 2014. 71.3% of flights with more than 30 mins of ATFM delay in June 2014 were en-route and 28.8% were airport. Both June 2013 and June 2014 were impacted by industrial action.
@ 2014 The European Organisation for the Safety of Air Navigation (EUROCONTROL) This document is published by EUROCONTROL in the interests of exchange of information. It may be copied in whole or in part, providing that the copyright notice and disclaimer are included. The information contained in the document may not be modified without prior written permission from EUROCONTROL. EUROCONTROL makes no warranty, either implied or express, for the information contained in this document, neither does it assume any legal liability or responsibility for the accuracy, completeness or usefulness of this information. Operational Analysis & Reporting, Performance, Forecasts and Relations (PFR) Unit, Network Manager Directorate (NMD), EUROCONTROL, 96 Rue de la Fusée, B - 1130 Brussels Telephone: +32 (0) 2 - 729 1155 Fax: +32 (0) 2 - 729 9189 mailto:[email protected] http://www.eurocontrol.int/articles/network-operations-monitoring-and-reporting