monthly report october 2016 - manufacturingchampions.in · monthly report –october 2016...
TRANSCRIPT

1
Summary growth trends for the month of October 2016
Overall, October registered a growth of ~5% for the Indian industry, slowing in pace post its
high growth months of August and September
All regions witnessed a sluggish growth: North saw the slowest growth at only 4% and
South saw a sharp difference in volume and value growth at 5% and 8% respectively. East
and West grew at the same pace of 5% through October
Inflation for Oct 2016 (difference between value and volume growth) seemed marginal across
geographies
Consumer durables (~17%), commercial vehicles (~12%), textile and apparels (10%) emerged
as winners in October; Two wheelers (9%), engineering products (7%) and passenger
vehicles (~5%) showed moderate growth, while auto components (~1%) and building
materials (~1%) witnessed relatively weak growth
1. Not all respondents filled in regional growth numbers. Average of regional growths therefore, may not coincide with national average. The growth numbers reported are on an year-on-year basis. Inflation reported above is the value over volume growth based on the survey results.Source: CII BCG Growth Index Survey; Industry association data on automotive sales

2
Survey Results

3
Survey results: October 2016 performance
VolumeValue
0
4
8
12
Oct’16
5%5%
Sep ’16
8%8%
Aug ’16
8%9%
Jul’16
4%6%
YoY growth %
Jun’16
8%9%
May’16
6%7%
Summary – all respondents Regional growth – All respondents1
Industry growth comparison
Value growth (%)
Peer growth comparison
-20
-15
-10
-50
5
10
15
20
20151050-5-10-15-20
Volume growth (%)
Value growth (%)
-5.0
-2.5
0.0
2.5
5.0
7.5
10.0
12.5
0-2-4-6 18161412108642
Two WheelersEngineering
ProductsBuilding
Products
Auto components
All industry average All industry average
West:
5% (6%)
South:
8%
(5%)
North:
4% (3%)
East:
5% (5%)
Volume growth (%)
1. Not all respondents filled in regional growth numbers. Average of regional growths therefore, may not coincide with national average. The growth numbers reported are on an year-on-year basisNote: Building materials (BM) industry refers to cement, cementitious products, paints, tiles, roofing, scaffolding. Industry average is displayed only when there are 3+ responses per industry. Other industries where responses were received include: consumer durables, Steel, chemicals, plastics, logistics, packaging, Consulting services, Financial services. Regional averages may not fully align with national average because of different regional exposures of respondent industries. All averages are 'simple averages' (i.e. not weighted by size of company). CV – Commercial vehicles, PV –Passenger vehicles, Auto Comp – Auto Components, Engg prod & services – Engineering products and services, Build. mater. – Building Materials, MHE – Material Handling EquipmentSource: CII BCG Growth Index Survey; Industry association data on automotive sales
Value
growth yoy
Volume
growth yoy
Region
xx:
xx% (yy%)

4
Building materials witnessed sharp fall in overall
growth, deepest in North and West
Peer growth comparison
Value growth (%)All industry average
-16
-12
-8
-4
0
4
8
12
16
20
-16 -12 -8 -4 0 4 8 12 16 20
Volume growth (%)
• Building materials witnessed a de-growth in North and growth in
West fell to 2%. Overall, the industry grew <1% in revenue
• South re-gained it's position as the leading market for building
growth, maintaining a steady rate of 9%
• Sentiments from survey respondents:
<500 cr
Regional growth – All respondents1
West:
2% (5%)
South:
9%
(7%)
North:
-0.5% (-0.5%)
East:
3% (5%)
1. Not all respondents filled in regional growth numbers. Average of regional growths therefore, may not coincide with national average. The growth numbers reported are on an year-on-year basis. Building materials include cement, cementitious products, paints, tiles, roofing, scaffolding , and glass. No. of "visible" data points on the graph is less than the number of respondents due to overlaps. Source: CII BCG Growth Index Survey, CMIE, Projectstoday
Value
growth yoy
Volume
growth yoy
Region
xx:
xx% (yy%)"Markets and demand seem to be on the upswing post a good
monsoon. There was a dip in sales on account of Dussera and
Diwali holiday's. Across various part of the country there were
nearly 7-8 holidays, despite which there was growth."
- Mr. Rahul Chopra, Sr. VP and Head Roofing, Everest
Industries Ltd.

5
Material Handling Equipment witnessed growth at
6% across India with strongest growth in East
Regional growth – All respondents1
West:
3% (6%)
South:
4%
(0%)
North:
3% (-4%)
East:
10% (9%)
Peer growth comparison
Value growth (%)
-16
-12
-8
-4
0
4
8
12
16
-4 0 4 8 12 16 20
Volume growth (%)
• Material handling witnessed revenue growth of 6% and
volume growth of 4%
• With the demonetization of notes industries like
infrastructure, consumer durable, auto and real estate is
likely to feel the most heat. This might be layered with the
fresh uncertainty once there is more clarity on GST
• Sentiment of respondents:
< 500 cr
1. Not all respondents filled in regional growth numbers. Average of regional growths therefore, may not coincide with national average. 2. Capacity addition and distribution lines data is for Jul 2016. 3. Export rise is on YoY for Apr –Aug period. No. of "visible" data points on the graph is less than the number of respondents due to overlaps. The growth numbers reported are on an year-on-year basis. MHE – Material handling equipments. Source: CII BCG Growth Index Survey
Value
growth yoy
Volume
growth yoy
Region
xx:
xx% (yy%)
All industry average
"Though there are project enquiries being released,
movement is slow" – Mr. Pramod M. Pophale, GM Sales,
Josts Engineering Company Limited

6
Engineering products registered healthy growth at
7%, with strongest growth in South
Regional growth – All respondents1
West:
6% (8%)
South:
9%
(5%)
North:
5% (4%)
East:
8% (5%)
Peer growth comparison
Value growth (%)
-16
-12
-8
-4
0
4
8
12
16
20
-4 0 4 8 12 16 20
Volume growth (%)
• Sector slowed slightly over October with growth at 7% as
compared to 10% in September and August
• External trade data for October shows exports rise
almost 10% and imports increase 8%; gold imports up
108%, YoY
• Sentiments of survey respondents:
< 500 cr
1. Not all respondents filled in regional growth numbers. Average of regional growths therefore, may not coincide with national average. The growth numbers reported are on an year-on-year basis. MHE – Material handling equipments. Source: CII BCG Growth Index Survey
Value
growth yoy
Volume
growth yoy
Region
xx:
xx% (yy%)
All industry average
"Positive sentiment but still missing GCF growth esp
Private capex . Rural consumption (is) seeing slow pickup
but still not strong .Govt capex and consumption in urban
(areas is) currently driving growth. Manufacturing growth is
still visible enough to confirm growth is back" – Mr.
Ravichandran, President, Danfoss

7
Automotive components witnessed wide variance in
growth across companies and across regions
Regional growth – All respondents1
West:
-2.5% (2%)
South:
1%
(2%)
North:
0% (2%)
East:
-3.5% (3%)
Value growth (%)All industry average
-8
-4
0
4
8
12
16
-16 -12 -8 -4 0 4 8 12 16
Volume growth (%) < 500 cr
Peer growth comparison
1. Not all respondents filled in regional growth numbers. Average of regional growths therefore, may not coincide with national average. The growth numbers reported are on an year-on-year basis. No. of "visible" data points on the graph is less than the number of respondents due to overlaps. Source: CII BCG Growth Index Survey
Value
growth yoy
Volume
growth yoy
Region
xx:
xx% (yy%)
• Highest growth in revenue witness at ~7.5% while the
slowest growth at -12.5%. Volume growth ranged
between -7.5% to 12.5%.
• 2 Wheelers cashed in on the festive seasons as Royal
Enfield has registered a sales growth of 32% while India
Yamaha Motor has announced 22% rise in sales
• Sales of PV varied by manufacturer as TATA motors
(32%), Maruti Suzuki (2.2%) and Hyundai (6.4%) saw a
growth in sales, Honda (-23%), Toyota Kirloskar (-6%)
and Ford (-25%) saw a sharp dip in sales through
October 2016

8
Industry Deep Dives
9
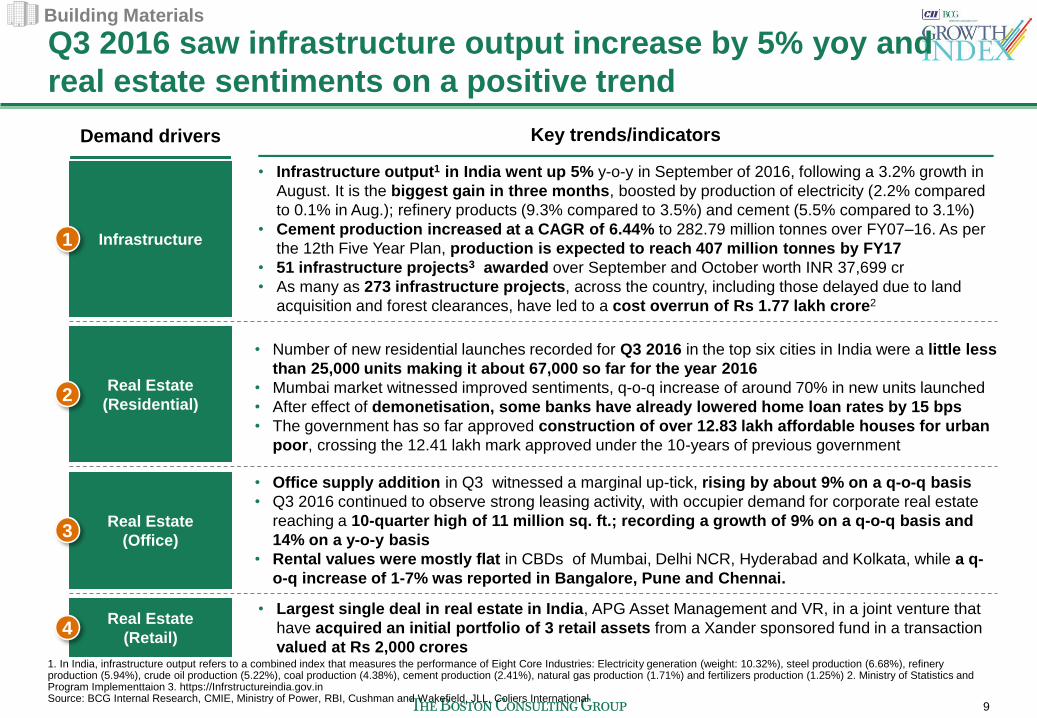
Q3 2016 saw infrastructure output increase by 5% yoy and
real estate sentiments on a positive trend
Demand drivers Key trends/indicators
Infrastructure
• Infrastructure output1 in India went up 5% y-o-y in September of 2016, following a 3.2% growth in
August. It is the biggest gain in three months, boosted by production of electricity (2.2% compared
to 0.1% in Aug.); refinery products (9.3% compared to 3.5%) and cement (5.5% compared to 3.1%)
• Cement production increased at a CAGR of 6.44% to 282.79 million tonnes over FY07–16. As per
the 12th Five Year Plan, production is expected to reach 407 million tonnes by FY17
• 51 infrastructure projects3 awarded over September and October worth INR 37,699 cr
• As many as 273 infrastructure projects, across the country, including those delayed due to land
acquisition and forest clearances, have led to a cost overrun of Rs 1.77 lakh crore2
Real Estate
(Residential)
• Number of new residential launches recorded for Q3 2016 in the top six cities in India were a little less
than 25,000 units making it about 67,000 so far for the year 2016
• Mumbai market witnessed improved sentiments, q-o-q increase of around 70% in new units launched
• After effect of demonetisation, some banks have already lowered home loan rates by 15 bps
• The government has so far approved construction of over 12.83 lakh affordable houses for urban
poor, crossing the 12.41 lakh mark approved under the 10-years of previous government
Real Estate
(Office)
• Office supply addition in Q3 witnessed a marginal up-tick, rising by about 9% on a q-o-q basis
• Q3 2016 continued to observe strong leasing activity, with occupier demand for corporate real estate
reaching a 10-quarter high of 11 million sq. ft.; recording a growth of 9% on a q-o-q basis and
14% on a y-o-y basis
• Rental values were mostly flat in CBDs of Mumbai, Delhi NCR, Hyderabad and Kolkata, while a q-
o-q increase of 1-7% was reported in Bangalore, Pune and Chennai.
1
2
3
Real Estate
(Retail)
• Largest single deal in real estate in India, APG Asset Management and VR, in a joint venture that
have acquired an initial portfolio of 3 retail assets from a Xander sponsored fund in a transaction
valued at Rs 2,000 crores4
1. In India, infrastructure output refers to a combined index that measures the performance of Eight Core Industries: Electricity generation (weight: 10.32%), steel production (6.68%), refinery production (5.94%), crude oil production (5.22%), coal production (4.38%), cement production (2.41%), natural gas production (1.71%) and fertilizers production (1.25%) 2. Ministry of Statistics and Program Implementtaion 3. https://Infrstructureindia.gov.inSource: BCG Internal Research, CMIE, Ministry of Power, RBI, Cushman and Wakefield, JLL, Coliers International
Building Materials

10
Construction sector going through a lull phase, though
projected to catch speed in next 4-6 quarters
0
1,000
2,000
3,000
0
2
4
6
8
10
INR Billion Percentage of Total Value Added
Q2’
17E
Q1
’17
Q4
’16
Q3
’16
Q2
’16
Q1
’16
Q4
’15
Q3
’15
Q2
’15
Q1
’15
Q4
’14
Q3
’14
Q2
’14
Q1
’14
+12%+5%
+6% +2%
Q4’
18E
Q3’
18E
Q2’
18E
Q1’
18E
Q4’
17E
Q3’
17E
Note: Data for Q2'17 onwards is projections based on growth rate for "Construction, Value-added output, real LCU" estimated by Oxford EconomicsSource: RBI, Oxford Economics, CMIE
Share in total value added has been decreasing since
Q2'15 while GFCF is consecutively fell for three quarters
Construction GDP showed flat growth Capital formation growth is
-5
0
5
10
15
Jan-16Jan-15Jan-14Jan-13Jan-12
GFCF Growth (YoY)
Building Materials
Projections

11
Credit deployment in infrastructure and construction
sector remains flat
5,992 6,045 5,799 5,382 5,386 5,288 5,245 5,217 5,178
1,789 1,7941,775
1,756 1,827 1,840 1,835 1,603 1,640
1,165 1,1661,161
1,112 1,109 1,102 1,1381,038 1,044
937 939913
941 951 910 883840 851
739 746745
787 766 755 758719 725
0
3,000
6,000
9,000
12,000
Apr-16Mar-16Feb-16
INR Bn
Jul-16May-16 Aug-16Jan-16 Jun-16
-16%
Sep-16
TelecomConstruction Other Infrastructure PowerRoads
Note: Includes repayments as wellSource: RBI
Infrastructure
Other
Construction
Building Materials
12
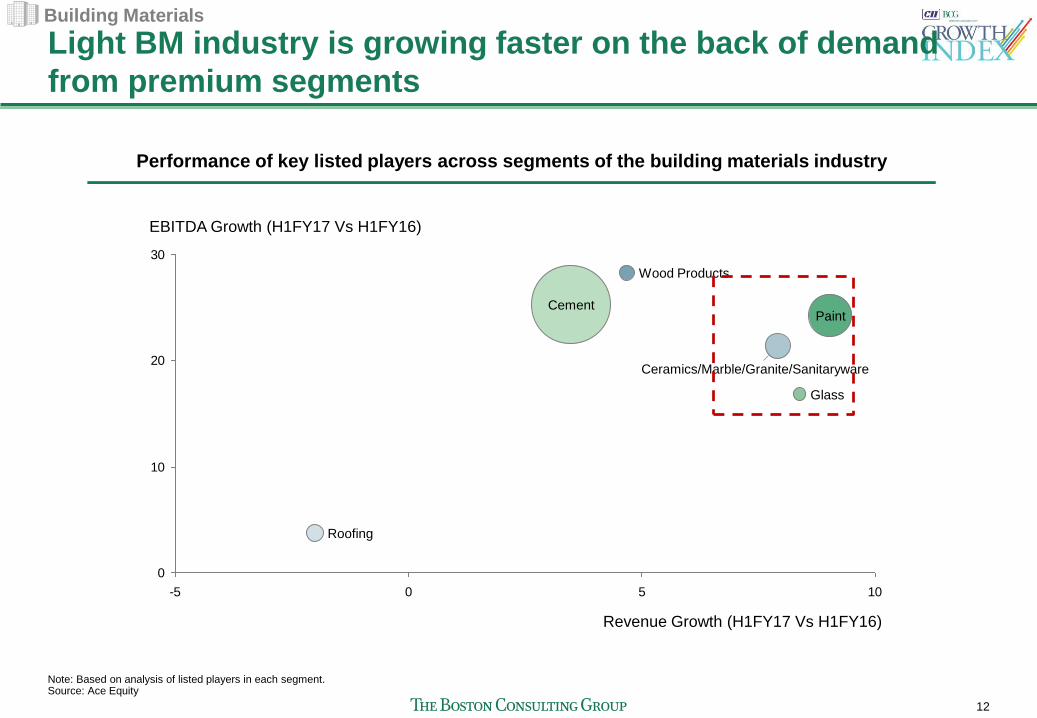
Light BM industry is growing faster on the back of demand
from premium segments
0
10
20
30
-5 0 5 10
Paint
Wood Products
Cement
Glass
EBITDA Growth (H1FY17 Vs H1FY16)
Roofing
Revenue Growth (H1FY17 Vs H1FY16)
Ceramics/Marble/Granite/Sanitaryware
Note: Based on analysis of listed players in each segment.Source: Ace Equity
Building Materials
Performance of key listed players across segments of the building materials industry
13
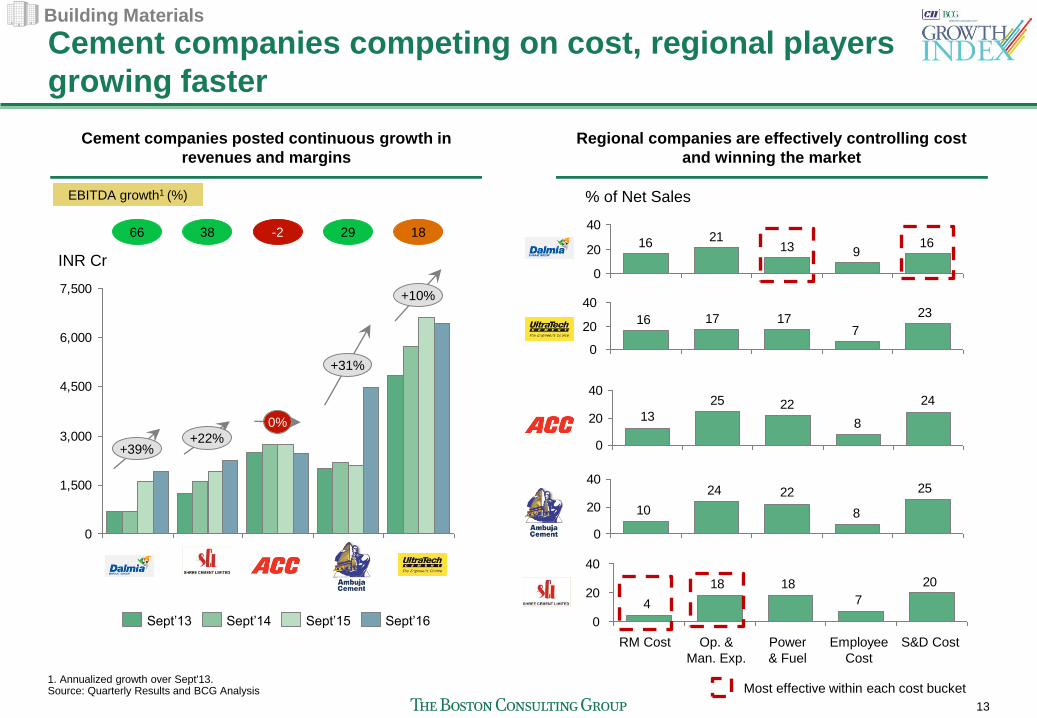
Cement companies competing on cost, regional players
growing faster
0
1,500
3,000
4,500
6,000
7,500
INR Cr
+39%+22%
+31%
+10%
0%
Sept’13 Sept’14 Sept’16Sept’15
1. Annualized growth over Sept'13. Source: Quarterly Results and BCG Analysis
Cement companies posted continuous growth in
revenues and margins
66 38 -2 1829
Regional companies are effectively controlling cost
and winning the market
16913
2116
0
20
40
% of Net Sales
23
7171716
0
20
40
24
8
2225
13
0
20
40
25
8
2224
10
0
20
40
20
7
1818
4
0
20
40
RM Cost Employee
Cost
S&D CostOp. &
Man. Exp.
Power
& Fuel
EBITDA growth1 (%)
Building Materials
Most effective within each cost bucket

14
Paint companies generated high EBITDA but sales
remained under pressure
4,000
3,500
1,000
500
0
INR Cr
+6%
+6%+9%
+6%
-5%
Sept’16Sept’15Sept’14Sept’13
1. Annualized growth over Sept'13.Source: Quarterly Results and BCG Analysis
Paint companies have shown subdued sales growth
but higher EBITDA
EBITDA growth1 (%)
13 21 1235
Cost structure is almost same for all leading players,
Nerolac effectively controls non-RM cost
818
56
0
50
100
% of Net Sales
722
56
0
50
100
518
57
0
50
100
1026
56
0
50
100
-8
816
57
0
50
100
Employee CostOp. & Man. Exp.RM Cost
Building Materials
Most effective within each cost bucket

15
Roofing companies benefitted by higher demand and
increased focus on cost control
0
100
200
300
+3%-3%
INR Cr
+27% +24%
-21%
Sept’16Sept’15Sept’14Sept’13
Note: Sept'16 data is not available for Ramco Ind, hence, taken June'161. Annualized growth over Sept'13.Source: Quarterly Results and BCG Analysis
De-growth for some over H1 FY 17 while 2 of the top 5
firms witnessed >20% growth in the same period
-12 48 24 6516
Cost control is key in a hyper competitive market, RM
costs almost 50% of total cost base for most
1538
51
0
50
100
% of Net Sales
142651
0
50
100
824
60
0
25
50
75
720
54
0
20
40
60
9
3444
0
20
40
60
Employee CostOp. & Man. Exp.RM Cost
EBITDA growth1 (%)
Building Materials
Most effective within each cost bucket

16
Automotive industry continued to grow on the account
of new models and festive season
• PV industry grew by ~4.5% with auto
makers resorting to inventory
correction after pushing stocks in the
previous month ahead of festive
season
• Maruti's UV segment witnessed a
growth of 90.9% YoY (down 2.3%
MoM), supported by newly launched
Brezza, S-Cross and Ertiga upgrade
• Tata's volumes grew on back of
robust performance by Tiago
• CV segment touched double digit
growth (11.9% YoY)
• Tata's domestic M&HCV sales
Domestic volumes ended the four-
month losing streak, growing 9%
YoY in October
• Ashok Leyland has posted 36%
growth YoY in MHC&V segment on
a lower base of Oct-15 due to pre-
buying in Aug/Sep-15 (driven by
change in emission norms from Oct-
15)
Value growth (%)All industry average
-40
-20
0
20
40
60
80
-40 -20 0 20 40 60 80
Volume growth (%)
Value growth (%)All industry average
-10
0
10
20
30
40
200 4-4 128 16 24 28 32 36
Volume growth (%)
Value growth (%)All industry average
-75
-50
-25
0
25
50
75
100
125
0-75 -50 -25 25 50 75 100 125
Volume growth (%)
• Festive season fuelled the growth of
2 wheeler segment – grew by 9%
• Piaggio's sales doubled on YoY
basis on a lower base of 2,800 units
in Oct-15
• Royal Enfield continued to grow at
the rate of 30%+ on YoY basis
1. Not all respondents filled in regional growth numbers. Average of regional growths therefore, may not coincide with national average. The growth numbers reported are on an year-on-year basis. Revenue size of the companies not represented in the graph Source: CII BCG Growth Index Survey, Industry association data on automotive sales
Passenger vehicle (PV) Commercial vehicle (CV) 2-wheelers
Automobile and Auto Components

17
Premium and Mini passenger vehicle segments drive
growth in the sector
SegmentSegment Size &
Growth (FY 2017)Key Players and Market shares Key trends
Mini
Domestic Sales
Growth
338K
14%
Maruti
Hyundai
Renault
71%
9%
19%
• Maruti lost 14% market share; Alto and Wagon R sales down by 9.8%
• Renault gained 17% market share with its new entrant Kwid
Compact
Domestic Sales
Growth
732K
5%
Maruti
Hyundai
Tata Motors
Honda
45%
27%
10%
5%
• Sales across manufacturers remain consistent since FY 16
• Honda's market share dropped by 4% as its new hatchbacks, Jazz, Brio
and Amaze failed to impress the markets
Mid-size
Domestic Sales
Growth
96K
-10%
Maruti
Hyundai
Renault
Honda
40%
11%
5%
35%
• Maruti gained 12% market shared since FY 16
• Hyundai and Toyota maintained their market share with only marginal
movement
• Honda's share reduced by 8% from 43% to 35% in FY 17
Executive
Domestic Sales
Growth
7.8K
-21%
Toyota
Hyundai
GM
Volkswagen
Skoda
41%
15%
7%
10%
19%
• Toyota Corolla leads the market with 41% steady market share since FY 16
• Hyundai's Elantra maintains its market share at 15%
• GM sees 3% gain in market share through its Optra and Cruz models
• Volkswagen's Jetta loses 4% market share over the recent controversies
• Skoda's Laura and Octavia help gain 2% market share in FY 17
PremiumDomestic Sales
Growth
2.2K
58%
Skoda
Toyota
57%
39%
• Skoda gained 13% market share as sales for Superb doubles since FY 16
• Toyota lost 17% market share primarily due to drop in Camry sales
Note: YOY Growth is over FY 16Source: CRISIL Reports, SIAM, BCG analysis
Automobile and Auto Components
18
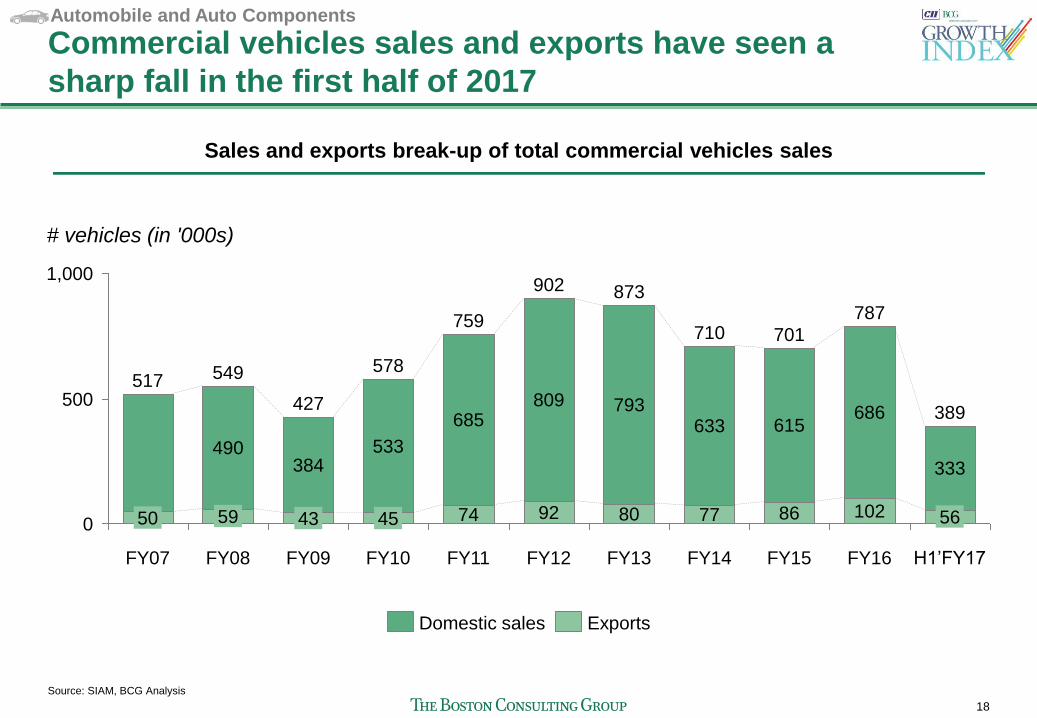
Commercial vehicles sales and exports have seen a
sharp fall in the first half of 2017
0
1,000
500
# vehicles (in '000s)
56
FY16
787
102
686
FY15
701
86
615
FY14
710
77
633
FY13
873
80
793
FY12
902
92
809
FY11
759
74
685
FY10
578
45
533
FY09
427
43
384
FY08
549
59
490
FY07
517
50
333
H1’FY17
389
ExportsDomestic sales
Sales and exports break-up of total commercial vehicles sales
Source: SIAM, BCG Analysis
Automobile and Auto Components

19
Commercial vehicle sales
Overall economic indicators: October 2016 review
Passenger vehicle sales
20
40
0
80
60
'000
Oct-
16
66
+21%
Sep-1
6
62
Aug-1
6
53
Jul-16
52
Jun-1
6
56
May-
16
Jan-1
6
62
Dec-1
5
57
Nov-1
5
59
Oct-
15
59
Sep-1
5
Mar-
16
Aug-1
5
52
Jul-15
52
54
80
Apr-
16
57
+6%
Feb-1
6
62
63
0
200
50
100
150
250
300
260
Jun-1
6
223
May-
16
232
Apr-
16
242
Mar-
16
281
Feb-1
6
234
Jan-1
6
232
Dec-1
5
231
Nov-1
5
252
Oct-
15
269
Sep-1
5
232
Aug-1
5
'000
Jul-15
222
Oct-
16
+17%
Sep-1
6
257 278
Aug-1
6
+1%
259
Jul-16
222
Latest
month
Previous
month
Growth Indices
IIP (%)7
(y-o-y)
Steel production (Mn Tn)1
CV Auto vol growth8 (%)
(y-o-y)
Cement production (Mn Tn)1
Energy req growth1 (%)
(y-o-y)
PV Auto vol growth8 (%)
(y-o-y)
0.7
22.6
4.0
11.9
7.8
4.5
(0.7)
22.3
1.0
1.5
8.6
16.3
Select industry metrics
Economy statistics
FII flows (US$ Mn)3
FDI flows (US$ Mn)4
Latest
month
Previous
month
NRI deposits (US$ Bn)2
Forex reserves (US$ Bn)3
Currency competitiveness6
Balance of payment measures
(644)
4,743
130
367
66.6
China GDP growth est. (%)5 6.7 6.7Oil imports growth3 (%)1
(y-o-y) (8.5)3.9
Inflation – WPI (%)1 3.39 3.57Non-oil imports growth3 (%)1
(y-o-y) (14.9)(5.3)
1,567
4,338
129
370
66.7
BSE Sensex6 27,930 27,866 Trade deficit (US$ Bn) 3 (7.7)(8.3)
India GDP growth est. (%)5 7.1 7.9Exports growth3 (%)1
(y-o-y)1.24.7
Capital account
Current account
*Not comparable as one of the data 1. As of Sept and Aug 2. Total outstanding values as of Sept and Aug 3. For Aug and July. Includes only equity flows. 4. As of end Aug and Jul 5. Average of GDP estimates for FY16-17 for China and India made by leading international financial institutions in Sep & Aug 6.As in Sep & Aug 7. As of Sept and Aug 8. As of Oct and Sept Note: PV and CV refer to passenger and commercial vehicles resp. Source: RBI, Thomson One, Ministry of Finance monthly Report, Capitaline, EIS, BCG analysis, Press Search.
Thank you
bcg.com | bcgperspectives.com