moog new tb117
TRANSCRIPT

7/30/2019 Moog New Tb117
http://slidepdf.com/reader/full/moog-new-tb117 1/24
SPECIFICATION STANDARDS
FOR ELECTROHYDRAULIC FLOW CONTROL SERVOVALVESWILLIAM J . THAYER
Proposed to the AIEE Subcommittee
on Component Specifications, J uly 1959 Revised J une 1962.
1.0 SCOPE
This report proposes standards for the specification of electrohydraulicflow control servovalves. These recommendations were initiallycompiled and submitted to the AIEE Subcommittee on ComponentSpecifications in J uly 1959. Significant progress towardsstandardization of servovalve terminology and specifications was madeduring the early 1960's by the Servovalve Panel of the A-6DSubcommittee of the SAE. Accordingly, the nomenclature and
definitions contained here have been revised to reflect the SAErecommendations.*
Flow control servovalves are, by far, the most widely used controlmeans for electrohydraulic servomechanisms. Other basic valve types,such as pressure control, pressure feedback flow control and timemodulated input valves, are used for specialized control applications.However it is felt that the extension of this standard (at this time) tocover other type servovalves would make the result unreasonably
In general the recommended specifications tell what parameters aresignificant for evaluating a servovalve, rather than stating specificnumerical requirements. By this approach valve manufacturers are leftreasonable design flexibility to permit and encourage optimum designsfor specific applications. Certainly the physical and performancecharacteristics dictated by different systems and different environmentsrequire a diversity of design emphasis. It is well-recognized that certain
valve characteristics can often be improved, but usually at the expenseof others (including cost).
The emphasis in this proposed standard in on how a valve should bespecified, and on how the performance of a valve should be measuredto achieve consistent and meaningful data. Necessary production teststo insure reasonable conformance to design specifications vary with therequirements of the end application. Also, continuous improvements inthe uniformity of production techniques may lead to fewer production
TECHNICAL BULLETIN 117

7/30/2019 Moog New Tb117
http://slidepdf.com/reader/full/moog-new-tb117 2/24
2.0 ABBREVIATIONS
ac alternating currentAR amplitude ratiocis cubic inches per seconddb decibelsdc direct currentdeg degreesgpm gallons per minuteHz Hertz (cycles per second)hp horsepowerma milliamperesmw milliwattsPA phase anglepsi pounds per square inch
3.0 DEFINITIONS
3.1 General Terminology
3.1.1 Closed- Loop Control System -An automatic control system inwhich the system input is compared with a measurement of the systemoutput, and the resultant error signal used to drive the system towardsthe desired output.
3.1.2 Servomechanism - A continuously acting, bidirectionalclosed-loop control system.
3.1.3 Servovalve - A device used to produce hydraulic control in aservomechanism.
3.1.4 Electrohydraulic Servovalve - A servovalve which produceshydraulic control in response to electrical signal inputs; sometimescalled a transfer valve*.
3.1.5 Electrohydraulic Flow Control Servovalve - A servovalvedesigned to produce hydraulic flow output proportional to electricalcurrent input.
3.2 Valve Nomenclature
3.2.1 Hydraulic Ampli fier -A fluid valving device which acts as a power
amplifier, such as a sliding spool, or a nozzle flapper, or a jet pipe withreceivers.
3.2.2 Stage - The portion of a servovalve which includes a hydraulicamplifier. Servovalves may be single stage, two stage, three stage, etc.
3.2.3 Output Stage -The final stage of hydraulic amplification used in aservovalve, usually a sliding spool.
3.2.4 Port -A fluid connection to the servovalve; for example, a supplyport, a return port, or control port (sometimes called loadport* oroutputport* or strut port*).
3.2.5 Three-Way Valve - A multi-orifice fluid control element withsupply, return and one control port arranged so that valve action in onedirection opens the control port to supply and reversed valve actionopens the control port to return.
3.2.6 Four -Way Valve - A multi-orifice fluid control element with supply,return and two control ports arranged so that valve action in onedirection simultaneously opens control port #1 to supply and control port#2 t t R d l ti t l t #1 t t d
3.2.8 Load Compensation - A valve design condition which yieldsrelatively constant flow gain over a wide range of load pressure drop;sometimes called gain compensation*.
3.3 Electrical Input Characteristic s
3.3.1 Torque Motor - The electromechanical transducer commonlyused with the input stage of a servovalve. Displacement of the armatureof the torque motor is generally limited to a few thousandths of an inch.
3.3.2 Input Current -The current which is required for control of thevalve, expressed in ma. For three and four lead coils, input current isgenerally the differential coil current, expressed in ma.
3.3.3 Rated Current - The specified input current of either polarity toproduce rated flow, excluding any null bias current, expressed in ma.For three and four lead coils, rated current must be associated with aspecific coil connection (series, differential, or parallel).
3.3.4 Quiescent Current -The dc current present in each coil of adifferential coil connection, the two coil currents having opposingpolarities such that no electrical control power exists.
3.3.5 Electrical Control Power - The electrical power dissipated in thevalve coils which is required for control of the valve, expressed in mw.For differential coil connection, the total electrical input power suppliedto the servovalve is the sum of t he electrical control power and thepower due to quiescent current.
3.3.6 Electrical Nul l* -The zero input current condition.
3.3.7 Coil Impedance - The complex ratio of coil voltage to coil current.It is important to note that coil impedance may vary with signalfrequency, amplitude and other operating conditions due to back emf generated by the moving armature. Therefore, coil impedance shouldbe measured with explicit operating conditions.
3.3.8 Coil Resistance - The dc resistance of each torque motor coil,expressed in ohms.
3.3.9 Coil Inductance - The apparent inductive component of the coilimpedance, expressed in henrys. For a valve torque motor having morethan one coil, the total coil inductance will include mutual couplingeffects.
3.3.10 Dither - A low amplitude, relatively high frequency periodicelectrical signal sometimes superimposed on the servovalve input toimprove system resolution. Dither is expressed by the dither frequency(Hz) and the peak-to-peak dither current amplitude (ma).
3.4 Static Performance Characteristics
3.4.1 Control Flow, also called Load Flow* or Flow Output* The fluidflow passing through the valve control ports, expressed in cis or gpm. Intesting a four-way servovalve, flow passing out one control port is
assumed equal to the flow passing in the other. This assumption is validfor no-load valve testing with a symmetrical load (e.g., with an equalarea piston having insignificant friction and mass) and for static testingwith loaded flow.
3.4.2 Rated Flow - The specified control flow corresponding to ratedcurrent and specified load pressure drop, expressed in cis or gpm.Rated flow is normally specified as the no-load flow.

7/30/2019 Moog New Tb117
http://slidepdf.com/reader/full/moog-new-tb117 3/24
3.4.4 Loaded Flow - The servovalve control flow when there is loadpressure drop, expressed in cis or gpm.
3.4.5 Internal Leakage - The total internal valve flow from pressure toreturn with zero control flow (usually measured with control portsblocked), expressed in cis or gpm. Internal leakage will vary with input
current, generally being a maximum at the valve null (null leakage). Ina two stage servovalve, internal leakage will include both hydraulicamplifier flow (sometimes called tare flow*) and bypass flow throughthe output stage.
3.4.6 Total Valve Flow - The sum of the control flow and the internalleakage flow, expressed in cis or gpm.
3.4.7 Load Pressure Drop - The differential pressure between thecontrol ports, expressed in psi. With conventional three-way valves,load pressure drop is the differential pressure between the valvecontrol port and one-half the net supply pressure.
3.4.8 Valve Pressure Drop - The sum of the differential pressurespresent across the control orifices of the output stage, expressed inpsi. Valve pressure drop will equal the supply pressure minus thereturn pressure minus the load pressure drop.
3.4.9 Power Output -The fluid power which is delivered to the load,expressed in hp.
3.4.10 Polarity - The relationship between the direction of control flowand the direction of the input current.
3.4.11 Threshold - The increment of input current required toproduce a change in valve output, expressed as percent of ratedcurrent; sometimes called resolution*. Threshold is normally specifiedas the current increment encountered when changing the direction of application of input current,
3.4.12 Hysteresis - The difference in the valve input currents requiredto produce the same valve output during a single cycle of valve inputcurrent when cycled at a rate below that at which dynamic effects areimportant. Hysteresis is normally specified as the maximumdifference occurring in a complete cycle between ±rated current, andis expressed as percent of rated current
3.4.13 Flow Curve - The graphical representation of control flowversus input current. This is usually a continuous plot of a completecycle between plus and minus rated current values.
3.4.14 Normal Flow Curve - The locus of the mid-points of thecomplete cycle flow curve. This locus is the zero hysteresis flowcurve; however, valve hysteresis is usually quite low such that oneside of the f low curve can be used for the normal flow curve.
3.4.15 Flow Gain - The slope of the control flow versus input currentcurve at any specific point or in any specific operating region,expressed in cis/ma or gpm/ma. The incremental flow gain may varyf i t t i t d t l li iti Th i l fl i
current, with the magnitude of load differential pressure, and withchanges in operating conditions.
3.4.17 No-Load Flow Gain - The normal flow gain with zero loaddifferential pressure. No-load flow gain will vary with supply pressure
and other operating conditions.
3.4.18 Rated Flow Gain* - The ratio of rated flow to rated current,expressed in cis/ma or gpm/ma. When rated flow is specified for aloaded flow condition, the rated flow gain should be qualified similarly.
3.4.19 Flow Saturation - The condition where flow gain decreaseswith increasing input current. Flow saturation may be deliberatelyintroduced by mechanical limiting of the valve range, or may be theresult of increasing pressure drops along internal fluid passages.
3.4.20 Flow Limit - The condition wherein control flow no longer
increases with increasing input current.
3.4.21 Symmetry -The degree of equality between the normal flowgain of one polarity and that of the reversed polarity. Symmetry ismeasured as the difference in normal flow gain of each polarity,expressed as percent of the greater.
3.4.22 Linearity - The degree to which the normal flow curveconforms to a straight line with other operational variables heldconstant. Linearity is measured as the maximum deviation of thenormal flow curve from the normal flow gain line, expressed aspercent of rated current.
3.4.23 Pressure Gain - The change in load pressure drop per unitinput current with zero control flow (control ports blocked), expressedin psi/ma. Pressure gain is usually specified as the average slope of the curve of load pressure drop versus input current in the regionbetween ±40% of maximum load pressure drop.
3.4.24 Pressure Threshold* - The change in input current required toproduce a specific change in the load pressure drop with zero controlflow. Sometimes used as a combined threshold and pressure gainmeasurement.
3.5 Null Characteristi cs
3.5.1 Null - The condition where the valve supplies zero control flowat zero load pressure drop.
3.5.2 Null Region - The range of input current about null whereineffects of lap and bypass leakage in the output stage predominate.Normally the valve null region extends through a range of about ±5%rated current from null.
3.5.3 Lap - In a sliding spool valve, the relative axial position
relationship between the fixed and movable flow metering edges withthe spool at null. For a servovalve lap is measured as the totalseparation at zero flow of straight line extensions of the nearly straightportions of the normal flow curve drawn separately for each polarity,expressed in percent of rated current.
3.5.4 Zero Lap, also called Closed-Center - The lap condition wherethere is no separation of the straight line extensions of the normalflow curve generally corresponding to precise alignment of the flow

7/30/2019 Moog New Tb117
http://slidepdf.com/reader/full/moog-new-tb117 4/24
3.5.7 Deadband* - The null region associated with a spool overlapcondition.
3.5.8 Null Bias - The input current required to bring the valve to nullunder any specified set of operating conditions, excluding the effects of valve hysteresis, expressed as percent of rated current. Hysteresis
effects may be discounted by taking the arithmetic average of the nullbias currents measured on a symmetrical hysteresis loop.
3.5.9 Null Shift - The change in null bias required as a result of achange in operating conditions or environment, expressed as percent of rated current. Null shift, sometimes called center shift*, may occur withchanges in supply pressure, temperature, and other operatingconditions.
3.5.10 Null Pressure - The pressure existing at both control ports atnull, expressed in psi; sometimes called centering pressure *.
3.5.11 Null Pressure Gain* - The slope of the pressure gaincharacteristic at null, expressed in psi/ma.
3.5.12 Null Flow Gain* - The slope of the control flow versus inputcurrent relationship at null, expressed in cis/ma. Null flow gain may bebetween 0 to 200% of the nominal flow gain due to the lap condition.
3.5.13 Null Leakage - The total valve internal leakage flow at null,expressed in cis.
3.6 Dynamic Characteristi cs
3.6.1 Frequency Response - The complex ratio of control flow to inputcurrent as the current is varied sinusoidally over a range of frequencies.Frequency response is normally measured with constant input currentamplitude and zero load pressure drop, and is expressed by theamplitude ratio and phase angle. Valve frequency response may varywith the input current amplitude, temperature, supply pressure, andother operating conditions.
3.6.2 Amplitude Ratio - The ratio of the control flow amplitude to asinusoidal input current amplitude at a particular frequency divided bythe same ratio at a specified low frequency (usually 5 or 10 Hz).
Amplitude ratio may be expressed in decibels where db =20 log10 OAR.
3.6.3 Phase Angle - The time separation between a sinusoidal inputcurrent and the corresponding variation of control flow, measured at aspecified frequency and expressed in degrees (deg = time separation,sec x frequency, Hz x 360).
4.0 RECOMMENDED SPECIFICATIONS
4.1 Mechanical
4.1.1 Design Configuration- The manufacturer should make availablea written description of the design configuration of the servovalve,
together with a brief description of the operating principles.
Designs for flow control servovalves vary widely, reflecting thepreferences and experiences of both manufacturers and users. A basicdistinction is the number of stages of hydraulic amplification utilizedwithin the servovalve. In a single stage valve, the torque motor iscoupled directly to the output stage which is usually a sliding spool. In
monly utilized as the intermediate hydraulic amplifier. Some valvesutilize three stages of hydraulic amplification to achieve high capacityflow control.Single stage servovalves often use flow force compensation to reducethe required electrical driving forces. Most multistage flow controlservovalves utilize some form of internal feedback for stabilization of the intermediate hydraulic amplifiers. Both hydraulic feedback andmechanical feedback are commonly used. Occasionally internalelectrical transducers are included to provide a signal proportional tovalve output. These valves require an external servoamplifier to achievestable flow control.
Flow control servovalves are available with both three-way and four-wayoutput stages. Three-way valves are normally used in conjunction withsingle-ended pistons of 2:1 area ratio. Four-way valves are considerablymore common and are usually used for double-sided control of pistonsor hydraulic motors.
Another design classification for flow control servovalves distinguishesbetween wet motor, stale motor and dry motor valves. Isolation of thetorque motor magnetic circuit from fluid filled areas prevents theaccumulation of magnetic contaminant within the valve, therebyincreasing the reliability of most servo systems. With a stale motordesign, fluid is dead-ended in the motor cavity so flow about the motoris considerably reduced. Dry motor valves utilize a sealed flexuremember to transmit motor motion through a fluid barrier.
4.1.2 Construction and Workmanship - The mechanical design,materials and processing, and general workmanship should becompatible with the intended operational, environmental and liferequirements. These requirements vary widely for applications whichrange from machine tools to manned aircraft, missiles and satellites.
Military standard AN, NAS or MS parts should be used in theservovalve whenever suitable. The general requirements of MIL-H-8775A, MIL-H-5440 and MIL-H-25475 should govern the designwherever possible. Especially pertinent considerations are the following:
•All threaded parts and fastenings should be lockwired per MS33540where practicable. Where necessary, other approved locking
methods may be used.•Retaining rings should not be used in any location where failure of thering could result in loss of function of the unit or in loss of hydraulicfluid.
•If practicable, all screw threads should conform to MIL-S-7742.All parts and matched subassemblies subject to replacement shouldbe completely interchangeable with comparable parts of likeservovalves.
•Materials and finishes in contact with the fluid should be selected forfluid compatibility.
Workmanship and tolerance control on all parts utilized in production
servovalves should insure uniform quality and performance to theextent that all units will meet or exceed pertinent customer andgovernment specifications.
4.1.3 Installation and Envelope Details - The installation details andenvelope dimensions for flow control servovalves should be furnishedby the manufacturer. Information given should include: envelopedrawing, mounting details, mating electrical connector, coil connections,lead wire color code sup

7/30/2019 Moog New Tb117
http://slidepdf.com/reader/full/moog-new-tb117 5/24
ply pressure, rated flow at rated current and rated pressure drop,nominal coil resistance and resistance tolerance, valve polarity,intended fluid, recommended fluid filtration, operating temperaturerange, identification of manifold seals, dry weight.
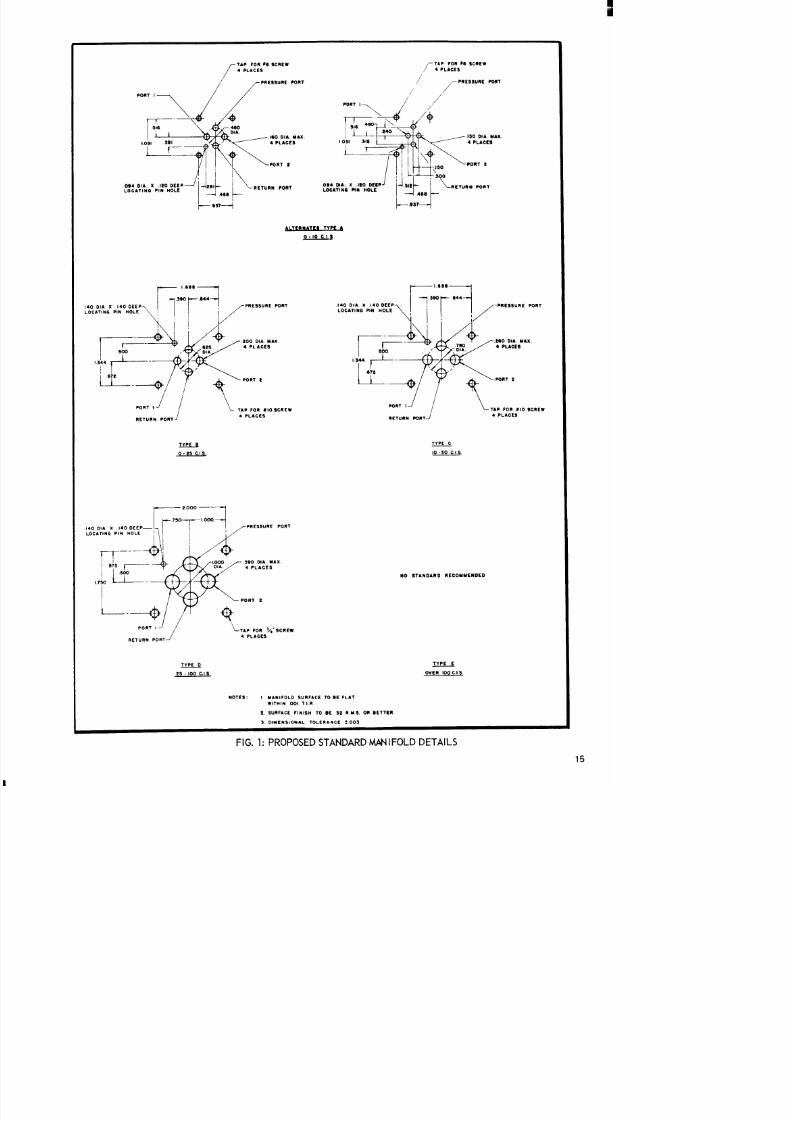
4.1.4 Mounting Configuration - Recommended porting and mounting
configurations for flow control servovalves are given in Figure 1. Three-way valves should use the same porting configurations, exceptthat control port 2 is eliminated
All ports on each servovalve should be legibly identified by markings onthe sides of the valve using P for the pressure supply port, R for thereturn port, 1 and 2 for the control ports.
4.1.5 Nameplate - A nameplate should be securely attached to eachservovalve. Information contained on the nameplate should include thefollowing: name of component, manufacturer's name, model number,serial number, part number.
4.1.6 Centering Adjustment - If an external centering adjustment isprovided to set the valve null, the adjustment should operate smoothlyand without difficulty while the valve is operating with rated supplypressure.
4.1.7 Lubrication - The fluid being controlled should serve as the soleand sufficient lubricant for the servovalve.
4.1.8 Seals -Military standard (MS) seals, selected for compatibility withboth the fluid and the anticipated temperature operating, range, shouldbe used whenever possible within the servovalve. In general, seal sizes
and groove dimensions should conform with MIL-P-5514D. The curedate of elastomeric seals used within the servovalve should be clearlymarked on the exterior of the valve.
4.1.9 Environment - The environmental capability of servovalvessupplied for standard military applications should conform generally tothe requirements of MIL-E-5272C, with the following interpretations:
• The following tests are not normally conducted duringenvironmental testing of servovalves: sunshine, rain, explosion,temperature-altitude.
• Where two or more procedures are described for an environmentalvariable, the following are recommended for use with servovalves:
Low temperature Procedure I IHumidity Procedure I I IVibration Procedure XIVSand and dust Procedure IShock Procedure IVAcceleration Procedure I I I
• Valve performance at various temperatures will be greatlyinfluenced by the viscosity of the fluid. With MIL-H-5606 hydraulic
oil, valve performance will deteriorate rapidly at temperaturesbelow -40ºF. Normally with this fluid the valve low temperaturefunctional tests are taken at -20ºF oil temperature and -65ºFambient. Tests at -65ºF oil and ambient are conducted only todemonstrate valve action sufficient for system start capability.
• Temperatures for the high temperature test and the temperatureshock test should be selected to represent the specified operatingconditions Valve performance should be determined after a
in MIL-E-5272C are not applicable to servovalves. Sweep rates forlogarithmic frequency change can be as fast as 10 minutes/axis.Random vibration tests are not specified by MIL-E-5272C, but arerecommended for inclusion in environmental test programs onservovalves.
• Valve functional tests need not normally be conducted duringexposure to the following environments: altitude, humidity, saltspray, fungus, sand and dust, and immersion. Instead, completevalve tests should be conducted before and immediately followingexposure to these environments.
• Insulation resistance should be determined during humidity andimmersion tests. Valve null shift is normally monitored duringexposure to the following environments: temperature tests,altitude, vibration, shock and acceleration.
4.1.10 Life - The useful life of servovalves supplied for most
applications should exceed 1000 hours of normal operation with fluidhaving the recommended filtration. The useful life of a servovalve willbe greatly influenced by a number of operating conditions, includingenvironment, fluid contamination, number of cycles (including dither if present), frequency and magnitude of electrical and pressureoverloads, etc.
Fluid contamination generally causes gradual erosion and wear of metering orifice edges. This wear tends to increase valve internalleakage, to increase the nonlinearity through the null region, and tendsto decrease valve pressure gain. Contamination also generally tends toincrease friction of sliding spools which may increase valve hysteresis
and threshold.
The number of cycles which may be accumulated during 1000 hours of normal operating life may be several million, so the valve mechanismshould be designed for essentially infinite fatigue life. A suggested lifetest for flow control servovalves is one million sinusoidal cycles at ±rated current input, followed by one million square wave cycles at ±rated current input, each accumulated at a rate of 10 Hz. Control flowon higher flow servovalves may be restricted by a suitable orifice duringthe life test.
4.2 Electrical
4.2.1 Coil Configu ration - The wiring configuration for the torque motorcoils should be specified together with the connector pin identificationor pigtail color coding, as applicable.
Valves are normally supplied with two, three or four lead coils. The coilsmay be connected to the servoamplifier or electrical source in series,parallel or differentially (push-pull).
4.2.2 Coil Connections - Recommended coil connections are givenbelow. When a valve is supplied with an electrical connector, theconnector should be a pin type (male).
7/30/2019 Moog New Tb117
http://slidepdf.com/reader/full/moog-new-tb117 6/24
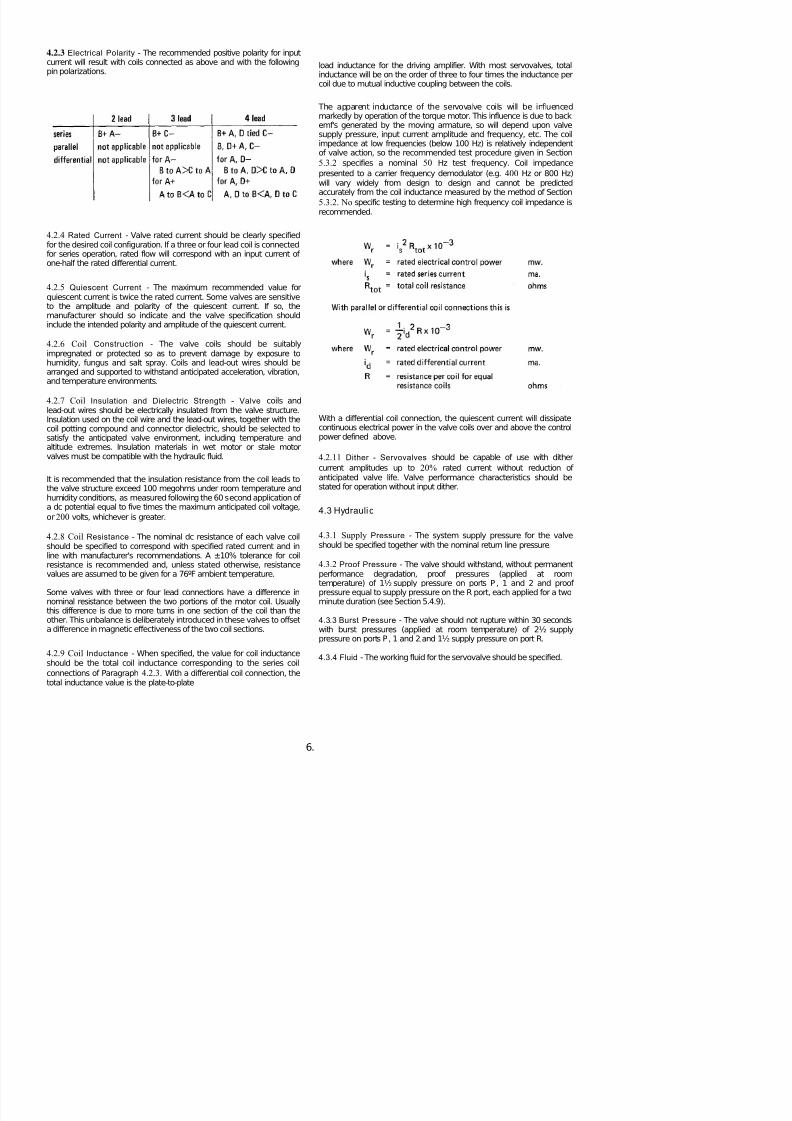
4.2.3 Electrical Polarity - The recommended positive polarity for inputcurrent will result with coils connected as above and with the followingpin polarizations.
4.2.4 Rated Current - Valve rated current should be clearly specifiedfor the desired coil configuration. If a three or four lead coil is connectedfor series operation, rated flow will correspond with an input current of one-half the rated differential current.
4.2.5 Quiescent Current - The maximum recommended value forquiescent current is twice the rated current. Some valves are sensitiveto the amplitude and polarity of the quiescent current. If so, themanufacturer should so indicate and the valve specification shouldinclude the intended polarity and amplitude of the quiescent current.
4.2.6 Coil Construction - The valve coils should be suitablyimpregnated or protected so as to prevent damage by exposure tohumidity, fungus and salt spray. Coils and lead-out wires should bearranged and supported to withstand anticipated acceleration, vibration,and temperature environments.
4.2.7 Coil Insulation and Dielectric Strength - Valve coils andlead-out wires should be electrically insulated from the valve structure.Insulation used on the coil wire and the lead-out wires, together with the
coil potting compound and connector dielectric, should be selected tosatisfy the anticipated valve environment, including temperature andaltitude extremes. Insulation materials in wet motor or stale motorvalves must be compatible with the hydraulic fluid.
It is recommended that the insulation resistance from the coil leads tothe valve structure exceed 100 megohms under room temperature andhumidity conditions, as measured following the 60 second application of a dc potential equal to five times the maximum anticipated coil voltage,or200 volts, whichever is greater.
4.2.8 Coil Resistance - The nominal dc resistance of each valve coilshould be specified to correspond with specified rated current and inline with manufacturer's recommendations. A ±10% tolerance for coilresistance is recommended and, unless stated otherwise, resistancevalues are assumed to be given for a 76ºF ambient temperature.
Some valves with three or four lead connections have a difference innominal resistance between the two portions of the motor coil. Usuallythis difference is due to more turns in one section of the coil than the
load inductance for the driving amplifier. With most servovalves, totalinductance will be on the order of three to four times the inductance percoil due to mutual inductive coupling between the coils.
The apparent inductance of the servovalve coils will be influencedmarkedly by operation of the torque motor. This influence is due to backemf's generated by the moving armature, so will depend upon valvesupply pressure, input current amplitude and frequency, etc. The coilimpedance at low frequencies (below 100 Hz) is relatively independentof valve action, so the recommended test procedure given in Section5.3.2 specifies a nominal 50 Hz test frequency. Coil impedancepresented to a carrier frequency demodulator (e.g. 400 Hz or 800 Hz)will vary widely from design to design and cannot be predictedaccurately from the coil inductance measured by the method of Section5.3.2. No specific testing to determine high frequency coil impedance is
recommended.
With a differential coil connection, the quiescent current will dissipate
continuous electrical power in the valve coils over and above the controlpower defined above.
4.2.11 Dither - Servovalves should be capable of use with dither
current amplitudes up to 20% rated current without reduction of anticipated valve life. Valve performance characteristics should bestated for operation without input dither.
4.3 Hydrauli c
4.3.1 Supply Pressure - The system supply pressure for the valveshould be specified together with the nominal return line pressure.
4.3.2 Proof Pressure - The valve should withstand, without permanentperformance degradation, proof pressures (applied at roomtemperature) of 1½ supply pressure on ports P , 1 and 2 and proof pressure equal to supply pressure on the R port, each applied for a twominute duration (see Section 5.4.9).

7/30/2019 Moog New Tb117
http://slidepdf.com/reader/full/moog-new-tb117 7/24
4.3.5 Temperature Range - The intended fluid and ambienttemperature operating ranges for the servovalve should be specified. If no ambient temperature range is given it is assumed equal to the fluidtemperature range. Normal temperature ranges for servovalvessupplied for military applications are the following:
4.3.6 Supply Fluid Filtration - Manufacturers should recommend thesystem filtration ratings to be used for normal life of the servovalve, andthis recommendation should appear on the valve installation drawing. If magnetic system filtration is required, a suitable note should beincluded.
4.3.7 External Leakage - There should be no external leakage from thevalve throughout all operational and environmental ranges, includingoperation under conditions of proof pressures specified in Section 4.3.2.
4.4 Static Performance
4.4.1 Rated Flow - Valve rated flow should be specified for statedvalues of rated current and rated valve pressure drop (or for a statedsupply pressure and load pressure drop). Each valve should be testedto pass the specified rated flow of each polarity with acceptabletolerance when operated under specified input current and pressureconditions. The usual tolerance for rated flow is ±10% when operatingunder standard test conditions (see Section 5.2).
Rated flow is usually specified for either of two valve pressure dropconditions. One is with full supply pressure drop across the valve(no-load flow), and the other is with a load pressure drop of two-thirdssupply pressure. The former condition is significant for sizing tubing andmanifold lines and for estimating maximum load velocity. The latterrated pressure condition is popular as operation at two-thirds maximumload pressure drop represents the maximum power output condition fora given valve orifice opening. For convenience in the use of semi-automatic flow plotters for valve testing, it is recommended thatrated flow be specified as the no-load flow.
It is recommended that the valve be designed for mating to the manifoldport patterns given in Figure 1. The manifold pattern should be selectedfor the valve rated flow at full supply pressure drop as listed below:
4.4.2 Flow Polarity - The recommended positive flow polarity for afour-way valve is flow out port 1 and flow in port 2. These flows shouldresult with positive input current (see Section 4.2.3). With a three-wayvalve positive input current should give flow out port 1. Flow polarity canbe determined from the control port pressures during a blocked loadtest (see Section 4.4.6).
4.4.3 Internal Leakage - The maximum allowable value for internalleakage should be specified, based upon manufacturer'srecommendations, and each valve should be tested to determine itsmaximum internal leakage flow. This test can be a continuous plot of internal leakage throughout the null region (as shown in Figure 2) ormay be a visually obtained flow reading taken at the peak valueobserved (see Section 5.4.4). Very low flow valves may require a stopwatch and beaker technique to obtain an accurate measurement of internal leakage.
Manufacturers should make available information explaining the internalleakage limits normally held in his products. Lower leakage values canusually be supplied with some degradation of dynamic response andflow linearity in the null region.
4.4.4 No-Load Flow Characteristi cs - Specification limits for flow gain,symmetry, linearity, lap region, flow saturation and flow limit (if applicable) are usually best defined in terms of an acceptable toleranceenvelope for one side of the no-load flow curve. The maximumhysteresis value may be specified separately, or included in the
tolerance envelope. See Figure 3.
Each valve should be tested to demonstrate acceptable performance of these no-load flow specifications. These characteristics are bestmeasured by a continuous no-load flow plot (see Section 5.5.3), but canbe ascertained by point-by-point data reading (see Section 5.4.5). Thetolerance envelope for the no-load flow characteristics should be drawnto the same scales as used for the valve data, thus facilitating use of overlays or preprinted data sheets.
Manufacturers should make available normal tolerances held on the
no-load flow characteristics of his products. Tighter envelopes cannormally be maintained if required, but at a corresponding cost penalty.
4.4.5 Threshold - Maximum allowable valve threshold should bespecified and each valve should demonstrate acceptable thresholdperformance when operated under standard test conditions. Thresholddata should be measured at several points throughout the valve workingrange. Either a flow plotter or static flow bench can be used to measurevalve threshold (see Section 5.4.7 or 5.5.4). Manufacturers shouldmake available acceptable threshold limits for his products.
4.4.6 Blocked Load Characteristics - Specification limits for pressuregain and null pressure should be established for the servovalveoperating with blocked control ports. Each valve should be tested todemonstrate acceptable blocked load characteristics. Either acontinuous pressure plot or point-by-point data may be used to measurepressure gain, as shown in Figure 4. The valve null pressure can beread from pressure gages in the control lines when the valve is at null.Also, valve polarity can be determined by the swing of the control port

7/30/2019 Moog New Tb117
http://slidepdf.com/reader/full/moog-new-tb117 8/24
valve design, so is not normally specified for flow control servovalves. If rated flow is specified for a loaded condition, the correspond in no-loadflow characteristics are dictated by the valve design.
Complete loaded flow characteristics are not normally measured on
each valve. The general nature of these characteristics should bedetermined, however, for each new servovalve by running eithercontinuous plots or point-to-point data on a representative valve (seeParagraphs 5.4.8 or 5.5.5). Data is normally presented as a family of curves taken at constant values of input current (see Figure 5).
4.4.8 Null Bias and Null Shift - Valve null bias at any time will reflectany permanent null offset, together with any temporary null shift. Initialoffset in the valve null bias may be present when the valve is firstassembled and a maximum value should be specified for operationunder standard conditions. This initial null bias may change during the
life of a valve as a result of use and exposure to environments. Theuncertainty of the long term null bias should be predicted by themanufacturer for valves having no centering adjustment.
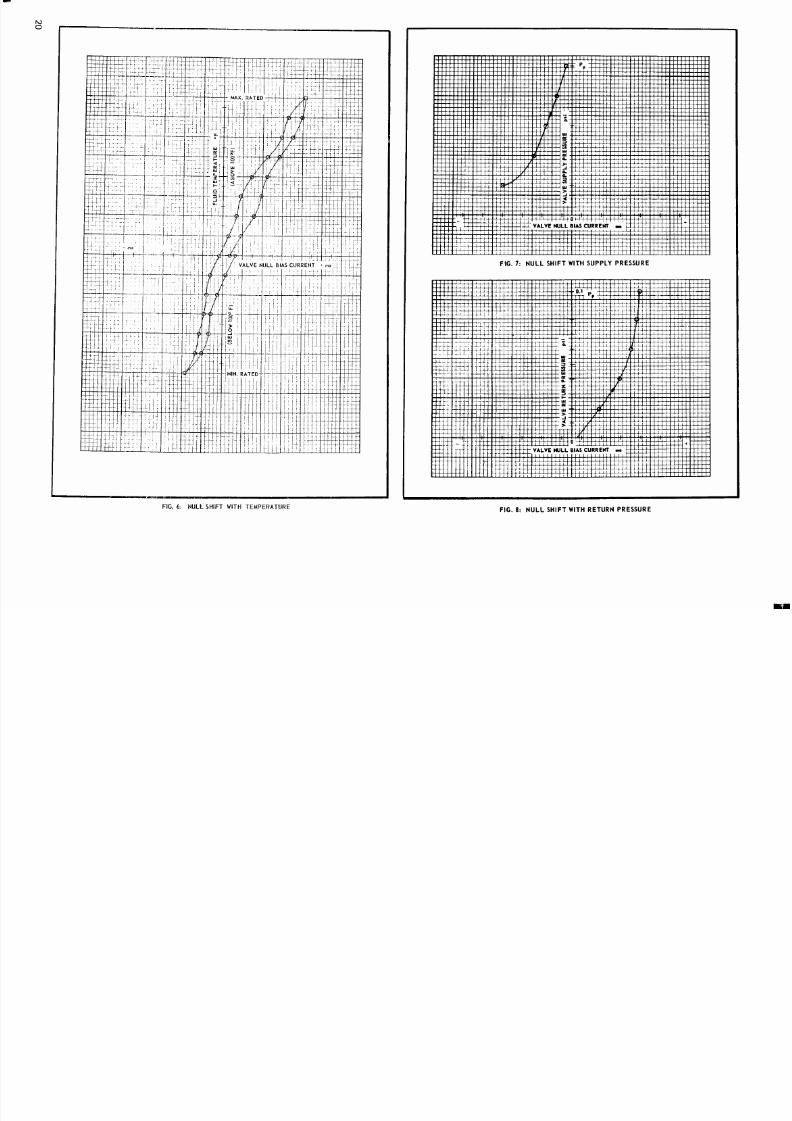
Temporary null shifts may occur during exposure to various operatingconditions or environments. If system performance is critical, thencorresponding specifications for maximum valve null shift should bedetermined. Normally maximum null shift is specified as the change innull from that present under standard room operating conditions. Valvenull shift may be measured with respect to a change in environment oroperating condition and when such data is taken it should be presented
as plots of null shift recorded during application and removal of the testcondition. Null shift is frequently measured for changes in the followingconditions.
Normally tests of valve null shift are only conducted on a representativesample of production valves. Manufacturers should make available datagiving typical null shift performance for his products.
4.5 Dynamic Performance
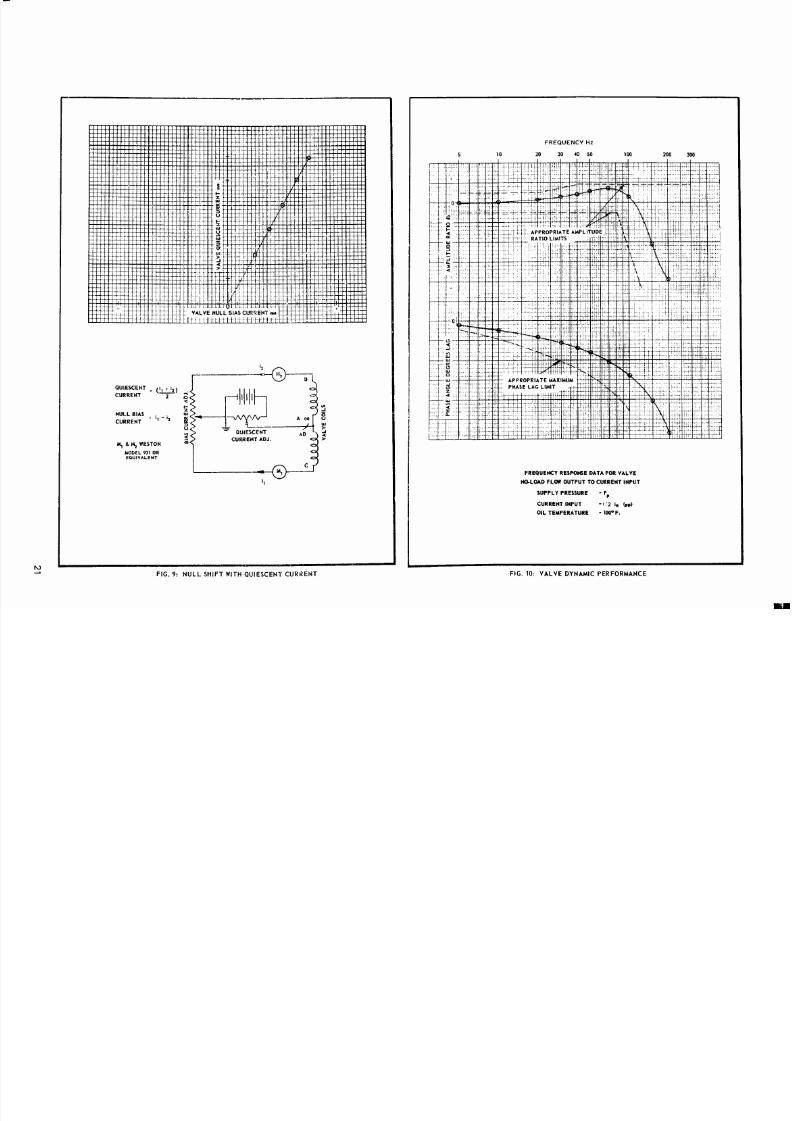
4.5.1 Amplitude Ratio - Data for a complete plot of amplitude ratioversus sinusoidal input current is not normally taken on each productionvalve. Often, however, the manufacturer will check valve amplitude ratioat one or two frequencies in order to assess valve stability. Whenfrequency response is critical, a tolerance envelope should be used tospecify amplitude ratio as indicated in Figure 10. This envelope willusually specify response under standard operating conditions (seeSection 5.2).
should be measured on a prototype model if performance requirementsare critical.
Valve dynamic response measured at large input current amplitudes will
saturate at higher frequencies due to limited output of the torque motorand valve intermediate stages. With low input current amplitude, valvethreshold effects produce distorted output waveforms. In either case,departure from sinusoidal waveforms can produce ambiguous and evenmeaningless response data. The recommended peak-to-peakamplitude of the input current for dynamic response testing is one-half the valve rated current.
4.5.2 Phase Angle - Data on valve phase angle, when taken, shouldbe presented on the same plot as amplitude ratio (see Figure 10). Thegeneral comments and specification recommendations of the precedingsection apply equally to phase angle measurements.
Manufacturers will often measure the frequency of the 90º phase pointas a quick check of valve dynamic response. When complete valvedynamic response is desired, data should be taken throughout thefrequency range from the reference lower frequency (usually 5 or 10Hz) to the frequency where the valve exhibits 96º phase lag.
5.0 RECOMMENDED TEST PROCEDURES
5.1 Test Equipment and Facili ties
Schematics are given in conjunction with the test descriptions whichfollow in order to illustrate the equipment requirements. Someequipment especially suited to the purpose is available from variousmanufacturers and a partial listing of this equipment has beenincluded.
When selecting individual test instruments, gages, etc. to be used inspecial test set-ups for measuring servovalve performance, theaccuracies of the equipment chosen must be compatible with the
precision of the tests to be performed. Most hydraulic and electricaltest equipment requires frequent calibration to maintain suitable
accuracy. In addition, most hydraulic flowmeters require readingcorrections to account for fluid viscosity variations. These variations canbe expected with fluid use or changing fluid temperature, or betweendifferent fluid types.
In designing special equipment set-ups, care should be exercised tominimize unnecessary line lengths and hydraulic fittings so as to reduceline pressure drops. Likewise, tubing sizes should be selected forcompatibility with peak flows to be encountered. Location of static
pressure gages at the valve manifold will avoid inaccurate indications of actual valve pressures.
The input to electrohydraulic servovalves is defined as the current in theservovalve coils. In order to provide for unambiguous testing of servovalves, the electrical equipment used should be capable of providing undistorted current waveforms, irrespective of the valve coilinductance and back emf's due to valve action. Hence, a high output
Null shift with acceleration is usually given as percent/unit acceleration(see 5.4.14).

7/30/2019 Moog New Tb117
http://slidepdf.com/reader/full/moog-new-tb117 9/24
Measured currents will correspond to the series coil connection, so willbe one-half corresponding differential currents. Valve performancemeasured in this manner will accurately represent differential coiloperation.
Several manufacturers and users are now utilizing semi-automatic,continuous data plotting equipment to obtain static performancecharacteristics for flow control servovalves. Either continuous orpoint-by-point test equipment may be employed for static valve testing. The recommended test procedures which follow recognize eithertechnique as acceptable.
5.3 Electrical Tests
5.3.1 Coil dc Resistance - The dc resistance of the coil, or coils,should be measured with an accuracy of ±1% for 70ºF ±2ºF ambienttemperature. If the valve utilizes a three or four lead coil connection, theresistance of each side of the total coil should be measured separately.A conventional Wheatstone bridge type electrical test instrument is
acceptable for measuring coil resistance (Industrial Instruments, Inc. Type RN). The valve need not be supplied with pressurized oil duringmeasurement of coil resistance.
5.3.2 Coil Inductance - The recommended procedure for measuringvalve coil inductance establishes the apparent inductance to signalfrequency variations. This inductance value is suitable for transfer
function representation in system dynamic studies.A suitable audio frequency oscillator is connected to drive the totalvalve coil, connected in series with a precision resistor. The oscillatorshould have sufficient power output to supply undistorted input currentof at least one-half rated value. The oscillator frequency is set at 50 Hzand the amplitude adjusted to give a peak-to-peak current amplitude of one-quarter valve rated current.
inductance can be determined.
If a suitable phase angle meter is not available, actual construction of the voltage vector diagram from measurement of e T, eR and eV canestablish the magnitude of eL with sufficient accuracy for determinationof valve coil inductance.
5.3.3 Insulation Resistance - The insulation resistance of the valvecoil and connections can be measured by the steps below. Valves neednot be pressurized for the insulation test; however, wet coil and stalecoil valves should be filled with hydraulic fluid during the test.
Step 1 Apply a dc voltage of five times the maximum anticipated coil
voltage, or 200 volts (whichever is greater) between the combined coilconnections (connected together) and the valve body (using IndustrialInstruments, Inc. Type P6 Voltage Tester, or equivalent).
Step 2 Maintain the test voltage for 60 seconds.
Step 3 With the test voltage still applied, measure the current flow.
Step 4 The applied voltage level divided by the measured current valuegives the insulation resistance. (Equivalent electrical instruments maygive the insulation resistance directly.) No evidence of insulationbreakdown should be apparent and the insulation resistance should
exceed 100 megohms.`
5.4 Static Performance Test- Point-by-Point Data The valve should be securely mounted to a suitable static test stand.Figure 12 gives the hydraulic schematic for a static test stand utilizingreturn line flowmeters.
5.4.1 Null -The procedure to determine valve null follows.
Step 1 Open the return line shut-off valve.
Step 2 Close the load valve to block the servovalve control ports.
Step 3 Apply rated pressure to the valve under test by opening thesupply line valve and adjusting the pressure regulating valve. Thesupply pressure to the valve should be adjusted untilStep 6 To eliminate electrical hysteresis, continue cycling the inputcurrent slowly between positive and negative values while graduallydecreasing the maximum current levels.
Step 4 Apply full positive rated current.
Step 5 Decrease the input current slowly to zero, then increase currentin a negative direction to full negative rated current.
The total coil inductance should be measured with the valve operatingunder conditions specified in 5.2. The recommended test set-up isshown in Figure 11.
5.2 Standard Test Conditions Unless specified otherwise, flowcontrol servovalves should be tested under the following standardconditions:

7/30/2019 Moog New Tb117
http://slidepdf.com/reader/full/moog-new-tb117 10/24
and reverse the direction of applying current input until the loadpressure drop is again zero. Note the value of input current. The twovalues of current will differ due to valve threshold.Step 9 The null bias current (in ma) is the average of the two current
values noted in the preceding step.
5.4.2 Polarity - Correct valve polarity can be determined from thecontrol port pressure indications following step 4 of 5.4.1. Pressure atcontrol port 1 should be equal to Pp and pressure at control port 2should equal PR'
5.4.3 Pressure Gain - Data for a plot of the pressure gain characteristic(see Figure 4) may be obtained by the following procedure.
5.4.4 Internal Leakage - Data for a plot of valve leakage flow versusinput current (see Figure 2) may be obtained by the followingprocedure. Often a statement of maximum internal leakage (whichexists at the null point) may suffice in lieu of a plot.Step 1 Follow steps 1 through 4 of 5.4. 1.Step 2 Slowly decrease the input current, stopping at suitable points torecord the flowmeter readings. Care should be taken to obtain themaximum flowmeter reading which will occur at the valve null. Note thatthe null bias current obtained here will be different from that of 5.4.1 byapproximately one-half the valve hysteresis.Step 3 Continuation of step 2 until full negative input current is obtainedwill provide data for a complete internal leakage plot. A minimum of
eleven data points is recommended. This data is also necessary toobtain the no-load flow plot of the following section.
5.4.5 No-Load Flow Characteristi cs - Data for a no-load flow plot (seeFigure 3) may be obtained by the following procedure.Step 1 Open the return line shut-off valve.Step 2 Open the load valve.Step 3 Apply rated pressure to the valve, as in step 3 of 5.4.1. Under
particularly evident through the null region where the control flow isdetermined by differences of nearly equal flow readings.
Step 7 A plot of the data obtained in step 6 will provide valve linearity,symmetry, flow gain, and flow saturation information. Minor flow gaindiscontinuities will not necessarily be uncovered by this point-by-pointtest method.
5.4.6 Hysteresis - Maximum valve hysteresis can be measured quiteaccurately by the following procedure.Step 1 Perform steps 1 through 4 of the preceding section (5.4.5).
Step 2 Decrease the input current slowly to full negative rated current.
Step 3 Increase the input current slowly to full positive rated current.Slowly decrease input current to approximately 10% of positive ratedcurrent. Note the current value (io) and the equivalent flowmeterreading.
Step 4 Decrease the input current to full negative rated, then increasethe current in a positive direction, continuing through zero and the valueio until the same flowmeter reading is obtained. Record the inputcurrent (i1 ) at this point.
Step 5 The valve hysteresis is given by
5.4.7 Threshold - Valve threshold may be obtained by the followingprocedure
Step 1 Perform steps 1 through 3 of Section 5.4.5.
Step 2 Slowly apply input current of one polarity, stopping near 10%.rated input, Note the current (io) and equivalent flowmeter reading.
Step 3 Slowly decrease the input current until a change in the flowmeterreading is noted. At this point, note the input current indication (i1 ).
Step 4 The incremental currentAi = io - i1 is a measure of valveth h ld

7/30/2019 Moog New Tb117
http://slidepdf.com/reader/full/moog-new-tb117 11/24
5.4.8 Loaded Flow Characteristics
Step 1 Perform steps 1 through 4 of Section 5.4.5.Step 2 Without changing the input current from the full positive ratedvalue, commence closing the load valve.Step 3 At suitable points, stop and obtain readings of flow, P1 and
P2. About five sets of data should be obtained at nearly equalincrements of load pressure drop.Step 4 Repeat step 3 at other constant values of input current, asappropriate.Step 5 For each set of data from steps 3 and 4, calculate the loadpressure drop (Pi - P2). Also, correct the return line flow data for thecorresponding internal leakage flows obtained at like input currentvalues (see 5.4.4).Step 6 From the calculations of step 5, the valve loaded flowcharacteristics may be plotted (see Figure 5).
5.4.9 Proof Pressure - The valve may be subjected to rated proof pressures by the following procedure.Step 1 Close the return line valve.
Step 2 Close the load valve.
Step 3 Apply rated pressure to the valve supply port by opening thesupply line valve and adjusting the pressure regulating valve.
Step 4 Apply full positive rated current, +iR, then apply _'R. Noexternal leakage should be present.
Step 5 Open the return line valve.
Step 6 Increase the valve supply pressure to 11/2% Pp by adjustingthe pressure regulating valve.Step 7 Repeat step 4.
5.4.10 Null Shift with Supply Pressure - Data for a plot of valvenull shift with supply pressure variations may be obtained by thefollowing procedure.
Step 1 Null the valve as in 5.4. 1.
Step 2 Decrease the supply pressure in suitable increments byadjusting the pressure regulating valve. At each value of supplypressure, repeat steps 7, 8 and 9 of the valve null procedure toobtain the corresponding null bias currents.Step 3 Data of step 2 maybe plotted as in Figure 7
5.4.11 Null Shift with Return Pressure - Valve null shift withchanging return line pressure may be presented as in Figure 8. Datafor such a plot may be obtained by the following procedure.
Step 1 Null the valve as in 5.4. 1.
Step 2 Slowly close the return line valve to establish suitableincrements of back pressure. At each back pressure value, repeatsteps 7, 8 and 9 of the valve null procedure to obtain correspondingnull bias currents.Step 3 Data from step 2 may be plotted as in Figure 8.
Step 3 Increase the coil quiescent current in suitable increments,and at each current value repeat steps 7, 8 and 9 of the valvenulling procedure to obtain corresponding null bias currents.
Step 4 Data from step 3 may be plotted as in Figure 9.
5.4.13 Null Shift with Temperature - The recommended testequipment for this test utilizes a simple position servoloop to providecontinuous null bias currents. See Figure 13.Step 1 Open the return line valve.Step 2 Set both the hot and cold oil supply pressures to the ratedsupply pressure.
Step 3 Adjust the mixing valve to give 100 F oil supply temperatureto the valve under test. Record the input current.Step 4 Readjust the mixing valve to establish suitable increments of increasing oil supply temperature. At each successive temperature
allow the valve to stabilize for one minute preceding the inputcurrent reading. It may be desirable to introduce some dither signalinto the system to avoid piston stiction.
Step 5 Continue to obtain null bias current readings for temperatureincrements to the rated maximum temperature; then decrease oiltemperature in like increments to the minimum oil temperature.Similarly, increase the temperature and obtain null bias readings to1 100 F.
Step 6 The data may be presented as in Figure 6.
5.4.14 Null Shift with Acceleration -The recommended equipmentfor this test utilizes electrical pressure transducers at the controlports as indicated in Figure 14. The transducer outputs may beconnected to give a differential load pressure indication, followingappropriate transducer calibration. The following procedure maythen be utilized to measure the valve null shift with accelerationinputs.
Step 1 Mount the valve and manifold on a suitable acceleration inputdevice (centrifuge for constant acceleration, shaker for vibration
inputs, or drop equipment for shock).Step 2 Open the return line valve.
Step 3 Apply rated supply pressure to the valve.
Step 4 For constant acceleration inputs, the null bias currentnecessary to obtain zero load pressure drop may be determined forappropriate acceleration values.Step 5 For vibration inputs, an oscillating load pressure signal willexist. The peak-to-peak amplitude of the null shift may bedetermined by monitoring the load pressure signal on a dc
oscilloscope, while slowly varying the bias input current. Thealgebraic difference of bias current values necessary to producezero load pressure drop, first at one peak and then at the otherpeak, is the peak-to-peak null bias current.Step 6 For shock inputs, a dynamic recording of the differential loadpressure signal is required. The equivalent null bias currents canthen be determined from the pressure gain data of Section 5.4.3.

7/30/2019 Moog New Tb117
http://slidepdf.com/reader/full/moog-new-tb117 12/24
automatic plotting equipment. Figure 15 gives a simplified schematicrepresentative of this equipment.Valve output flow is supplied to a large capacity piston equipped withmotion transducers. P iston velocity is equivalent to the volumetric flowfrom the valve and an electrical signal proportional to the piston velocity
can be recorded. A programmed current sweep input is supplied to thevalve. Usually the sweep signal is a triangular waveform as sketchedbelow.
The piston position prior to the sweep cycle is near one end, so thepiston traverses the cylinder and back during the cycle. The sweepduration is programmed such that the piston does not bottom during the
cycle. A low gain position feedback signal with bias adjustment is usedto maintain the piston position prior to a sweep input. During a currentsweep, the valve is operating open loop.Most continuous data plotting equipment for flow servovalves issupplied with control port pressure instrumentation. By closingoff thecontrol line shut-off valves, plots of valve pressure gain characteristicscan be made. For these plots, the amplitude of the current sweep canbe adjusted for a suitable cycle about the valve null.
Some plotters can produce valve loaded flow characteristics. Differenttechniques for obtaining loads are utilized. The technique illustrated inFigure 15 uses a manually adjusted load line valve to vary the loadpressure drop. Some plotter pistons can be loaded with dead weights tofurnish flow versus input current plots at constant values of loadpressure drop.It is usually possible to obtain plots of valve internal leakage flow versusinput current by blocking the control lines and diverting return line flowto the plotter piston. A half-sweep input commencing at +iR can beutilized to produce the internal leakage plot.At the present time, two manufacturers are known to have complete
Detailed operation and calibration procedures are available from thesemanufacturers to explain the correct use of their equipment. Frequentcalibration of plotting equipment is especially important for accuratedata presentation. Electrical circuits within the plotters should bearranged to produce positive plotter displacements with the
recommended standard positive current, flow and pressurespecifications of paragraphs 4.2.3 and 4.4.2.
Prior to each test the zero axes should be established by actuallyplotting zero Y input versus X sweep and zero X input versus Y sweep. This can be accomplished by manually rotating the corresponding axiscentering control.
5.5.1 Blocked Load Characteristic s - Pressure gain, polarity and nullcharacteristics can be ascertained from the following procedure.
Step 1 Connect the valve, both hydraulically and electrically, to theplotting equipment.Step 2 Close the control line valves.
Step 3 Open the return line valves.Step 4 Set the valve supply pressure to the rated value by opening thesupply valve and adjusting the pressure regulating valve. Theadjustment should compensate for any return line back pressure.
Step 5 With the plotting pen raised, automatically cycle the inputcurrent sweep several times between plus and minus rated currentvalues, stopping at zero input current.Step 6 Establish a plotter configuration to permit recording loadpressure drop along the Y axis and input current along the X axis. Usescale factors to give AP max =±PP and i max ~±0.2 iR,
Step 7 Set the automatic current sweep to approximately ±0.2 iRmaximum (or, as appropriate for the valve under test).Step 8 With the plotting pen still raised, automatically cycle the inputcurrent between values set in step 7. During cycling, ascertain that pen
motion is unrestricted and that a sufficiently slow sweep is in use toassure a smooth plot, free of recorder dynamic effects.
Step 9 Lower the plotter pen and record the pressure gaincharacteristic for one complete current sweep, as in Figure 4.Step 10 The slope of the plot in the region between ±40% Pp is thevalve pressure gain.
Step 11 Correct valve polarity is indicated by positive differentialpressures (∆P =Pi - P2) corresponding to positive input current.
Step 12 The valve null bias is assumed to be midway between theabcissa intercepts of the pressure gain plot.
5.5.2 Internal Leakage - A plot of the valve internal leakage may beobtained by the following procedure.Step 1 Repeat steps 1 and 2 of the preceding section.Step 2 Set the return line shut-off valves to allow return flow to pass to

7/30/2019 Moog New Tb117
http://slidepdf.com/reader/full/moog-new-tb117 13/24
Step 4 Set the input current sweep for a half cycle plot starting at +iR 'Some plotters are not equipped for half cycle plots, so will require amanually controlled sweep current input.
Step 5 Apply rated supply pressure to the valve. The plotter piston willcommence moving, so immediately lower the plotter pen and introduce
the input current described in step 4. Note that the sweep speed issufficiently slow, especially through the null region, to give a smooth,accurate plot. See Figure 2.Step 6 Should the piston bottom prior to the completion of the previousstep, or should another plot be required and insufficient piston strokeremain, the piston must be moved back to the starting end. This willrequire a temporary change in the shut-off valve configuration of thereturn and control lines, followed by a repetition of steps 2 and 5 above.
5.5.3 No-Load Flow Characteristics - Flow gain, linearity, symmetry,hysteresis and saturation may be obtained by the following procedure.
Step 1 Repeat steps 1 through 5 of Section 5.5. 1.
Step 2 Open the control I ine valves.
Step 3 Establish a plotter configuration to permit recording control flowon the Y axis and input current along the X axis. Use scale factors topermit recording Qmax =±QR, i max =±iR
Step 4 With the plotter pen raised, automatically cycle the input currentthroughout the entire range. During the sweep note that the flow piston
does not bottom, that the supply and return pressure values remainsufficiently stable, and that the sweep speed is sufficiently slow to avoidexcessive plotter dynamic inaccuracies.
Step 5 Lower the plotter pen and obtain a no-load flow plot as in Figure3.
Step 6 Acceptable flow gain, linearity, symmetry, and saturation arebest ascertained by use of a transparent overlay upon which are drawnallowable envelope limits.Step 7 Valve hysteresis can be measured as the maximum width (iw) of
the no-load flow plot. Percent hysteresis is given by
5.5.4 Threshold - Valve threshold can be determined on continuousdata plotting equipment by the procedure given below.Step 1 Following the no-load flow plot obtained by the procedure of
Section 5.5.3, increase the sensitivities of both the flow and currentrecording channels so that changes corresponding to the valvethreshold will be discernable.Step 2 With the plotter pen lowered, slowly adjust (manually) the inputcurrent until a flow change is recorded. At this point, slowly reverse thedirection of application of current until a corresponding change of flow isnoted Repeating this procedure will establish a threshold plot for the
Observation of plotter piston displacement during this test will benecessary to avoid bottoming of the piston.
5.5.5 Loaded Flow Characteristics - The change in control flow withload pressure may be plotted by the following procedure.Step 1 Repeat steps 1 through 5 of Section 5.5.1Step 2 Establish a plotter configuration to permit recording control flowon the Y axis and load pressure drop on the X axis. Use scale factors topermit Qmax =±QR and AP max =±PP.
Step 3 Set the input current to a constant value of +iR:Step 4 Open one control line shut-off valve.Step 5 With the plotter pen raised, slowly open the other control linevalve. By trial and observation, establish a rate for opening the controlline valve such that maximum flow can be obtained prior to bottoming of the plotter piston. Between trials, apply negative input currents to movethe piston back to the starting point; then close the control line valve.Step 6 Lower the plotter pen and repeat step 5 to obtain one plot of thefamily shown in Figure 5.Step 7 Repeat this procedure to obtain plots at other appropriate valuesof input current.
5.6 Dynamic Tests
The valve dynamic response while operating into no-load withsinusoidal current inputs can be determined by equipment equivalent tothat illustrated in Figure 16. In this equipment, valve control flow issupplied to a low mass, low friction actuator. Motion of the actuator isdetected by electrical transducers. The design of the actuator should besuch that negligible dynamic differential pressure variations exist in thefrequency range of interest (usually to several hundred cycles persecond). In this way the valve dynamic characteristics in the presenceof a true no-load can be ascertained.
A low gain, quasi-static position feedback signal is utilized for nominalcentering of the response actuator. A linear motion velocity generator isrecommended for deriving dynamic flow signals. The servoamplifiermust be designed to supply sinusoidal input currents to the servovalvethroughout the test frequency range. Input current signals may beobtained across a resistor in series with the valve coils.
The amplitude and phase relationship of flow to current may bedetermined directly from an oscilloscope Lissajous pattern, or by use of suitable transfer function measuring instrument.
Considerable caution must be exercised when setting-up a servovalvedynamic test installation to achieve adequate pressure regulation. Inany new installation the dynamic pressure variations in both the supplyand return lines should be observed during a typical test. Excessivepressure variations should be eliminated by careful choice of regulator,accumulators and plumbing configuration.
A significant source of ambiguity and data inaccuracy can arise if the
Step 4 Threshold may be determined by the maximum width of thethreshold plot (iw). Percent threshold is given by

7/30/2019 Moog New Tb117
http://slidepdf.com/reader/full/moog-new-tb117 14/24
commercial dynamic measuring equipment, the results obtained withdistorted waveforms depend upon the specific design of the equipment.Since wide differences in data arise under these conditions, carefulmonitoring of both the flow and current waveforms is essential foraccurate determination of servovalve dynamic characteristics.
Equipment especially designed for servovalve dynamic testing isavailable from at least two manufacturers.(1) Industrial Measurements Corporation Model 601(2) Moog Inc. Model TE 1006
5.6.1 Amplitude Ratio - Data for a plot of valve amplitude ratio (seeFigure 10) may be obtained by the following procedure.
Step 1 Mount the valve to be tested on the response actuator. Connectthe valve coils to the servoamplifier.
Step 2 Open the return line shut-off valve.Step 3 Pressurize the valve to rated pressure by opening the supply lineand adjusting the pressure regulating valve. This adjustment shouldcompensate for any return line back pressure. With proper polarity of the valve and test equipment, the position feedback should tend tocenter the actuator.
Step 4 Set the oscillator frequency to a prescribed reference frequency,usually 5 Hz.
Step 5 Increase the oscillator output amplitude until the desired inputcurrent amplitude is achieved. A peak-to-peak input current of one-half rated is recommended. Observe the actuator velocity signal on theoscilloscope to verify that the actuator does not bottom near the zerovelocity points. Slight adjustment of the valve bias current may benecessary to center the response piston.
Step 6 Adjust the oscilloscope controls to produce a reference height(peak-to-peak piston velocity) and width (peak-to-peak current) for theoutput/input Lissajous pattern.
Step 7 Increase the oscillator frequency to the next test point.Step 8 If necessary readjust the oscillator amplitude to maintain thereference peak-to-peak input current.Step 9 Measure and record the velocity amplitude with respect to thereference amplitude in the manner prescribed by the equipmentmanufacturer. Some equipment furnishes direct readings in decibels.With other equipment, db may be. calculated from the measuredamplitude ratio, if desired.
Step 10 Repeat steps 7, 8 and 9 for the remainder of the test points.Approximately ten data points in the frequency region to the 90 degree
phase lag point are desirable.
5.6.2 Phase Angle - Data for valve phase angle may be obtainedconcurrently with the amplitude data of the previous section.
Step 1 At each frequency setting use a suitable phase meter toascertain the phase difference between the velocity and current signals.If a suitable phase meter is not available, the phase difference may bedetermined from the oscilloscope Lissajous pattern. The following maybe use
7/30/2019 Moog New Tb117
http://slidepdf.com/reader/full/moog-new-tb117 15/24

7/30/2019 Moog New Tb117
http://slidepdf.com/reader/full/moog-new-tb117 16/24

7/30/2019 Moog New Tb117
http://slidepdf.com/reader/full/moog-new-tb117 17/24

7/30/2019 Moog New Tb117
http://slidepdf.com/reader/full/moog-new-tb117 18/24

7/30/2019 Moog New Tb117
http://slidepdf.com/reader/full/moog-new-tb117 19/24
7/30/2019 Moog New Tb117
http://slidepdf.com/reader/full/moog-new-tb117 20/24
7/30/2019 Moog New Tb117
http://slidepdf.com/reader/full/moog-new-tb117 21/24

7/30/2019 Moog New Tb117
http://slidepdf.com/reader/full/moog-new-tb117 22/24

7/30/2019 Moog New Tb117
http://slidepdf.com/reader/full/moog-new-tb117 23/24

7/30/2019 Moog New Tb117
http://slidepdf.com/reader/full/moog-new-tb117 24/24