mooring system sbj-33-c5-amc-26-re-113 - unit
TRANSCRIPT

0 15.08.2019 Final issue LBJ ANE SEJ
Rev. Publish
date
Description Made by Checked
by
Project
appro.
Client
appro.
Client
Contractor Contract no.:
18/91094
Document name:
Preferred solution, K12 – Appendix M
Mooring system
Document no.:
SBJ-33-C5-AMC-26-RE-113
Rev.:
0
Pages:
140
Ferry free E39 –Fjord crossings Bjørnafjorden 304624


CONCEPT DEVELOPMENT, FLOATING BRIDGE E39 BJØRNAFJORDEN
Preferred solution, K12
Appendix M – Mooring system
CLIENT
Statens vegvesen
DATE: / REVISION: 15.08.2019 / 0
DOCUMENT CODE: SBJ-33-C5-AMC-26-RE-113

SBJ-33-C5-AMC-26-RE-113 15.08.2019 / 0 Page 2 of 32

0 15.08.2019 Final issue L. Bjar A. Nesteby S. E. Jakobsen
REV. DATE DESCRIPTION PREPARED BY CHECKED BY APPROVED BY
REPORT
PROJECT Concept development, floating bridge
E39 Bjørnafjorden DOCUMENT CODE SBJ-33-C5-AMC-26-RE-113
SUBJECT Appendix M – Mooring system – K12 ACCESSIBILITY Restricted
CLIENT Statens vegvesen PROJECT MANAGER Svein Erik Jakobsen
CONTACT Øyvind Kongsvik Nedrebø PREPARED BY Lars Bjar
RESPONSIBLE UNIT AMC
SUMMARY
A mooring system has been developed to support the floating bridge concept for crossing Bjørnafjorden.
The curved bridge concept has three moored pontoons relatively close to the center with four mooring lines each, giving a total of 12 mooring lines anchored to the seabed. All anchors are suction anchors located on a relatively flat seabed with sufficient seabed soil for installation and stability.
All components of the mooring system are well known the offshore industry. Four dual axis fairleads are installed on the three moored pontoons. The fairleads will reduce any chain bending moments on the top end of the mooring chain. The fairleads are installed close to the bottom of the moored pontoons. This is done to reduce corrosion on the top end mooring chain and to avoid damage from ship collision.
The mooring lines have R4 chain and 124 mm coated steel wire ropes. All lines have 50 m top chain between fairlead connection on the pontoon and the wire rope segment. All lines have 100 m bottom chain between the wire rope segment and the anchor. Mooring line pretension has been optimized to give the desired line pretension or transverse restoring stiffness for each pontoon. The mooring line tension will also provide minimal total enforced loads from the mooring lines on each pontoon during equilibrium bridge position in calm weather. The mooring lines are pretensioned to 1.9-2.6 MN, providing a relatively taut system where the bottom chain most of the time will be suspended and not lay on the seabed.
Anchors locations are found to suit both a symmetrical mooring spread and locations on seabed with acceptable condition such as seabed slope, stability and soil thickness. Anchor positions are based on anchor suitability maps and recommendations from NGI based on the same geotechnical data. All anchors are located between 360 and 560 m water depth on relatively flat parts of the seabed. All anchors also have an alternative identified location close to the original location as a backup. Detailed anchor calculations and geotechnical evaluations are enclosed at the end of the appendix.
The mooring system design life will be 100 years. All components will either be replaced or have 100 year fatigue life. Top chain and steel wires should be replaced once, thus having 50 years fatigue life. All other mooring system components will have at least 100 year fatigue life.
Mooring calculations has been performed for worst intact condition, after multiple line breaks, during ship collision and fatigue life of mooring lines. All mooring lines satisfy the given requirements to loads and fatigue life.
The suggested mooring system is found to satisfy the requirements of rules and regulations using standard proven components from the offshore industry. More work on dimensions or other details could be performed during a detailed design phase to optimize the utilization and cost even further.

Concept development, floating bridge E39 Bjørnafjorden
Appendix M – Mooring system – K12 TABLE OF CONTENTS
SBJ-33-C5-AMC-26-RE-113 15.08.2019 / 0 Page 4 of 32
TABLE OF CONTENTS
1 Introduction.......................................................................................................................................................................... 5
2 Design basis .......................................................................................................................................................................... 5 2.1 General .......................................................................................................................................................................... 5 2.2 Coordinate system ........................................................................................................................................................ 5 2.3 Analysis ......................................................................................................................................................................... 7 2.4 Rules and regulations .................................................................................................................................................... 7 2.5 Design life ...................................................................................................................................................................... 7
3 Mooring system description ................................................................................................................................................. 8 3.1 General .......................................................................................................................................................................... 8 3.2 Mooring lines ................................................................................................................................................................ 8 3.3 Marine growth ............................................................................................................................................................ 10 3.4 Anchors ....................................................................................................................................................................... 11 3.5 Bridge layout ............................................................................................................................................................... 17 3.6 Restoring force ............................................................................................................................................................ 19 3.7 Anchor positions ......................................................................................................................................................... 22 3.8 Line segment lengths and pretension ......................................................................................................................... 22
4 Analysis model .................................................................................................................................................................... 23
5 Analysis results ................................................................................................................................................................... 24 5.1 Requirements .............................................................................................................................................................. 24 5.2 Main results ................................................................................................................................................................ 24 5.3 ULS line loads .............................................................................................................................................................. 25 5.4 ALS line loads .............................................................................................................................................................. 27 5.5 Minimum safety factors .............................................................................................................................................. 28 5.6 FLS line loads ............................................................................................................................................................... 29
6 References .......................................................................................................................................................................... 31
7 Enclosures .......................................................................................................................................................................... 32

Concept development, floating bridge E39 Bjørnafjorden
Appendix M – Mooring system – K12 1 Introduction
SBJ-33-C5-AMC-26-RE-113 15.08.2019 / 0 Page 5 of 32
1 Introduction
This report presents the work performed related to the mooring system of the Bjørnafjorden project.
The Curved floating bridge with mooring, known as K12, is the recommended solution for the bridge.
The curved bridge has 38 pontoons with 125 m centre spacing between each pontoon. Mooring lines
will be connected to three pontoons with four lines to each pontoon. This gives a total of 12 mooring
lines and anchors for the mooring system. The pontoons and mooring lines are presented in the
figure below (North is pointing right):
Figure 1.1 Bridge pontoons and mooring system overview
2 Design basis
2.1 General
The basis for the mooring system design is given in the project design basis [1]. Specific requirements
will be presented in the relevant sections below. This appendix is focused around the mooring
system design and performance. Details about anchors and seabed geotechnical considerations are
found in Enclosure 1 and Enclosure 2. Details about installation of the mooring system is found in
Appendix N [2].
2.2 Coordinate system
All coordinates in the mooring system is given in the same conventions as Orcaflex and the main
analysis model unless otherwise specified. The Orcaflex coordinate are defined as a right-handed
Cartesian coordinate system (UTM zone 32):
x-axis pointing north with zero in UTM 6,666,000 mN
y-axis pointing west, with zero in UTM 298,000 mE
z-axis pointing upwards, with zero in the mean waterline
directions are defined in propagation direction counter-clockwise from x-axis, e.g. 0 deg
means waves from south and 90 deg means waves from east.
The positions of the pontoons are shown below relative to the global reference point and north,
south, east and west:

Concept development, floating bridge E39 Bjørnafjorden
Appendix M – Mooring system – K12 2 Design basis
SBJ-33-C5-AMC-26-RE-113 15.08.2019 / 0 Page 6 of 32
Figure 2.1 Global coordinate system
The horizontal reference point in UTM coordinate system (zone 32) is 6,666,000 m N and 298,000 m
E. The zero reference point is located on land on the south side of Bjørnafjorden.
The local pontoon reference system is defined as:
x-axis pointing along bridge girder (from south to north) with zero in pontoon centre. Motion
in x-direction is referred to as surge.
y-axis pointing across bridge girder (from east to west) with zero in pontoon centre. Motion
in y-direction is referred to as sway.
z-axis pointing upwards with zero in still waterline Motion in z-direction is referred to as
heave.
Figure 2.2 Locale Coordinate system – Pontoon

Concept development, floating bridge E39 Bjørnafjorden
Appendix M – Mooring system – K12 2 Design basis
SBJ-33-C5-AMC-26-RE-113 15.08.2019 / 0 Page 7 of 32
2.3 Analysis
The mooring calculations are included in the global Orcaflex model calculations. Details about the
global model and calculation are found in Appendix F [3], G [4] and H [5].
2.4 Rules and regulations
The mooring system is based on the rules and regulations as given in the project design basis [1]:
DNV GL rules (OS-E301 [6])
NMA regulation (NMA 998/09 [7])
ISO rules (ISO 19901-7 [8])
2.5 Design life
As given in the project design basis [1], the bridge design life will be minimum 100 years. For the
mooring system, the design life is limited by:
Chain corrosion (mainly on top chain segment)
Fatigue life of the mooring lines (total accumulated damage during design life).
Corrosion of suction anchors embedded in sediments. Experience from suction anchors
shows that corrosion will be a minor challenge to the design life of the anchors.
The chain stopper and top end of the top chain will be fully submerged and below the splash zone at
all times. It is therefore considered that the corrosion allowance for both top and bottom chains will
be 0.2 mm/year. Reference is made to Appendix O [9].
The anchors and bottom chain segments are not planned to be replaced during the design life of the
bridge. This means the anchors and bottom chains must have design (corrosion and fatigue) life of at
least 100 years. All connection elements should have at least 100 year design life.
The wire rope and top chain segments will be replaced once during the design life of the bridge. This
means the anchors and bottom chains must have design (corrosion and fatigue) life of at least 50
years. The proposed design life for each mooring component is presented in the table below:
Table 2.1 Design life of mooring system
Component Minimum design life Comments
Pontoon connection, e.g. chain stopper/fairlead.
100 years Not considered; assumed 100 year. Replacement possible if necessary.
Top chain 50 years To be replaced once during life cycle.
Wire rope 50 years To be replaced once during life cycle.
Bottom chain 100 year Replacement not possible or planned.
Anchor 100 year Replacement not possible, but if necessary, a new anchor must be installed on a nearby location. Acceptable backup locations in proximity to the planned anchor locations has been identified for all anchors.
Connection elements 100 years Not considered; assumed 100 year. Replacement possible if necessary.

Concept development, floating bridge E39 Bjørnafjorden
Appendix M – Mooring system – K12 3 Mooring system description
SBJ-33-C5-AMC-26-RE-113 15.08.2019 / 0 Page 8 of 32
3 Mooring system description
3.1 General
The mooring system consists of three moored pontoons (A13, A20 and A27) with four mooring lines
connected to each pontoon. The mooring system serves several tasks:
Captures the static and dynamic loads on the bridge.
Adds restoring horizontal stiffness to the bridge
Adds damping to the bridge.
3.2 Mooring lines
All mooring lines are assumed to consist of five components based on a standard composition for a
taut or semi-taut mooring system:
Pontoon connection, chain stopper/fairlead
Top chain
Sheeted/coated steel wire rope
bottom chain towards the anchor (suction type)
The wire rope segment is considered more robust than for example fibre rope segments. The wire
will experience minor creep or elongation after installation and during the lifetime. The weight of the
wire rope also provides some catenary elasticity of the mooring lines. The catenary provides damping
from mooring lines on the bridge and avoids high snap loads due to axial loading of the mooring
lines.
Segmentation of a typical mooring line is shown in the figure below, and in separate drawing [10]:
Figure 3.1 Mooring line segmentation
The lines are numbered from 1 to 12, starting on the pontoon furthest south and numbering
clockwise from forward starboards side. See example from pontoon 13 (farthest south):

Concept development, floating bridge E39 Bjørnafjorden
Appendix M – Mooring system – K12 3 Mooring system description
SBJ-33-C5-AMC-26-RE-113 15.08.2019 / 0 Page 9 of 32
Figure 3.2 Mooring line numbering example
3.2.1 Corrosion
All mooring chains have the same corrosion allowance as for the bottom chain of 0.2 mm/year.
Top chains will be replaced once during 100 year, thus 50 year corrosion. Bottom chains will not be
replaced and need 100 year corrosion life. The properties for chain and wire was based on catalogue
data from chain and steel wire vendors:
Table 3.1 Mooring segment properties – dimensions and strength
Segment Type Diameter Corrosion Breaking strength
Top chain, new Studless R4 chain 147 mm - 19 089 kN
Top chain, end of life Studless R4 chain 137 mm 10 mm 16 992 kN
Steel wire Spiral strand wire – SPR2 plus
124 mm + 11 mm
coating 146 mm
-
15 073 kN
Bottom chain, new Studless R4 chain 147 mm - 19 089 kN
Bottom chain, end of life Studless R4 chain 127 mm 20 mm 14 955 kN
The basis for corrosion allowance:
Anodes to be connected on pontoons and fairlead/chain stopper, wire sockets, anchors and
other components where found necessary.
The top chain will have 0.2 mm/year corrosion for 50 years, which gives 137 mm dimension
at end of life cycle. 137 mm R4 grade chain has MBL of 16992 kN (~17 MN).
The wire rope with sheeting/coating should have zero corrosion of the steel wire rope. Since
there are not enough experience with long-term installed subsea wire ropes, the wire ropes
will be replaced after 50 years together with the top chain segments.
The bottom chain will have 0.2 mm/year corrosion for 100 years, which gives 127 mm
dimension at end of life cycle. 127 mm R4 grade chain has MBL of 14955 kN (~15 MN).
Fatigue calculations uses chain dimensions at mid-life, 142 mm for top chain and 137 mm for
bottom chain.
All mooring components (chain stoppers, coupling elements) must have same (or better)
breaking strength and fatigue life as given above.
Further data on the line segments are presented below:

Concept development, floating bridge E39 Bjørnafjorden
Appendix M – Mooring system – K12 3 Mooring system description
SBJ-33-C5-AMC-26-RE-113 15.08.2019 / 0 Page 10 of 32
Table 3.2 Mooring segment properties – weight, elasticity and drag
Segment Unit weight, dry Unit weight, wet Elastic modulus (EA) Cd,n Cd,l
Top chain 432 kg/m 376 kg/m 1.73E6 kN 2.4 1.15
Steel wire 82.2 kg/m 65.3 kg/m 1.45E6 kN 1.2 0.10
Bottom chain 432 kg/m 376 kg/m 1.73E6 kN 2.4 1.15
3.3 Marine growth
The calculations do not include the effect of marine growth on the mooring lines. The marine growth
will increase the specific weight and drag on the mooring lines. There will be no adjustment of
pretension due to marine growth. A sensitivity case has been checked to find the impact of marine
growth on the bridge. Marine growth has been modelled in accordance with DNVGL
recommendations given in OS-E301 [6], see below:
Table 3.3 DNVGL marine growth
Water depth (m) 59 - 72 deg north
Thickness Density
from to (mm) (kg/m3)
2 above 0 -
-15 2 60 1325
-30 -15 50 1325
-40 -30 40 1325
-60 -40 30 1100
-100 -60 20 1100
below -100 10 1100
Bjørnafjorden is located approximately at 60 degrees north. As seen above, the density and thickness
vary for different water depths down to 100 m depth. Below this depth the thickness is assumed
constant. The top chain segments will be located down to approximately 40 m depth. The wire
segments are split into depth between 40 and 100 m, and below 100 m. For depth between 40 and
100 m, average thickness of 25 mm was applied. At this draft about the upper 90 m of the wire
segment is located. The rest of the wire segment and bottom chain is located below 100 m depth.
For The calculated unit mass and drag coefficients due to marine growth is presented in the table
below:
Table 3.4 Marine growth unit mass and drag coefficients
Marine growth
Mass per unit length
Drag coefficient
(te/m) (-)
Chain no growth 0.432 2.40
wd < 40 m 0.451 4.03
Wire
no growth 0.080 1.20
wd 40-100 m 0.081 1.61
wd > 100 m 0.081 1.36

Concept development, floating bridge E39 Bjørnafjorden
Appendix M – Mooring system – K12 3 Mooring system description
SBJ-33-C5-AMC-26-RE-113 15.08.2019 / 0 Page 11 of 32
As seen above, the unit mass has minor change due to marine growth. The top chain will have
significantly more drag due to marine growth, and also the upper part of the wire segment
(approximately 90 m length) will have some increased drag due to marine growth.
To evaluate the impact of marine growth, the bridge has been exposed to static 100 year extreme
current. A current profile was applied from east and west (separately) using mooring lines with
marine growth as presented above and compared to mooring lines with no marine growth (as
installed). Mooring line tensions increase by approximately 1% when marine growth is included. The
transverse horizontal offset due to this is negligible.
Given that the static current loads only contribute with a limited part of the total environmental
loads on the bridge and mooring lines, the impact due to marine growth is considered to be very
limited. The marine growth may also increase the damping on the mooring lines, which could be
positive for the loads on the system. Marine growth could be further studied in more details, but
these evaluations suggests that marine growth will not be critical for the mooring system.
3.4 Anchors
Anchor sizing was generally based on the factored loads as given in DNVGL-RP-E303. Loads from ULS
(intact condition) and ALS (ship collision, two line failure, 10,000 year condition) has been found and
design loads established for each anchor. Details about anchors will be presented in a separate
geotechnical note, see Enclosure 1 and Enclosure 2. Enclosure 1 presents the specific details related
to the selected bridge concept, while Enclosure 2 presents general information about different
anchor types. A brief summary of the anchors is presented below showing anchor type and sizes:
Table 3.5 Anchor type, dry weights and dimensions
Anchor no
Anchor type
Anchor dry
weights
Anchor dimensions
Diameter Depth
(m) (m)
1 Suction 144 t 6 18
2 Suction 144 t 6 18
3 Suction 144 t 6 18
4 Suction 126 t 6 15
5 Suction 126 t 6 15
6 Suction 126 t 6 15
7 Suction 126 t 6 15
8 Suction 144 t 6 18
9 Suction 169 t 8 14
10 Suction 97 t 6 10
11 Suction 126 t 6 15
12 Suction 169 t 8 14
Initial suction anchor steel weight is based on all anchors having skirt thickness 40 mm, 35 mm 2 m
vertical stiffener inside skirt, top lid (incl. reinforcements) with equivalent thickness 100 mm and
5 ton padeye and reinforcements. This is considered a good initial estimate of the suction anchor
weights. Reference is made to the suction anchor drawing [11].

Concept development, floating bridge E39 Bjørnafjorden
Appendix M – Mooring system – K12 3 Mooring system description
SBJ-33-C5-AMC-26-RE-113 15.08.2019 / 0 Page 12 of 32
3.4.1 Restoring stiffness and line pretension
After several evaluations, the line pretension is adjusted to give a relatively taut mooring system.
Pretension is adjusted to approximately 2000/2500/2000 kN pretension on mooring lines on pontoon
A13/A20/A27 respectively. Anchor locations are selected as symmetrical as possible, but adjustments
were made to find suitable anchor locations based on geotechnical evaluations.
Once the anchor locations are selected, the mooring system for each moored pontoon is optimized
to have the desired restoring stiffness in sway (across the bridge). The mooring line tension is
changed for each line connected to the pontoon to give correct total stiffness and a neutral
horizontal equilibrium position of each pontoon. The neutral position is evaluated by minimizing the
net load on each pontoon in both surge and sway direction:
𝐹𝑠𝑢𝑟𝑔𝑒 = ∑ 𝐹𝐻,𝑖𝑐𝑜𝑠(∝𝑖)
8
𝑖=1
→ 0 , 𝐹𝑠𝑤𝑎𝑦 = ∑ 𝐹𝐻,𝑖𝑠𝑖𝑛(∝𝑖)
8
𝑖=1
→ 0
Where FH is the horizontal component of the mooring line pretension and αi is the horizontal azimuth
angle of one mooring line. To find the correct and neutral pretension for mooring lines on one
moored pontoon, the following iteration has been applied:
1. By selecting the pretension of the moored pontoon, an iteration procedure was utilized to satisfy
the formulas given above for each pontoon. This gave the horizontal component needed to have
neutral horizontal loads on each pontoon.
2. Another iterative script integrated in Orcaflex is used to find the pretension of each line that
corresponds to the desired horizontal component.
3. When all necessary line pretensions are calculated, the mooring lines are given that level by
adjusting the length of the wire segment of each line.
4. The initial restoring stiffness of the pontoon in surge and sway is found in Orcaflex. If the
stiffness is too low, repeat cycle step 1-3 by selecting a higher line pretension load. If the stiffness
is too high, reduce the selected line pretension.
After this procedure, the wire segment lengths are optimized to give a neutral position and correct
sway stiffness for all moored pontoons. The resulting transverse restoring sway stiffness of each
pontoon is presented in the table below:
Table 3.6 Resulting pontoon restoring sway stiffness
Pontoon no Ky (kN/m)
13 542
20 628
27 797
As seen in the table, the restoring stiffness is somewhat higher towards north.
3.4.2 Vertical loads
The vertical component of each mooring line contributes to a vertical load on the moored pontoon.
To sustain this additional load, the moored pontoons have extra deep draft (7.5 m instead of 5.0 m
compared to the regular pontoons). To compensate for the vertical mooring line loads, each moored
pontoon is ballasted with an appropriate amount of ballast water to balance out the mooring loads.
This ballast procedure in the analysis model is done automatically by an iterative script.

Concept development, floating bridge E39 Bjørnafjorden
Appendix M – Mooring system – K12 3 Mooring system description
SBJ-33-C5-AMC-26-RE-113 15.08.2019 / 0 Page 13 of 32
3.4.3 Chain stoppers
The mooring lines are connected symmetrically to two points in each end of the moored pontoons.
All mooring lines will be connected 6 m below the water line. This will be well below the splash zone,
keeping the chain stopper and chain top end away from increased corrosion due to exposure to air.
Figure 3.3 Mooring line connection positions on pontoons
The connection points of mooring lines on the pontoons are given in the table below in local
coordinates of the pontoon:
Table 3.7 Mooring line connection positions on pontoons
Line no X (m) Y (m) Z (m)
1 7 -24 -6
2 -7 -24 -6
3 -7 24 -6
4 7 24 -6
The fairleads will be dual axis with chain stoppers at the end with possibility to install and tension
during installation vessels. The fairlead type and design is well known and proven technology from
offshore installations in harsh weather conditions. The fairleads are assumed to have sufficient
capacity to sustain extreme loads as well as fatigue and corrosion during the whole design life. An
example of the suggested fairlead design shows the chain stopper, pulling wheel, dual axis and
connection bracket:
Figure 3.4 Dual axis fairlead with chain stopper (© Flint-tech and MacGregor Pusnes)
This fairlead design provides easy connection using vessels installation. The dual-axis connection
between the pontoon bracket and the chain stopper provides flexibility for difference in in-plane and
out-of-plane angles at the fairlead. The long arm with chain stopper reduces misalignments due
friction in the coupling joint, thus reducing interlink bending moments on the top (as described in

Concept development, floating bridge E39 Bjørnafjorden
Appendix M – Mooring system – K12 3 Mooring system description
SBJ-33-C5-AMC-26-RE-113 15.08.2019 / 0 Page 14 of 32
IPB/OPB calculations, see 3.4.5). The fairlead should be possible to replace after 50 years, but also if
necessary due to an unforeseen event causing damage.
The fairleads are installed on the bottom part of the pontoon, approximately 6 m below water line.
The low fairlead position is selected for two main reasons:
It keeps the chain always fully submerged and far away from oxygen in and close to the
splash zone that may increase the corrosion rate, thus reduce the design life of the top
mooring chain.
It reduces the risk of impact on fairlead and mooring line from ship collisions. For vessels
with draft less than 5-6 m, a collision will be less critical for the mooring system. For very
large and deep draft vessels, the mooring system may still be damaged by collision, but a
deeper fairlead will avoid several possible scenarios.
3.4.4 Mooring lines installation and replacement
The installation and tensioning of the mooring lines will be performed using vessels pulling through
the top end fairlead with chain stopper. Once correctly installed and pretensioned, the chain locker is
locked, and chain on the upper side of the chain stopper will be cut or hung off on the pontoon. The
installation principles of the mooring system are described in more details in Appendix N [2].
All anchors will be pre-installed about one year before the bridge installation. Installation of anchors
and mooring line connection between anchors and bridge pontoons will be performed using
installation vessels.
Mooring wire and top chain will be replaced after 50 year. Mooring system lines or anchors may also
need replacement due to unexpected damage/accidents. The replacement principle will be the same
as with the regular installation.
3.4.5 Mooring line fatigue
The fatigue life of mooring lines has been evaluated in accordance with DNVGL. The studless chains
have been compared against S-N curves using aD = 6E10 and m = 3.0 with the fatigue formula:
Where nc(s) is number of stress ranges (cycles), s is stress range in MPa, aD is the intercept
parameters of S-N curve and m is the slope of the S-N curve. Further details about the fatigue
calculations are presented in Appendix I [12].
The first fatigue calculations only includes fatigue damage due to the axial loading and includes a
factor 1.15 to account for OPB effects but does not follow the methods described by BV NI604 [13].
Calculations of the OPB/IPB fatigue can be calculated following the following simplified methodology:
1) Collect time series of tension and interlink angles of 5 links on top of chain.
2) Calculate the bending moments (including max sliding moment)
Interlink bending moment estimate formula:
𝑀𝑖(∝𝑖 , 𝑇, 𝑑) =𝜋𝑑3
16𝐶
𝑃(∝𝑖𝑛𝑡)
𝐺 + 𝑃(∝𝑖𝑛𝑡)(
𝑇
0,14𝑑2)
𝑎(∆∝𝑖)
(𝑑
100)
2𝑎(∝𝑖)+𝑏(∝𝑖)
Where:
αi Interlink angle, in degree.

Concept development, floating bridge E39 Bjørnafjorden
Appendix M – Mooring system – K12 3 Mooring system description
SBJ-33-C5-AMC-26-RE-113 15.08.2019 / 0 Page 15 of 32
T Mooring line tension, in kN.
d Chain diameter, in mm.
C = 354 and G = 0,93.
𝑃(∝𝑖𝑛𝑡) =∝𝑖𝑛𝑡+ 0.307𝛼𝑖𝑛𝑡3 + 0.048𝛼𝑖𝑛𝑡
5 𝑎1 = 0.439 𝑏1 = −0.433
𝑎(∝𝑖𝑛𝑡) = a1 + 𝑎2𝑡𝑎𝑛ℎ(𝑎3 ∝𝑖𝑛𝑡) 𝑎2 = 0.532 𝑏2 = −1.640
𝑏(∝𝑖𝑛𝑡) = 𝑏1 + 𝑏2𝑡𝑎𝑛ℎ(𝑏3 ∝𝑖𝑛𝑡) 𝑎3 = 1.020 𝑏3 = 1.320
In seawater, 𝑀𝑖(∝𝑖 , 𝑇, 𝑑) is limited by sliding moment between links:
𝑀𝑡ℎ𝑟𝑒𝑠ℎ𝑜𝑙𝑑 = 𝜇 𝑇 𝑑 2⁄
Where:
T Actual tension.
Friction coefficient, use 0.3 for seawater.
d Chain nominal diameter.
3) Calculate the stress from tension, OPB and IPB:
𝑑𝑐𝑜𝑟𝑟 = 𝑑𝑛𝑒𝑤 −𝐿𝑑
2𝑟𝑐𝑜𝑟𝑟
Where:
Ld Design life, year.
rcorr Corrosion rate, mm/year.
d Chain nominal diameter.
Stresses from tension and bending moments:
∆𝜎𝑇𝑇,𝑛𝑜𝑚. =2∆𝑇
𝜋𝑑𝑐𝑜𝑟𝑟2 , ∆𝜎𝑂𝑃𝐵,𝑛𝑜𝑚. =
16∆𝑀𝑂𝑃𝐵
𝜋𝑑𝑐𝑜𝑟𝑟3 , ∆𝜎𝐼𝑃𝐵,𝑛𝑜𝑚. =
2,3∆𝑀𝐼𝑃𝐵
𝜋𝑑𝑐𝑜𝑟𝑟3
4) Calculate the combined stress load:
∆𝜎𝑐𝑜𝑚𝑏𝑖𝑛𝑒𝑑 = 𝑍𝑐𝑜𝑟𝑟(∆𝜎𝑇𝑇 ± 𝑍𝑠∆𝜎𝑂𝑃𝐵 ± 𝑍𝑠∆𝜎𝐼𝑃𝐵)
Where:
Zcorr Stress concentration factor due to corrosion, use 1.08 if mid-life diameter loss is less than 5%.
Zs Stiffness variability factor [BV 3.2.1], use 1.06 for seawater [BV App.1, 2.2.2]
5) Include the effect of diameter on stress:
∆𝜎𝑓𝑎𝑐𝑡𝑜𝑟𝑒𝑑 = ∆𝜎𝑐𝑜𝑚𝑏𝑖𝑛𝑒𝑑 (𝑑
𝑑𝑟𝑒𝑓)
𝑘
= ∆𝜎𝑐𝑜𝑚𝑏𝑖𝑛𝑒𝑑 (𝑑
84)
0,15
Use ∆𝜎𝑓𝑎𝑐𝑡𝑜𝑟𝑒𝑑 instead of ∆𝜎𝑐𝑜𝑚𝑏𝑖𝑛𝑒𝑑 in fatigue calculations.
6) Calculate fatigue life using Miner sum:
𝐾 = 𝑁∆𝜎𝑐𝑜𝑚𝑏𝑖𝑛𝑒𝑑𝑚
With:
Log(K) = 12,575.
Concept development, floating bridge E39 Bjørnafjorden
Appendix M – Mooring system – K12 3 Mooring system description
SBJ-33-C5-AMC-26-RE-113 15.08.2019 / 0 Page 16 of 32
m = 3.
Total damage by Miner sum of all cycles is found:
𝑑𝑠𝑠 = ∑∆𝜎𝑐𝑜𝑚𝑏𝑖𝑛𝑒𝑑
𝑚
𝐾𝑐𝑦𝑐𝑙𝑒𝑠
Design Fatigue Factor 10 for chain to calculate final fatigue life.

Concept development, floating bridge E39 Bjørnafjorden
Appendix M – Mooring system – K12 3 Mooring system description
SBJ-33-C5-AMC-26-RE-113 15.08.2019 / 0 Page 17 of 32
3.5 Bridge layout
The moored pontoons and anchor positions are plotted shown below:
Figure 3.5 Mooring system on seabed map (top) and in Orcaflex model (middle and bottom)

Concept development, floating bridge E39 Bjørnafjorden
Appendix M – Mooring system – K12 3 Mooring system description
SBJ-33-C5-AMC-26-RE-113 15.08.2019 / 0 Page 18 of 32
3.5.1 Pontoon A13
Lines 1-4 are located on relatively flat seabed with soil and have suction anchors.
Figure 3.6 Pontoon A13 mooring - Top and 3D view
3.5.2 Pontoon A20
Anchors 5-8 are located on relatively flat seabed with soil and have suction anchors.
Figure 3.7 Pontoon A20 mooring - Top and 3D view

Concept development, floating bridge E39 Bjørnafjorden
Appendix M – Mooring system – K12 3 Mooring system description
SBJ-33-C5-AMC-26-RE-113 15.08.2019 / 0 Page 19 of 32
3.5.3 Pontoon A27
Anchors 9-12 are located on relatively flat seabed with soil and have suction anchors.
Figure 3.8 Pontoon A27 mooring - Top and 3D view
3.6 Restoring force
The plot below shows the restoring mooring force of each of the four moored pontoons A8, A16, A24
and A32. The offset considered is the transverse (y-direction) displacement of the pontoons.
The linear stiffness of approximately 1000 kN/m (shown by red line in figure below).
The restoring stiffness is relatively linear for ±2-3 m.
Above ±5 m a new and higher linear stiffness is established.
Figure 3.9 Mooring – restoring mooring force

Concept development, floating bridge E39 Bjørnafjorden
Appendix M – Mooring system – K12 3 Mooring system description
SBJ-33-C5-AMC-26-RE-113 15.08.2019 / 0 Page 20 of 32
The following plots shows mooring line load for each line with ± 20 m varying transverse offset of
the pontoon where the lines are connected. Force at offset zero represents the pretension level of
each mooring line, which is approximately 1500-2500 kN.
Figure 3.10 Mooring offset vs. mooring line loads – Pontoon A13
Figure 3.11 Mooring offset vs. mooring line loads – Pontoon A20

Concept development, floating bridge E39 Bjørnafjorden
Appendix M – Mooring system – K12 3 Mooring system description
SBJ-33-C5-AMC-26-RE-113 15.08.2019 / 0 Page 21 of 32
Figure 3.12 Mooring offset vs. mooring line loads – Pontoon A27

Concept development, floating bridge E39 Bjørnafjorden
Appendix M – Mooring system – K12 3 Mooring system description
SBJ-33-C5-AMC-26-RE-113 15.08.2019 / 0 Page 22 of 32
3.7 Anchor positions
Positions are given in UTM coordinates (zone 32). The anchor positions and corresponding depths for
all mooring systems are presented in the table below:
Table 3.8 Anchor positions
Anchor no
UTM coordinates
Northing Easting Depth
1 6 667 803 299 528 466
2 6 667 646 299 432 449
3 6 668 030 298 300 559
4 6 668 250 298 390 560
5 6 669 015 300 102 491
6 6 668 282 299 932 491
7 6 668 441 298 441 560
8 6 669 130 298 575 485
9 6 669 793 299 794 367
10 6 669 445 299 899 388
11 6 669 455 298 850 442
12 6 669 694 298 817 360
3.8 Line segment lengths and pretension
The lengths of mooring chain and steel wire are presented below:
All top chain lengths are 50 m.
All wire lengths are adjusted to have the desired pretension in each line.
All bottom chain lengths are 100 m.
The pretension of all mooring lines are found as explained in section 3.4.1.
Table 3.9 Line component lengths
Anchor no
Top chain Wire length Bottom chain Pretension
(m) (m) (m) (MN)
1 50 571 100 1.98
2 50 514 100 2.00
3 50 717 100 2.08
4 50 713 100 1.93
5 50 875 100 2.59
6 50 811 100 2.28
7 50 830 100 2.54
8 50 717 100 2.63
9 50 466 100 2.17
10 50 560 100 1.69
11 50 479 100 2.09
12 50 435 100 2.04

Concept development, floating bridge E39 Bjørnafjorden
Appendix M – Mooring system – K12 4 Analysis model
SBJ-33-C5-AMC-26-RE-113 15.08.2019 / 0 Page 23 of 32
4 Analysis model
The mooring system is analysed in a coupled time domain model using the Orcaflex software [14].
The mooring system is included in the global time domain model and calculations are performed
using the fully coupled bridge and mooring.
The bridge analysis model with mooring lines is seen from east below:
Figure 4.1 Analysis model – Side view
Top view showing line spread from pontoons A13, A20 and A27:
Figure 4.2 Analysis model – shaded top view
Shaded 3D view from east side showing bathymetry and mooring lines:
Figure 4.3 Analysis model – shaded 3D view

Concept development, floating bridge E39 Bjørnafjorden
Appendix M – Mooring system – K12 5 Analysis results
SBJ-33-C5-AMC-26-RE-113 15.08.2019 / 0 Page 24 of 32
5 Analysis results
Mooring lines are analysed for line loads (at top end) for extreme ULS, ALS and FLS conditions.
Notice that all calculations are performed using end of life dimensions, meaning corroded diameters
and corresponding load capacity. Reference is made to section 3.2.
5.1 Requirements
5.1.1 Mooring lines
Requirements to line safety factors are based on ISO 19901/7 [8] and NMA 998/09 [7]. NMA refers to
ISO, and the applied required minimum safety factors are taken from Table B.2 in ISO Annex B.2
(permanent moorings, dynamic analysis and Consequence Class 3):
Intact condition (ULS) must have safety factor > 2.20.
One failure (ALS ship collision) must have safety factor > 1.50 after failure and > 1.10 for
transient loads during failure.
Two failure (ALS line break) must have safety factor > 1.50 after failure and > 1.10 for
transient loads during failure.
5.1.2 Anchors
Requirements to anchor:
Suction anchors should be on locations with slope < 10 degrees and soil thickness > 10 m.
Gravity anchors should be on locations with slope < 5 degrees and soil thickness < 10 m.
The anchor design will be based on DNVGL code where a load factor of 1.4 is used on the
mean load component while a load factor of 2.1 is used for the dynamic load component
(consequence class 2). Details about mean and dynamic loads are currently not available so
for the preliminary anchor sizing a load factor of 2.0 was used. This is considered
conservative.
5.2 Main results
All presented mooring line loads are characteristic extreme values without load factors. Loads on
mooring lines and anchors are checked using these loads in combination with required safety factors.
Table 5.1 Mooring loads
Max load (MN) Pontoon Anchor
ULS 5.62 5.15
ALS line break 4.30
ALS ship collision 7.50
MBL (MN) 17.0 15.0
The maximum loads are compared against MBL at end of fatigue life (corroded chain). This gives top
chain MBL 17 MN and bottom chain 15 MN. Corresponding minimum line safety factors and
requirements are given in the table below:

Concept development, floating bridge E39 Bjørnafjorden
Appendix M – Mooring system – K12 5 Analysis results
SBJ-33-C5-AMC-26-RE-113 15.08.2019 / 0 Page 25 of 32
Table 5.2 Line safety factors
Safety Factor (-) Pontoon Anchor Required
ULS 3.02 2.90 > 2.20
ALS line break 3.95 > 1.50
ALS ship collision 2.27 > 1.10
During intact and damage condition, all mooring lines satisfy the minimum safety factors required.
All mooring lines are found to have fatigue life of at least 100 years.
Intact condition:
Maximum line intact load is 5.62 MN (at top end).
Minimum line intact safety factor is 3.02 (at top end).
Damage condition:
Maximum line damage load is 7.5 MN during ship collision. Required minimum safety factor
> 1.50 for regular damage > 1.10 during transient response after failure. The ALS condition
analysed gives the maximum transient loads during/after ship collision. This means all
mooring lines satisfy the minimum safety factors for damage condition.
Minimum line damage safety factor is 2.27.
All anchors locations are found acceptable for slope, soil thickness and other geotechnical
parameters evaluated for suction and gravity anchors. All anchors are sized based on calculated
intact line loads. The anchor holding capacity is found acceptable. Further details about the anchors
are given in Enclosure 1.
Further details about mooring line results are given in the sections below.
5.3 ULS line loads
Extreme line loads from worst intact condition is presented below. Loads are found for each line end
labelled ‘pontoon’ (top end) and ‘anchor’ (bottom end). Values presented are expected 1-hour
maxima based on combined loads from wind, waves and current. Extreme tide and temperature is
also included in the calculations. Maximum loads for each line are shown in table and figure below:

Concept development, floating bridge E39 Bjørnafjorden
Appendix M – Mooring system – K12 5 Analysis results
SBJ-33-C5-AMC-26-RE-113 15.08.2019 / 0 Page 26 of 32
Table 5.3 ULS extreme line loads
Intact condition Max load (MN)
ULS pontoon anchor
MooringLine1 3.86 3.31
MooringLine2 4.48 3.93
MooringLine3 4.36 3.75
MooringLine4 3.76 3.14
MooringLine5 4.08 3.58
MooringLine6 3.55 3.05
MooringLine7 3.73 3.17
MooringLine8 4.69 4.15
MooringLine9 5.62 5.15
MooringLine10 2.82 2.38
MooringLine11 4.70 4.14
MooringLine12 5.04 4.61
Max, all lines 5.62 5.15
Figure 5.1 ULS extreme line loads

Concept development, floating bridge E39 Bjørnafjorden
Appendix M – Mooring system – K12 5 Analysis results
SBJ-33-C5-AMC-26-RE-113 15.08.2019 / 0 Page 27 of 32
Detailed information with static, dynamic and total ULS load is shown below for top end (fairlead)
and bottom end (anchor) of line loads:
Table 5.4 Detailed line loads
Mooring line
Top end loads (kN) Anchor loads (kN)
total static dyn. total static dyn.
1 3.86 2.75 1.10 3.31 2.19 1.12
2 4.48 3.00 1.49 3.93 2.43 1.50
3 4.36 3.24 1.13 3.75 2.62 1.13
4 3.76 2.85 0.91 3.14 2.23 0.91
5 4.08 3.23 0.85 3.58 2.73 0.84
6 3.55 2.79 0.76 3.05 2.27 0.78
7 3.73 2.96 0.78 3.17 2.38 0.80
8 4.69 3.47 1.22 4.15 2.94 1.21
9 5.62 3.94 1.68 5.15 3.45 1.70
10 2.82 2.16 0.66 2.38 1.70 0.68
11 4.70 3.10 1.60 4.14 2.53 1.62
12 5.04 3.15 1.88 4.61 2.67 1.94
All 3.86 2.75 1.10 3.31 2.19 1.12
5.4 ALS line loads
5.4.1 Line break
For details about line break calculations, reference is made to Appendix G [4].
Removal of all anchor lines on one side of an anchor cluster was selected to investigate the
consequence of loss of mooring lines. This is a conservative approach as the requirement by ISO [8] is
loss of two mooring lines. It was selected as a risk mitigation measure to document the robustness of
the bridge, capturing the possibility that all anchors on one side of a mooring group is lost due to e.g.
underwater landslides. The loss of two (all) mooring lines on one side of a mooring cluster has been
considered for all moored pontoons.
Example of line break scenario is shown in figure below:
Figure 5.2 Example of loss of mooring group (pontoon 20, lines towards east removed)

Concept development, floating bridge E39 Bjørnafjorden
Appendix M – Mooring system – K12 5 Analysis results
SBJ-33-C5-AMC-26-RE-113 15.08.2019 / 0 Page 28 of 32
5.4.2 Ship collision
For details about ship collision calculations, reference is made to Appendix J [15].
Several ship collision scenarios were analysed and the resulting extreme loads on the bridge
evaluated. Extreme line loads during ship collision has been calculated. The extreme line loads are
presented in the figure and table below, including the worst line load for all analysed ship collisions.
Loads are presented for line top end, so anchor loads are expected to be slightly lower than these
values.
5.4.3 ALS results
Maximum line loads in damage condition for each line is shown in table below:
Extreme line loads from line break are found to be 4.3 MN.
Extreme line loads from ship collision are found to be 7.5 MN.
Table 5.5 ALS extreme line loads – Top end
Mooring line
Line break (MN)
Ship collision (MN)
1 3.0 6.8
2 3.1 7.5
3 3.9 1.3
4 3.7 1.2
5 3.3 6.4
6 3.0 6.0
7 3.3 1.8
8 3.6 1.9
9 3.1 6.8
10 2.2 3.6
11 4.3 1.2
12 4.3 1.3
Max 4.3 7.5
5.5 Minimum safety factors
Corresponding minimum safety factors are found using the MBL during end of design life for top
chain (17 MN) and bottom chain (15 MN):

Concept development, floating bridge E39 Bjørnafjorden
Appendix M – Mooring system – K12 5 Analysis results
SBJ-33-C5-AMC-26-RE-113 15.08.2019 / 0 Page 29 of 32
Table 5.6 ALS minimum line safety factors
Mooring line
ULS ALS
ship Line break -
top end Line break - bottom end
1 4.41 2.50 5.66 4.51
2 3.79 2.27 5.48 3.81
3 3.89 13.07 4.36 3.99
4 4.52 14.16 4.59 4.76
5 4.16 2.66 5.15 4.18
6 4.79 2.83 5.66 4.90
7 4.55 9.44 5.15 4.71
8 3.62 8.94 4.72 3.60
9 3.02 2.50 5.48 2.90
10 6.02 4.72 7.72 6.29
11 3.61 14.16 3.95 3.61
12 3.37 13.07 3.95 3.24
Min 3.02 2.27 3.95 2.90
5.6 FLS line loads
Fatigue calculation of the mooring line loads are presented below. Values presented are fatigue life
in years of top and bottom chain based on wave scatter data. Further details about the fatigue
calculations are presented in Appendix I [15].
All mooring lines have fatigue life of at least 100 years. See details below:
Figure 5.3 Mooring line fatigue life
These results are based on a factor of 1.15 used in the fatigue calculations to include the bending
contributions on the mooring line fatigue life.
The line fatigue calculations have also been checked with simplified estimations due to OPB/IPB as
described in section 3.4.5. A selection of conditions known to have significant damage contribution
was analysed using the OPB calculation methods.

Concept development, floating bridge E39 Bjørnafjorden
Appendix M – Mooring system – K12 5 Analysis results
SBJ-33-C5-AMC-26-RE-113 15.08.2019 / 0 Page 30 of 32
The method described in section 3.4.5 was followed for each of the 12 mooring lines. For each line,
the bending moments and corresponding contributions to the fatigue life was calculated.
The results from the simplified BV method for estimation of chain moments calculates the bending
moment factor for fatigue loads to be close to the default factor 1.15 used in the initial mooring
fatigue life calculations. This suggests that OPB/IPB on top end of the chain is relatively small and will
have a minor impact on the fatigue life. Fatigue life for top chain is presented below:
Figure 5.4 Mooring line fatigue life – OPB/IPB fatigue
Further details about mooring line fatigue life and OPB/IPB contribution is found in appendix I [12].

Concept development, floating bridge E39 Bjørnafjorden
Appendix M – Mooring system – K12 6 References
SBJ-33-C5-AMC-26-RE-113 15.08.2019 / 0 Page 31 of 32
6 References
[1] AMC, “SBJ-32-C5-AMC-90-RE-010 : Design basis Rev. 1,” 31-08-2019.
[2] AMC, “SBJ-33-C5-AMC-28-RE-114 : Appendix N: Fabrication and Marine Operations Rev. 0,” 15-08-2019.
[3] AMC, “SBJ-33-C5-AMC-90-RE-106 : Appendix F: Global Analyses - Modelling and assumptions Rev. 0,” 15-08-2019.
[4] AMC, “SBJ-33-C5-AMC-90-RE-107 : Appendix G: Global Analyses - Response Rev. 0,” 15-08-2019.
[5] AMC, “SBJ-33-C5-AMC-21-RE-108 : Appendix H: Global Analyses - Special studies Rev. 0,” 15-08-2019.
[6] DNV GL, “DNVGL-OS-E301 "Position mooring",” July 2018.
[7] Norwegian Maritime Authority, “Anchoring regulations 09,” 10 july 2009.
[8] ISO, “ISO 19901-7 "Stationkeeping systems for floating offshore structures and mobile offshore units",” 2013-05-01.
[9] AMC, “SBJ-33-C5-AMC-04-RE-115 : Appendix O: Material technology and steel in marine environment Rev. 0,” 15-08-2019.
[10] AMC, “SBJ-33-C5-AMC-22-DR-701 : Mooring, K12 - Mooring line segmentation arrangement Rev. 1,” 15.08.2019.
[11] AMC, “SBJ-33-C5-AMC-22-DR-601 : Anchor, K12 - Suction anchor, typical Rev. 1,” 15.08.2019.
[12] AMC, “SBJ-33-C5-AMC-22-RE-109 : Appendix I: Fatigue analyses Rev. 0,” 15-08-2019.
[13] Bureau Veritas, “NI 604 DT R00 E "Fatigue of Top Chain of Mooring Lines due to In-plane and Out-of-plane Bendings",” October 2014.
[14] Orcina, “Orcaflex v10.3,” 2019.
[15] AMC, “SBJ-33-C5-AMC-27-RE-110 : Appendix J: Ship collision Rev. 0,” 15-08-2019.
[16] AMC, “10205546-NOT-034 : Design brief Rev.0,” 28-01-2019.

Concept development, floating bridge E39 Bjørnafjorden
Appendix M – Mooring system – K12 7 Enclosures
SBJ-33-C5-AMC-26-RE-113 15.08.2019 / 0 Page 32 of 32
7 Enclosures
Enclosure 1 10205546-12-NOT-182 – Geotechnics anchors K12
Enclosure 2 10205546-12-NOT-090 – Geotechnical evaluation of anchor concepts

Concept development, floating bridge
E39 Bjørnafjorden
Appendix M – Enclosure 1
10205546-12-NOT-182
Geotechnics anchors K12

MEMO
PROJECT Concept development, floating bridge E39 Bjørnafjorden
DOCUMENT CODE 10205546-12-NOT-182
CLIENT Statens vegvesen ACCESSIBILITY Restricted
SUBJECT Geotechnics anchors K12 PROJECT MANAGER Svein Erik Jakobsen
TO Statens vegvesen PREPARED BY Knut Schrøder
COPY TO RESPONSIBLE UNIT AMC
SUMMARY
This document considers anchors for bridge concept K12. Issues related to bridge foundations at each end towards land have not been part of the study covered by this memo. The available information about bathymetry and sediment thickness was expanded in 2018 when a seismic survey was performed to the east of the previously investigated area. The interpreted sediment thickness has been presented by an isopach map. In addition, some simplified slope stability calculation results for the old and new areas are included to give a more complete overview of the situation in the bridge crossing areas. Based on some defined criteria with respect to slope stability and sediment thickness, anchor suitability maps were established.
The static slope stability calculations were in Phase 3 performed on a total stress basis only. In the current Phase some of the profiles from Phase 3 have been re-calculated based on the effective stress approach. The results showed that the estimated safety factor for static slope failure is higher on effective stress basis as compared to the results of the total stress analysis.
The loads due to ship impact have been governing for the anchor design. In general, the a sizing of the anchors have been performed based on load and soil material factors for suction anchor design according to the DNVGL code for Consequence Class 2. For ship collision a load factor equal to 1.0 was used.
K12 is suggested moored by 12 suction anchors where the anchor locations have been selected by trying to avoid areas with nearby steep slopes. The suggested anchor diameter is for all but two anchors D=6 m and the skirt penetration depth vary between 10m and 18 m. The exception at two locations is an anchor with D=8 m and skirt penetration depth of 14 m.
Near each of the suggested anchor locations it has been checked that it is possible to relocate an anchor if required. Industry practice has often been to require a distance >3 diameters from the target location if the first installation fails and the anchor must be relocated.
Significant earthquakes may trigger submarine slope instabilities. A preliminary hazard assessment for all anchor locations have been included in Attachment 3. The assessment is based on the experience from the more detailed evaluations that were made in Phase 3 of the Bjørnafjorden project in addition to the information gathered about sediment thickness and steepness of the surrounding potentially unstable slopes nearest to the current anchor locations. Oversized suction anchors, where possible; dependant on the thickness of the soft sediments, are capable of resisting loads of a certain level from submarine slides. This might be considered a mitigation measure or a way to reduce the risk of having loss of anchor due to a submarine slide. This can only be achieved at locations where the sediment thickness is large (>25 m). Alternatively, the use of plate anchors (SEPLA type) could be considered at about 50% of the anchor locations where the top of the plate anchor could be penetrated to a depth such that top of plate is located about 10 m below seabed level.
With respect to future work, it is recommended to revisit the slope stability assessment (both static and dynamic) when the soil parameters based on the 2018 soil investigation become available. The assessment should include both effective and total stress slope stability calculations near the actual anchor positions. It is also recommended to combine the new soil data, the results of the slope stability analyses and the age dating interpretation of existing landslides in Bjørnafjorden into a probabilistic design approach in which the probability of failure is addressed rather than only consider slope stability failure from a deterministic approach. There are still significant uncertainties with respect to landslide depth, the total mass involved and landslide's properties. It has been shown that deep ploughing slides are most critical to potential loss of anchors. In order to better evaluate the criticality of a landslide and to be
Unntatt offentligheten Offentleglova - §21

10205546-12-NOT-182 15.08.2019 / 0 Page 2 of 67
able to suggest potential mitigation measures, more information should be gathered to better understand when these landslides occurred and under what climatically/geological conditions the landslides were initiated. For specific targets, one could consider running a full 3D slope stability analysis and coupling the result with quasi-3D landslide dynamics.
The effect of extended soil data base should also be investigated with respect to anchor holding capacity, anchor installation and thereby anchor sizes.

10205546-12-NOT-182 15.08.2019 / 0 Page 3 of 67
Table of contents 1 Introduction .................................................................................................................................. 4 2 Integration of results from 2018 acoustic survey ......................................................................... 4 3 Screening tool results ................................................................................................................... 7
Slope stability with effect of earthquake ............................................................................. 7 Static slope stability ............................................................................................................ 13
3.2.1 Methodology .............................................................................................................. 13 3.2.2 Soil parameters and material model .......................................................................... 14 3.2.3 Results ......................................................................................................................... 15 Feasibility map for anchor types ........................................................................................ 18 Attribute maps and anchor types for K12 .......................................................................... 20 Hazard assessment for anchors at K12 ............................................................................... 21
4 K12 suction anchor sizing ........................................................................................................... 22 Intact undrained shear strength ......................................................................................... 22 Loads at seabed and load factors ....................................................................................... 23 Chain configuration analysis ............................................................................................... 26
4.3.1 Calculation procedure ................................................................................................ 26 4.3.2 Chain characteristics ................................................................................................... 28 4.3.3 Results ......................................................................................................................... 28 Holding capacity ................................................................................................................. 28
4.4.1 Calculation procedure ................................................................................................ 28 4.4.2 Results ......................................................................................................................... 31 4.4.3 Comment regarding potential use of other anchor types .......................................... 33
Comment regarding potential settlements due to anchor weight and creep due to permanent loads ......................................................................................................................... 34 Skirt penetration resistance ............................................................................................... 34
5 References .................................................................................................................................. 39 6 Attachments ............................................................................................................................... 40
Attachment 1 – K12 hazard attribute maps for anchor clusters 1-3 .................................. 40 Attachment 2 – Landslide impact on anchors .................................................................... 44 Attachment 3 – Evaluation of anchor locations ................................................................. 55

10205546-12-NOT-182 15.08.2019 / 0 Page 4 of 67
1 Introduction Four conceptual floating bridge designs have been evaluated in this concept development Phase. The recommended concept is K12 which is the curved floating bridge with fixed ends and mooring system. K12 is moored by 12 suction anchors connected to 3 different pontoons along the bridge. See illustration on Figure 1-1. The anchor sizing has been revisited compared to previous stages and is now based on final loads and the load and soil material factors recommended by the DNVGL code for suction anchor design (DNVGL, 2017).
Figure 1-1 Illustration of bridge concept K12
2 Integration of results from 2018 acoustic survey Samples and in situ geotechnical data at 5 locations across the fjord area for the bridge crossing were collected in 2016 (NGI, 2016 a, b, c). In addition, sub-bottom profiling data were collected by DOF SubSea in 2016 covering most of the bridge crossing area. However, to provide information also in the areas to the East of the curved bridge with fixed ends, a new seismic survey was performed in 2018. Figure 2-1 illustrates the location of the extended survey area from 2018.

10205546-12-NOT-182 15.08.2019 / 0 Page 5 of 67
Figure 2-1 Overview of acoustic survey lines including extended area for 2018
Based on the given interpretation of all the sub-bottom profiling data (including the 2018 survey) that mapped the top of the acoustic basement, the values have been converted from time to depth to provide an isopach map. The isopach map shows the expected thickness of the soil deposits on top of the acoustic basement, see Figure 2-2.

10205546-12-NOT-182 15.08.2019 / 0 Page 6 of 67
Figure 2-2 Isopach or sediment thickness above the acoustic basement. The triangles numbered 1-5 illustrate locations of the soil boreholes. Bridge line K12 is used as illustration.

10205546-12-NOT-182 15.08.2019 / 0 Page 7 of 67
3 Screening tool results
Slope stability with effect of earthquake
In phase 3 of the Bjørnafjorden floating bridge study NGI conducted an initial screening of the slope stability in Bjørnafjorden using an in-house computer program. The program discretises the three-dimensional topographic and soil properties data into equally sized blocks. For blocks on the soil surface, the program calculates the slope angle as the angle between the highest and lowest edge points of the surface face. Blocks below the surface take the slope angle of the block directly above. The program then performs one-dimensional (1D) infinite static and pseudo-static slope stability analyses as well as estimates the seismically induced displacements and transient shear strains.
In Phase 3 the above referred geohazard assessment due to earthquake was based on the simplified methodology specified in Eurocode 8 (2014) while improved seismic design values are now available based on a site specific probabilistic seismic hazard analysis (PSHA) estimated by NORSAR (2018). It is recommended that, if additional earthquake analyses are performed in the future, the results of the PSHA should be used as these are more scientifically rigorous and accurate than the simplified procedure used in the Phase 3 geohazard assessment. However, comparison of the seismic design values used in the Phase 3 geohazard assessment and those estimated by the site specific probabilistic seismic hazard analysis (PSHA) are not too different such that the result is not likely to be very different either. As a preliminary and simplified approach, the seismic geohazard evaluation performed in Phase 3 has therefore been repeated with the same input as in Phase 3 but by extending the investigated area to cover the eastern part that was surveyed in 2018.
Figure 3-1 compares the pseudo-static factors of safety calculated using PGA on rock = 135.7 cm/s2 (phase 3 reports) and for PGA on rock = 130.3 cm/s2 (average value from the PSHA).

10205546-12-NOT-182 15.08.2019 / 0 Page 8 of 67
Figure 3-1 Minimum pseudo-static factor of safety over the top 20 meters for (left) PGA on rock = 135.7 cm/s2 and for (right) PGA on rock = 130.3 cm/s2.
Figure 3-1 shows that the pseudo-static factor of safety is not significantly different when comparing the Phase 3 PGA on rock= 135.7 cm/s2 with the average value suggested from the new PSHA = 130.3 cm/s2. As a more advanced method, the estimated transient shear strain using the model described in NGI (2017) for the 2750 yrs and 10000 yrs return period earthquake is shown in Figure 3-2 and Figure 3-3. The maximum allowed shear strain for a dynamic analysis should be less than 5% to avoid failure during an earthquake and less than 3% in order to avoid post-earthquake static failure of the slope due to a build-up of excess pore pressure caused by earthquake shaking (SVV, 2018).

10205546-12-NOT-182 15.08.2019 / 0 Page 9 of 67
Figure 3-2 Maximum transient shear strain map (2750 yr earthquake return period), from NGI's screening tool using the infinite slope model for the area of interest (includes 2018 survey). Bridge line K12 used as illustration but given results are valid for all bridge lines

10205546-12-NOT-182 15.08.2019 / 0 Page 10 of 67

10205546-12-NOT-182 15.08.2019 / 0 Page 11 of 67
Figure 3-3 Maximum transient shear strain map (10000 yr earthquake return period), from NGI's screening tool using the infinite slope model for the area of interest (includes 2018 survey). Bridge line K12 used as illustration but given results are valid for all bridge lines.
As a result of the screening tool analyses, the local static factors of safety are shown on Figure 3-4. The only information that is different from Phase 3 is that the area covered by the 2018 seismic survey has also been analysed.

10205546-12-NOT-182 15.08.2019 / 0 Page 12 of 67
Figure 3-4 Static factor of safety using the infinite slope model for the area of interest (includes 2018 survey area). Bridge line K12 used as illustration but given safety factors are valid for all bridge alternatives

10205546-12-NOT-182 15.08.2019 / 0 Page 13 of 67
Static slope stability
Static 2D slope stability analyses performed on a total stress basis are presented in report SBJ-31-C3-MUL-02-RE-100 (NGI, (2017c).
“NGI modelled all of the profiles as a clay layer over a stiff material. Like NGI (2016b), NGI conducted multiple analyses for each profile by removing the part of the slope that failed during the first safety analysis and re-calculating the factor of safety for the modified geometry. NGI repeated this procedure until the static and pseudo-static factors of safety were equal to or greater than 1.5 and 1.2, respectively, or the soil around the anchors failed. NGI used static and pseudo-static factors of safety of 1.5 and 1.2 based on comments from SVV.”
The design basis SVV (2018) requests that slope stability analyses shall be performed both on total stress and effective stress basis. A selection of profiles defined from NGI (2017c) were analysed on an effective stress basis (drained) and the resulting Factors of Safety (FoS) are thereafter compared to the results presented in NGI (2017c) for the same profile.
3.2.1 Methodology
PLAXIS 2D (2018) was used to analyse the slope stability. The study presented in NGI (2017c) was performed by conducting multiple analyses for each profile by removing the part of the slope that failed during the first safety analysis and re-calculating the FoS for the modified geometry. The effective stress analyses presented within this section is performed for the first phase only, and the resulting FoS is compared to the result from the total stress analysis. The difference in the FoS calculated by a total stress or an effective stress analysis was thereby revealed.
The model geometry used in the effective stress analysis is identical to the model used in the total stress analysis.
Total stress slope stability analyses were performed for 40 profiles. The selection of profiles for effective stress slope stability analysis was made with emphasis to cover a range of profiles which is considered representative for the area. The profiles checked in the effective stress analyses are marked with a light green line in Figure 3-5. The analysed profiles correspond to profile no. 3, 9, 16 and 23.

10205546-12-NOT-182 15.08.2019 / 0 Page 14 of 67
Figure 3-5. Effective stress slope stability analyses indicated with light green line. Black lines indicated total stress slope stability analyses profiles [1]. The map and anchor positions are from phase 3 evaluations.
3.2.2 Soil parameters and material model
The soil layering is identical to the previous total stress analysis model; thus, it is referred to NGI (2017c) for further details. All profiles were modelled with a clay layer over a stiff material. The elevation of the seafloor and the thickness of the soft clay layer were determined from the bathymetry and isopach data NGI (2017c).
The Mohr-Coulomb material model was used to model the clay layer. The FE code PLAXIS 2D, with drainage type “drained” was used to analyse the problem. The material properties values were found from NGI (2016c).

10205546-12-NOT-182 15.08.2019 / 0 Page 15 of 67
The report NGI (2016c) presents summaries of effective stress paths from triaxial undrained tests performed on intact specimens.
The interpretation NGI (2016c) recommends a common set of failure lines in compression and extension as follows:
a = 2 kPa
u’ = 32°
Where ‘is the effective stress friction angle and a is the attraction intercept.
The constrained modulus, M, is linearly increasing from 200 – 5200 kN/m2 at depth 0 – 46 m below seafloor NGI (2016c). Constant Eoed = 1000 kN/m2 is used in the analysis.
The parameters used in the MC material model is presented in Table 3-1.
Table 3-1. Material parameters, Mohr Coulomb – drained.
E 624 [kN/m2]
0.35 [-]
G 231 [kN/m2]
Eoed 1001 [kN/m2]
Cref 1.25 [kN/m2]
32 [°]
0 [°]
einit 0.65 [-]
’unsat 6.5* [kN/m3]
'sat 6.5* [kN/m3]
K0 0.55 [-]
tension cut-off yes [-] *)Water is not present in the model
3.2.3 Results
The calculated Factor of Safety (FoS) for the four profiles analysed on an effective stress, drained basis is listed in Table 3-2. FoS calculated on total stress basis NGI (2017c) for the same profiles are also presented in this table. Note that the failure surface may vary when comparing the same profile but using a different calculation basis (total stress vs. effective stress).
The FoS calculated on effective stress basis is larger than the FoS calculated on a total stress basis when comparing identical profiles. This conclusion is well aligned with the general expectation when comparing the two different approaches of slope stability calculations.
It is therefore concluded that there is at present no need to perform slope stability analyses on an effective stress basis on all 40 profiles – as the total stress analyses apparently are more critical.
The calculated failure mechanisms for the four profiles are presented in Figure 3-6 to Figure 3-9 (the failure mechanisms are illustrated by plotting “incremental displacements”).

10205546-12-NOT-182 15.08.2019 / 0 Page 16 of 67
Table 3-2. Calculated Factor of Safety (FoS).
Profile T.St.* E.St.**
no. FoS FoS
3 1.13 1.81
9 1.14 1.91
16 1.05 1.56
23 1.10 1.88 *) Total stress analysis **) Effective stress, drained, analysis
Figure 3-6. Profile 3. FoS = 1.81.
Figure 3-7. Profile 9, FoS = 1.91.

10205546-12-NOT-182 15.08.2019 / 0 Page 17 of 67
Figure 3-8. Profile 16, FoS = 1.56.
Figure 3-9. Profile 23, FoS = 1.88.

10205546-12-NOT-182 15.08.2019 / 0 Page 18 of 67
Feasibility map for anchor types
To identify locations where the various anchor types may be feasible, a list of limiting conditions
was used.
Table 3-3 Summary of limiting conditions/constraints on the different anchor types.
Anchor Type Maximum seabed slope [°]
Soil thickness [m]
Suction anchors < 10 > 10
Gravity anchors < 5 < 10
Combined anchors < 5 < 20
Plate anchors <10 >10
Figure 3-10 presents an anchor feasibility map based on the anchor criteria given in Table 3-1 combined with a required factor of safety above 1.4 for global stability.

10205546-12-NOT-182 15.08.2019 / 0 Page 19 of 67
Figure 3-10 Summary of suitable anchor locations.

10205546-12-NOT-182 15.08.2019 / 0 Page 20 of 67
Attribute maps and anchor types for K12
With respect to the hazards and risks to the anchor clusters and bridge concepts, all of the attributes are compiled and zoomed in per anchor cluster for the bridge concepts. Attachment 1 contain hazard attribute maps for K12. The basic hazard attributes are:
Bathymetry/topography
Slope angle map
Fjord floor azimuth map
Sediment thickness (isopach)
Static slope stability FoS (factor of safety)
Maximum transient shear strain for 2750 yr recurrence period
Watershed analysis map that was derived from the bathymetry and showing streams, ridges as well as boundaries between different drainage areas.
Interpretation map, which combines key elements from the analysis. The attributes or elements used are:
o bathymetry contours; o infrastructure (bridge line, moored pontoons, proposed anchor locations); o geotechnical borehole locations; o landslide areas (origins with blue shaded areas, deposits as green shaded areas); o areas in which the transient shear strain exceeds 5% (red shaded areas)
A summary of some key figures with reference to the actual anchor locations is given in Tables 3-2 and 3-3.
Table 3-2 Bridge K12 Summary of main attributes and suggested anchor types
Transient Transient Anchor
Water Sediment Slope Slope Shear shear type
X Y Anchor depth, thickness, angle stability strain strain
ID (m) (m) (deg) (FoS) (%) (%)
2750 yrs 10000 yrs
299528 6667803 1 -468.3 20.9 6.3 2.92 0.27 1.33 S
299432 6667646 2 -449.3 21.7 4.4 4.22 0.27 1.18 S
298300 6668030 3 -559.6 45.2 0.7
25.61 0.25 0.79 S
298390 6668250 4 -560.5 29.7 1.5
11.88 0.17 0.79 S
300102 6669015 5 -500.7 18.8 2.2 8.50 0.20 0.89 S
299932 6668282 6 -541.7 25.5 1.1
17.00 0.20 0.77 S
298441 6668441 7 -562.9 38.0 0.2
74.97 0.37 0.90 S
298575 6669130 8 -488.8 24.4 2.5 7.26 0.20 0.93 S
299794 6669793 9 -368.1 16.2 0.7
26.24 0.25 0.78 S
299899 6669445 10 -386.6 14.0 0.6
31.79 0.27 0.78 S
298850 6669455 11 -442.9 17.7 3.1 6.06 0.24 1.06 S

10205546-12-NOT-182 15.08.2019 / 0 Page 21 of 67
298817 6669694 12 -360.0 15.1 4.5 4.20 0.31 1.34 S
At all 12 anchor locations suction anchors are applicable. Anchor sizes for the given loads are summarized in Section 4.
Hazard assessment for anchors at K12
Potential hazards related to slope instability for the different anchor clusters for bridge concept K12 were evaluated. The assessment is based on previous analysis by NGI (NGI, 2016), as well as the hazard maps for the anchors/anchor clusters as presented in Attachment 1. It is important to note that AMC has not performed more slope stability analyses (2D static, pseudo-static, dynamic) or landslide dynamics (quasi-2D or quasi-3D). One must bear in mind that several of the anchor clusters are distant from the previous anchor locations of Phase 3. This is particularly so for K12, as the anchoring layout is changed to 12 anchors from the previous 32 anchors. It is therefore recommended to update the hazard assessment for the selected concept in the next phase. There are still significant uncertainties with respect to landslide depth, the total mass involved and landslide's properties. It has been shown that deep ploughing slides are most critical to potential loss of anchors. To better evaluate the criticality of a slide and to be able to suggest potential mitigation measures, more information should be gathered to better understand when these slides occurred and under what climatically/geological conditions the slides were initiated.
Bridge concept K12
All the anchor locations are applicable. It appears from Table 3.2 that the slope at the anchor locations in general is small or limited and there is favourable thickness (>14 m) of the soft sediments. The thickness of soft sediments is limited for some anchors - 9, 10 and 12. However, for the given loads acceptable suction anchor sizes are found also for these locations.
Some of the anchors are located near to slopes where slides may take place and potentially hit the anchors. It has been checked that alternative anchor locations in case of unsuccessful anchor installation or other reasons for the need for alternative locations can be found.
An evaluation of all the anchor locations is made in Attachment 3 based on selected profiles of the sea floor slope and sediment thicknesses near the anchor locations. There are 3 anchor locations which are in the vicinity of a slope that is considered to potentially fail if a design earthquake should occur. For the remaining 9 anchors their locations are less likely to be hit by a slide.

10205546-12-NOT-182 15.08.2019 / 0 Page 22 of 67
4 K12 suction anchor sizing
Intact undrained shear strength
The low estimate intact undrained shear strength in compression (suC) was used as basis for the
holding capacity calculations and was taken from (NGI, 2016) 20150804-05-R. Reference is made to Figure 4.1.
Figure 4.1 Design profiles for undrained shear strength in compression versus depth
In addition the following ratios between undrained shear strength in compression (su
C ), in extension (su
E ) and direct shear (suD ) were considered (NGI, 2016);
suD/ su
C=0.75
suE/ su
C=0.60
For chain configuration analyses and skirt penetration resistance analysis it is common practice to investigate a range of the undrained shear strength like both low estimate and high estimate.
It is noted that in a detailed anchor design the effect of cyclic loading shall also be addressed. This requires information about both anchor chain time load history as well as results from advanced soil laboratory tests for cyclic loading which is not available in this phase of the project. The anchor sizing has therefore been based on static shear strengths which in most cases for suction anchor

10205546-12-NOT-182 15.08.2019 / 0 Page 23 of 67
design is found to be conservative. The cyclic loading is one-way and the rate of dynamic loading is much faster than the rate of loading used to determine the static shear strength in a triaxial or direct simple shear laboratory strength test. This "rapid" loading rate will compensate for the reduction in strength due to the effect of repeated cyclic loading and this is the reason why it often can be conservative to assume a cyclic strength equal to the static strength.
Loads at seabed and load factors
The loads given at seabed and the DNVGL load factors (DNVGL, 2017) that have been used in this sizing are shown in Tables 4.1 - 4.5.
Table 4.1 Characteristic and factored loads at seabed - ULS
Anchor Tension (MN)
Angle at seabed (deg)
Mean component (MN)
Dynamic component (MN)
Load factor mean component
Load factor dynamic component
Factored load (MN)
1 3.31 39.7 2.19 1.12 1.4 2.1 5.42
2 3.93 41.9 2.43 1.50 1.4 2.1 6.55
3 3.75 39.7 2.62 1.13 1.4 2.1 6.05
4 3.14 40.1 2.23 0.91 1.4 2.1 5.03
5 3.58 28.3 2.73 0.84 1.4 2.1 5.60
6 3.05 30.4 2.27 0.78 1.4 2.1 4.82
7 3.17 34.4 2.38 0.80 1.4 2.1 5.00
8 4.15 33.6 2.94 1.21 1.4 2.1 6.66
9 5.15 36.0 3.45 1.70 1.4 2.1 8.40
10 2.38 32.7 1.70 0.68 1.4 2.1 3.80
11 4.14 43.9 2.53 1.62 1.4 2.1 6.93
12 4.61 37.3 2.67 1.94 1.4 2.1 7.81
Table 4.2 Characteristic and factored loads at pontoon – ALS (ship collision)
Anchor Tension (MN)
Angle at seabed (deg)
Mean component (MN)
Dynamic component (MN)
Load factor mean component
Load factor dynamic component
Factored load (MN)
1 9.9 39.7 NA NA 1.0 1.0 9.9
2 11.3 41.9 NA NA 1.0 1.0 11.3
3 8.8 39.7 NA NA 1.0 1.0 8.8
4 7.7 40.1 NA NA 1.0 1.0 7.7
5 8.1 28.3 NA NA 1.0 1.0 8.1
6 7.8 30.4 NA NA 1.0 1.0 7.8
7 8.1 34.4 NA NA 1.0 1.0 8.1
8 11.5 33.6 NA NA 1.0 1.0 11.5
9 9.4 36.0 NA NA 1.0 1.0 9.4
10 4.6 32.7 NA NA 1.0 1.0 4.6
11 7.9 43.9 NA NA 1.0 1.0 7.9
12 9.7 37.3 NA NA 1.0 1.0 9.7

10205546-12-NOT-182 15.08.2019 / 0 Page 24 of 67
Figure 4.2 Example of line break scenario
Table 4.3 Characteristic and factored loads at seabed – ALS (2 lines damaged in one cluster)
Anchor Tension (MN)
Angle at seabed (deg)
Mean component (MN)
Dynamic component (MN)
Load factor mean component
Load factor dynamic component
Factored load (MN)
1 4.00 39.7 1.83+1.51) 0.67 1.0 1.25 4.17
2 4.16 41.9 2.09+1.5 0.82 1.0 1.25 4.61
3 4.62 39.7 2.26+1.5 0.86 1.0 1.25 4.83
4 4.39 40.1 2.06+1.5 0.83 1.0 1.25 4.60
5 4.30 28.3 2.39+1.5 0.47 1.0 1.25 4.48
6 4.16 30.4 2.17+1.5 0.51 1.0 1.25 4.31
7 4.33 34.4 2.32+1.5 0.51 1.0 1.25 4.45
8 4.67 33.6 2.44+1.5 0.72 1.0 1.25 4.85
9 4.15 36.0 1.94+1.5 0.70 1.0 1.25 4.32
10 3.86 32.7 1.71+1.5 0.66 1.0 1.25 4.03
11 5.34 43.9 2.50+1.5 1.33 1.0 1.25 5.67
12 5.42 37.3 2.49+1.5 1.42 1.0 1.25 5.77 1) The effect of tide and temperature has been included by adding 1.5 MN to the calculated loads

10205546-12-NOT-182 15.08.2019 / 0 Page 25 of 67
Table 4.4 Characteristic and factored loads at seabed – ALS 10 000 yrs wind (load factors =1.0)
Anchor Tension (MN)
Angle at seabed (deg)
Mean component (MN)
Dynamic component (MN)
Estimated component due to tide (MN)
Estimated component due to temperature (MN)
Total load (MN)
1 3.56 39.7 1.87 1.74 0.5 1.0 5.06
2 4.02 41.9 1.96 2.14 0.5 1.0 5.52
3 3.32 39.7 1.99 1.35 0.5 1.0 4.82
4 3.08 40.1 1.82 1.28 0.5 1.0 4.58
5 3.49 28.3 2.30 1.20 0.5 1.0 4.99
6 3.26 30.4 2.02 1.25 0.5 1.0 4.76
7 3.40 34.4 2.15 1.24 0.5 1.0 4.90
8 4.01 33.6 2.35 1.67 0.5 1.0 5.51
9 4.25 36.0 1.96 2.52 0.5 1.0 5.75
10 2.49 32.7 1.48 1.02 0.5 1.0 3.99
11 3.51 43.9 1.63 2.23 0.5 1.0 5.01
12 3.48 37.3 1.67 1.82 0.5 1.0 4.98
Based on the loads given in Tables 4.1-4.4 a summary table has been established comparing the different factored loads and based on this comparison the governing load for each anchor is found. The factored load at seabed suggested used for the anchor design is found by rounding up the numbers and at the same time trying to limit the number of cases some. Reference is made to Table 4.5. Table 4.5 Comparison of factored load cases and suggested design load at seabed
Note: The numbers in red shows the governing load case for each of the anchors.
Anchor ULS ALS ALS ALS Maximum Suggested
factored factored factored factored factored design
ship impact 2 line failure 10000yr wind line load load
(MN) (MN) (MN) (MN) (MN) (MN)
1 5.42 9.9 4.17 5.06 6.8 11.5
2 6.55 11.3 4.61 5.52 7.5 11.5
3 6.05 8.8 4.83 4.82 6.05 11.5
4 5.03 7.7 4.60 4.58 5.03 8.5
5 5.60 8.1 4.48 4.99 8.12 8.5
6 4.82 7.8 4.31 4.76 7.772 8.5
7 5.00 8.1 4.45 4.9 5.00 8.5
8 6.66 11.5 4.85 5.51 6.66 11.5
9 8.40 9.4 4.32 5.75 8.40 10
10 3.80 4.6 4.03 3.99 4.03 5
11 6.93 7.9 5.67 5.01 6.93 8.5
12 7.81 9.7 5.77 4.98 7.81 10

10205546-12-NOT-182 15.08.2019 / 0 Page 26 of 67
Figure 4.3 shows a graphical presentation of the results presented in Table 4.5. The anchor design loads at seabed varies between 5 MN and 11.5 MN with 9.5 MN as an average.
Figure 4.3 Factored and used (thick black line) design loads for each anchor
Chain configuration analysis
4.3.1 Calculation procedure
The loads at the padeye of the suction anchor are different in both magnitude and direction from the loads of the corresponding mooring line at the mudline. The foundation load at the padeye becomes smaller than the corresponding line load at the mudline, and the loading angle at the padeye will be greater than the loading angle at the mudline. The change in shape and load is due to soil-chain friction acting tangentially to the chain and bearing resistance acting normally to the embedded chain. The soil resistance results in an inverse-catenary mooring line shape in the soil. Figure shows conceptually how the line angle varies below the mudline (a: Top) and two resistances acting normally and tangentially to the chain (b: Bottom). Note that Ta and To are
tensions at the padeye and mudline, a and o are angles at the padeye and mudline respectively.
Caisson
Line Load at
Mudline
Mudline
Padeye (a)

10205546-12-NOT-182 15.08.2019 / 0 Page 27 of 67
To
Mudline
Ta
θo
θa Q=NcbSu
μQ
(b)
Figure 4.4 Mooring line angle variation and soil resistance below mudline (a) Inverse catenary mooring line below mudline; (b) Chain-soil interaction below mudline (Note: Not to Scale)
The NGI program ChainConfig (NGI, 2006) is a program used to determine the configuration of chain connected to an anchor below seabed. The solution is obtained by considering the forces on an element length, L, and computing the change in angle, α∆i, required for static force equilibrium of the element.
Using this program, the chain configuration of the embedded chain in soil together with the change in tension along the embedded chain is calculated. Figure 4.5 shows a schematic diagram showing a mooring line load and angle as input to ChainConfig and the padeye load and angle as output from the program. In addition to the output, the horizontal and total length of the embedded chain can also be estimated from the analysis.
Uncertainty in padeye loads and corresponding load angles was considered by performing chain configuration analyses using the characteristic chain loads at seafloor with both the low and high estimate suD design profiles. The resulting padeye loads and angles from the two profiles were used as input to the holding capacity calculations.
Figure 4.5 Illustration of chain configuration of the embedded chain

10205546-12-NOT-182 15.08.2019 / 0 Page 28 of 67
4.3.2 Chain characteristics
The following chain properties (Moss Maritime, 2019) have been adopted in the analyses:
Chain type: R4, Studless
Nominal diameter (ND): 147 mm
Submerged weight (SW): 3.76 kN/m
4.3.3 Results
The chain configuration analyses are run for a number of assumed padeye depths where the final padeye depth is determined based on the holding capacity calculations. Tables 4.6 and 4.7 summarize the results for what is considered final padeye depths. Table 4.6 Calculated padeye loads and angles for factored design loads (loads 5000-8500 kN)
Parameter Unit Low Estimate Strength
Profile
High Estimate
Strength Profile
Factored mooring line load (kN) 5000 8500 5000 8500
Padeye depth (m) 6.25 9.25 6.25 9.25
Mooring line angle to seafloor (deg) 32.7 28.3 32.7 44
Load at padeye (kN) 4930 8378 4930 8392
Angle at padeye to horizontal (deg) 35.8 32.1 36.6 47.3
Table 4.7 Calculated padeye loads and angles for factored design loads (loads 10000-11500 kN)
Parameter Unit Low Estimate Strength
Profile
High Estimate
Strength Profile
Factored mooring line load (kN) 10000 11500 10000 11500
Padeye depth (m) 8.25 12 8.25 12
Mooring line angle to seafloor (deg) 36 33.6 39.7 41.9
Load at padeye (kN) 9905 11350 9894 11350
Angle at padeye to horizontal (deg) 38.3 37.3 42.5 45.6
Holding capacity
4.4.1 Calculation procedure
The holding capacity of the anchor has been calculated using the finite element code, BIFURC which is part of the NGI suite of programs HVMCAP (2004a). In this program, the 3-D effects are taken into account by incorporating roughness factors at the two plane vertical sides of the anchor and at the sides of the active and passive zones. The FE program has also a capability to model the anisotropic shear strengths that represent the strength difference in shear, compression and extension strengths of soils. In the FE analyses the anchor chain load is increased in steps and the holding capacity is obtained when a steady-state condition is reached. A steady-state condition is reached when the suction anchor displacement increases significantly for an infinitesimal small increase in the chain load. The holding capacity was estimated with the padeye load and angle as input to BIFURC. The low estimate characteristic design (LE) su
C profile divided by the required soil

10205546-12-NOT-182 15.08.2019 / 0 Page 29 of 67
material factor of 1.2 was used as input in the program together with the strength anisotropy factors given in Section 4.1. Since the required load and soil material factors are included in the input this way, the holding capacity is satisfactory when the resulting load factor from the FE analysis is equal to or greater than 1.0.
Model of a padeye heading variation (i.e. misorientation), maximum 5, compared to the target heading, is typically included through a torsional moment transformed to a reduced maximum value of the outside skirt wall friction factor along the anchor wall. However, for the present analysis this was considered indirectly included by using an outside skirt wall friction factor of 0.65 (this means that any axial load resisted by outside skirt wall friction is limited to 0.65·su
D/γm).
The effect of tilt installation tolerance is analysed in BIFURC by changing the inclination of the
longitudinal axis of the anchor with vertical by maximum 5 as shown in Figure 4.6. The positive tilt causes the padeye angle to increase resulting in larger vertical component of the padeye load relative to axis going through the anchor while the negative tilt results in greater horizontal component.
It was assumed that the top vent will be closed after installation and that the suction anchor will remain closed during the design life of the anchor. When the anchor is pulled upwards, an under pressure (suction) will develop underneath the top cap. The suction underneath the closed top cap is limited to the undrained reverse end bearing (REB) of the soil below the skirt tip level.
In order to avoid uncertainty about a potential gap opening on the back side of the anchor when loaded, it is common practice to position the load attachment point such that the top of the anchor is expected to rotate away from the load direction. This was taken into account when determining the location of the padeye.
Mooring line
Minimumpenetration
Installation tolerancegoverning for lateral
resistance
Seabed
Targetpenetration
Mooring line
Minimum
penetration
Installation tolerance
governing for vertical
resistance
Seabed
Target
penetration
.
Orientation tolerance
Mooring line .
.
Neg. Tilt (-) Pos. Tilt (+)
Figure 4.6 Illustration of anchor installation tolerances

10205546-12-NOT-182 15.08.2019 / 0 Page 30 of 67

10205546-12-NOT-182 15.08.2019 / 0 Page 31 of 67
4.4.2 Results
Table 4.8 summarizes the anchor sizes for bridge concept K12. In general suction anchors with diameter D=6.0 m is used, except for anchors 9 and 12 where a relatively large load has to be combined for a location with limited sediment thickness. For these anchors a diameter of 8 m is suggested. In addition to the required average skirt penetration depth an allowance for the effect of soil heave due to soil displaced by the embedded skirt, the tilt tolerance and the effect of seabed slope is included by increasing the skirt height by 1 m.
Table 4.8 Suggested anchor sizes and estimated steel weights
Figures 4.7-4.9 show input and results from the analysis performed for anchors with design load at seabed of 8500 kN as an example. Based on Figure 4.8 the anchor rotates with top of anchor in the opposite direction of the load to avoid tension stresses along the top heel side of the anchor to avoid the potential development of an open crack. The soil strength input is equal to the low estimate static strength divided by the material factor 1.2. Figure 4.9 shows that the load factor at failure in this example is 1.05 which means that the holding capacity is satisfied with an additional margin of 5%. Based on Figure 4.9 it can be seen that the estimated displacement of the anchor for the characteristic ULS load (representative of a load factor of about 0.6 in Figure 4.9) is small <5 cm which is insignificant compared to the expected offset of the bridge line during storm loading (several meters).
Anchor Factored Design Sediment Diameter Depth Tolerance Skirt height Dry
load load thickness soil heave, incl. weight
used tilt,slope tolerances
(MN) MN (m) (m) (m) (m) (m) (t)
1 9.9 11.5 20.9 6 18 1 19 144
2 11.3 11.5 21.7 6 18 1 19 144
3 8.8 11.5 45.2 6 18 1 19 144
4 7.7 8.5 29.7 6 15 1 16 126
5 8.1 8.5 18.8 6 15 1 16 126
6 7.8 8.5 25.5 6 15 1 16 126
7 8.1 8.5 38.0 6 15 1 16 126
8 11.5 11.5 24.4 6 18 1 19 144
9 9.4 10 16.2 8 14 1 15 169
10 4.6 5 14.0 6 10 1 11 97
11 7.9 8.5 17.7 6 15 1 16 126
12 9.7 10 15.1 8 14 1 15 169
Average 8.7 9.5 SUM 1641

10205546-12-NOT-182 15.08.2019 / 0 Page 32 of 67
Figure 4.7 Example of input to holding capacity calculations for the anchor with D=6 m and skirt penetration depth of 15 m and padeye at 9.25 m depth
Figure 4.8 Deformed mesh at failure from analysis of anchor with D=6 m and penetration depth of 15 m

10205546-12-NOT-182 15.08.2019 / 0 Page 33 of 67
Figure 4.9 Horizontal displacement of top and bottom of anchor versus load for anchor with D=6 m and penetration depth 15 m
4.4.3 Comment regarding potential use of other anchor types
In the Technical Note 12-NOT-090_1 geotechnical evaluation of anchor concepts K13 the potential use of the plate anchor type SEPLA was considered. With reference to the design loads and sediment thicknesses shown in Table 4.8 a plate anchor of size 4.5 m* 10 m could potentially work for 4 of the anchor locations, i.e. anchors 3-4 and anchors 6-7. For anchor locations 1,2 and 8 the loads are higher and sediment thickness between 21 m and 24 m. To achieve sufficient holding capacity at these locations a larger plate size will have to be used with plate area of about 77 m2.
For the SEPLA to be valid for the loads in question the sediment thickness should be at least 20 m. Including a penetration depth tolerance of 2 m before bedrock is reached the installed and keyed in position of the top of the SEPLA plate will then be located at about 10m depth for the 45 m2. In this way a plate anchor like the SEPLA type may in the case of a submarine slide be more robust as the top of the plate is embedded at 10 m depth. However as mentioned in 12-NOT-090_1, these sizes of plates have not been used before. According to our information the largest SEPLA anchor installed in the world to date has a plate area of 30 m^2. It is nevertheless considered feasible to fabricate but a 10 m wide plate would be more sensitive to effects of inclined stronger soil layers and potential boulders during penetration. An illustration of the SEPLA plate anchor principle and installation is given on Figure 4.10.

10205546-12-NOT-182 15.08.2019 / 0 Page 34 of 67
Figure 4.10 Illustration of SEPLA plate anchor installation
Comment regarding potential settlements due to anchor weight and creep due to permanent loads
With reference to Table 4.8 the submerged weight of the suction anchors is expected to be about 1000-1300 kN. This represents a small downward vertical load compared to the vertical bearing capacity of the anchor even if only skirt wall friction is considered. By inspection it can therefore be concluded that settlements of the anchors will be small (mm to a few centimeters) and therefore not a concern for the mooring system or the bridge.
The same simplified evaluation applies for potential lateral or vertical soil creep deformations due to permanent load. The pretension load (still water load) is in the order of 1.5 - 2.0 MN which compared to the anchor weight and holding capacity is small. The permanent deformations are therefore considered to be insignificant and is therefore by inspection not considered any concern for the mooring system.
Skirt penetration resistance
The skirt penetration resistance has been calculated using a spreadsheet (PENC). The effect of potentially hitting two boulders with size 50 cm by 50 cm somewhere along the skirt periphery has also been investigated. In this calculation both the low and the high estimate soil strengths were used as input in combination with a soil sensitivity of St=2.5.
The penetration resistance of the skirt and the plate stiffeners are calculated using the following expressions:
Qtot = Qside + Qtip (1)
Qside = Aside suDSS (2)
Qtip = (Nc su,tipAV + pz') Atip (3)

10205546-12-NOT-182 15.08.2019 / 0 Page 35 of 67
where Qtot = total penetration resistance
Qside = resistance along all side areas
Qtip = resistance at the tip of all areas
Aside = total side area
Atip = total tip area
= remolding factor 1/St where St is the sensitivity
z = penetration depth
suDSS = characteristic direct simple shear strength
su,tipAV= characteristic average shear strength at tip level
= 1/3 (suC + su
DSS + suE)
pz' = effective vertical stress of soil
Nc = bearing capacity factor strip loading in clay (see below)
Figure shows an illustration of the soil resistance forces involved skirt penetration.
The required underpressure to be applied within the skirt in order to ensure penetration is calculated using the expression:
ureq = (Qtot W') / Ain (4)
where ureq = required underpressure ("suction")
Qtot = total penetration resistance of the suction anchor
W’ = submerged weight of anchor
Ain = inside area where underpressure is applied

10205546-12-NOT-182 15.08.2019 / 0 Page 36 of 67
Figure 4.11 Illustration of soil resistance forces during caisson installation
Figure 4.12 Input to the skirt penetration resistance calculations
Table 4.9 Skirt penetration resistance results
Anchor D
(m)
Target penetration
(m)
Self-weight pen low
strength (m)
Self-weight pen high
strength (m)
Required suction low
Required suction high

10205546-12-NOT-182 15.08.2019 / 0 Page 37 of 67
estimate (kPa)
estimate (kPa)
6 18 7.1 5.5 145 204
8 14 6.1 4.6 67 96
With reference to Figure 4.8 it has also been checked that target depth can be reached with ample margins against soil plug failure (compare green curve versus blue curve).
Figure 4.13 High estimate skirt penetration resistance for anchors with diameter D=6 m

10205546-12-NOT-182 15.08.2019 / 0 Page 38 of 67

10205546-12-NOT-182 15.08.2019 / 0 Page 39 of 67
5 References DNVGL (2017). DNVGL-RP-E303 Geotechnical design and installation of suction anchors
HVMCAP (NGI, 2004a). Windows program HVMCAP. Theory, user manual and certification. NGI Report 524096-7 Rev. 1 conf.
ChainConfig (NGI,2006). Configuration of Embedded Mooring Lines. ChainConfig – Version 1.01, Theory Manual and Verification. Report No. 20041570-2, dated 15 June 2006.
NGI (2016a). Bjørnafjorden 2016 Soil Investigation. Field Operations and Preliminary Results. Doc. No. 20150804-03-R, Rev.0 dated 2016-06-16. Statens Vegvesen document no. SBT-PGR-RE-203-008-1.
NGI (2016b). Bjørnafjorden 2016 Soil Investigation. Measured and Derived Geotechnical Parameters and Final Results. Doc. No. 20150804 04-R, Rev.0 dated 2016-06-30. Statens Vegvesen document no. SBT-PGR-RE-203-009-0.
NGI (2016c). Bjørnafjorden 2016 Soil Investigation. Data Interpretation and Evaluation of Representative Geotechnical Parameters. Doc. No. 20150804-05-R, Rev.1 dated 27 June 2017. Statens Vegvesen document no. SBT-PGR-RE-203-010-1.
Eurocode 8 (2014) NS-EN 1998-1:2004+A1:2013/NA: 2014. Eurocode 8: Design of structures for earthquake resistance - Part 1: General rules, seismic actions and rules for buildings. Standard Norge.
NORSAR (2018). Probabilistic Seismic Hazard Analysis (PSHA) for Project E39 Aksdal-Bergen (subproject E39 Bjørnafjorden) Tysnes/Os kommune i Hordaland. Report number 18-007, 15 June 2018.
NGI (2017a). Bjørnafjorden – Sideforankret flytebro. Phase 3 Geohazard Assessment. Report number 20160790-01-R. 2 June 2017.
NGI (2017b). Bjørnafjorden – Sideforankret flytebro. Phase 3 Geohazard Assessment. 1D slope stability analyses. Report number 20160790-01-TN, 2 June 2017.
NGI (2017c). Bjørnafjorden – Sideforankret flytebro. Phase 3 Geohazard Assessment. 1D slope stability analyses. Report number 20160790-01-TN, 2 June 2017.
Statens Vegvesen (2018). Design Basis for Geotechnical Design. Doc. No. SBJ-02-C4-SVV-02-RE-002 dated 12 November 2018
AMC (2019). AMC begrunnet innstilling- Geotechnical evaluation of anchor concepts K13. Doc. No. 10205546-12-NOT-090_01

10205546-12-NOT-182 15.08.2019 / 0 Page 40 of 67
6 Attachments
Attachment 1 – K12 hazard attribute maps for anchor clusters 1-3
Unntatt offentligheten
Offentleglova - §21

Map domain: 297912.5−299912.5 E, 6666932.2−6668932.2 N, UTM−32N CM 9°E ETRS89
Concept development, floating bridge E39 BjørnafjordenDocument No.
Figure No.
Date Drawn by
20180677−01−R
A1_K12−01
2019−05−15 MVaCompilation of attribute maps for anchor cluster 1 (anchors 1−4), bridge conceptK12, used in landslide hazard assessment
Map legend:
Anchor location
CPT location, 2016
Bridge pontoon
Moored bridge pontoon

Map domain: 298262.5−300262.5 E, 6667717.0−6669717.0 N, UTM−32N CM 9°E ETRS89
Concept development, floating bridge E39 BjørnafjordenDocument No.
Figure No.
Date Drawn by
20180677−01−R
A1_K12−02
2019−05−15 MVaCompilation of attribute maps for anchor cluster 2 (anchors 5−8), bridge conceptK12, used in landslide hazard assessment
Map legend:
Anchor location
CPT location, 2016
Bridge pontoon
Moored bridge pontoon

Map domain: 298340.0−300340.0 E, 6668596.8−6670596.8 N, UTM−32N CM 9°E ETRS89
Concept development, floating bridge E39 BjørnafjordenDocument No.
Figure No.
Date Drawn by
20180677−01−R
A1_K12−03
2019−05−15 MVaCompilation of attribute maps for anchor cluster 3 (anchors 9−12), bridgeconcept K12, used in landslide hazard assessment
Map legend:
Anchor location
CPT location, 2016
Bridge pontoon
Moored bridge pontoon

10205546-12-NOT-182 15.08.2019 / 0 Page 44 of 67
Attachment 2 – Landslide impact on anchors

10205546-12-NOT-182 15.08.2019 / 0 Page 45 of 67
Slide scenarios investigated The implications of a landslide include additional loading on the anchors, with the magnitude depending on the landslide volume, potential ploughing depth and velocity of the debris flows. This was investigated in Phase 3 of the Bjørnafjorden project. The methods and the main assumptions have been adopted and included in a preliminary evaluation on the effect on an anchor in this attachment. Two slope failure scenarios were investigated for an anchor with dimeter D=6 m.
1. Slide scenario 1 – Soil riding on top of seabed In this scenario, the critical slope failure shape is predicted by slope stability calculations and the debris flow runs out and continues downslope on top of the seabed until the slide mass hits and then flows over and around the anchor(s) (see Figure A2.1). The thickness of the debris flow depends on the volume that can be released by the failure, but as a reference for the impact load calculations, we use a 10 m thick debris flow. At the anchor, the soil is expected to make a ramp from seabed to the top of the anchor and the total height including this effect was therefore taken as 12 m.
Figure A2.1 Slide scenario 1 – Debris flow assumption

10205546-12-NOT-182 15.08.2019 / 0 Page 46 of 67
2. Slide scenario 2 – Soil ploughing into the seabed and flowing around the anchor when debris thickness above original seabed is equal on all sides of the anchor
This is a slide scenario where the ploughing soil has passed the anchor such that the soil all around the anchor can be considered remoulded from the fjord floor to the assumed ploughing depth of 5 m or 10 m (Figure ). This situation is generally considered to be the most critical for design of anchors to be able to resist the slide impact forces for ploughing depths >5 m.
Figure A2.2 Slide scenario 2 – Debris flow and ploughing depth assumption
The suction anchors considered are 6 m wide, but the potential landslides will likely have a lateral extension significantly exceeding this width.
In slide scenario 1, the foundation side area above the fjord bed will be subjected to friction forces, whereas in scenario 2 the soil is assumed to flow around the anchor to the depth of the ploughing. In these example calculations a ploughing depth of 0 m, 5 m and 10 m was investigated.
Debris flow forces on structures
When a debris flow runs into and around a structure, the flow pattern will change. Dependent on the shape of the structure, different pressure and friction forces will develop. We refer to, e.g., the work by Zakeri (2008) for technical details that are relevant.
In a fluid dynamics approach, these forces are split in pressure drag, Fp, and friction drag, Ff, representing the integrated pressure force and the integrated friction force over the structure, respectively. In fluid dynamics, the fluid is typically of Newtonian type with no yield strength and a

10205546-12-NOT-182 15.08.2019 / 0 Page 47 of 67
low viscosity and the forces are strongly dependent on the velocity. The total drag force is formulated as:
𝐹 =1
2𝜌 ∙ 𝐶𝐷 ∙ 𝐷 ∙ 𝑈2 ∙ 𝐵
Numerous studies have been performed to determine the drag factor, CD, as a function of viscosity and velocity, density and shape, the latter given as a representative dimension of the structure, for pipes typically the diameter D, expressed through the Reynolds number Re which is the ratio between inertial and viscous forces, according to:
𝑅𝑒 =𝜌 ∙ 𝑈 ∙ 𝐷
𝜇
In geotechnical terms, the pressure term corresponds to the frontal and aft bearing and suction capacity whereas the side friction corresponds to the viscous force. Dynamic effects will affect the bearing capacity as bearing capacity failure involves displacement of mass and thus mobilization of inertia forces.
The undrained shear strength of clay, intact as well as remoulded, is shear-rate dependent and this will affect the shear resistance of the anchor as well as the slide induced pressure forces and friction forces acting on the anchor.
Slide scenario 1
The driving forces related to slide scenario 1 is simplified illustrated on Figure .
Figure A2.3 Slide scenario 1 – Driving forces
Driving forces in addition to potential mooring loads:
Ft Friction when slide masses are passing top of the anchor = A·Sur; where A is area of anchor top and Sur is the remoulded shear strength of the slide mass
Fs Side friction along the anchor stick up=Aside·Sur; where Aside is area of the two sides of stick up and Sur is the remoulded shear strength of the slide mass

10205546-12-NOT-182 15.08.2019 / 0 Page 48 of 67
Pd Dynamic impact load when the slide mass with estimated velocity 8m/s hits the stick up part of the anchor, see more details below.
Qg Unbalanced submerged weight of soil on active side = 0.5·γ'·Hstick up2·B+ γ'·Hstick up·z·B; where
B is the anchor width and z is skirt penetration
Qd Unbalanced pressure due to weight of slide mass on active side only = γ'·Hd·z·B; where Hd is the height of slide mass (10 m), z is sum of penetration depth and stick up (20 m based on assumed anchor penetration of 18 m) and B is the anchor width
Calculation of driving forces.
A fast moving, flow-like submarine landslide may hit an anchor. Many investigators have studied the impact forces generated by debris flows on obstructions (e.g., Zakeri, 2008 and references therein). There are basically two approaches, a geotechnical and a fluid dynamics approach.
The geotechnical approach is based on bearing capacity models
𝐹 = 𝑁𝐶,𝑑𝑦𝑛 ∙ 𝑠𝑢 ∙ 𝐴𝑝
where Nc,dyn = dynamic (strain rate dependent) bearing capacity factor
su = undrained strength (in debris flows, the remoulded strength is considered to be most representative)
Ap = projected area normal to the flow direction.
The fluid dynamics approach describes the force as a drag force
𝐹 =1
2𝜌 ∙ 𝐶𝐷 ∙ 𝑈
2 ∙ 𝐴𝑝
where = mass density of flow
CD = drag coefficient
U = flow velocity.
Following Sahdi et al (2014) and based on centrifuge testing of pipeline loading in soft clay, a hybrid approach is proposed. In this approach, the separate drag and bearing components are superposed in the hybrid relationship
𝑃𝑑 =1
2𝜌 ∙ 𝐶𝐷 ∙ 𝐷 ∙ 𝑈2 ∙ 𝐴𝑝 +𝑁𝐻 ∙ 𝑠𝑢 ∙ 𝐴𝑝
The best-fit values of CD and NH are 1.06 and 7.35 (Sahdi et al, 2014). However, since this bearing capacity factor is based on flow around a pipeline, the situation will be different for a relatively wide (6 m) and relatively small stick up anchor (2 m) and therefore the calculation is based on NH = 3.3. This value is selected equivalent of standard passive earth pressure coefficient of 2.5 times the

10205546-12-NOT-182 15.08.2019 / 0 Page 49 of 67
rate effect factor of 1.3. A typical velocity when the slide hits the anchor is predicted to be U = 8 m/s (value taken from the Phase 3 report). However, for slide scenario 2, the pile width and the sum of stick up and ploughing depth has a ratio of 1 to 2 (dependent of 5m or 10m ploughing depth), and in this situation a bearing capacity factor of NH = 9 was used and in addition a rate effect factor of 1.3 was applied.
The remoulded shear strength of the clay is based on the static shear strength at 10 m depth (sediment thickness in failed slope is assumed 10 m) and divided by a typical soil sensitivity of St = 4. This gives an estimated average shear strength (suD) of about 4 kPa. Table A2-1 summarizes the estimated impact force components.
Table A2-1 Slide scenario 1. Summary of driving forces (anchor D=6 m Zpen=18 m)
Ft
MN
Fs
MN
Pd
MN
Qg
MN
Qd
MN
SUM PH incl rate effect
factor 1.3 on dynamic loads
MN
Overturning moment at
mudline MNm
0.11 0.042 0.71 1.31 6.91 9.36 -64.53
Table A2-2 Slide scenario 1. Summary of driving forces (anchor D=6 m Zpen=26 m)
Ft
MN
Fs
MN
Pd
MN
Qg
MN
Qd
MN
SUM PH incl rate effect
factor 1.3 on dynamic loads
MN
Overturning moment at
mudline MNm
0.11 0.042 0.71 1.87 9.68 12.67 -137.25
Slide scenario 2
The landslide will not necessarily break out at the toe of the slope. The slide mass may continue in direction of the steep part of the slope and start to plough into the seabed, compressing the soil in the less steep part of the slope. This will cause distortion of the soil mass until the compression zone reaches the front of the anchor (and beyond). If the anchor can resist the pressure, the debris will pile up some and the slide mass will start to run over the anchor in the same way as in slide scenario 1. On both sides of the anchor, the compression will continue at a certain depth and generate side forces on a considerably larger part of the anchor skirts than in scenario 1, see Figure A2.1 and A2.2. However, the main difference when considering anchor stability is that much of the soil next to the anchor will be remoulded in slide scenario 2 compared to slide scenario 1. Although the driving forces have decreased, see Table A2-3, the soil supporting the anchor will provide less resistance and thereby the load situation will become more critical when ploughing depth is >5 m. The driving forces related to slide scenario 2 is simplified illustrated on Figure .

10205546-12-NOT-182 15.08.2019 / 0 Page 50 of 67
Figure A2.4 Slide scenario 2 – Driving forces
The thickness of the debris flow will increase, but due to increased resistance (deeper flow path) and considerably larger distortion zones, the velocity is likely to be reduced compared to scenario 1. A velocity of 5 m/s was assumed in the calculations. For slide scenario 2 the main driving force will be the dynamic force component calculated by the equation;
𝑃𝑑 =1
2𝜌 ∙ 𝐶𝐷 ∙ 𝐷 ∙ 𝑈2 ∙ 𝐴𝑝 +𝑁𝐻 ∙ 𝑠𝑢 ∙ 𝐴𝑝
Pd = 0.5·1682 kg/m3·1.06·6 m· (5 m/s)2·6 m·7 m + 9·1.3·5 kPa·6 m·7 m
= 2.83 MN (based on ploughing depth 5 m)
In addition, the top area friction Ft=0.11 MN is added.

10205546-12-NOT-182 15.08.2019 / 0 Page 51 of 67
Table A2-3 Slide scenario 1. Summary of driving forces (anchor D=6 m ploughing depth 5 m)
Ft
MN
Pd
MN
SUM PH incl rate effect factor 1.3 on dynamic loads
MN
Overturning moment at
mudline MNm
0.11 2.83 3.82 -7.05
Table A2-4 Slide scenario 1. Summary of driving forces (anchor D=6 m ploughing depth 10 m)
Ft
MN
Pd
MN
SUM PH incl rate effect factor 1.3 on dynamic loads
MN
Overturning moment at
mudline MNm
0.11 4.84 6.45 -24.90
Anchor stability checks
The anchor capacity was checked by the FE program Bifurc which is part of NGI’s suite of capacity analysis software HVMCap (NGI 2004a). This program uses an elasto-plastic soil model. The finite element program HVMCap models a plane strain situation where anisotropic shear strength is considered. The actual base geometry is approximated by a rectangle with the same area as the foundation and with the width equal to the diameter. The 3D-effect is taken into account by use of roughness factors for side shear both for soil-soil and for steel-soil. The values for these roughness factors are calibrated based on results from full 3 D Finite Element calculations.
For slide scenario 1, the intact shear strength profile multiplied by a rate effect factor of 1.3 was used. For slide scenario 2, the soil support from seabed to 5m and 10 m depth respectively was ignored since the soil is ploughing whereas the intact shear strength multiplied by the rate effect factor of 1.3 was used for the soil below the ploughing depth. The load input to the analyses are given in Table A2-1-A2-4. The results of these anchor bearing capacity checks are given in the next section.
Results from bearing capacity checks due to slide impact only
Slide scenario 1: An anchor with D=6 m and penetration depth of Z=18 m is required to withstand the slide with thickness 10 m.
Slide scenario 2: An anchor with D=6 m and penetration depth of Z=17 m is required to withstand the slide with an assumed ploughing depth of 5 m. In other words, slide scenario 1 and 2 gave approximately the same required anchor penetration.
An anchor with D=6 m and penetration depth of Z=26 m is required to withstand the slide with an assumed ploughing depth of 10 m. An increase of the anchor diameter to for example 10 m will not have any major effect on required skirt penetration depth as the driving forces from the slide masses will increase significantly due to the larger skirt wall areas that will be exposed to the slide. As an example, a skirt penetration depth of 25 m is required for D=10 m.

10205546-12-NOT-182 15.08.2019 / 0 Page 52 of 67
Figures A2.5 – A2.8 show input and results for an example calculation for slide scenario 2 with anchor D=6 m and penetration depth 18 m.
Figure A2.5 Example input-slide scenario 2 with ploughing depth 5 m (anchor D=6 m Zp=18 m)
Figure A2.6 Example shear strength profile-slide scenario 2 with ploughing depth 5 m

10205546-12-NOT-182 15.08.2019 / 0 Page 53 of 67
Figure A2.7 Example result deformed FE mesh-slide scenario 2 with ploughing depth 5 m (anchor D=6 m Zp=18 m)
Figure A2.8 Example load displacement of anchor at top and bottom-slide scenario 2 with ploughing depth 5 m (anchor D=6 m and Zp=18 m)
General comments to the slide impact analyses The slide impact analyses are based on several assumptions.
a) Ploughing depth. This is the assumption that can affect the results the most. Based on interpretations performed of the existing slides that have occurred in Bjørnafjorden several hundred years ago, ploughing depths in excess of 15 m may have occurred. In other words, the assumptions of ploughing depths of 5-10 m is not necessarily conservative. However, if the ploughing depth should go deeper than 10 m, as used in the calculation example, it will

10205546-12-NOT-182 15.08.2019 / 0 Page 54 of 67
generally be difficult to find anchor locations with sediment thickness large enough to be able to potentially resist the slide impact.
b) Soil sensitivity. The soil mass that is flowing around the suction anchor has been assumed to be completely remoulded based on a soil sensitivity of St=4. For this type of analyses, it is common industry practice to assume that the soil is fully remoulded but it involves uncertainty. Although much of the soil mass will be remoulded, there might be larger blocks that are not entirely remoulded following the flow that could hit the anchor and produce a somewhat larger impact. It is in any case important to gather more soil information from a larger number of boreholes to confirm or decide on a representative soil sensitivity.
c) Flow velocity. For slide scenario 2 a flow velocity of 5 m/s was assumed. This is another uncertain parameter but, based on the given calculation model, the fluid dynamics contribution is a limited part of the total driving force and the importance of the assumed velocity therefore becomes less important.
Conclusions It is challenging to potentially design anchors that will be able to resist a massive landslide because of the limited sediment thickness at many anchor locations. However, the calculations show that anchors with penetration depth of about 20 m or more will obtain some robustness in the case of a landslide but then limited to slides that do not plough deeper than about 5 m. Experience based on existing slides that have occurred in Bjørnafjorden several hundred years ago these indicates that ploughing depths more than 15 m can be observed. Just after a landslide the anchor holding capacity is likely to be reduced because the soil within the potential ploughing depth will be reduced due to the remoulding. It may also be the situation that the landslide has caused an erosion around the anchor and thereby reduced the effective skirt penetration depth. On the other hand, it is also theoretically possible that the anchor holding capacity has increased in case the landslide has deposited soil masses on top of the existing fjord bed. References HVMCAP (NGI, 2004a). Windows program HVMCAP. Theory, user manual and certification. NGI Report 524096-7 Rev. 1 conf.
Sahdi, F. et al. (2014). Centrifuge modelling of active slide-pipeline loading in soft clay. Geotechnique 64, No.1, 16-27.
Zakeri, A. (2008). Submarine Debris Flow Impact on Pipelines, University of Oslo, Oslo.

10205546-12-NOT-182 15.08.2019 / 0 Page 55 of 67
Attachment 3 – Evaluation of anchor locations

10205546-12-NOT-182 15.08.2019 / 0 Page 56 of 67
Bridge concept K12
Figures A3.1 and A3.2 show the slope and sediment thicknesses at the anchor locations.
Figure A3.1 Slope map

10205546-12-NOT-182 15.08.2019 / 0 Page 57 of 67
Figure A3.2 Sediment thickness map

10205546-12-NOT-182 15.08.2019 / 0 Page 58 of 67
Figure A4.3 shows potentially critical profiles wrt slides near to the anchor locations.
Figure A3.3 Investigated profiles wrt slides near to the anchor locations

10205546-12-NOT-182 15.08.2019 / 0 Page 59 of 67
Detailed profiles are not investigated for anchors 3, 4, 5, 9 and 10 for the following reasons:
Anchors 3 and 4: slide is not likely, and the anchors can be moved in any direction if relocation is needed.
Anchor 9: slide is not likely, and the anchor can be moved in any direction if relocation is needed, but the sediment thickness is limited.
Anchor 10: slide is not likely. There is a slope near the anchor to the south, but there are hardly sediments in the slope. The anchor can be moved northwards if relocation, but the sediment thickness is limited.
Anchor 5: slide is not likely. There is a slope near the anchor to the north, but there are hardly sediments in the slope. The anchor can be moved if relocation is needed.
Inspection of the profiles shows the following for the remaining anchors:
Table A3-1 Evaluation of the anchor locations for bridge concept K12
Anchor Slide probability Slope Anchor relocation Figure ref
3,4,5,9,10 Not likely Flat area Possible
1 Not likely Minimal 100 m in any direction
A3.4
11 Not likely A slope near by, but hardly soft sediments in the slope
100 m away from the slope
A3.5
12 Not likely A gentle slope (8.4 deg) about 100 m west of the anchor location
Anchor can be moves some 50 m along the profile
A3.6
7 Less likely A local slope of 21 deg near the anchor. The larger slope has an inclination of 6.7 deg
Anchor can be moved 50 m in all direction, and preferably away from the slope
A3.7
6 More likely than anchors 1, 11 and 12, but less likely than anchor 2
A slope of 14 deg some 70 m away from the location
Anchor can be moved 50-100 m away from the slope
A3.8
8 Similar to anchor 6 A slope of 14-15 deg some 50 m away from the location
Anchor can be moved 50-100 m away from the slope
A3.9 and A3.10
2 More likely A slope of 23 deg some 50 m away from the location
Anchor can be moved 50-100 m or more away from the slope
A3.11

10205546-12-NOT-182 15.08.2019 / 0 Page 60 of 67
Figure A3.4 Profile at anchor 1 (please note that vertical scale is different from horizontal, see legend)
Figure A3.5 Profile at anchor 11 (please note that vertical scale is different from horizontal, see legend)

10205546-12-NOT-182 15.08.2019 / 0 Page 61 of 67
Figure A3.6 Profile at anchor 12 (please note that vertical scale is different from horizontal, see legend)
Figure A3.7 Profile at anchor 7 (please note that vertical scale is different from horizontal, see legend)

10205546-12-NOT-182 15.08.2019 / 0 Page 62 of 67
Figure A3.8 Profile at anchor 6 (please note that vertical scale is different from horizontal, see legend)
Figure A3.9 Profile at anchor 8 (please note that vertical scale is different from horizontal, see legend)

10205546-12-NOT-182 15.08.2019 / 0 Page 63 of 67
Figure A3.10 Profile at anchor 8 (please note that vertical scale is different from horizontal, see legend)
Figure A 3.11 Profile at anchor 2 (please note that vertical scale is different from horizontal, see legend)
On Figures A3.12 and A3.13 results of 1D infinite slope stability analyses as a function of slope angle, sediment thickness and earthquake events (2750 years and 10000 years) are shown, SBJ-31-C3-MUL-02-RE-100 (NGI, (2017c).

10205546-12-NOT-182 15.08.2019 / 0 Page 64 of 67
Figure A3.12 Max transient shear strain as a function of slope angle, sediment thickness for the 2750-year earthquake event.
Figure A3.13 Max transient shear strain as a function of slope angle, sediment thickness for the 10000-year earthquake event.

10205546-12-NOT-182 15.08.2019 / 0 Page 65 of 67
The results show that when the slope angle exceeds 12-18 degrees a significant and abrupt increase of the shear strain takes place, beyond a level that is commonly considered equivalent with failure.
This result supports the ranging of the anchors in Table A3-1 where anchors 2, 6 and 8 are more susceptible to slides than the other anchors.
Static global factor of safety, SoF
SVV (2018) requires SoF ≥ 1.4 for a global failure of a sloping seabed. SoF estimates as a function of slope and sediment thicknesses were presented in NGI (2016). The undrained shear strength profile for the soft sediments applied in this phase of the project is identical to the strength profile in NGI (2016). Thus, the results obtained in NGI (2016) are considered approximately valid for seabed slopes comparable to seabed slopes investigated in NGI (2016).
The soil profiles on Figs. A18 and A19 in NGI (2016) are focused on, shown as Figs. A3.14 and A3.15 below.
Figure A3.14 SoF for profile 18, NGI (2016)
The slope to the left side is 22 degrees and SoF is very low, around 1. The slope is similar to the steepest part (22.6 degrees) of the seabed slope near to anchor 2, Fig. A3.11 above. Both slopes contain soft sediments that can be released during strong enough earthquakes. Our conclusion is that SoF for the slope near to anchor 2 is around 1.

10205546-12-NOT-182 15.08.2019 / 0 Page 66 of 67
Profile 19 is shown below.
Figure A3.15 SoF for profile 19, NGI (2016)
The slope is 14 degrees and SoF is around 1.3. The slope is similar to the seabed slopes near to anchors 6 and 8, Figs. A3.8, A3.9 and A3.10 above. The slopes contain soft sediments that can be released during strong enough earthquakes. Our conclusion is that SoF for the slopes near to anchors 6 and 8 is around 1.3.
An overall conclusion may be as follows: earthquakes may trigger slides for slopes of 12-18 degrees. The estimated SoF for such slopes is of the order 1.3. SoF reduces for increasing slopes to 1 for 22 degrees inclination. The overall picture for all 12 anchors is shown in Table A3-2.
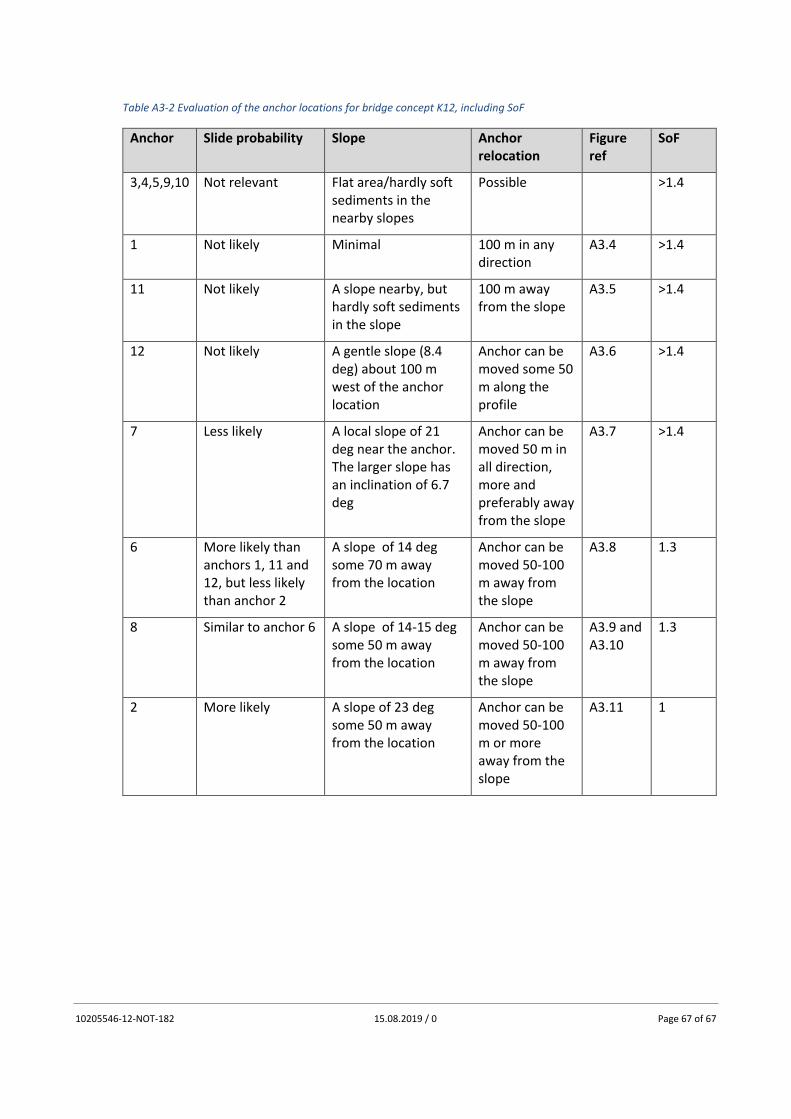
10205546-12-NOT-182 15.08.2019 / 0 Page 67 of 67
Table A3-2 Evaluation of the anchor locations for bridge concept K12, including SoF
Anchor Slide probability Slope Anchor relocation
Figure ref
SoF
3,4,5,9,10 Not relevant Flat area/hardly soft sediments in the nearby slopes
Possible >1.4
1 Not likely Minimal 100 m in any direction
A3.4 >1.4
11 Not likely A slope nearby, but hardly soft sediments in the slope
100 m away from the slope
A3.5 >1.4
12 Not likely A gentle slope (8.4 deg) about 100 m west of the anchor location
Anchor can be moved some 50 m along the profile
A3.6 >1.4
7 Less likely A local slope of 21 deg near the anchor. The larger slope has an inclination of 6.7 deg
Anchor can be moved 50 m in all direction, more and preferably away from the slope
A3.7 >1.4
6 More likely than anchors 1, 11 and 12, but less likely than anchor 2
A slope of 14 deg some 70 m away from the location
Anchor can be moved 50-100 m away from the slope
A3.8 1.3
8 Similar to anchor 6 A slope of 14-15 deg some 50 m away from the location
Anchor can be moved 50-100 m away from the slope
A3.9 and A3.10
1.3
2 More likely A slope of 23 deg some 50 m away from the location
Anchor can be moved 50-100 m or more away from the slope
A3.11 1

Concept development, floating bridge
E39 Bjørnafjorden
Appendix M – Enclosure 2
10205546-12-NOT-090
Geotechnical evaluation of anchor concepts

01 24.05.2019 Final issue K. Schrøder / J. Tistel S. E. Jakobsen S. E. Jakobsen
00 29.03.2019 Status 2 issue K. Schrøder S. E. Jakobsen S. E. Jakobsen
REV. DATE DESCRIPTION PREPARED BY CHECKED BY APPROVED BY
MEMO
PROJECT Concept development, floating bridge E39 Bjørnafjorden
DOCUMENT CODE 10205546-12-NOT-090
CLIENT Statens vegvesen ACCESSIBILITY Restricted
SUBJECT Geotechnical evaluation of anchor concepts K13 PROJECT MANAGER Svein Erik Jakobsen
TO Statens Vegvesen PREPARED BY Knut Schrøder/Joar Tistel
COPY TO RESPONSIBLE UNIT AMC
SUMMARY
A geotechnical evaluation of 4 different anchor concepts has been performed with reference to anchor locations using bridge layout concept K13 as reference. The study shows that a suction anchor is the most applicable solution. Suction anchor is proven technology for the soil conditions (soft clay) and design loads in question. The suction embedded plate anchor (SEPLA) is considered as the second most applicable solution. The high holding power drag anchor VLA and the dynamically installed DPA is less attractive mainly because of the combination of high design loads, uncertainty related to the final anchor position and limited sediment thicknesses. The disadvantage with the suction anchor is probably a larger vulnerability in case a submarine slide should occur and hit the anchor. In theory a suction anchor can be oversized to better withstand a potential slide with a limited ploughing depth < 10 m, but it would require a relatively deep penetration which is sensitive to the slide impact calculation uncertainties and the sediment thickness at the location. Tentatively the anchors will have to be penetrated>25 m to resist a landslide with 10 m ploughing depth. The required penetration depth is not very sensitive to the anchor diameter because the increase in capacity is to a large extent counteracted by the increase in driving forces when the diameter is increased. A plate anchor like the SEPLA type may in the case of a submarine slide be more robust as the top of the plate can for many of the locations be installed to a depth of 10-15 m below seabed and thereby avoid being directly hit by a submarine slide if the slide does not plough deeper.
Table S1. Number of applicable locations for the different anchor concepts (indicative based on preliminary loads)
Anchor concept
Number of applicable locations at K13 Comment
Load A 7000 kN
Load B 10 000 kN
Load C 14 000 kN
Total
Suction anchor
8 12 5 (6) 25-(26) Flexible, robust design for normal operating conditions
SEPLA 4 8 6 18 Plate size 45m2(4off) and 77 m2 (14off) These size plates have not been used before
VLA 4 2 NA 6 Large pull in force required, sediment thickness limiting, plate area 45 m2 is larger than found in Manufacturers manual
DPA 4 (5) NA 4-(9) Sediment thickness limiting
The present note also addresses hybrid anchors, gravity anchors and rock anchors for the locations where the above four anchor concepts are not applicable.
The present revision of the note is basically the same as the previous version, AMC (2019). Although the final anchor loads may differ from the preliminary loads used as examples in this memo, this memo is considered to suit its purpose which is to discuss different anchor alternatives.
Unntatt offentligheten
Offentleglova - §21

Concept development, floating bridge E39 Bjørnafjorden
Geotechnical evaluation of anchor concepts K13
10205546-12-NOT-090 24.05.2019 / 01 Page 2 of 39
TABLE OF CONTENTS 1 Introduction .................................................................................................................................. 3
2 Anchor concepts ........................................................................................................................... 4
Suction anchor ...................................................................................................................... 4
SEPLA concept ...................................................................................................................... 5
VLA concept .......................................................................................................................... 6
DPA concept ......................................................................................................................... 7
3 Suitable areas ............................................................................................................................... 8
Side anchored straight bridge K13 ........................................................................................ 8
4 Anchor loads ................................................................................................................................. 9
5 Anchor sizing ............................................................................................................................... 11
Suction anchor .................................................................................................................... 11
SEPLA .................................................................................................................................. 12
VLA ...................................................................................................................................... 15
DPA ..................................................................................................................................... 20
5.4.1 DPA geometry ............................................................................................................. 21
5.4.2 DPA Capacity ............................................................................................................... 22
Subsea Rock Anchor (SRA) .................................................................................................. 26
5.5.1 SRA –concept development since previous phase ..................................................... 26
5.5.2 Previous study............................................................................................................. 27
5.5.3 SRA status ................................................................................................................... 27
5.5.4 Review of prototype testing ....................................................................................... 27
5.5.5 Conclusive remarks on SRA......................................................................................... 32
6 Pros and cons .............................................................................................................................. 33
Suction anchor .................................................................................................................... 33
SEPLA .................................................................................................................................. 33
VLA ...................................................................................................................................... 34
DPA ..................................................................................................................................... 35
Subsea Rock Anchor (SRA) .................................................................................................. 35
7 Hybrid anchor and gravity anchor .............................................................................................. 36
8 References .................................................................................................................................. 38

Concept development, floating bridge E39 Bjørnafjorden
Geotechnical evaluation of anchor concepts K13
10205546-12-NOT-090 24.05.2019 / 01 Page 3 of 39
1 Introduction Statens Vegvesen has since 2012 worked with development of the E39 Bjørnafjorden fjord crossing project. Four initial project phases are now completed, ref. /1/. An important objective with the current phase (phase 5) is to further mature the bridge concepts with the goal of recommending one concept. The number of concepts have for this phase been expanded to cover two additional floating bridge solutions.
This memo evaluates a number of different anchor types that could be relevant and feasible solutions in areas with significant sediment thicknesses, i.e. sediment thicknesses of typically more than 10m. The mooring system for the Bjørnafjorden Floating bridge could be regarded as a semi-taut mooring system, where some of the mooring lines arrives at the seabed horizontally, and other mooring line arrives at the seabed at an angle, see sketches in Figure 1-1 and Figure 1-2. For a taut, or semi-taut mooring systems, the anchor needs to resist both vertical and horizontal forces. The evaluated anchors herein therefore focus on concepts that can withstand both vertical and horizontal forces.
Figure 1-1 Sketch of a Catenary mooring system. Ref. www.vryhof.com
Figure 1-2 Sketch of a Taut leg mooring system. Ref. www.vryhof.com
The assessment focuses on describing the main features of the concepts. In addition a preliminary sizing is performed for the different concepts. The calculations are made for three different load levels which are based on the mooring analysis results from the previous project phase (Phase 3), ref. /1/
The following anchor concepts have been evaluated (see also Figure 1-1)
- Suction anchor
- Suction embedded plate anchor; ref. SEPLA (Intermoor)
- Drag embedment anchor; ref. Stevmanta (Vryhof anchors)
- Deep Penetrating Anchors; ref. DPA (DeepSea Mooring)
It should be mentioned that the above patented plate anchor types are examples and that within the industry there could be other anchors that also could be of interest like for example;
- Denla anchor (Bruce Anchors Ltd.)
- Pader Plate Anchor (Subsea7)
- PPA “Position Penetrated Anchor” (Viking Marine Mooring A/S)
- Depla (dynamically installed plate anchor, Vryhof anchors)
In areas where the sediment thickness is significantly less than 10 m a Hybrid anchor (skirted gravity anchor) or a pure gravity anchor has been suggested. The evaluations made in this respect are taken from the Phase 3 of the Bjørnafjorden study (ref. /1/) and has been added in Section 7 of this memo for information. A section on rock anchors has been included.

Concept development, floating bridge E39 Bjørnafjorden
Geotechnical evaluation of anchor concepts K13
10205546-12-NOT-090 24.05.2019 / 01 Page 4 of 39
Suction anchor (not patented)
Sepla (figure taken from www.dnv.com)
VLA (Stevmanta, www.Vryhofanchors.com)
DPA (figure taken from www.sintef.no))
PPA (figure taken from www.DNV.com)
Denla
(www.bruceanchor.co.uk)
Depla
www.Vryhofanchors.com)
Pader figure taken from www.DNV.com)
Figure 1-3 Example of different anchor concepts suitable for combined vertical and horizontal loading
2 Anchor concepts
Suction anchor
Suction anchors have been extensively used worldwide in the last 25 years for permanent mooring of floating structures. In several offshore development projects it has been the preferred option because of its ability to withstand large vertical and lateral forces and relatively simple and feasible installation in clay, sand and layered soils. The anchor is lowered to seabed and after self-weight penetration has been reached, the required force for further penetration is obtained by pumping water out of the caisson and thereby creating an underpressure (often simplified denoted as "suction") that drives the anchor down to the target depth. This concept was used as the base case

Concept development, floating bridge E39 Bjørnafjorden
Geotechnical evaluation of anchor concepts K13
10205546-12-NOT-090 24.05.2019 / 01 Page 5 of 39
anchor alternative in the previous phase of the Bjørnafjorden floating bridge project, ref. /1/. The optimum load attachment point is typically located below seabed at about 2/3 of the skirt penetration depth for deep and slender anchors but could be shallower and even at the top of the anchor for more wide and shallow anchors. Anchor with mooring line is sketched on Figure 2-1.
Figure 2-1 2illustration of inverse catenary shape for two different load levels
SEPLA concept
The SEPLA (Suction Embedded Plate Anchor) is a plate that is installed to target depth by the use of a suction caisson follower (i.e. a suction anchor). When in place the follower is extracted and the SEPLA plate is by the mooring line rotated into position. Figure 2-2 illustrates the installation technique.
Figure 2-2 Illustration of SEPLA plate anchor installation
The common size of the plate has typically been 28-30 m2, i.e. width of 4 m and length of 7 m with an expected installed ultimate holding capacity of about 7 MN (dependent of the actual soil conditions and the installation depth). Recovery lines are typically attached to the SEPLA which makes it possible to retrieve the anchor.
For permanent mooring the anchor plate is in /2/ stated to be typically 45 m2 with width 4.5 m and length 10 m. However, in personal communications with Intermoor in Houston 45 m2 anchors have not been used for permanent moorings so far. These anchors are primarily intended for use in the Gulf of Mexico with most likely lower undrained shear strength profiles than the soft clay in

Concept development, floating bridge E39 Bjørnafjorden
Geotechnical evaluation of anchor concepts K13
10205546-12-NOT-090 24.05.2019 / 01 Page 6 of 39
Bjørnafjorden. In relation to the anchor loads for the bridges in question larger anchors than ever used may be required.
In personal communications with Intermoor in Houston we are told that they are planning anchors for permanent mooring of 77 m2 size, i.e. 7 m width and 11 m length. Their aim is to obtain an ultimate capacity of about 14 MN. Because of a larger plate the size of the follower will also have to be increased. As we understand the current plan is to make a follower with diameter D=6.1 m that will be so tall that it can penetrate the tip of the plate anchor to a maximum of 27 m.
VLA concept
The VLA concept is developed to withstand both vertical and horizontal forces and are thus often used for taut mooring systems. The VLA anchor concept is commonly used in deep water for temporary installation, where the mooring spread gets very large for catenary mooring system.
The VLA is installed like a conventional drag embedment anchor. I.e. the anchor is first placed on seabed and is then pulled into the seabed by, either winches or by means of bollard pull, using anchor handling vessels (AHV), see illustration of a bollard pull installation in Figure 2-3.
Figure 2-3 Illustration of bollard pull installation of a drag embedment anchor. (Based on figure in Vryhof anchor manual, ref /10/).
The VLA anchor with the highest holding capacity is, according to Vryhof’s anchor manual, the Stevmanta anchor, see Figure 2-4 through Figure 2-6. The Stevmanta anchor has no Rigid shank, but a system of wires, or chains, connected to a fixed plate angle adjuster. The Stevmanta is typically installed in the direction towards the mooring attachment point (upper end of the mooring line).

Concept development, floating bridge E39 Bjørnafjorden
Geotechnical evaluation of anchor concepts K13
10205546-12-NOT-090 24.05.2019 / 01 Page 7 of 39
Figure 2-4 Stevmanta, view from above
Figure 2-5 Stevmanta, view from the side
Figure 2-6 Stevmanta, view from behind.
DPA concept
Dynamically installed anchors are rocket or torpedo shaped and are installed by allowing the anchor to free fall from a designated height above the seabed. Since it was first introduced in the late 1990s, several design variations have been proposed, typically with overall lengths in the range of 12-15m, and shaft diameters in the range of 0.76 – 1.2 m. Hydrodynamic stability during free fall is enhanced through side fins (or flukes) positioned towards the upper end of the anchor and optional ballasting inside the tubular shaft /4/ (C.O.Beirne et al. 2015), see Figure 2-7 below. The anchor embedment achieved after impact with the mudline depends mainly on the anchor mass and geometry, impact velocity, and soil strength profile. The embedment depth will be larger in weaker soils and smaller in stronger soils, but the holding capacity at the final average embedment depth will be approximately the same.

Concept development, floating bridge E39 Bjørnafjorden
Geotechnical evaluation of anchor concepts K13
10205546-12-NOT-090 24.05.2019 / 01 Page 8 of 39
Figure 2-7 The Deep Penetrating Anchor (DPA), /5/.
3 Suitable areas
Side anchored straight bridge K13
The investigated anchor types may require a sediment thickness as much as 30 m to achieve the required holding capacity. For this reason, the anchors may not be applicable at all relevant locations, as the thickness of the top soft clay may be significantly less than 30 m at many of the locations. Figure 3-1 shows the bathymetry including the anchor location based on the phase 3 study. Figure 3-2 and Figure 3-3 show the slope inclination map and sediment thickness map respectively.

Concept development, floating bridge E39 Bjørnafjorden
Geotechnical evaluation of anchor concepts K13
10205546-12-NOT-090 24.05.2019 / 01 Page 9 of 39
4 Anchor loads Based on the phase 3 mooring analyses the breaking strength of the mooring line is stated to be approximately 14000 kN. However, calculated maximum ULS loads, based on /6/ DNV-OS-C101, are generally significantly less for most of the lines, see Table 4-1. In Table 4-1 the interpreted sediment thickness at each anchor location is also given for reference.

Concept development, floating bridge E39 Bjørnafjorden
Geotechnical evaluation of anchor concepts K13
10205546-12-NOT-090 24.05.2019 / 01 Page 10 of 39
Table 4-1 Summary of mooring analysis results and sediment thickness, from phase 3 studies, ref. /1/
Line no
Water depth
Sediment thickness
Pre-tension load
Bottom angle for Pre-tension load
Design load at the anchor for individual mooring lines
Bottom angle for ULS load
Fig. 4-1
Load category
- (m) (m) (kN) (deg) ULS (kN) (deg)
1 -528.2 36.3 2 500 41.7 10069 45.8 C
2 -527 31.6 2 500 43.7 10405 44.3 C
3 -535.7 29.9 2 500 48.7 11608 53.5 C
4 -538.6 34.4 2 500 37.4 11411 47.9 C
5 -532.1 27.1 1 900 9.1 4704 25.7 A
6 -534.9 28.0 1 900 6.3 4678 26 A
7 -534.9 38.2 1 900 14.8 5396 32 A
8 -530.1 30.4 1 900 20.7 5538 33 A
9 -505.2 22.3 3 000 11.1 8718 20.9 B
10 -515.5 23.0 3 000 10.3 8787 21.6 B
11 -533.1 25.6 3 000 6.6 8791 22.3 B
12 -534.9 23.5 3 000 11.6 8819 22.6 B
13 -458.5 18.8 3 000 10.3 8060 18.5 B
14 -444.9 21.2 3 000 7 8155 18 B
15 -482.7 20.9 3 000 19.4 9290 25.2 B
16 -456.9 20.3 3 000 9.6 8179 18.9 B
17 -541.3 21.8 2 700 7.7 6902 22 B
18 -538.4 24.2 2 700 9.2 7037 22 B
19 -367.6 16.2 2 700 9.6 9013 18.2 B
20 -368.3 15.8 2 700 0.2 7530 14.2 B
21 -132 3.2 2 900 0.5 11008 7.8 C
22 -124.9 Rock 2 900 0.4 10333 8.3 C
23 -538.8 27.0 3 100 19 10080 29 C
24 -547.3 25.0 3 100 20.6 10187 29 C
25 -269.9 13.2 2 700 21.1 6730 32 A
26 -267.1 16.2 2 700 15.7 6461 28.9 A
27 -175.7 9.9 2 200 8.8 4869 20.3 A
28 -174.9 17.1 2 200 0.6 4811 16.3 A
29 -61.1 0.3 1 900 0 4631 4.8 A
30 -64.9 Rock 1 900 0 5182 8 A
31 -63.3 Rock 1 900 0 8946 7.5 B
32 -59.9 Rock 1 900 0 11832 8.1 C
The project has not yet decided whether the anchor shall be designed for the actually calculated design loads or if the anchors shall be designed for the breaking strength of the mooring line. Consequently, the feasibility evaluation of the different anchor concept herein is carried out for

Concept development, floating bridge E39 Bjørnafjorden
Geotechnical evaluation of anchor concepts K13
10205546-12-NOT-090 24.05.2019 / 01 Page 11 of 39
three set of loads, which cover the entire span of factored loads previously considered for the phase 3 studies:
Load A = 7000 kN anchor load
Load B = 10000 kN anchor load
Load C = 14000 kN anchor load
Figure 4-1 shows the factored ULS design loads for all anchor locations and the assumed load categories A, B and C for the different anchors.
Figure 4-1 Design Line loads at the bridge for individual mooring loads from phase 3 studies, ref. /1/
Table 4-2 Anchors and associated design load categories
Factored design load (kN) Anchor location No of anchors
A: 7000 5-8 & 25-30 10
B: 10000 9-20 & 31 13
C: 14000 1-4 & 21-24 & 32 9
5 Anchor sizing
Suction anchor
The anchor holding capacity was calculated by the FE program Bifurc that is part of NGI’s suite of capacity analysis software HVMCap, /7/ NGI (2004). This program uses an elasto-plastic soil model. The finite element program HVMCap models a plane strain situation where anisotropic shear strength is considered. The actual base geometry is approximated by a rectangle with the same area as the foundation and with the width equal to the diameter. The 3D-effect is taken into account by use of roughness factors for side shear both for soil-soil and for steel-soil. The values for these roughness factors are calibrated based on results from several full 3 D Finite Element calculations. According to table 2-1 in /8/ DNV-RP-E303, a partial material factor of 1.2 should be

Concept development, floating bridge E39 Bjørnafjorden
Geotechnical evaluation of anchor concepts K13
10205546-12-NOT-090 24.05.2019 / 01 Page 12 of 39
adopted for suction anchor design subjected to ULS conditions, for the holding capacity calculations. This has been included in Figure 5-1.
A preliminary screening study has been performed by investigating the required anchor size based on the three load categories defined in Section 4. In addition, the sizing was based on two assumed load angles at padeye, 30 degrees and 50 degrees relative to the horizontal. Calculations have been performed for three different anchor diameters, 5m, 8m and 11m. The results are presented in Figure 5-1.
Figure 5-1 Required suction anchor penetration as a function of anchor diameter and design load
With reference to Table 4-1 (loads) and Figure 5-1 (anchor size) it can be seen that a suction anchor solution can be used at 25 anchor locations or potentially at 26 locations if a large diameter like D=16 m or so is used at line 27. An anchor with a diameter of 5 m could be feasible at 22 of the locations.
SEPLA
Herein we investigate the 45 m2 and 77 m2 anchor plates wrt holding capacity for permanent mooring. Based on the thicknesses of the soft clay (ref. Table 4-1) the anchor capacity is as a first approach estimated with the anchor plate embedded as deep as possible. The criteria for the maximum depths are:
0
5
10
15
20
25
0 2 4 6 8 10 12
Skir
t p
enet
rati
on
dep
th (
m)
Suction anchor diameter (m)
P=7000 kN
P=10000 kN
P=14000 kN

Concept development, floating bridge E39 Bjørnafjorden
Geotechnical evaluation of anchor concepts K13
10205546-12-NOT-090 24.05.2019 / 01 Page 13 of 39
Anchor tip is installed with the tip not closer than 2 m from the bottom of the soft clay
After keying the anchor, the plate centre is assumed moved upwards half the anchor width
In this position the anchor holding capacity is calculated as
Q = Nc Aplate sc su η
where: Nc is bearing capacity factor, =12 provided the anchor centre depth ≥ 4.5 B. B is the anchor width. Aplate is the anchor area Sc is shape factor = (1 + 0.2 B/L). L is plate length Su is the average undrained shear strength at the depth of the centre of the anchor plate, approximated by Su
D η is an empirical reduction factor with the range 0.7 – 1. Effect of cyclic loading is disregarded as the anchors in operation are exposed to one-way loading with a relatively small average load. For such loading conditions in soft clay, the ratio between cyclic strength and static undrained shear strength is likely to be at least 1.0. It should be noted that this study does not specifically account for variations of line angles at seabed. For simplicity, combining the shape factor of typically 1.1-1.15 and η=0.7 and that the plate centre may not reach a depth of 4.5 B at all locations, an equivalent factor Nc sc η = 10 is applied. Accordingly, a capacity of Q = 10 Aplate su is applied. According to /9/ DNV-RP-E302, a partial material factor of 1.4 should be adopted for plate anchor design subjected to ULS conditions, for the holding capacity calculations. Normal plate anchor of 45 m2 for permanent mooring Table 5-1 14 MN ULS design load
Anchor no
Sediment thickness, m
Plate centre depth, m
Design capacity, MN
Design load, ULS, MN
Applicable
1-4 30-36 24 12.8 14 -
23, 24 25-27 19 10.3 14 -
The 45 m2 anchors cannot resist the 14 MN load Table 5-2 10 MN ULS design load
Anchor no
Sediment thickness, m
Plate centre depth, m
Design capacity, MN
Design load, ULS, MN
Applicable
9-12 22-26 16 9.0 10 (OK)
13-16 19-21 13 7.4 10 -
17, 18 22-24 16 9.0 10 (OK)
19, 20 16 10 6.0 10 -
The 45 m2 anchor plate cannot be used at all the locations where the design is 10 MN. It can probably withstand the 10 MN design load at a few of the locations.

Concept development, floating bridge E39 Bjørnafjorden
Geotechnical evaluation of anchor concepts K13
10205546-12-NOT-090 24.05.2019 / 01 Page 14 of 39
Table 5-3 7 MN ULS design load
Anchor no
Sediment thickness, m
Plate centre depth, m
Design capacity, MN
Design load, ULS, MN
Applicable
5, 6 27 21 11.2 7 OK
7, 8 30-38 24 12.8 7 OK
25-28 10-17 4, 11 -, 6.0 7 -
In total 4 anchors can withstand the 7 MN design load, provided the anchors can be installed to the required depth.
Plate anchor of 77 m2 under development, 14 MN ULS load
The required depth for an anchor design capacity of up to the maximum anchor load of 14 MN is estimated. The anchor capacity together with the design load is as shown in the table below.
Table 5-4 Applicability of 77 m2 SEPLA
Sediment thickness, m
Plate centre depth, m
Design capacity, MN
Design load, MN
Applicable
1-4 30-36 16 14.0 14.0 OK
5, 6 27 16 14.0 7.0 OK
7, 8 30-38 16 14.0 7.0 OK
9-12 22-26 13 12.1 10.0 OK
13-16 19-21 10 9.9 10.0 OK
17, 18 22-24 13 12.1 10.0 OK
19, 20 16 7 5.4 10.0 -
23, 24 25-27 16 14.0 14.0 OK
25-28 10-17 2 - 7.0 -
At the locations with 14 MN design load, there is sufficient thickness of the soft clay to obtain the required depth. At the other locations the anchor capacity is limited by the thickness of the soft clay.
With a combination of "ordinary" plate anchors of 45 m2 and plate anchors of 77 m2 under development for permanent mooring, such anchors seem applicable for 5-6 of the anchor groups. The smaller plates may be used for group 2 (anchors 5, 6, 7, 8).
It is shown below that the 77 m2 plate with follower can be installed to the required depth at the locations with a design load of 14 MN. In summary, the SEPLA concept, based on the assumed plate sizes, will be able to resist the design loads at 18 locations; at 4 locations using a plate size of 45 m2 and 14 locations where the 77 m2 is required.
Installation of the 77 m2 plate anchor
Intermoor assumes an installation follower diameter of 6.1 m for the large plate anchor.

Concept development, floating bridge E39 Bjørnafjorden
Geotechnical evaluation of anchor concepts K13
10205546-12-NOT-090 24.05.2019 / 01 Page 15 of 39
To end with the plate centre at 16 m depth after keying to obtain a design capacity of 14 MN, the plate tip needs to penetrate to 23 m depth, with the follower tip at approximately 20 m depth.
Anchor plate and follower resistance are calculated based on high estimate of the undrained shear strength together with clay sensitivity of 4. 250 tons are assumed for the weight of the follower and the plate. The required suction at target depth is 224 kPa. The underpressure that may cause uplift of the soil plug and thereby penetration refusal is reduced by the inside follower wall friction. The effective underpressure at target depth becomes 125 kPa. (inside wall friction is considered). The allowable suction is based on the low estimate undrained shear strength at the follower tip level, including an often applied "safety factor" of 1.5. The allowable effective suction at skirt tip level becomes 135 kPa, i.e. acceptable.
VLA
An anchor sizing exercise has been carried out, for a VLA (Stevmanta anchor), partly according to the methodology described in the Vryhof’s anchor manual /10/, and partly the DNV guideline presented in DNV-RP-E302 /9/The anchor sizing exercise documented herein, shall be regarded as a high-level assessment. It should also be noted that this study does not specifically account for variations of line angles at seabed.
According to table 3-1 in /9/ DNV-RP-E302, a partial material factor of 1.4 should be adopted, for the ULS conditions, for the holding capacity calculations. This factor applies for both consequence classes CC1 and CC2. For ALS conditions a material factor of 1.0 shall be adopted for CC1 conditions, and 1.3 for CC2 conditions.
The maximum penetration depth is calculated based on the following equation, taken from the Vryhof manual. /10/ :
𝐷 = 1.5 ∗ 𝑘0,6 ∗ 𝑑−0,7 ∗ 𝐴0,3 ∗ 𝑡𝑎𝑛.1,7 (∝)
where:
D = Stevmanta penetration depth [m]
k = quotient Undrained Shear Strength clay [kPA] and depth [m]
d = mooring line or installation line diameter [m]
A = Stevmanta fluke area [m2]
α = Stevmanta fluke / shank angle [deg]
The penetration depth is thus primarily governed by the shear strength gradient, fluke area, line diameter and which fluke angle one sets on the anchor for the installation. Larger fluke angle gives deeper penetration.
The shear strength gradient (k) has a constant value of approximately 1.55 within the depth 0-20m. Below this depth the gradient increases slightly, to a constant value of approximately 1.8. Since the pullout capacity is governed by soil strength above and below the location of the anchors an average value of 1.7 has been adopted.
The expected penetration has been calculated for five different anchor sizes and for three different fluke angles. It should be noted that the 45m2 is not included in the anchor manual. The results are presented in Table 5-5 and Figure 5-2 below:

Concept development, floating bridge E39 Bjørnafjorden
Geotechnical evaluation of anchor concepts K13
10205546-12-NOT-090 24.05.2019 / 01 Page 16 of 39
Table 5-5 Calculated penetration of Stevmanta vs. fluke area, for three fluke angles
Calculated Penetration depth (m) vs. fluke area (m2) according to the methodology described in the Vryhof manual
Fluke angle 10m2 15 m2 20 m2 25 m2 30 m2 45 m2
30 degree fluke angle 6 6.8 7.4 8 8.5 9,5
40 degree fluke angle 11.5 13 14.1 15.1 16 18
50 degree fluke angle 21 23.5 25.6 27.4 29 32,7
Figure 5-2 Calculated Anchor penetration based on methodology described in Vryhofs anchor manual /10/.
The maximum fluke area, covered by the Stevmanta Ultimate Pullout Capacity chart, is 30 m2, see Figure 5-3. Although the capacity charts stop at 30m2 these anchors can typically be custom made in order to fit the actual need. The anchor width and anchor lengths are extrapolated to fit a 45m2 large anchor. According to information provided by Vryhof, drawings exists of a Stevmanta anchor with 45m2 fluke area, ref. /18/. According to the UHC chart the “typical” maximum characteristic pullout capacity for a Stevmanta anchor with a fluke area of 30m2 is approximately 1 950ton. This corresponds to 19 139kN. Applying a material factor of 1.4 on this will give approximately 13 500kN ultimate pullout capacity. This is in the same order as the breaking strength of the mooring line (ref. phase 3 studies.). However, this holding capacity requires a significant penetration (Large sediment thickness).
Typical installation load for a 30m2 anchor is approximately 7 500kN, see right axis in Figure 5-3.

Concept development, floating bridge E39 Bjørnafjorden
Geotechnical evaluation of anchor concepts K13
10205546-12-NOT-090 24.05.2019 / 01 Page 17 of 39
Figure 5-3 UPC chart for Stevmanta anchor, taken from the Vryhof manual, ref./10/
The pullout capacity is calculated based on the methodology described in the DNV-RP-E-302, for the penetration depth calculated with the methodology described in the Vryhof manual. The following equation is given in the recommended practice, ref /9/:
𝑅𝑐𝑦 = 𝑁𝑐 ∗ 𝑠𝑐 ∗ 𝜂 ∗ 𝜏𝑓,𝑐𝑦(𝑧𝑖) ∗ 𝐴𝑃𝑙𝑎𝑡𝑒
where:
Nc = Bearing capacity factor
S c = 1+0.2⋅WF/LF Shape factor
η = Empirical reduction factor (0.75 based on well controlled onshore tests)
plate A = Plate area
zi = Penetration depth
For further details reference is made to the /9/ DNV-RP-E-302.

Concept development, floating bridge E39 Bjørnafjorden
Geotechnical evaluation of anchor concepts K13
10205546-12-NOT-090 24.05.2019 / 01 Page 18 of 39
A cyclic factor of 1.0 is adopted for these calculation (one way loading with relatively small pre-tension load). In detail design it is however, recommended that a thorough assessment of cyclic degradation is carried out
The results from the capacity calculations, as a function of penetration depth, for 10, 15, 20, 25, 30m2 and 45m2 large Stevmanta anchors are presented in Figure 5-4. The minimum required penetration to resist the three load cases are presented in Table 5-1.
For load A (7000kN) the minimum required anchor penetration is approximately 14m, and for this penetration depth the fluke area needs to be 45m2. If a smaller anchor shall be used the anchor needs to penetrate deeper than 14m.
For load B (10000kN) the minimum required penetration is 19m if a 45m2 anchor is used.
For load C (14000kN), which is similar to the breaking strength of the mooring line, the required penetration is 25m for a 45m2 anchor.
Table 5-6 Minimum required penetration to resist the three load cases, A, B and C
Required penetration to resist the load A, B & C for different anchor sizes
10m2 anchor
15m2 anchor
20m2 anchor
25m2 anchor
30m2 anchor
45m2 anchor
Load A
(7000kN) -** -** 27m* 22m 19m
14m
Load B
(10000kN) -** -** -** 30m* 26m
19m
Load C
(14000kN) -** -** -** -** 35m*
25m
* Exceeding the calculated anchor penetration, with 50degree fluke angle, slightly
** Required penetration exceeds the calculated penetration, with 50degree fluke angle, significantly

Concept development, floating bridge E39 Bjørnafjorden
Geotechnical evaluation of anchor concepts K13
10205546-12-NOT-090 24.05.2019 / 01 Page 19 of 39
Figure 5-4 Calculated design holding capacity according to DNV-RP-E302
Since the VLA is an anchor type which is dragged in place there are uncertainties in terms of the achieved final penetration. Once the anchor is dragged in place the anchor is pulled upwards so that the anchor fluke is positioned approximately normal to mooring line orientation, when subjected to the design load. During the phase the anchor experience keying which often causes the anchor to move slightly upwards. To account for uncertainties with respect to the achieved final depth a similar approach is adopted for the VLA as for the SEPLA concept. The maximum installation depth is based on the following criteria:
Anchor should not be installed closer than 2 m from the bottom of the soft clay.
After keying the anchor, the plate centre is assumed moved upwards half the anchor width of a 25m2 anchor. This correspond to approximately 3.5m.

Concept development, floating bridge E39 Bjørnafjorden
Geotechnical evaluation of anchor concepts K13
10205546-12-NOT-090 24.05.2019 / 01 Page 20 of 39
The results are summarized in Table 5-7.
Table 5-7 result summary VLA
Anchor no
Sediment thickness, m
Max penetration depth, m
Design load, MN
Design cap. 20m2, MN
Design cap. 30m2, MN
Design cap. 45m2, MN
Applicable
1-4 30-36 24,5 14.0 6,3 9,3 13.5 -Almost
5, 6 27 21,5 7.0 5,4 8.0 11.5 OK (30m2,45m2)
7, 8 30-38 24,5 7.0 6,3 9,3 13.5 OK (30m2,45m2)
9-12 22-26 16,5 10.0 4.0 5,9 8.5 -
13-16 19-21 13,5 10.0 3.2 4.7 6.7 -
17, 18 22-24 16,5 10.0 4.0 5,9 13.5 OK (45m2)
19, 20 16 10.5 10.0 2.4 3.6 4.6 -
23, 24 25-27 19,5 14.0 4.8 7.1 10.2 -
25-28 10-17 4,5 7.0 0,9 1.4 1.9 -
DPA
Currently, no formal design procedure exists for free-fall anchors, but according to the DNVGL framework, the design principles for piles as outlined in /11/ DNVGL-RP-C212 can normally be adopted. The ISO-framework /13/ (ISO 19901-4) recommends the same approach, following the general criteria for calculating the axial capacity of piles, but with some modifications to account for the differences in geometry, installation methodology and loading conditions. Lateral capacity may be determined applying the P-Y concept assuming that the anchor can be represented as a cylindrical pile of varying diameter. It follows that for deeply penetrated anchors the vertical (axial) resistance component at the pad-eye governs the anchor capacity, whereas for shallower penetrated anchors the lateral resistance component (and lateral displacements) may govern this capacity /12/ (DNVGL-ST-0119 (July 2018).
The sizing presented here shall be regarded as approximate, and detailed assessments by use of FEM must be done if this concept is relevant for the Bjørnafjorden floating bridge.
According to /14/ Sousa et al. 2010, it can be assumed that capacity for torpedo anchors subjected to loads with inclinations higher than 30 degrees can be estimated by calculating the axial load capacity of the anchor and dividing by the sine of this angle:
sin
vl
where Ql = anchor capacity in line-direction

Concept development, floating bridge E39 Bjørnafjorden
Geotechnical evaluation of anchor concepts K13
10205546-12-NOT-090 24.05.2019 / 01 Page 21 of 39
Qv = axial capacity of DPA
= angle between the horizontal plane and anchor line (catenary) at padeye
To be noted though, the study by Sousa is performed for a torpedo pile, which is slightly different from the DPA geometry, but still, this general “rule” is adhered to in this brief assessment. This assumption is also justified by findings presented in/4/ Beirne et al.2015, performed on a prototype DPA in clay. Their tests documents 38% increase in DPA holding capacity when load inclination is decreased from 90° (vertical) to 33°.
For this assessment the approximate maximum penetration depths are assumed based on field experience and published material. In addition, simple analyses of vertical and horizontal capacity are carried out.
Field tests and analyses reported in literature suggests:
Penetration depth of up to 2-3 times the anchor length for dynamically installed anchors in typical deep water clay. Beirne et al. 2014, Lieng et al.2010.
Further, vertical monotonic capacities are typically less than five times the dry weight of the anchor.
5.4.1 DPA geometry
Only a few DPA’s have been installed worldwide, whereas “torpedo piles” which are slightly different are commonly installed offshore Brazil. The two concepts are illustrated in Figure 5-5.
Figure 5-5 DPA (left) vs. torpedo pile concept (right). Source: www.deepseaanchors.com and www.offshore-mag.com .
This study considers the DPA concept only. The geometry used as “base case” is the DPA anchor installed at the Gjøa field, offshore Norway. A scaled DPA (scaling factor 1.3) is also assessed in the study.

Concept development, floating bridge E39 Bjørnafjorden
Geotechnical evaluation of anchor concepts K13
10205546-12-NOT-090 24.05.2019 / 01 Page 22 of 39
Base case geometry:
Ø = 1.2 m
L = 13 m
W_fin = 1.4 m
H_fin = 4.68 m
Dry weight = 750 kN
Subm.weight = 650 kN
Scaled geometry:
Scaling factor = 1.3
Ø = 1.56 m
L = 16.9 m
W_fin = 1.82 m
H_fin = 6.08 m
Dry weight = 750*1.33 = 1650 kN
Subm.weight ≈ 1430 kN
5.4.2 DPA Capacity
The vertical anchor capacity is calculated according to the equation bellow:
Vult = Ws + Fb + Fs
Where Ws is the submerged weight of the anchor, Fb is the bearing resistance at the tip and top of the DPA, in addition to the tip and top of the fins, Fs is the shaft frictional resistance. Fb and Fs is calculated according to /13/ ISO 19901-4 in this case. Fb from DPA top and fins are neglected in this study.
Calculation of DPA vertical capacity is performed by applying the undrained direct shear strength
profile, divided by a soil material coefficient according to /6/ DNVGL OS C101 (Pile anchors) m = 1.3. The strength profile is found from the report /15/ SBT-PGR-RE-203-010-1 Soil investigation – Data interpretation and evaluation of representative geotechnical parameters
The line loads presented in Section 0 are considered in the study (7 MN, 10 MN and 14 MN). The line load at the padeye is divided into vertical and horizontal load components. The line-angle at the padeye is calculated by the inverse catenary typically used by the Industry. Reduction in line load due to friction between chain and surrounding soil is not included. The chain presented in Figure 5-6 is used in the study:
H_fin
L - H_fin
Ø
w_fin

Concept development, floating bridge E39 Bjørnafjorden
Geotechnical evaluation of anchor concepts K13
10205546-12-NOT-090 24.05.2019 / 01 Page 23 of 39
Figure 5-6 Chain geometry
Where the following geometries are estimated:
d = 147 mm
t = 639 mm
b1 = 294 mm
Dequivalent = 283 mm
The same SuD profile as used for vertical DPA capacity calculation is used to calculate the catenary
shape within the soil. However, no material coefficient is applied in catenary calculations.
The DPA capacity with tip penetration depth versus Line load at given DPA-tip penetration depth is
presented for only one 0 angle (30 degrees) for the 13 m DPA and for the 16.9 m DPA, see Figure
5-3 and Figure 5-4. The evaluation is however performed for four 0 –cases: 20, 30, 40 and 50
degrees. 0 is the angle between the mooring line/chain and the seabed (assumed horizontal seabed).
The DPA penetration depth is not calculated, nevertheless, literature refers to penetration depth of up to three times the anchor length for DPA installed in typical deep-water clay. This is a rough statement, but still it seems valid when assessing the observed data from the DPA installation at Gjøa, where DPA tip-penetration between 24 m and 31 m was achieved, i.e. 1.8 – 2.4 times the DPA length, /16/ Lieng et al. 2010. A comparison between the remoulded shear strength at Bjørnafjorden and Gjøa is presented in Figure 5-9. It is reasonable to believe that penetration depths in excess of the Gjøa case can be achieved. A limitation, which will have to be considered at each anchor location is the sediment thickness/thickness of soft clay.

Concept development, floating bridge E39 Bjørnafjorden
Geotechnical evaluation of anchor concepts K13
10205546-12-NOT-090 24.05.2019 / 01 Page 24 of 39
Figure 5-7 13 m DPA, 0 = 30 degrees.
Figure 5-8 16.9 m DPA, 0 = 30 degrees.
0
10
20
30
40
50
60
0 2 000 4 000 6 000 8 000 10 000 12 000
DP
A t
ip-p
enet
rati
on
bel
ow
sea
bed
[m
]
Fv [kN]
Vertical line load component vs. DPA vertical capacity,
0 = 30°
7000 kN
10000 kN
14000 kN
DPA, 13 m length
0
10
20
30
40
50
60
0 2 000 4 000 6 000 8 000 10 000 12 000
DP
A t
ip-p
enet
rati
on
bel
ow
sea
bed
[m
]
Fv [kN]
Vertical line load component vs. DPA vertical capacity,
0 = 30°
7000 kN
10000 kN
14000 kN
DPA 16.9 m length
Required penetration depth
For 7 000 kN line load

Concept development, floating bridge E39 Bjørnafjorden
Geotechnical evaluation of anchor concepts K13
10205546-12-NOT-090 24.05.2019 / 01 Page 25 of 39
Figure 5-9 Comparison between remoulded shear strength at Bjørnafjorden and Gjøa
Table 5-8 Anchor location, sediment thickness, ULS line load and required penetration depth for two DPA alternatives.
Anchor no
Sediment thickness, m
DPA 13 m
Required pen.depth
DPA 16.9 m
Required pen.depth
Line angle
0 [degr.]
Design load, MN
Applicable
1-4 30-36 - 48-55 44-53 14.0 -
5, 6 27 30-35 18 25-26* 7.0 OK (16.9)
7, 8 30-38 40 19 32-33 7.0 OK (16.9)
9-12 22-26 50 20 20-23* 10.0 OK (16.9)
13-16 19-21 50 20-23 18-25* 10.0 -
17, 18 22-24 50 20 22* 10.0 OK (16.9)
19, 20 16 50 20 14-18* 10.0 -
23, 24 25-27 - 36 29* 14.0 -
25-28 10-17 - - 0-17* 7.0 -
*0 = 30 degrees was considered a “threshold value” for the simplified approach to evaluate the DPA capacity by
calculating the vertical capacity and divide by the sine of 0, de Sousa et al. 2010.
0
5
10
15
20
25
30
35
40
45
50
0 10 20 30 40D
epth
bel
ow
sea
bed
[m
]
remoulded undrained shear strength, su rem [kN/m2]
SU rem. Bjørnafjorden SU rem. Gjøa

Concept development, floating bridge E39 Bjørnafjorden
Geotechnical evaluation of anchor concepts K13
10205546-12-NOT-090 24.05.2019 / 01 Page 26 of 39
The results show that the 13 m DPA required penetration depth is beyond the sediment thickness at all anchor locations, concluding the inadequacy of this DPA size. The scaled DPA (= 16.7 m length) can provide satisfactory holding capacity at 10 anchor locations as indicated in the table. The required penetration depths are within 3 × DPA length, which is the assumed maximum penetration depth for the 16.9 DPA in this study. (Maximum penetration depth can be increased by increasing drop height).
The DPA installation is a “rough” installation method, and accurate penetration depths will be difficult to predict. There should therefore be some margin between the DPA target depth and bedrock.
Subsea Rock Anchor (SRA)
Rock anchors may replace gravity anchors and may thus constitute a possible optimization in terms of materials, schedule and cost. Design of and installation of subsea rock anchors (SRA) are nevertheless not straight forward: Only a few Subsea Rock Anchors (SRA) are installed as of today, research is ongoing and there have been performed both onshore and offshore testing/installation of SRA’s which are encouraging.
SRA’s can be considered if there are bedrock outcropping or if the sediment thickness above bedrock is limited i.e. dredging or similar may be performed. Rock anchors may apparently be relevant to consider at the northern anchor positions as the sediment thickness is limited in this area.
One of the key issues before SRA’s can be used for the E39-Bjørnafjorden floating bridge will also concern the technical qualification of the SRA concept.
Throughout the relatively “high level” study presented within this section, there have been communication with a contractor working on the topic of SRA’s, and a manufacturer of Ischebeck anchors. The findings from the study and input provided by the contractor is included here, relevant references are also provided.
5.5.1 SRA –concept development since previous phase
The bridge concepts are further developed since the previous phases. The design of the bridge structure itself, pontoons (number off), anchor positions (number off) are further matured and optimized resulting in updated anchor-line loads.
At the same time, there has been some development when it comes to SRA’s. A brief research shows that there are at least two separate groups working on the design and testing of subsea drill rigs with the purpose of drilling and installing subsea rock anchors. Both groups are working within the offshore renewables energy market. One of the greatest challenges faced by the offshore wave, tidal and wind energy industry is the high cost of construction and installing offshore foundations. Foundations based on post tensioned pile anchors can be effectively proposed to tackle this issue [5].
One of the groups has already (2016) successfully installed a rock anchor at 35 m water depth.
Ischebeck has launched a new anchor size in the well documented and used Titan series; Ischebeck Titan 196/130. Documentation from field testing is received from the supplier [27]. The ultimate capacity of this anchor is 8 MN. This anchor was also used in a field test, documenting the capability of a drill rig developed for subsea operations.

Concept development, floating bridge E39 Bjørnafjorden
Geotechnical evaluation of anchor concepts K13
10205546-12-NOT-090 24.05.2019 / 01 Page 27 of 39
5.5.2 Previous study
Use of rock anchor as a viable anchor method for the floating bridge mooring lines have been addressed throughout several studies. The report SBJ-31-C3-MUL-23-RE-200 /22/ summarizes different studies and presents also a calculation of a rock anchor subjected to a line load of 17 000 kN at 20 degrees inclination (to horizontal). This load was referred to as the breaking strength of the line. The study applied a passive rock anchor, installed and grouted in a pre-drilled borehole.
The result revealed that the capacity of the anchor-steel cross section was exceeded, given the boundary conditions and load applied in the analyses.
The line loads applied in the current phase reveals somewhat reduced loads compared to what was used as a base case in /22/. Detailed ULS/ALS design loads are not provided at the time when this memo is prepared.
5.5.3 SRA status
There has been quite some development of SRA’s during the past period since the last phase [3] was terminated. The development is basically driven by the renewables energy sector that requires anchoring of tidal, wave and wind energy structures to the seabed (offshore). The developers are looking at cost effective solutions, and foundations anchored by use of rock anchors are one of the concepts being evaluated.
Recently, the use of foundations for tidal turbines based on post-tensioned anchors has been proposed, jointly with a system for an efficient installation in offshore environments (Callan et al., 2012). The development aims at sufficient bearing resistance, but also cost efficiency by reducing the overall size of the foundation when compared to gravity-based foundations (thereby reducing concrete requirements). This system consists of small-diameter hollow bars drilled in the rocky seabed and secured to the underlying rock volume by means of grout bond. When tensioned using hydraulic jacks, they apply a vertical force on the underwater structure that replicates the self-weight of a ballasted structure to ensure its stability [5].
5.5.4 Review of prototype testing
Two different concepts are reviewed in the following sections; the concept proposed by McLaughlin & Harvey and the concept proposed by Sustainable Marine Energy (SME). Both concepts utilised post tensioned rock anchors (which was not considered in the previous phase).
A short summary of Ischebeck Titan 196/130 drill test is also presented [27]. This anchor size is novel, but the concept is well known and is used worldwide (onshore).
Testing/installation performed by McLaughlin & Harvey Offshore
An innovative concept, among other concepts, is suggested at the ScotRenewables SR 2000 floating tidal turbine at the Orkney. The anchor concept constitutes subsea drilled and grouted rock anchors. The anchor is post-tensioned in order to mobilize horizontal shear capacity between the foundation and bedrock when subjected to horizontal loads.
The system can utilize the commercial available Ischebeck Titan anchor type which is a well-known and well proven concept. The technology is thus commercially viable and proven onshore. The largest anchor dimension has been 196/129 (diameters) with ultimate capacity 8000 kN (4000 kN service load). The nominal outside diameter of this anchor is 196 mm, nominal inside diameter is 129 mm.

Concept development, floating bridge E39 Bjørnafjorden
Geotechnical evaluation of anchor concepts K13
10205546-12-NOT-090 24.05.2019 / 01 Page 28 of 39
Figure 5-10. Drill rig MK2 /20/ with adjustable legs for levelling at the seabed
The concept utilizes a self-levelling drill unit (MK2) as shown in Figure 5-10. Testing has been performed onshore both wet and dry. Testing in offshore un-controlled environment has not yet been performed.
Field tests documenting horizontal capacity of an installed anchor with the proposed anchor footing are presented in /24/. The test set-up is presented in Figure 5-11. The study presented in /24/ concluded that “relationships developed for the analysis of the mechanical behavior of natural rock discontinuities showed a good agreement with the experimental data.” The research concentrated on the primary shear resistance mechanism of tensioned anchors. The resistance to horizontal displacement offered by the anchor itself, a mechanism that arises when the foundation footing – rock coupling has already failed, was not analysed.
Figure 5-11. Experimental apparatus for testing horizontal capacity of foundation/rock anchor system.

Concept development, floating bridge E39 Bjørnafjorden
Geotechnical evaluation of anchor concepts K13
10205546-12-NOT-090 24.05.2019 / 01 Page 29 of 39
Further, according to McLaughlin & Harvey /25/, some of the key features of the Subsea Drilling System are:
- The system can install, test, proof load and lock in the required working load into the anchor in a single operation.
- The system was designed for installation on tidal sites with exposed bed rock.
- As the water depths prevalent on these sites is in the 10s of meters (30 to 70) the system was designed and fabricated to work at these water depths. The equipment can be upgraded to work in deeper water depts.
- In the tidal foundation application the max working load the anchor would experience in service was locked in (to generate the friction) so cyclic loading was eliminated.
- Following testing the anchor head and anchor / foundation interface was grouted to prevent any further settlement of the anchor and ensure full corrosion protection of the system.
- The system installs the largest ground anchors available (Ischebeck-Titen 196-129)
- The horizontal component of the load is resolved through the friction generated between the foundation and the rock of the sea bed generated by the tension loads locked into the anchor.
- The foundation installed and tested had an ultimate capacity of 800 t in tension on a single anchor. Foundations that used multiple anchors and a larger foundation to share the load between the anchors with a higher capacity have been designed.
- The total weight of the installation rig is 40 to 70t (dependent on the amount of ballast installed to provide stability of the rig during deployment on a highly active tidal site.)
- The system can be deployed from dumb barges or mid-size DP construction vessels.
Figure 5-12. Installation vessel/dumb barge /20/.

Concept development, floating bridge E39 Bjørnafjorden
Geotechnical evaluation of anchor concepts K13
10205546-12-NOT-090 24.05.2019 / 01 Page 30 of 39
Testing/installation performed by Sustainable Marine Energy (SME)
SME successfully installed four subsea rock anchors at 35 m water depth. The in-house developed Anchoring Remotely Operated Vehicle (AROV) was used for the installation. The anchors are “expanding” meaning there are no need for grout. The installed anchors are 3.5 m and holding capacity of 100t (approximately 1000 kN).
According to /21/ there are funding to launch a project to develop and demonstrate generic foundation mooring solution to reduce cost and improve organization and methods. “The anchor solution will undergo an extensive verification and validation campaign including subsystem testing followed by open sea testing”.
Figure 5-13. The AROV rig /26/.
A capacity chart presented by the provider refers to single anchor capacity of 500 t and multiple anchors installed in templates with total capacity of more than 1000 t. The outlay of the Raptor mechanical anchor is presented in Figure 5-14.

Concept development, floating bridge E39 Bjørnafjorden
Geotechnical evaluation of anchor concepts K13
10205546-12-NOT-090 24.05.2019 / 01 Page 31 of 39
a)
b)
Figure 5-14. The Raptor Anchor /26/.
Figure 5-15. The Raptor Anchor capacity chart /26/.

Concept development, floating bridge E39 Bjørnafjorden
Geotechnical evaluation of anchor concepts K13
10205546-12-NOT-090 24.05.2019 / 01 Page 32 of 39
Drill test Ischebeck 196/130 (outer/inner diameter)
The drill test was performed in March 2018, Ennepetal, Germany, and performed by the drilling contractor Neidhardt Grundbau GmbH. The test was performed onshore, evaluates the performance of drill equipment for the 196/130 anchor; drill bit, drill rig/torque, anchor system in general. The Ischebeck Titan 196/130 anchor ultimate capacity is 8 MN.
Four Titan 196/130 piles/anchors were drilled with different drill bits. The test concludes that the drill rig was capable of drilling to 24 m depth in rock and weathered rock. At 24 m the drill rig used for the trials was not performing anymore. A rig with larger torque will allow to drill even deeper piles. The best performance was documented by the carbide cross cut Ø340 mm drill bit (given the rock properties at the test site).
Figure 5-16. Carbide cross cut Ø340 mm, Titan 196/130, 3 m long, Coupling nut Ø254 x 600 mm.
5.5.5 Conclusive remarks on SRA
The technology is developed from being “non-existing” to having installed the first subsea rock anchors (SRA) in a few years. The offshore renewables energy sector drives the development as these anchors may reduce costs for offshore foundations supporting wave, tidal and wind energy structures.
The foundation - rock anchor system can be used to anchor inclined tension loads. Multiple rock anchors can be installed in a template and add up to a required design holding capacity. Given the current design loads, it seems that a foundation with 1 – 3 post-tensioned rock anchors (Ishebeck 196/129) will provide satisfactory holding capacity (given several assumptions).
The technology is developed – and is available also for the Bjørnafjorden floating bridge. The foundation-rock anchor system is beneficial in terms of cost and schedule. These are “small” structures compared to e.g. gravity anchors. Nevertheless, even if Ischebeck anchors are well proven and documented for onshore application, one should evaluate if there are specific requirements related to offshore use.
The design life for the Bjørnafjorden anchors is 100 years, which sets significantly more strict demands to the anchor design compared to a traditional renewables structure with a design life of e.g. 25 years. Further, the consequence of a failure, both with respect to loss of human life and economic impact is more significant for the Bjørnafjorden floating bridge compared to a traditional renewables energy structure. Several topics needs more discussion e.g. loss of pre-tension over time (creep), redundancy, material performance over the design life, and more.
This study does not recommend applying rock anchors as an alternative to anchor the mooring lines for the Bjørnafjorden floating bridge at the current phase. The main reason for this conclusion is that such anchors are not yet installed subsea at the water depths and rock surface slopes relevant for this project. In addition, the work with the concept development at this stage will only rely on pre-accepted conventional solutions.

Concept development, floating bridge E39 Bjørnafjorden
Geotechnical evaluation of anchor concepts K13
10205546-12-NOT-090 24.05.2019 / 01 Page 33 of 39
Further actions can be initiated to investigate the current SRA technology, and assess what must be done to arrive at a feasible concept that can satisfy the project requirements. Such a study is not part of the current scope, further work within this topic will therefore not be done during this phase.
6 Pros and cons
Suction anchor
The main risks identified for the suction anchor concept are as follows:
A potential submarine slide will cause a significant load impact which may act over the entire anchor height (from skirt tip to anchor top) or over the depth with moving slide masses. Dependent on the slide geometry the anchor may or may not be designed to withstand such impact. The most critical issue is the potential ploughing depth of the submarine slide. Determination of the ploughing depth is not straight forward and no general guidance or methodology exists. Interpretation of some of the old slides that have occurred in Bjørnafjorden indicate that the ploughing depth could have been deeper than 15 m. In phase 3 of the Bjørnafjorden floating bridge study it was estimated that with a ploughing depth up to 10 m it might be possible to design a suction anchor such that it could resist a submarine slide. However this will require a very large anchor like D=12 m penetrated to 25 m. In theory this could then be possible at about 11 of the anchor locations but it should be noticed that slide impact calculations are uncertain.
The main advantages identified for the suction anchor concept are as follows:
Suction anchors have been used as permanent moorings for a large number of offshore projects. It is flexible in the sense that the anchor size is tailor made for each project dependent on soil conditions and loads. Worldwide experience exist from installation of anchors with diameter varying from D=2 m to as much as D=16 m. Suction anchors have been penetrated in clay to depths >30m. The anchor is penetrated at its dedicated location to its design target depth and both design and installation methods are proven technology. No failures in operation have to date been reported.
SEPLA
The main risks identified for the SEPLA concept are as follows:
The anchor sizes needed to resist the given design loads are larger than the anchor sizes used so far for temporary moorings in soft clays.
SEPLA anchors have primarily been used for temporary moorings and for one permanent mooring in the Gulf of Mexico.
The anchor size mainly needed for Bjørnafjorden (77 m2) is under development, so the apparent applicable solution with SEPLA anchors is not "proven technology".
We foresee significant development effort and costs before a SEPLA solution is documented feasible.
Since the top of the plate can be located several meters below seabed the SEPLA may "survive" a submarine slide but the sediment thickness above the SEPLA after a potential slide will be uncertain. The sediment thickness above the plate after the slide will affect the holding capacity which then could be lower or higher than before the slide.

Concept development, floating bridge E39 Bjørnafjorden
Geotechnical evaluation of anchor concepts K13
10205546-12-NOT-090 24.05.2019 / 01 Page 34 of 39
The main advantages identified for SEPLA concept are as follows:
The holding capacity vs. anchor weight ratio is high, meaning the amount of steel is low compared to other anchor types such as suction anchors and gravity anchors.
The anchor will need to be installed to a significant depth in order to provide sufficient holding capacity . In concequence the anchor is less likely to interact with a landslide compared to other anchor types such as suction anchor and gravity anchors.
VLA
The main risks identified for VLA concept are as follows:
The VLA anchor is installed by pulling it into the seabed until it reaches the intended position. The installation process and the behaviour of the anchor during the actual installation phase is partly dependent of the actual marine operation, where parameters such as installation speed and environmental conditions (seastate, wind etc.) may affect the performance of the anchor during the installation phase.
We are not aware of any accurate method to confirm the calculated penetration depth post installation. However, the anchor manufacturer (Vryhof) has developde a method where they have previously estimated the final penetration depth. For detail information on depth verifications reference is made to the Stevmanta VLA user guide, ref. /3/.
It is crucial for the documentation of the ultimate pullout capacity to verify the final penetration. Hence, it is recommended to study this topic in detail before the VLA concept is adopted. One way to reduce the uncertainties regarding final penetration is to perform full scale test installations in the actual site.
It could also be mentioned that Vryhof has previously worked with the develpopment of a instrumentation device (stevtracker), which provided information of the position of the anchor post installation. It is however believed that the work with developing this tracker was stopped before the technology was “proven”. If this device or another similar device are available and the technology is “proven”, this could also be used to document the final position of the anchor.
As mentioned in the bullet above it may be challanging to predict the final position of the anchor. According to the anchor manufacturer (Vryhof) the Stevmanta anchor typically drag between 1 and 1.4 times the penetration depth, ref Stevmanta user guide. /3/. Therefor one may need several attempts in order to reach the exact intended position of the anchor. This impose a risk with regards to a anchor installation time.
The anchors could potentially be installed to a depth close to the underlying bedrock in order to provide suficient holding capacity. The consequences of potential interaction between the anchor and the bedrock should be thoroughly investigated. A proper safety margin should be adopted for the installation in order to minimize the risk of damage the anchor due to potential interaction with the underlying bedrock. For the study herein a safety margin of 5.5m is adopted.
The largest VLA ever installed is, according to the anchor manufacturer, 28m2 hence, there are no available track record for a 45m2 Stevmanta anchor. However, the concept as such, is still considered “proven”.

Concept development, floating bridge E39 Bjørnafjorden
Geotechnical evaluation of anchor concepts K13
10205546-12-NOT-090 24.05.2019 / 01 Page 35 of 39
The main advantages identified for VLA concept are as follows:
The holding capacity vs. anchor weight ratio is high, meaning the amount of steel is relatively low compared to other anchor types such as suction anchors and gravity anchors.
The anchor will need to be installed to a significant depth in order to provide sufficient holding capacity.. The main advantage for considering this type of anchor is that it is less likely to interact with a landslide because it is located deeper than the likely landslide ploughing depth.
DPA
The main risks identified for the DPA concept are as follows:
Only two large scale DPA’s are installed, these were installed at Gjøa, offshore Norway. The DPA’s were instrumented and the installation is well documented.
The analyses show that a DPA exceeding currently produced sizes will be required (scale factor 1.3), depending on the design line load and line angle.
Design capacity depends on successful penetration to target depth, only few cases are reported from the field: Prototype testing inTrondheimsfjorden (scale 1:3), prototype testing at Troll (scale 1:3), Large scale installation at Gjøa (scale 1:1, 75 tons, 13 m length). The Gjøa anchors were used to anchor a mobile drilling unit. It shall be noted that the observed penetration depths aligned well with the predicted values.
Penetration rate in granular material is not evaluated here. The penetration depth in sand/gravel etc. will be reduced due to increased penetration resistance. Effects on penetration depth and holding capacity must be evaluated if layers of sand/gravel occurs at the site.
The study concludes that the target penetration will be close to the bedrock elevation, some margins should be applied.
The main advantages identified for DPA concept are as follows:
The DPA concept is comparable to the torpedo pile concept utilized by Petrobras. When experience with the DPA concept is rather scarce, the field experience with the torpedo pile is more extensive.
The installation of the DPA is simple and time effective. No external energy required, no orientation requirements, precise horizontal positioning, low sensitivity to increasing water depth.
Due to the anchor’s low cross-section area, hydrodynamic forces are limited when lowering through the splash zone and water column and therefore installation is not as weather sensitive as other anchor types may be.
The anchor will need to be installed to a significant depth in order to provide sufficient holding capacity. In concequence the anchor is less likely to interact with a landslide compared to other anchor types such as suction anchor and gravity anchors.
Subsea Rock Anchor (SRA)
The main risks identified for the SRA concept are as follows:
The equipment developed by McLaughlin & Harvey is not yet tested in an uncontrolled offshore environment.

Concept development, floating bridge E39 Bjørnafjorden
Geotechnical evaluation of anchor concepts K13
10205546-12-NOT-090 24.05.2019 / 01 Page 36 of 39
The Raptor Rock Anchor installed by SME utlize a mechanical locking mechanism and no grout, which may be a risk in itself. The installation is easier, but the long-term holding capacity might be fragile, only dependent on the mechanical locking.
The technology is at an early stage – SME installed the first subsea Rock Anchors ever installed in 2016. The subsea installation tehcnology is thus not well proven.
The ischebeck anchors are well proven onshore, further technology qualification for offshore use will have to be addressed.
The main advantages identified for the SRA concept are as follows:
The drill rig developed by McLauglin and Harvey installs Ischebeck anchors which is a well proven and certified anchor onshore. The rig can install the largest Ischebeck anchor 196/129 with ultimate capacity 8000 kN, the service capacity being 4000 kN /20/ /25/. Horizontal load tests of the foundation-rock anchor system confirms lateral holding capacity of 0.7 – 0.8 times the vertical applied load (post tensioned). According to /25/, foundations (templates) with several anchors can be installed and thus add up to a required design capacity.
According to Bergamo et al. /24/ and McLaughlin and Harvey /25/, The horizontal component of the load is resolved through the friction generated between the foundation and the rock of the sea bed generated by the tension loads locked into the anchor. The resistance to horizontal displacement offered by the anchor itself, a mechanism that arises when the foundation footing – rock coupling has already failed, was not analyzed. The concept thereby elude the perhaps most critical failure mode revealed in the study presented in /22/. Following the concept including a foundation with a post-tensioned rock anchor, failure due to moment/bending of the rock anchor is not brought up as a critical issue.
The McLaughlin & Harvey drill rig is developed with the purpose of installing rock anchors at 30-70 m water depths, the equipment can be adjusted to accommodate larger water depths /25/.
The drill rig developed by Sustainable Marine Energy (SME) has installed subsea rock anchors with 100 t lateral holding capacity at 35 m water depth /21/.
7 Hybrid anchor and gravity anchor The following information is directly based on the results presented in Phase 3 of the project. Phase 3 anchor concepts: Base case anchor concepts from Phase 3 studies are as follows:
1. Suction anchors used in general 2. Hybrid anchors (gravity and suction) at tentatively 2 locations 3. Gravity anchor at tentatively 6 locations
Hybrid anchor: The hybrid anchor concept was selected in areas where the sediment thickness is too thick to suitable for gravity anchors and at the same time too thin to be suitable for standard suction Anchors. This concept was selected based on the assumption that the anchors needed to resist a load equivalent with the breaking strength of the mooring line (approx. 14000kN). The concept can

Concept development, floating bridge E39 Bjørnafjorden
Geotechnical evaluation of anchor concepts K13
10205546-12-NOT-090 24.05.2019 / 01 Page 37 of 39
be explained by a large diameter circular anchor, that gets additional holding capacity from rockfill,
installed in front of the anchor (additional gravity), see Figure 7-1.
Figure 7-1 Principal sketch of hybrid anchor concept
Should the project decide that it is acceptable to design the anchors for the actual calculated loads for each individual mooring line the two hybrid anchors it is expected that this concept can be changed to suction anchors, i.e. there would not be any need for additional capacity from rockfill. According to the phase 3 mooring analysis results the design ULS loads, in the two mooring lines where it was selected mix anchor (line 25 & 27), is 6730kN and 4869kN respectively. This is less than half of the breaking strength of the mooring lines. Calculations made in the phase 3 studies, with these loads, indicated that the required diameter of a suction anchor, without any supportive rockfill, is approximately 18-20m if the embedded skirt length is 7m. Gravity anchor: Gravity anchor were selected in areas where there are no, or limited, sediment thickness. These anchors are basically open steel boxes, which are filled with high-density rock (Olivine). This concept may require that soft sediment, which could be locally present in bedrock depressions, is being removed by means of dredging. To make sure the anchor has full contact with the bedrock surface a rockfill “carpet” is installed, on which the gravity anchors then are located.
Figure 7-2 Principal sketch of gravity anchor
For detailed information regarding hybrid anchor and gravity anchor, se the phase 3 anchor report, ref. /1/ (“SBJ-31-C3-MUL-22-RE-110”).

Concept development, floating bridge E39 Bjørnafjorden
Geotechnical evaluation of anchor concepts K13
10205546-12-NOT-090 24.05.2019 / 01 Page 38 of 39
8 References
/1/ Multiconsult/NGI/Aker AS
Report SBJ-31-C3-MUL-22-RE-110 Analysis and design (Base case)
/2/ Wilde, B. et al (2001)
Field testing of suction embebbed plqte anchors
Proc. Eleventh International Offshore and Polar Engineering Conference
Stavanger, Norway June 17-22, 2001
/3/ Vryhof Stevmanta manuel/users guide, document no. SOZ\170626, datetd 26 June 2017
/4) Beirne, C.O., Loughlin C.D.O., Wang, D., Gaudin C. “ Capacity of dynamically installed anchors as assessed through field testing and three-dimensional large-deformation finite
element analyses” Can.Geotech.Journal vol.52: 548-562 (2015)
/5/ Beirne,C.O., Loughlin C.D.O., Gaudin C. “A release-to-Rest model for Dynamically Installed Anchors” J. Geotechnical and Geoenvironmental Engineering, 2017, vol 143(9)
/6/ DNVGL-OS-C101 (2015)
Design of offshorte steel structures, general . LRFD method
/7/ NGI (2004)
HVMCAP suite of programs designed for calculating holding capacity of skirted foundations and anchors in clay
/8/ DNVGL-RP-E303 (2017)
Geotechncial design and installation of suction anchors in clay
/9/ DNV-RP-E302
Design and installation of plate anchors in clay
/10/ Vryhof
Anchor manual- the guide to anchoring (fifth edition), dated Jan. 2015
/11/ DNVGL-RP-C212 (2017)
Offshore soil mechanics and geotechnical engineering
/12/ DNVGL-ST-0119 (2018)
Floating wind turbine structures
/13/ ISO 19901-4 (2016)
Geotechnical and foundation design considerations in offshore construction

Concept development, floating bridge E39 Bjørnafjorden
Geotechnical evaluation of anchor concepts K13
10205546-12-NOT-090 24.05.2019 / 01 Page 39 of 39
/14/ Sousa J.R.M. de, Aguiar C.S. de, Ellwanger G.B., Porto E.C., Foppa D. and Medeiros Jr. C.J. de “Undrained Load Capacity of Torpedo Anchors Embedded in Cohesive Soils” J. of Offshore Mech. and Arctic Eng., Vol. 13. August 2010
/15/ NGI (2016)
Report SBT-PGR-RE-203-010-1 Soil investigation – Data interpretation and evaluation of representative geotechnical parameters
/16/ Lieng, J.T., Tjelta, T.I., and Skaugset, K. 2010. “Installation of two prototype deep penetrating anchors at the Gjøa Field in the North Sea” In Proceedings of the 2010 Offshore Technology Conference, Houston, Texas, USA, Paper No. OTC 20758
/18/ Vryhof: email from vryhof with information that there are drawings inplace for anchors up to 45m2 Stevmanta anchors, sent to Daniel Melin the 14th January. 2019 at 14:52.
/19/ AMC (2019). AMC status 1 – Geotechnical evaluation of anchor concepts K13. Doc. No. 10205546-12-NOT-051.
/20/ Mc Sherry M., Callan D. “Innovative Foundation Installation Techniques for Offshore Renewables Projects” Presentation by McLaughlin & Harvey Offshore
/21/Press release at The European Marine Energy Centre LTD (EMEC) website: CorPower and Sustainable Marine Energy join forces to tackle foundations and moorings, dated October 31. 2018: http://www.emec.org.uk/press-release-corpower-and-sustainable-marine-energy-join-forces-to-tackle-foundations-and-moorings/
/22/ SBJ-31-C3-MUL-23-RE-200 Bjørnafjorden, straight floating bridge phase 3 Bedrock anchor qualification
/23/SBJ-31-C3-MUL-22-RE-110, Bjørnafjorden, straight floating bridge phase 3, Analysis and design (Base Case), appendix J – Design of anchorages
/24/Bergamo P. et al. Evaluation of full scale shear performance of tension anchor foundations: Load displacement curves and failure criteria. In Ocean Engineering vol.131 (2017) p. 80-94.
/25/ E-mail communication with McLaughlin & Harvey (Damian Callan)
/26/ Direct Embedment Anchor Solutions – Raptor Rock Anchors – Sustainable Marine Energy ltd. Data sheet
/27/ Coerschulte F, Andric A. Ischebeck Titan Presentation, Drill trial TITAN 196/130