moscop a fac x r -fr tology - uc davis healthr -fr tology farz fereidouni 1, z t. h 1, m tian 1, aus...
TRANSCRIPT

Articleshttps://doi.org/10.1038/s41551-017-0165-y
© 2017 Macmillan Publishers Limited, part of Springer Nature. All rights reserved.
1Department of Pathology and Laboratory Medicine, University of California Davis Medical Center, Sacramento, CA, USA. 2Department of Biochemistry and Molecular Medicine, University of California Davis Medical Center, Sacramento, CA, USA. 3Lawrence Livermore National Laboratory, Livermore, CA, USA. 4University of Rochester, Rochester, NY, USA. *e-mail: [email protected]
High-quality tissue microscopy is central to the diagnosis and management of neoplasms, as well as other diseases. However, the bright-field (transmission) design of clini-
cal microscopes requires optically thin (4–6 µ m) slices of tissue mounted onto glass slides. Preparation of these slides is costly, generates toxic reagent waste, exhausts small samples and, perhaps most importantly, involves delays of hours to days that can adversely affect patient care as well as the efficiency of basic and preclinical research. Preparing frozen tissues, as opposed to formalin-fixed, paraffin-embedded (FFPE) sections of fresh tissues, is a more rapid alternative but requires considerable expertise and the results are often unsatisfactory1.
Optical alternatives that can acquire cellular-scale images directly from tissue surfaces without micro- or cryosectioning are under development. Approaches include structured illumination2, conventional reflectance and fluorescence confocal microscopy3, multi-photon imaging4, spectrally encoded confocal microscopy5, stimulated Raman microscopy6, light-sheet microscopy7,8 and optical coherence tomography9, among others. While all appear promising, they have yet to be widely adopted by the cost-sensitive and technologically conservative field of pathology.
We present a simple and cost-effective, fluorescence-based, slide-free optical imaging system: microscopy with ultraviolet sur-face excitation (MUSE). MUSE images can resemble those from standard histology slides and bright-field microscopes while also providing surface and colour contrast features not usually pres-ent in standard haematoxylin and eosin (H&E) preparations. The approach relies on two phenomena. First, ultraviolet (UV) excitation light, particularly at wavelengths shorter than 300 nm, penetrates the tissue just a few μ m deep; that is, the approximate thickness of a typical histology slide. This property of light–tissue interaction has been appreciated in previous work using a tunable laser intended
to examine wavelength-dependent native tissue autofluorescence for in vivo diagnostic purposes. It was noticed that excitation with light below 300 nm generated images with dramatically improved contrast and sharpness10,11. Second, excitation light in this same sub-300 nm spectral range can elicit bright emission from tissue speci-mens stained with conventional fluorescent dyes. Despite being excited in the relatively deep UV, these stains emit photons in the visible range. The visible-band signals can then be captured using simple-to-operate and inexpensive conventional glass-based micro-scope optics and either grayscale or colour cameras. Fortunately, some of the dyes with this favourable excitation-emission behaviour have proved to label tissue components with specificities resembling those of H&E.
Since the excitation light is localized to within a few μ m of the surface, tissue sectioning is not required for achieving a high-con-trast subcellular-scale image. Tissues—either fresh or fixed—can be stained and imaged with MUSE (at 3–10 frames s–1) within just a few minutes, compared with delays of hours or days associated with current methods. Using colour-mapping approaches, the original fluorescence images can be converted to mimic conventional H&E staining or, alternatively, novel optimized colour display schemes can be used12. Finally, MUSE is non-destructive, meaning that small biopsy specimens can be imaged and then submitted for additional downstream studies as necessary. Preliminary results and examples of MUSE in dermatology were recently described13,14.
Based on experience to date exploring the MUSE approach, we dis-cuss the key elements of the optical design and describe the associated straightforward staining methodology. Examples of slide-free imaging of a variety of tissue specimens are provided, and these are compared with conventional H&E histology. In some instances, we show that MUSE can also generate images that contain information unobtain-able using standard thin sections and bright-field microscopy.
Microscopy with ultraviolet surface excitation for rapid slide-free histologyFarzad Fereidouni1, Zachary T. Harmany 1, Miao Tian1, Austin Todd1, John A. Kintner1, John D. McPherson 2, Alexander D. Borowsky1, John Bishop1, Mirna Lechpammer1, Stavros G. Demos3,4 and Richard Levenson 1*
Histological examination of tissues is central to the diagnosis and management of neoplasms and many other diseases and is a foundational technique for preclinical and basic research. However, commonly used bright-field microscopy requires prior preparation of micrometre-thick tissue sections mounted on glass slides—a process that can require hours or days, contributes to cost and delays access to critical information. Here, we introduce a simple, non-destructive slide-free technique that, within minutes, provides high-resolution diagnostic histological images resembling those obtained from conventional haematoxylin and eosin histology. The approach, which we named microscopy with ultraviolet surface excitation (MUSE), can also gener-ate shape and colour-contrast information. MUSE relies on ~280 nm ultraviolet light to restrict the excitation of conventional fluorescent stains to tissue surfaces and it has no significant effects on downstream molecular assays (including fluorescence in situ hybridization and RNA sequencing). MUSE promises to improve the speed and efficiency of patient care in both state-of-the-art and low-resource settings and to provide opportunities for rapid histology in research.
NATuRe BioMeDicAL eNGiNeeRiNG | www.nature.com/natbiomedeng

© 2017 Macmillan Publishers Limited, part of Springer Nature. All rights reserved. © 2017 Macmillan Publishers Limited, part of Springer Nature. All rights reserved.
Articles Nature Biomedical eNgiNeeriNg
ResultsUV surface excitation. The optical system comprises one or more UV light-emitting diodes (LEDs) and a UV-compatible sample stage, complemented by conventional microscope components (Fig. 1a). Oblique UV excitation light illuminates the specimen, bypassing the glass microscope lens, which, as it is opaque in the sub-300 nm spectral region, serves as an intrinsic excitation filter that blocks backscattered UV light from the optical path. The oblique excitation angle, compared with full en-face illumina-tion, can also generate shading across the face of a specimen that usefully highlights tissue surface topography (Fig. 1c). MUSE is distinct from other UV microscope systems (for example, refs 15,16), which detect fluorescence emission from, or absorbance by, thinly sectioned samples, largely in the UV spectral range. Unlike MUSE, such instruments require the use of special UV-transmitting or reflecting objective lenses.
The advantage provided by sub-300 nm UV excitation com-pared with visible-range excitation is demonstrated in Fig. 1b,c. The cut surface of an unfixed lamb kidney specimen was stained with eosin (a fluorescent and chromogenic dye) and excited using either a visible-range 405 nm LED (launched via a traditional dichroic mirror with an accompanying in-line emission filter) or an off-axis 280 nm UV LED. Images were captured with a mono-chrome charge-coupled device camera (see Methods for details) with the objective focused on the surface of the specimen. In this example, the 405 nm excitation generated an image with low over-all contrast due to out-of-focus signals originating from multiple tissue depths. In comparison, 280 nm excitation of the same field
provided a sharp, high-contrast image with clearly demarcated kid-ney tubules arranged among bundles of collecting ducts because the UV excitation was restricted to regions very close to the surface.
To identify optimal excitation wavelengths for MUSE, a tunable laser was used to illuminate stained cardiac tissue. Images were acquired as the excitation was stepped from 350 nm to 210 nm. The results suggest that wavelengths from about 290 to 240 nm generate similar surface-limited excitation (Supplementary Fig. 1). See also Supplementary Fig. 2 and Supplementary Note 1 for further discussion.
280 nm UV excitation and standard fluorescent dyes. A variety of exogenous dyes were sought that would be excitable at 280 nm, emit in the visible range and stain diagnostically relevant tissue features (nuclei, cytoplasm and extracellular components)17. Such behaviour (UV excitation with visible emission) would appear to be incon-sistent with the narrow Stokes shifts usually associated with many fluorescent labels, but many visible-range fluorophores are in fact excitable in the less familiar, sub-300 nm spectral region, as illus-trated with 4',6-diamidino-2-phenylindole (DAPI) and rhodamine in Fig. 1d (see Supplementary Note 2 for additional discussion). Consequently, multiple stains can be combined, all excited at 280 nm while emitting across the visible range. The resulting colour signals are then captured simultaneously using a colour camera—of course, more sophisticated sensors can be used as well. As an example, a kidney specimen stained for 10 s with a rhodamine–Hoechst solu-tion is shown in Fig. 1e,f. In addition to nuclear and parenchymal staining, the elastic laminae of the artery are visible in orange, while
b c e
d
f
0.00
0.25
0.50
Inte
nsity
(a.u
.)
0.75
1.00
Wavelength (nm)250
280 310 340370
400430
460490
520550
580610 640
670700
DAPIRhodamine
DAPIRhodamine
aUV window
Specimen
Camera
XYZ stage
LEDObjective
Tube lens
Emission
405 nm 280 nm
Excitation
S0Excitation
S2
Fig. 1 | Principles of MuSe: surface-weighted excitation and long Stokes-shift fluorescence emission. a, Schematic diagram of the MUSE optical design. An inverted microscope design is used, modified to include a UV-transparent stage and off-axis UV LED illumination. b,c, Unfixed ovine kidney, cut surface prepared via razor blade, stained with eosin and imaged using a greyscale camera excited with 405 nm (b) and 280 nm (c) sources. Tubules and collecting ducts are easier to discern with 280 nm UV because of its surface-limited tissue penetration. d, 280 nm light excites multiple dyes that emit in the visible range due to the S0–S2 excitation (shown in yellow) followed by S1–S0 relaxation. Excitation and emission spectra for DAPI and rhodamine are shown. e, Image captured from the cut surface of a thick, formalin-fixed porcine kidney specimen stained for 10 s with a mixed solution of rhodamine and Hoechst and excited using a 280 nm UV LED. Multiple colours are visible, showing the muscular artery’s internal and external laminae (orange), collagen (blue), nuclei (lilac) and tubules (orange and green). Endothelial cell nuclei extending down inside the artery are also visible. f, Magnified image of the section marked by a yellow box in e. Scale bars, 100 μ m.
NATuRe BioMeDicAL eNGiNeeRiNG | www.nature.com/natbiomedeng
© 2017 Macmillan Publishers Limited, part of Springer Nature. All rights reserved. © 2017 Macmillan Publishers Limited, part of Springer Nature. All rights reserved.
ArticlesNature Biomedical eNgiNeeriNg
collagen demonstrates an intrinsic blue autofluorescence. Moreover, the oblique illumination and the extended depth of the unsectioned specimen provides a glimpse down into the vessel, the nuclei of the endothelial lining cells vanishing out of the field of view.
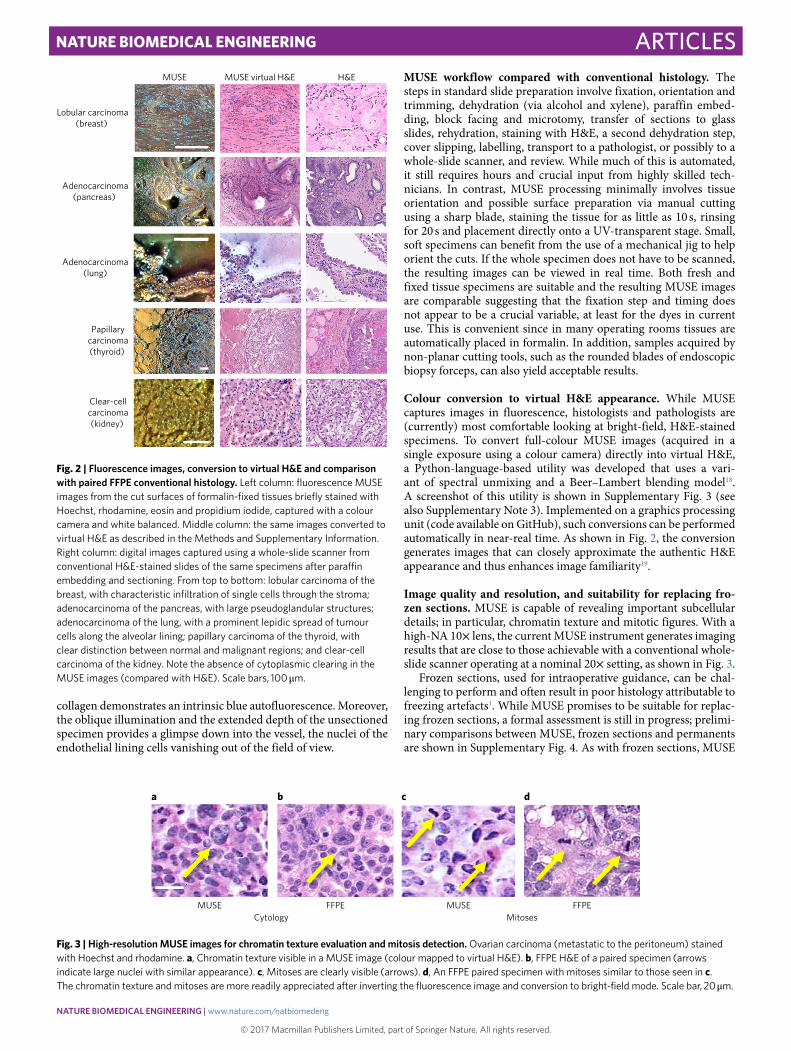
MUSE workflow compared with conventional histology. The steps in standard slide preparation involve fixation, orientation and trimming, dehydration (via alcohol and xylene), paraffin embed-ding, block facing and microtomy, transfer of sections to glass slides, rehydration, staining with H&E, a second dehydration step, cover slipping, labelling, transport to a pathologist, or possibly to a whole-slide scanner, and review. While much of this is automated, it still requires hours and crucial input from highly skilled tech-nicians. In contrast, MUSE processing minimally involves tissue orientation and possible surface preparation via manual cutting using a sharp blade, staining the tissue for as little as 10 s, rinsing for 20 s and placement directly onto a UV-transparent stage. Small, soft specimens can benefit from the use of a mechanical jig to help orient the cuts. If the whole specimen does not have to be scanned, the resulting images can be viewed in real time. Both fresh and fixed tissue specimens are suitable and the resulting MUSE images are comparable suggesting that the fixation step and timing does not appear to be a crucial variable, at least for the dyes in current use. This is convenient since in many operating rooms tissues are automatically placed in formalin. In addition, samples acquired by non-planar cutting tools, such as the rounded blades of endoscopic biopsy forceps, can also yield acceptable results.
Colour conversion to virtual H&E appearance. While MUSE captures images in fluorescence, histologists and pathologists are (currently) most comfortable looking at bright-field, H&E-stained specimens. To convert full-colour MUSE images (acquired in a single exposure using a colour camera) directly into virtual H&E, a Python-language-based utility was developed that uses a vari-ant of spectral unmixing and a Beer–Lambert blending model18. A screenshot of this utility is shown in Supplementary Fig. 3 (see also Supplementary Note 3). Implemented on a graphics processing unit (code available on GitHub), such conversions can be performed automatically in near-real time. As shown in Fig. 2, the conversion generates images that can closely approximate the authentic H&E appearance and thus enhances image familiarity19.
Image quality and resolution, and suitability for replacing fro-zen sections. MUSE is capable of revealing important subcellular details; in particular, chromatin texture and mitotic figures. With a high-NA 10× lens, the current MUSE instrument generates imaging results that are close to those achievable with a conventional whole-slide scanner operating at a nominal 20× setting, as shown in Fig. 3.
Frozen sections, used for intraoperative guidance, can be chal-lenging to perform and often result in poor histology attributable to freezing artefacts1. While MUSE promises to be suitable for replac-ing frozen sections, a formal assessment is still in progress; prelimi-nary comparisons between MUSE, frozen sections and permanents are shown in Supplementary Fig. 4. As with frozen sections, MUSE
Clear-cellcarcinoma(kidney)
Lobular carcinoma(breast)
Adenocarcinoma(pancreas)
Adenocarcinoma(lung)
Papillarycarcinoma(thyroid)
MUSE MUSE virtual H&E H&E
Fig. 2 | Fluorescence images, conversion to virtual H&e and comparison with paired FFPe conventional histology. Left column: fluorescence MUSE images from the cut surfaces of formalin-fixed tissues briefly stained with Hoechst, rhodamine, eosin and propidium iodide, captured with a colour camera and white balanced. Middle column: the same images converted to virtual H&E as described in the Methods and Supplementary Information. Right column: digital images captured using a whole-slide scanner from conventional H&E-stained slides of the same specimens after paraffin embedding and sectioning. From top to bottom: lobular carcinoma of the breast, with characteristic infiltration of single cells through the stroma; adenocarcinoma of the pancreas, with large pseudoglandular structures; adenocarcinoma of the lung, with a prominent lepidic spread of tumour cells along the alveolar lining; papillary carcinoma of the thyroid, with clear distinction between normal and malignant regions; and clear-cell carcinoma of the kidney. Note the absence of cytoplasmic clearing in the MUSE images (compared with H&E). Scale bars, 100 μ m.
MUSE FFPEFFPE MUSECytology Mitoses
a b c d
Fig. 3 | High-resolution MuSe images for chromatin texture evaluation and mitosis detection. Ovarian carcinoma (metastatic to the peritoneum) stained with Hoechst and rhodamine. a, Chromatin texture visible in a MUSE image (colour mapped to virtual H&E). b, FFPE H&E of a paired specimen (arrows indicate large nuclei with similar appearance). c, Mitoses are clearly visible (arrows). d, An FFPE paired specimen with mitoses similar to those seen in c. The chromatin texture and mitoses are more readily appreciated after inverting the fluorescence image and conversion to bright-field mode. Scale bar, 20 μ m.
NATuRe BioMeDicAL eNGiNeeRiNG | www.nature.com/natbiomedeng

© 2017 Macmillan Publishers Limited, part of Springer Nature. All rights reserved. © 2017 Macmillan Publishers Limited, part of Springer Nature. All rights reserved.
Articles Nature Biomedical eNgiNeeriNg
does not always faithfully reproduce some familiar and often useful artefacts attributable to FFPE processing20. For example, the clear-cell carcinoma example in Fig. 3 does not show the eponymous cleared cytoplasm visible in the H&E image.
Extended field of view or 'whole-slide' imaging. In regular his-tology practices, the size of the tissue to be imaged is limited by the capability of the sectioning instrumentation. Large-format microtomes, in use at a few sites, are expensive and technically chal-lenging. However, experience suggests that large fields of view can provide insights not discernible with conventionally sized slides21. A MUSE system equipped with a suitable stage can scan arbitrarily large specimens; for example, entire adult brain slices, with the
resolution uncoupled from sample dimensions. Examples of multi-field stitched images are shown in Fig. 4.
The imaging speed is acceptable for collecting these large fields of view. Individual 10× images are currently captured at about 5 frames s–1, which permits imaging a 15 mm × 15 mm region within about 2–3 min. Higher-power LEDs would shorten the imaging time further. This scan time is comparable to that of conventional bright-field whole-slide scanners, with the proviso that whole-slide scanners typically use effective lens magnifications of at least ~20× , providing somewhat higher spatial resolution than the 0.6 μ m provided by the 10× , 0.45 numerical aperture objective used in the present studies. While the current 10× objective can gener-ate sub-nuclear resolution that may be adequate for most applica-tions, MUSE systems deploying higher magnification objectives are technically feasible.
Preliminary validation studies. As with bright-field whole-slide imaging, which was recently cleared by the Food and Drug Administration after a process examining more than 2,000 speci-mens22, MUSE will require detailed, multi-tissue, multi-pathology validation to support its clinical use. A validation study was per-formed that compared diagnoses determined from MUSE images with those derived from viewing corresponding images from H&E-stained conventional slides of the same specimens. The images were accompanied by tissue-of-origin information only. The study set consisted of 42 cases comprising both benign and malignant pro-cesses. The diagnoses made from MUSE and H&E images were essentially identical in 39 cases (a concordance rate of 93%). Of the three remaining cases, the paired diagnoses reflected alternate can-didates on the differential diagnosis list, and the third discrepant case displayed diagnostic features in the MUSE images that were originally overlooked. Some representative example images are shown in Fig. 5 and case-by-case written diagnoses plus comments are provided in Supplementary Table 1. A separate study examining MUSE applicability to neuropathology cases with positive results is also presented in Supplementary Fig. 5.
Suitability for downstream molecular analysis. Increasingly, com-plex molecular diagnostic tests are being performed on ever smaller tissue samples, and a needle biopsy may have to be called on to provide morphological diagnosis as well as molecular characteriza-tion. It would be ideal if MUSE could be used to non-destructively image such specimens (for diagnosis or sample adequacy deter-mination) without interfering with downstream procedures; for example, analysis of protein or DNA/RNA expression, targeted, exome or entire genome sequencing, or metabolomics. It is also important that prior MUSE imaging does not interfere with subse-quent standard FFPE histology, immunohistochemistry or fluores-cence in situ hybridization (FISH). The preliminary results presented in the Supplementary Information suggest that prior MUSE imaging does not interfere with these tasks (see Supplementary Figs. 6–8), although considerable further work is required to fully explore the possible effects.
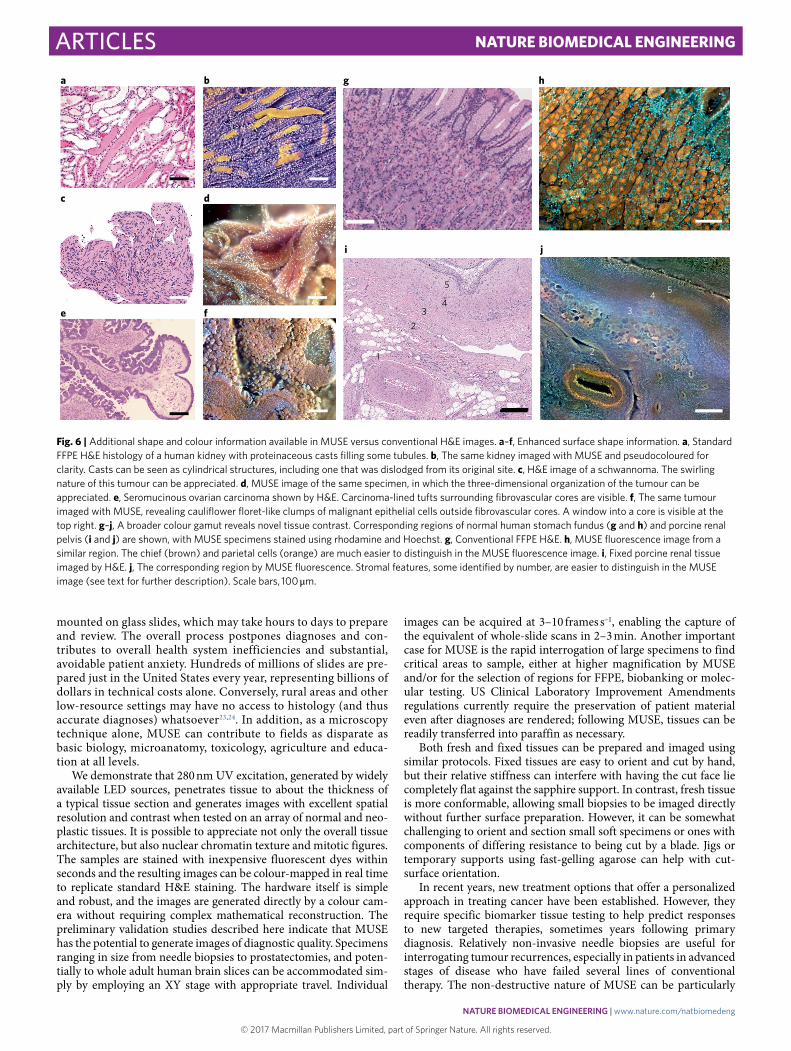
2.5-dimensional surface profiling and extended colour gamut. MUSE images can resemble conventional histology, but they also differ in several aspects. For example, three-dimensional surface profile information can be appreciated, as shown in Fig. 6a–f that is not easily perceived with the corresponding 5 μ m slices. Fig. 6a,b demonstrates proteinaceous renal tubular casts; the MUSE image (acquired with a greyscale camera and emission filters, and reco-loured for clarity) clearly visualizes their cylindrical nature (unsur-prising, but not easy to appreciate in the H&E). Fig. 6c,d compares a H&E-stained preparation of a nerve sheath tumour with the MUSE image of the same specimen. The swirling nature of the tumour can be inferred from the H&E image, but is more evident
a b c
d e f
g h i
Fig. 4 | Large-field-of-view imaging with MuSe. a–i, Formalin-fixed tissue specimens from the cerebellum (a–c), spinal cord (d–f) and porcine liver (g–i) were imaged via MUSE. Flat surfaces were prepared by cutting with a hand-held histology blade and stained with rhodamine and Hoechst (cerebellum and liver), supplemented with eosin and propidium iodide (spinal cord). Multiple fields at 10× were captured using a scanning stage and stitched together. The top row presents a region of cerebellum from a human neonate, consisting of 49 10× images, flat-fielded and stitched together using the freely available Microsoft Image Composite Editor. Purkinje cells are visible in b at the interface between the molecular and granular layers. A 6 × 6 montage of the whole paediatric spinal cord cross-section imaged in d–f is available at full resolution at http://www.gigapan.com/gigapans/199300. e, Neurons (orange) and capillaries are visible. An image montage (4 × 4 stitched 10× images) of the cut surface of the rhodamine-and-Hoechst-stained thick specimen of fixed porcine liver is shown in g–i. The normal liver architecture can be appreciated, while well-outlined lobules surrounding central veins and abutting portal triads consisting of portal veins, hepatic arteries and bile ducts are shown in h (see http://www.gigapan.com/gigapans/185233). Colour differences between these examples are due to intrinsic tissue properties and details of how colour channel brightness and contrast were stretched. Scale bars, 700 μ m (a,d); 300 μ m (g).
NATuRe BioMeDicAL eNGiNeeRiNG | www.nature.com/natbiomedeng

© 2017 Macmillan Publishers Limited, part of Springer Nature. All rights reserved. © 2017 Macmillan Publishers Limited, part of Springer Nature. All rights reserved.
ArticlesNature Biomedical eNgiNeeriNg
in the paired MUSE image. Finally, Fig. 6e,f examines the epithe-lium and fibrovascular core of a seromucinous ovarian carcinoma. An opening into a core can be seen in the upper right region of Fig. 6f. Additional examples of quasi-three-dimensional (thus termed 2.5-dimensional) views can be seen in Fig. 7. It is also pos-sible to acquire actual quantitative depth information using Z-stack analysis (manuscript in preparation). Interesting surface profiles imply excursions along the z axis, which poses a challenge for high-magnification (high-numerical aperture) limited depth-of-field objectives. With z-axis control, it is possible to extend the depth of field to ensure that entire specimens are in focus, as shown in Supplementary Fig. 9.
The staining repertoire available to MUSE is also broader than that seen with conventional H&E (Fig. 6g–j). For example, the stomach fundus contains two distinct cell types—chief and parietal cells. While these cell types are somewhat distinguishable in con-ventional histology, the two populations can be much more distinct following rhodamine and Hoechst staining (Fig. 6g versus Fig. 6h) Stromal components that are hard to appreciate with conventional H&E can also be better distinguished with MUSE staining. In Fig. 6i (H&E) and Fig. 6j (MUSE) from a region of the renal pelvis, features (labelled 1–5) are compared. The artery’s elastic laminae (1) and the vein (2), along with additional small vessels, are much easier to dis-cern in the MUSE image. The three stromal layers (labelled 3–5), located beneath the urothelium in the upper right corner, are tincto-rially distinct with MUSE, but are only distinguishable in the H&E
image through minor variations in texture. The stromal compo-nents reflected in these staining differences are not yet understood. The possible diagnostic utility of the 2.5-dimensional views and extended colour ranges of MUSE will require further investigation.
Additional examples of different tissue types imaged by MUSE. MUSE provides novel views of familiar tissues. Some examples of this, spanning a variety of specimens, are shown in Fig. 7. Some highlights include a remarkable cluster of histiocytes in the lung (Fig. 7a), apparently surrounded by a thin purple sheath that also connects to other clusters (and is not visible in paired FFPE speci-mens), a multicolour view of skin with elastin, collagen and melanin clearly delineated (Fig. 7c), an unusual en-face view of endocardium with underlying myocardium (Fig. 7e), a nerve above and penetrat-ing and between adipocytes from a fresh mastectomy specimen (Fig. 7f), breast ducts in stroma (Fig. 7g), skeletal muscle (Fig. 7h) and a sebaceous gland (Fig. 7i), with tinctorial differences between the stem cells at the periphery and the maturing and apoptotic cells in the interior. Finally, it is possible to use MUSE in the bright-field, transillumination mode to scan conventional whole slides, which could be a useful additional capability. An example is shown in Supplementary Fig. 10.
DiscussionAlthough current microscope-based diagnostics are familiar and in use globally, they require sectioned and stained tissue slices
MUSE Virtual H&E FFPE H&Ea b c
d e f
g h i
Fig. 5 | Sample images from the validation study with examples of concordant and discrepant diagnoses. The columns are as in Fig. 2, except all MUSE-imaged specimens were stained only with rhodamine and Hoechst. a–c, Case 18 (fixed): concordant. Benign skin with an abundant keratin layer, easily diagnosed in both MUSE and H&E modes. d–f, Case 8 (fresh): concordant. Retroperitoneal mass, easily identified as malignant neoplasm and both reviewers favoured rhabdomyosarcoma. g–i, Case 41 (fixed): mildly discrepant. The H&E reviewer favoured adrenal cortical adenoma or carcinoma, whereas the MUSE reviewer favoured pheochromocytoma, both of which are part of a potentially difficult differential that may require immunohistochemistry or other studies to resolve. Note the large tubular nucleus in the MUSE image (lower right) and compare this with the similar long, dark nuclei in the corresponding H&E image. Scale bars, 100 μ m.
NATuRe BioMeDicAL eNGiNeeRiNG | www.nature.com/natbiomedeng
© 2017 Macmillan Publishers Limited, part of Springer Nature. All rights reserved. © 2017 Macmillan Publishers Limited, part of Springer Nature. All rights reserved.
Articles Nature Biomedical eNgiNeeriNg
mounted on glass slides, which may take hours to days to prepare and review. The overall process postpones diagnoses and con-tributes to overall health system inefficiencies and substantial, avoidable patient anxiety. Hundreds of millions of slides are pre-pared just in the United States every year, representing billions of dollars in technical costs alone. Conversely, rural areas and other low-resource settings may have no access to histology (and thus accurate diagnoses) whatsoever23,24. In addition, as a microscopy technique alone, MUSE can contribute to fields as disparate as basic biology, microanatomy, toxicology, agriculture and educa-tion at all levels.
We demonstrate that 280 nm UV excitation, generated by widely available LED sources, penetrates tissue to about the thickness of a typical tissue section and generates images with excellent spatial resolution and contrast when tested on an array of normal and neo-plastic tissues. It is possible to appreciate not only the overall tissue architecture, but also nuclear chromatin texture and mitotic figures. The samples are stained with inexpensive fluorescent dyes within seconds and the resulting images can be colour-mapped in real time to replicate standard H&E staining. The hardware itself is simple and robust, and the images are generated directly by a colour cam-era without requiring complex mathematical reconstruction. The preliminary validation studies described here indicate that MUSE has the potential to generate images of diagnostic quality. Specimens ranging in size from needle biopsies to prostatectomies, and poten-tially to whole adult human brain slices can be accommodated sim-ply by employing an XY stage with appropriate travel. Individual
images can be acquired at 3–10 frames s–1, enabling the capture of the equivalent of whole-slide scans in 2–3 min. Another important case for MUSE is the rapid interrogation of large specimens to find critical areas to sample, either at higher magnification by MUSE and/or for the selection of regions for FFPE, biobanking or molec-ular testing. US Clinical Laboratory Improvement Amendments regulations currently require the preservation of patient material even after diagnoses are rendered; following MUSE, tissues can be readily transferred into paraffin as necessary.
Both fresh and fixed tissues can be prepared and imaged using similar protocols. Fixed tissues are easy to orient and cut by hand, but their relative stiffness can interfere with having the cut face lie completely flat against the sapphire support. In contrast, fresh tissue is more conformable, allowing small biopsies to be imaged directly without further surface preparation. However, it can be somewhat challenging to orient and section small soft specimens or ones with components of differing resistance to being cut by a blade. Jigs or temporary supports using fast-gelling agarose can help with cut-surface orientation.
In recent years, new treatment options that offer a personalized approach in treating cancer have been established. However, they require specific biomarker tissue testing to help predict responses to new targeted therapies, sometimes years following primary diagnosis. Relatively non-invasive needle biopsies are useful for interrogating tumour recurrences, especially in patients in advanced stages of disease who have failed several lines of conventional therapy. The non-destructive nature of MUSE can be particularly
a b
c d
e f
g h
i j
*
5 54
3
2
1
43
2
1
Fig. 6 | Additional shape and colour information available in MUSE versus conventional H&E images. a–f, Enhanced surface shape information. a, Standard FFPE H&E histology of a human kidney with proteinaceous casts filling some tubules. b, The same kidney imaged with MUSE and pseudocoloured for clarity. Casts can be seen as cylindrical structures, including one that was dislodged from its original site. c, H&E image of a schwannoma. The swirling nature of this tumour can be appreciated. d, MUSE image of the same specimen, in which the three-dimensional organization of the tumour can be appreciated. e, Seromucinous ovarian carcinoma shown by H&E. Carcinoma-lined tufts surrounding fibrovascular cores are visible. f, The same tumour imaged with MUSE, revealing cauliflower floret-like clumps of malignant epithelial cells outside fibrovascular cores. A window into a core is visible at the top right. g–j, A broader colour gamut reveals novel tissue contrast. Corresponding regions of normal human stomach fundus (g and h) and porcine renal pelvis (i and j) are shown, with MUSE specimens stained using rhodamine and Hoechst. g, Conventional FFPE H&E. h, MUSE fluorescence image from a similar region. The chief (brown) and parietal cells (orange) are much easier to distinguish in the MUSE fluorescence image. i, Fixed porcine renal tissue imaged by H&E. j, The corresponding region by MUSE fluorescence. Stromal features, some identified by number, are easier to distinguish in the MUSE image (see text for further description). Scale bars, 100 μ m.
NATuRe BioMeDicAL eNGiNeeRiNG | www.nature.com/natbiomedeng

© 2017 Macmillan Publishers Limited, part of Springer Nature. All rights reserved. © 2017 Macmillan Publishers Limited, part of Springer Nature. All rights reserved.
ArticlesNature Biomedical eNgiNeeriNg
helpful in this setting, especially for small tissue biopsies that might otherwise be significantly consumed following frozen and/or conventional sectioning. Prior MUSE imaging does not appear to interfere with subsequent conventional histology, immunohis-tochemistry, FISH or RNA sequencing (RNA-Seq) studies. In fact, FFPE-based methods (dispensable with MUSE) can themselves have deleterious effects on nucleic acid integrity25, antigen preserva-tion and retrieval26–29.
MUSE was developed with an eye towards examining manu-ally cut tissue specimens, but there are tasks that call for exam-ining closely spaced serial sections; for example, searching for small metastases in tumour-draining lymph nodes. Such fine spacing can be accomplished using vibrating blade microtomes able to slice fresh tissue at spacings of 50 μ m or less30. Another possible limitation is that some useful artefacts associated with FFPE techniques, such as the chromatin-clearing characteristic of some tumours, may not be visible in MUSE images, which in this regard resemble fine-needle aspirates or frozen sections31.
Additional differences between MUSE and conventional histol-ogy exist, some of which are advantageous and others that perhaps may be distractions. (1) As UV penetration is slightly deeper than the thickness of conventional sections, cellularity estimates trend somewhat higher and nuclear crowding may interfere with some manual or automated evaluations. (2) A broader colour palette is available than that afforded by simple H&E. Even a simple two-dye
cocktail (rhodamine and Hoechst), when combined with tissue autofluorescence (for example, from collagen and tryptophan) or under the influence of other environmental effects32, can gener-ate multiple hues. On the one hand, such hues can serve as instant special stains in histology, highlighting important features such as elastic laminae that may be poorly delineated in H&E staining. On the other hand, converting these high-content colour images into H&E-like bright-field versions without confusing the viewer who is used to viewing a limited colour range and without collapsing the extra information into just two colour channels remains an inter-esting challenge. (3) MUSE can generate 2.5-dimensional views of surface topography, revealing novel aspects of tissue organization and connectivity. While this may be an advantage in some settings, anything that diminishes the familiarity of the resulting images may be undesirable. That said, the prominence of topographical fea-tures in MUSE images can be regulated by how the surface of the specimen is prepared.
MethodsOptical design and components. As shown in Supplementary Fig. 1, the essential components of a functional system, based on an inverted microscope geometry, consist of a UV-transparent stage, one or more obliquely oriented 280 nm LEDs and a conventional microscope optical train and imaging sensor. The specimen, which can be of any thickness and is stained as described below, is supported on a 300-µ m-thick UV-transparent sapphire window (GT Advanced Technologies). The sample is oriented with a nominally flat surface, created in
a b c
d e f
g h i
Fig. 7 | examples of additional tissues imaged using MuSe. a, Lung with clusters of histiocytes encased in a fine membrane that is not visible on the corresponding H&E images (eosin and propidium iodide). b, Ovary stroma and germinal epithelium (Rhodamine and Hoechst). c, Skin with the epidermis, dermis, skin appendages, collagen (green), elastin (yellow) and dermal–epidermal melanin visible (Hoechst, rhodamine, eosin and propidium iodide), d, Spleen with a prominent blood vessel (rhodamine and Hoechst). e, Myocardium with a thin layer of endocardium covering part of the specimen (rhodamine and Hoechst). f, Fresh breast tissue with nerve coursing over and through a layer of intact adipocytes (rhodamine and Hoechst). g, Normal colon (left) next to adenocarcinoma (right). h, Pineal gland with pineal 'sand' (rhodamine and Hoechst). i, Sebaceous gland, of the cervix (rhodamine and Hoechst). Scale bars, 100 μ m.
NATuRe BioMeDicAL eNGiNeeRiNG | www.nature.com/natbiomedeng

© 2017 Macmillan Publishers Limited, part of Springer Nature. All rights reserved. © 2017 Macmillan Publishers Limited, part of Springer Nature. All rights reserved.
Articles Nature Biomedical eNgiNeeriNg
most cases using a knife or razor blade, towards the objective. The specimen can be lightly compressed against the stage to help flatten the tissue. The sapphire window is held in a custom mount attached to a motorized XYZ-translational stage (433-series; Newport) to allow for fully motorized translational scanning and focus.
The current version of the MUSE microscope prototype employs 280 nm UV-emitting LEDs for sample excitation (MTE280H32-UV; Marktech). These UV LEDs have a maximum output of 0.9 mW per LED. The light from one or more UV LEDs is focused onto the surface of the sample using short-focal-length ball lenses in an oblique off-axis orientation, illuminating an approximately 1 mm2 area. Note that recently released LEDs in the same wavelength range (Nikkiso America) can have a maximum output of 30 mW or more.
The emitted fluorescent light was collected using a variety of long-working-distance objectives (for example, 10× , numerical aperture 0.28 for Mitutoyo and 10× , numerical aperture 0.45 for Nikon) and focused using an infinity corrected tube lens (Thorlabs–ITL200 Tube Lens, F = 200 mm; Thorlabs) onto either a greyscale charge-coupled device camera (Retiga 2000 EXi, 1.5 megapixel, 6.4 µ m pixel–1; QImaging) or a Bayer-pattern colour charge-coupled device camera, such as the Micro Publisher 3.3, 3.1-Mpixel, 3.45 µ m pixel–1 (QImaging) or a 9.2-Mpixel, 3.7 µ m pixel–1, colour charge-coupled device (Ximea). The greyscale camera was used to collect the dataset for exploring the wavelength-dependent imaging depth, whereas the colour cameras were used to collect the other images shown (except for Fig. 6b). Using the 9.2-Mpixel colour camera and a 10× objective, the field of view comprised approximately 1 mm2.
In addition to the core components described above, the MUSE system was temporarily augmented with additional optics to allow for a comparison with conventional epifluorescence excitation (Supplementary Fig. 1). These included a 405 nm LED, a dichroic mirror (Thorlabs 500 LP; Thorlabs) and a long-pass emission filter (Thorlabs FEL0500; Thorlabs) To explore the wavelength-dependent depth of imaging in tissue, a laser system equipped with a tunable optical parametric oscillator (Vibrant 355I; Opotek) was used to generate excitation light in the 210–350 nm range. Mirrors were used to guide the laser light onto the sample with oblique geometry like that used by the LED excitation path, and the emitted fluorescence was collected as described above, except that a 500 nm long-pass filter was inserted to ensure that the entire range of excitation wavelengths used would be prevented from reaching the camera.
A convenient feature is that the inverted optics design of this configuration allows the scanning of conventional whole stained slides in bright-field mode simply by using room light (or appropriately configured built-in white light sources) in transmission (see Supplementary Fig. 9 for an example image).
Assessment of the depth of UV light penetration in biological tissue. To investigate the depth of penetration of the excitation light into tissue as a function of wavelength, a specimen of fresh porcine heart was stained for 16 h (to allow deep penetration into the tissue) with Hoechst 33342 (Life Technologies; 500 µ g ml–1 in PBS)—a dye that selectively labels nuclei—and the specimen was then imaged using tunable laser excitation, a blue long-pass filter and a monochrome camera (shown in Supplementary Fig. 1). The excitation light was tuned from 350 to 210 nm in 10 nm steps. At each of the 15 wavelengths used, single-field images at 10 focal depths were collected by moving a 20× objective lens using a micrometre stage in 4 µ m steps.
The stack images were projected onto a single image using the maximum intensity Z-projection algorithm in ImageJ. Thereafter, a rolling-ball algorithm (ImageJ) was used to highlight the nuclei and suppress background signals resulting from excess binding of Hoechst to myocyte cytoplasm attributable to extended exposure to the stain. The nuclei were counted manually, assisted by an ImageJ cell-counter plugin.
Image acquisition and processing. Microscope control and image acquisition tasks were performed with custom software written in Microsoft Visual Basic.NET (Microsoft). Greyscale and colour images were captured with exposures that typically ranged from 0.1 to 0.5 s frame–1, and were saved in TIFF or JPEG format. Image processing was performed using open-source ImageJ image processing and analysis software (http://imagej.nih.gov/ij/) along with open-source GNU Image Manipulation Program image processing software (https://www.gimp.org) and was in most cases confined to flat-fielding, adjusting the brightness and contrast, colour balance and sharpening with an unsharp mask tool (with the GNU Image Manipulation Program default settings, radius 5.0, amount 0.5, threshold 0.0). Using an XYZ-translation stage (the z axis is currently used for manual focus), multiple fields of view were collected and assembled by mosaicking single frames together. In many cases, the XYZ stage was sufficiently precise that the images were simply abutted after flat-fielding to create acceptable large montages. However, optimal montage results were obtained by allowing 10% image-to-image spatial overlap and using the Microsoft Image Composite Editor (http://research.microsoft.com/en-us/um/redmond/projects/ice/) to perform subpixel registration and image stitching.
When extended depth of field imaging was required, multiple Z-stacks were acquired at 10 μ m spacing (see Supplementary Fig. 9 and Supplementary Note 4 for more information).
Sample preparation and staining. In this study, both fresh and formalin-fixed tissues were used. Human specimens were sourced through two mechanisms. Predominantly, de-identified excess patient material was obtained directly from the frozen section or grossing room at the University of California (UC) Davis Medical Center. These tissue samples were determined to be exempt from oversight by the UC Davis Institutional Review Board (ID 743439-1). Alternatively, formalin-fixed specimens from patients diagnosed with primary brain tumours were collected under Institutional Review Board approval from the Department of Pathology and Laboratory Medicine at the UC Davis Medical Center. Only excess tissues were retained and reviewed by a board-certified neuropathologist (co-author M.L.) for diagnostic purposes and tissue quality control. Tissue samples were then coded and de-identified per protocol. Efforts were made to obtain tissue from both genders and from minorities. Animal tissues were obtained from the UC Davis Meat Laboratory from slaughtered animals or discarded experimental animals post-sacrifice. In the case of discarded experimental animals, all procedures were performed under Institutional Animal Care and Use Committee supervision.
Several dyes and dye combinations were studied, including eosin, rhodamine, DAPI, Hoechst, acridine orange, propidium iodine and proflavine. Eosin and rhodamine stain the cytoplasm and the extracellular matrix, making the bulk of the tissue visible. Hoechst and DAPI fluoresce brightly when bound to DNA, allowing them to serve as excellent nuclear stains. A suitable combination proved to be rhodamine B (Sigma–Aldrich; 500 µ g ml–1 in phosphate buffered saline (PBS)) plus Hoechst 33342 (Life Technologies; 500 µ g ml–1 in PBS), which were combined in a single solution. Tissues were submerged in this combination for 10 s and then briefly washed in water (fixed tissues) or PBS (fresh tissues). The resulting stained tissue specimens generated bright enough signals for direct and interpretable visualization through microscope eyepieces, as the reddish rhodamine contrasts well with blue nuclear labels. Compared with captured digital images, live binocular viewing provides better appreciation of surface shape information. Camera-acquired images, however, benefit from additional digital enhancement, as described above.
For precise correlation between H&E and MUSE, we prepared conventional FFPE and H&E-stained slides, and then released the remaining tissue from the paraffin block by deparaffinization (essentially reversing the solvent steps used in embedding). The cut face of the recovered tissue specimen was then imaged via MUSE, creating essentially a serial-section rendition, as illustrated in Supplementary Fig. 2. Alternatively, after primary MUSE imaging, samples were then processed for standard histology; the resulting H&E-stained slides were scanned on an Aperio AT2 slide scanner.
Colour-mapping fluorescence to virtual H&E. A two-stage approach was used to convert the original MUSE fluorescence images to a H&E-stained bright-field appearance. The first step consisted of unmixing the RGB colour image based on the (three-channel) spectral properties of the fluorescent dyes, using end-members selected from regions corresponding to the cytoplasm and nuclei, with spectral correction to estimate the colour coordinates of the pure dye components. The second step converted the corresponding dye-specific abundance images into simulated H&E concentrations using a Beer–Lambert physical model of transillumination microscopy, wherein the absorption RGB values of H&E are used to determine the colours in the computed output image. Additional details are provided in Supplementary Fig. 4 and Supplementary Note 3.
Immunohistochemical and FISH methods. Standard histological and immunohistochemical procedures, including semiquantitative analyses were performed as previously published33. Representative sections were stained by immunohistochemical labelling using the Dako Omnis automated immunohistochemistry system (Agilent Technologies) using the following antibodies: (1) an anti-ATRX (α -thalassaemia/mental retardation syndrome X-linked) rabbit polyclonal antibody (catalogue number HPA001906; Sigma–Aldrich, a part of Millipore–Sigma) and (2) an anti-Ki-67 mouse monoclonal antibody (GA626, prediluted; Agilent Technologies). FISH testing for 1p19q co-deletion on interphase cells was performed either on FFPE only or FFPE after MUSE. The tumour cells were labelled with 19q13 SpectrumOrange or 19p13 SpectrumGreen using Vysis LSI 1p36/1q25 and LSI 19q13/19p13 dual-colour probes and a previously published protocol34. The results are shown in Supplementary Fig. 7.
RNA-Seq. To investigate whether MUSE staining and imaging—steps that involve the use of intercalating dyes and UV excitation—might affect labile RNA sample integrity, two core needle 'biopsies' obtained ex vivo from a resected specimen were processed in parallel. One was stained with Hoechst and rhodamine for 10 s as described above and imaged over several fields for a total imaging time of about 2 min. The unstained and unimaged paired specimen was kept moist in PBS at room temperature during this time. After MUSE imaging, both cores were snap-frozen in liquid N2 and processed for RNA-Seq. Total RNA was isolated using an RNeasy Mini Kit (Qiagen). Subsequently, RNA quantity and quality were assessed on a NanoDrop spectrophotometer and an Agilent 2100 Bioanalyzer. Whole transcriptome profiling was performed using a directional, strand-specific messenger RNA-Seq approach in the UC Davis Genomics Shared Resource and indexed RNA-Seq libraries were prepared. Double-stranded complementary DNA
NATuRe BioMeDicAL eNGiNeeRiNG | www.nature.com/natbiomedeng

© 2017 Macmillan Publishers Limited, part of Springer Nature. All rights reserved. © 2017 Macmillan Publishers Limited, part of Springer Nature. All rights reserved.
ArticlesNature Biomedical eNgiNeeriNg
was generated as described35,36 and libraries were sequenced on an Illumina MiSeq System (75 bp, paired-end; ~30 million reads per sample) as described37.
To compare the results from the MUSE-imaged and control RNA-Seq runs, de-multiplexed raw sequence data (FASTQ) were aligned to the human genome (GRCh37) using the DRAGEN bioinformatics processor. The aligned reads (bam format) were analysed using the RSeQC RNA-Seq Quality Control package38,39. None of the metrics examined showed appreciable differences between the MUSE and non-MUSE samples outside of expected RNA-Seq library variation. Supplementary Table 1 and Supplementary Fig. 8c summarize a few key metrics. The results provide reassurance that the approach of using MUSE-imaged small specimens will not seriously impair downstream molecular diagnostic applications.
Assessment of diagnostic suitability of MUSE images. General surgical pathology specimens: MUSE versus H&E. A total of 42 cases from the general surgical pathology service at UC Davis were selected for a comparison between diagnoses obtained via MUSE and H&E imaging. Excess material beyond that required for patient care was obtained under a UC Davis Institutional Review Board exemption allowing the study of anonymized tissue samples. The distribution was weighted towards ovary, kidney, colon, breast, lung and prostate, along with a few other sites of origin. Out of the 42 cases, 10 were benign and the balance was either frankly malignant or borderline. No effort was made to select textbook examples of common pathologies and some of the cases posed a considerable degree of diagnostic difficulty. Eight specimens were examined in the fresh state and the remainder had been formalin fixed for variable periods of time ranging from a few days to a few weeks. Each case was imaged via MUSE using 10 s staining with rhodamine and Hoechst, and multiple fields of view were captured at 10× magnification. Companion tissue was submitted for fixation (if required) and standard histological processing followed by H&E staining and whole-slide scanning at 20× . Representative fields reflecting both normal (if present), adjacent and diagnostic regions were selected and matched by one of the authors and then presented to two experienced, board-certified pathologists with only the tissue of origin information provided (that is, no age, gender, medical history or procedure). Each reviewer saw approximately 190 images over the 42 cases (mean 4.5 images per case, range 2–11). One reviewer made diagnoses viewing only the MUSE images (in both the fluorescence and virtual H&E mode) and, similarly, the other viewed only the H&E images. No communication between the reviewers occurred. Their diagnoses, along with comments, if any, more or less verbatim, are presented in the Supplemental Information.
Neuropathology specimens. A panel of board-certified and eligible practising anatomic pathologists and neuropathologists conducted blinded analyses to assess the diagnostic accuracy achievable with MUSE images (primary MUSE and virtual H&E) compared with diagnoses obtained by review of the standard FFPE, microtome-sectioned and H&E-stained glass slides of the same brain tumour specimens. Given the histopathological heterogeneity of central nervous system tumours and the fact that some specimens may contain a mixture of normal and lesional areas of interest, two to four representative images were captured from each case and selected by an independent board-certified neuropathologist to best represent diagnostic features. A total of 24 adult patients (14 male, 10 female, with a mean age of 54 years; range 19–83 years) who underwent surgical resection for newly diagnosed brain and spinal cord tumours were included in the study. Of these, 7 (29%) were diagnosed with diffuse astrocytic or oligodendroglial tumours, 8 (33.5%) with meningiomas, 3 (12.5%) with ependymal and choroid plexus tumours, 3 (12.5%) with tumours of the cranial or paraspinal nerves and 3 (12.5%) with metastatic tumours by the conventional methodology.
Each pair of test images (primary MUSE and virtual H&E) was accompanied by a questionnaire that included a series of potential diagnoses that included the above diagnoses. The pathologists had to pick the one answer that represented the correct diagnostic category.
Any differences in diagnosis between primary MUSE or virtual H&E compared with the ground-truth diagnoses made by conventional methodology were noted as a major, clinically significant difference (false diagnosis or subclassification of tumour), as presented in Supplementary Table 1.
Life Sciences Reporting Summary. Further information on experimental design is available in the Life Sciences Reporting Summary.
Code availability. The Python code and executables to convert full-colour MUSE images to virtual H&E images are freely available on GitHub at https://github.com/UCDavisMUSE/colormapper.
Data availability. The authors declare that all data supporting the findings of this study are available within the paper and its Supplementary Information.
Received: 30 December 2016; Accepted: 30 October 2017; Published: xx xx xxxx
References 1. Rastogi, V. et al. Artefacts: a diagnostic dilemma—a review. J. Clin. Diagn. Res.
7, 2408–2413 (2013). 2. Neil, M. A., Juskaitis, R. & Wilson, T. Method of obtaining optical sectioning
by using structured light in a conventional microscope. Opt. Lett. 22, 1905–1907 (1997).
3. Dobbs, J. et al. Confocal fluorescence microscopy for rapid evaluation of invasive tumor cellularity of inflammatory breast carcinoma core needle biopsies. Breast Cancer Res. Treat. 149, 303–310 (2015).
4. Tao, Y. K. et al. Assessment of breast pathologies using nonlinear microscopy. Proc. Natl Acad. Sci. USA 111, 15304–15309 (2014).
5. Kang, D. et al. Endoscopic probe optics for spectrally encoded confocal microscopy. Biomed. Opt. Express 4, 1925–1936 (2013).
6. Orringer, D. A. et al. Rapid intraoperative histology of unprocessed surgical specimens via fibre-laser-based stimulated Raman scattering microscopy. Nat. Biomed. Eng. 1, 0027 (2017).
7. Liu, J. T. et al. Efficient rejection of scattered light enables deep optical sectioning in turbid media with low-numerical-aperture optics in a dual-axis confocal architecture. J. Biomed. Opt. 13, 034020 (2008).
8. Bouchard, M. B. et al. Swept confocally-aligned planar excitation (SCAPE) microscopy for high-speed volumetric imaging of behaving organisms. Nat. Photon. 9, 113–119 (2015).
9. Gabriele, M. L. et al. Optical coherence tomography: history, current status, and laboratory work. Invest. Ophthalmol. Vis. Sci. 52, 2425–2436 (2011).
10. Lin, B., Urayama, S., Saroufeem, R. M., Matthews, D. L. & Demos, S. G. Real-time microscopic imaging of esophageal epithelial disease with autofluorescence under ultraviolet excitation. Opt. Express 17, 12502–12509 (2009).
11. Lin, B., Urayama, S., Saroufeem, R. M., Matthews, D. L. & Demos, S. G. Characterizing the origin of autofluorescence in human esophageal epithelium under ultraviolet excitation. Opt. Express 18, 21074–21082 (2010).
12. Kather, J. N. et al. New colours for histology: optimized bivariate colour maps increase perceptual contrast in histological images. PLoS ONE 10, e0145572 (2015).
13. Fereidouni, F., Datta-Mitra, A., Demos, S. & Levenson, R. Microscopy with UV surface excitation (MUSE) for slide-free histology and pathology imaging. In Progress in Biomedical Optics and Imaging - Proc. SPIE 9318, 93180F (SPIE, 2015).
14. Ho, D., Fereidouni, F., Levenson, R. M. & Jagdeo, J. Real-time, high-resolution, in vivo characterization of superficial skin with microscopy using ultraviolet surface excitation (MUSE). J. Drugs Dermatol. 15, 1344–1346 (2016).
15. Zeskind, B. J. et al. Nucleic acid and protein mass mapping by live-cell deep-ultraviolet microscopy. Nat. Methods 4, 567–569 (2007).
16. Zaak, D. et al. Ultraviolet-excited (308 nm) autofluorescence for bladder cancer detection. Urology 60, 1029–1033 (2002).
17. Sharma, A. & Schulman, S. G. Introduction to Fluorescence Spectroscopy (John Wiley & Sons, New York, 1999).
18. Kenny, K. B. System and methods for generating a brightfield image using fluorescent images. US patent US8639013 B2 (2011).
19. Garsha, K. et al. Polyfocal interferometric image acquisition. Google patents CA2849985 C (2016).
20. Hui, P. & Buza, N. Atlas of Intraoperative Frozen Section Diagnosis in Gynecologic Pathology (Springer, Switzerland, 2015).
21. Foschini, M. P., Baldovini, C., Ishikawa, Y. & Eusebi, V. The value of large sections in surgical pathology. Int. J. Breast Cancer 2012, 785947 (2012).
22. Abels, E. & Pantanowitz, L. Current state of the regulatory trajectory for whole slide imaging devices in the USA. J. Pathol. Inform. 8, 23–23 (2017).
23. Adeyi, O. A. Pathology services in developing countries—the West African experience. Arch. Pathol. Lab. Med. 135, 183–186 (2011).
24. Benediktsson, H., Whitelaw, J. & Roy, I. Pathology services in developing countries: a challenge. Arch. Pathol. Lab. Med. 131, 1636–1639 (2007).
25. Srinivasan, M., Sedmak, D. & Jewell, S. Effect of fixatives and tissue processing on the content and integrity of nucleic acids. Am. J. Pathol. 161, 1961–1971 (2002).
26. Kapp, J. R. et al. Variation in pre-PCR processing of FFPE samples leads to discrepancies in BRAF and EGFR mutation detection: a diagnostic RING trial. J. Clin. Pathol. 68, 111–118 (2015).
27. Penland, S. K. et al. RNA expression analysis of formalin-fixed paraffin-embedded tumors. Lab. Invest. 87, 383–391 (2007).
28. Maes, E. et al. Analysis of the formalin-fixed paraffin-embedded tissue proteome: pitfalls, challenges, and future prospectives. Amino Acids 45, 205–218 (2013).
29. Gnanapragasam, V. J. Unlocking the molecular archive: the emerging use of formalin-fixed paraffin-embedded tissue for biomarker research in urological cancer. BJU Int. 105, 274–278 (2010).
30. Ragan, T. et al. Serial two-photon tomography for automated ex vivo mouse brain imaging. Nat. Methods 9, 255–258 (2012).
NATuRe BioMeDicAL eNGiNeeRiNG | www.nature.com/natbiomedeng

© 2017 Macmillan Publishers Limited, part of Springer Nature. All rights reserved. © 2017 Macmillan Publishers Limited, part of Springer Nature. All rights reserved.
Articles Nature Biomedical eNgiNeeriNg
31. Hapke, M. R. & Dehner, L. P. The optically clear nucleus. A reliable sign of papillary carcinoma of the thyroid? Am. J. Surg. Pathol. 3, 31–38 (1979).
32. Lakowicz, J. R. Principles of Fluorescence Spectroscopy (Springer Science + Business Media, Berlin, 2013).
33. Lechpammer, M. et al. Pathology of inherited manganese transporter deficiency. Annals Neurol. 75, 608–612 (2014).
34. Woehrer, A. et al. FISH-based detection of 1p 19q codeletion in oligodendroglial tumors: procedures and protocols for neuropathological practice—a publication under the auspices of the Research Committee of the European Confederation of Neuropathological Societies (Euro-CNS). Clin. Neuropathol. 30, 47–55 (2010).
35. Borodina, T., Adjaye, J. & Sultan, M. A strand-specific library preparation protocol for RNA sequencing. Methods Enzymol. 500, 79–98 (2011).
36. Levin, J. Z. et al. Comprehensive comparative analysis of strand-specific RNA sequencing methods. Nat. Methods 7, 709–715 (2010).
37. Bentley, D. R. et al. Accurate whole human genome sequencing using reversible terminator chemistry. Nature 456, 53–59 (2008).
38. Wang, L., Wang, S. & Li, W. RSeQC: quality control of RNA-Seq experiments. Bioinformatics 28, 2184–2185 (2012).
39. Wang, L. et al. Measure transcript integrity using RNA-Seq data. BMC Bioinformatics 17, 58 (2016).
AcknowledgementsWe acknowledge L. Brandi, A. Datta-Mitra, T. McBroom, A. Adelaja, A. Krueger and L. Martinez for helping with the sample preparation and imaging, J. Wilson and D. Peabody for assisting with the tissue procurement, and E. Hillman for providing critical feedback. This work was partially supported by UC Davis Department of Pathology and Laboratory Medicine start-up funds, a UC Davis Science Translation and Innovative Research grant and an unrestricted gift from Agilent Technologies. This work was performed in part under the auspices of the US Department of Energy by the Lawrence Livermore National Laboratory under contract DE-AC52-07NA27344.
Author contributionsR.L. and S.G.D. developed the original observations of tissue imaging using fluorescing stains under UV LED excitation. F.F., S.G.D. and R.L. designed and fabricated the MUSE microscope based on the original design by S.G.D. and conducted the wavelength-dependent depth measurements. Z.T.H. was responsible for the colour-mapping software and maintaining the github repository. R.L., F.F., M.T., A.T. and J.A.K. performed the experiments on sample preparation, staining and comparisons with traditional histology. R.L., M.T., J.A.K. and M.L. designed and performed the comparison of MUSE and traditional histology in the central nervous system cases. R.L. and A.T. designed and performed the comparison of MUSE tissues with traditional histology, which were viewed and interpreted by J.B. and A.D.B. R.L., F.F., M.L. and J.D.M. designed and performed the FISH and RNA-Seq experiments. All authors discussed and interpreted the results and wrote and edited the paper.
competing interestsR.L. and S.G.D. are co-founders of a start-up company, Muse Microscopy, which is involved in commercializing MUSE technology. The other authors declare no competing financial interests.
Additional informationSupplementary information is available for this paper at https://doi.org/10.1038/s41551-017-0165-y.
Reprints and permissions information is available at www.nature.com/reprints.
Correspondence and requests for materials should be addressed to R.L.
Publisher’s note: Springer Nature remains neutral with regard to jurisdictional claims in published maps and institutional affiliations.
NATuRe BioMeDicAL eNGiNeeRiNG | www.nature.com/natbiomedeng

1
nature research | life sciences reporting summ
aryJune 2017
Corresponding author(s): Richard Levenson
Initial submission Revised version Final submission
Life Sciences Reporting SummaryNature Research wishes to improve the reproducibility of the work that we publish. This form is intended for publication with all accepted life science papers and provides structure for consistency and transparency in reporting. Every life science submission will use this form; some list items might not apply to an individual manuscript, but all fields must be completed for clarity.
For further information on the points included in this form, see Reporting Life Sciences Research. For further information on Nature Research policies, including our data availability policy, see Authors & Referees and the Editorial Policy Checklist.
Experimental design1. Sample size
Describe how sample size was determined. The validation study was performed to compare MUSE with H&E on 42 samples (approximated 400 images split between MUSE and H&E) drawn from the surgical pathology service at UC Davis, with the goal to assess how similar the resulting images were. Sample size was determined to cover a reasonable spread of sites of origin, as well as malignant vs. benign processes.
2. Data exclusions
Describe any data exclusions. No data were excluded.
3. Replication
Describe whether the experimental findings were reliably reproduced.
Two studies, one on general pathology and another, with a different study design, focusing on neuropathology, came to the same conclusion: that MUSE and H&E could generate similar diagnostic impressions in the eyes of skilled viewers.
4. Randomization
Describe how samples/organisms/participants were allocated into experimental groups.
Cases were chosen from recent UC Davis surgical-pathology cases largely based on tissue availability and disease coverage. Choices were otherwise random.
5. Blinding
Describe whether the investigators were blinded to group allocation during data collection and/or analysis.
For the general surgical pathology study, the pathologist viewing the MUSE images and the one viewing the corresponding H&E images had no opportunity to see images from the other modality before rendering a diagnosis or impression. No communication between them occurred, and no clinical information except site of origin was provided.
Note: all studies involving animals and/or human research participants must disclose whether blinding and randomization were used.

2
nature research | life sciences reporting summ
aryJune 2017
6. Statistical parameters For all figures and tables that use statistical methods, confirm that the following items are present in relevant figure legends (or in the Methods section if additional space is needed).
n/a Confirmed
The exact sample size (n) for each experimental group/condition, given as a discrete number and unit of measurement (animals, litters, cultures, etc.)
A description of how samples were collected, noting whether measurements were taken from distinct samples or whether the same sample was measured repeatedly
A statement indicating how many times each experiment was replicated
The statistical test(s) used and whether they are one- or two-sided (note: only common tests should be described solely by name; more complex techniques should be described in the Methods section)
A description of any assumptions or corrections, such as an adjustment for multiple comparisons
The test results (e.g. P values) given as exact values whenever possible and with confidence intervals noted
A clear description of statistics including central tendency (e.g. median, mean) and variation (e.g. standard deviation, interquartile range)
Clearly defined error bars
See the web collection on statistics for biologists for further resources and guidance.
SoftwarePolicy information about availability of computer code
7. Software
Describe the software used to analyze the data in this study.
Arithmetic.
For manuscripts utilizing custom algorithms or software that are central to the paper but not yet described in the published literature, software must be made available to editors and reviewers upon request. We strongly encourage code deposition in a community repository (e.g. GitHub). Nature Methods guidance for providing algorithms and software for publication provides further information on this topic.
Materials and reagentsPolicy information about availability of materials
8. Materials availability
Indicate whether there are restrictions on availability of unique materials or if these materials are only available for distribution by a for-profit company.
N/A
9. Antibodies
Describe the antibodies used and how they were validated for use in the system under study (i.e. assay and species).
N/A
10. Eukaryotic cell linesa. State the source of each eukaryotic cell line used. N/A
b. Describe the method of cell line authentication used. N/A
c. Report whether the cell lines were tested for mycoplasma contamination.
N/A
d. If any of the cell lines used are listed in the database of commonly misidentified cell lines maintained by ICLAC, provide a scientific rationale for their use.
N/A

3
nature research | life sciences reporting summ
aryJune 2017
Animals and human research participantsPolicy information about studies involving animals; when reporting animal research, follow the ARRIVE guidelines
11. Description of research animalsProvide details on animals and/or animal-derived materials used in the study.
Surplus tissues from animal remains were purchased at the UC Davis Meat Lab (it's an agricultural school). Additionally, some organs were obtained from cadavers of research animals from other, unrelated labs, that had been studied and sacrificed under IACUC supervision. No living animals were obtained or sacrificed specifically for these studies.
Policy information about studies involving human research participants
12. Description of human research participantsDescribe the covariate-relevant population characteristics of the human research participants.
The studies that included human tissue were deemed to be 'exempt', in that they used excess surgical pathology material (that is, not required further for patient care) that had been de-identified. The IRB committee reviewed the activity and issued an IRB exemption.