mozambique's forest reference emission level for reducing … · republic of mozambique...
TRANSCRIPT

Republic of Mozambique
Ministry of Land, Environment and Rural Development
Mozambique's Forest Reference Emission Level for Reducing Emissions
from Deforestation in Natural Forests
Government of Mozambique
03 October 2018

1
Republic of Mozambique
Ministry of Land, Environment and Rural Development
Mozambique's Forest Reference Emission Level for Reducing
Emissions from Deforestation in Natural Forests Version 03 October 2018

2
EXECUTIVE SUMMARY
Main features of the FREL Remarks
Proposed FREL (in
tCO2e/year) 38 956 426
Type and duration of
FREL
Historical average – 11
years (2003-2013)
Adjustment of
national
circumstances
None
National/Subnational National
National, but reporting estimates at
Provincial level and for groups of
Districts as Mozambique wishes to
pilot REDD+ at a sub-national
level.
Activities included Deforestation Only deforestation of natural
forest. Conversion of plantations is
not included.
Pools included AGB, BGB
Aboveground and Belowground.
The dead wood and litter, and SOC
will be included in the future
modified submission.
Gases included CO2
Forest definition 1 ha, 30% canopy cover, 3
meters tree height
Relationship with
latest GHG inventory None
Past national communications are
not consistent. Mozambique will
work through 2018 to ensure
consistency.
Description of
relevant policies and
plans
Yes This shows that GHG emissions in
the historical period are a good
proxy of future GHG emissions.
Description of
assumptions on future
changes in policies
Not applicable
Description on
changes to previous
FREL
Not applicable
Future improvements
identified
Include SOC and DOM
pools. Include Forest
degradation activity.

3
TABLE OF CONTENTS
EXECUTIVE SUMMARY .................................................................................................................. 2
TABLE OF CONTENTS ..................................................................................................................... 3
LIST OF TABLES ................................................................................................................................ 5
LIST OF FIGURES .............................................................................................................................. 5
ACRONYMS ......................................................................................................................................... 6
1 INTRODUCTION ......................................................................................................................... 7
2 NATIONAL CIRCUMSTANCES ............................................................................................... 9
2.1 LEGAL FRAMEWORK ............................................................................................................... 9
2.2 CAUSES OF DEFORESTATION AND DEGRADATION ................................................................. 12
2.3 POLICIES AND PLANS ............................................................................................................. 14
3 TRANSPARENT, COMPLETE, CONSISTENT AND ACCURATE INFORMATION .... 15
3.1 TRANSPARENCY .................................................................................................................... 15
3.2 COMPLETENESS ..................................................................................................................... 15
3.3 CONSISTENCY........................................................................................................................ 15
3.4 ACCURACY ............................................................................................................................ 15
4 DEFINITIONS ............................................................................................................................ 16
4.1 FOREST DEFINITION AND OPERATIONALIZATION .................................................................. 16
4.2 LAND USE LAND COVER CLASSIFICATION SYSTEM .............................................................. 17
5 SCALE AND SCOPE ................................................................................................................. 19
5.1 SCALE .................................................................................................................................... 19
5.2 REDD+ ACTIVITIES ............................................................................................................... 19
5.3 CARBON POOLS ..................................................................................................................... 21
5.4 GASES .................................................................................................................................... 21
6 REFERENCE PERIOD AND VALIDITY PERIOD .............................................................. 22
6.1 REFERENCE PERIOD ............................................................................................................... 22
6.2 FREL VALIDITY PERIOD ........................................................................................................ 22
7 METHODOLOGICAL CHOICES ........................................................................................... 23
7.1 APPROACH TO SET FREL ...................................................................................................... 23
7.2 IPCC METHODS USED ............................................................................................................ 23
8 ACTIVITY DATA ...................................................................................................................... 25
8.1 SOURCE ................................................................................................................................. 25
8.2 SAMPLING DESIGN ................................................................................................................. 25
8.3 RESPONSE DESIGN ................................................................................................................. 26
8.3.1 Spatial sampling unit ........................................................................................................ 26
8.3.2 Source of reference data ................................................................................................... 26
8.3.3 Reference labelling protocol ............................................................................................. 27
8.4 ANALYSIS AND RESULTS ....................................................................................................... 29
8.4.1 Analysis design .................................................................................................................. 29
8.4.2 Results for activity data ..................................................................................................... 30
9 EMISSION FACTORS............................................................................................................... 32
9.1 SOURCE ................................................................................................................................. 32
9.2 SAMPLING DESIGN ................................................................................................................. 32

4
9.3 DATA COLLECTION ................................................................................................................ 34
9.4 ESTIMATION .......................................................................................................................... 36
9.5 ANALYSIS AND RESULTS ....................................................................................................... 37
9.5.1 Analysis ............................................................................................................................. 37
9.5.2 Results ............................................................................................................................... 39
10 FOREST REFERENCE LEVEL .............................................................................................. 42
10.1 NATIONAL CIRCUMSTANCES ................................................................................................. 42
10.2 CALCULATION ....................................................................................................................... 42
10.3 PROPOSED FREL ................................................................................................................... 42
10.4 ANALYSIS OF UNCERTAINTY ................................................................................................. 43
10.5 CAPACITY BUILDING NEEDS .................................................................................................. 44
10.6 AREAS OF IMPROVEMENT ...................................................................................................... 45
11 REFERENCES ............................................................................................................................ 46

5
LIST OF TABLES
Table 1. Land use and Land Cover classification system used in the production of the maps, activity
data and national forest inventory. ........................................................................................................ 18
Table 2. Overview of the Land Use, Land Use Change and Forestry (LULUCF) between 2003 and 2013
per forest stratum and forest type .......................................................................................................... 30
Table 3. Land Use, Land Use Change and Forestry between 2003 and 2013 ...................................... 31
Table 4 Number of sampling units in NFI ............................................................................................ 32
Table 5. Distribution of the Number of samples of NFI per Province .................................................. 34
Table 6. Models used to estimate biomass of each stratum and species. .............................................. 36
Table 7. Area, proportion and sample size per stratum......................................................................... 37
Table 8. Above-ground biomass (AGB), above-ground carbon (AGC) and carbon dioxide equivalent or
emission factor for AGB (CO2eq (A)) ................................................................................................. 39
Table 9. Below ground biomass (BGB), below ground carbon (BGB) and carbon dioxide equivalent or
emission factor for BGB (CO2eq (B)) .................................................................................................. 39
Table 10. Total tree biomass (TB = AGB + BGB), total tree carbon (TC = AGC + BGC) and carbon
dioxide equivalent or emission factor for TB (CO2eq (T)) .................................................................. 40
Table 11. Above- and below-ground biomass in mangroves ................................................................ 40
Table 12. Standard error and sampling error of estimates .................................................................... 40
Table 13. Default biomass stocks present on forest land converted to cropland or grassland .............. 41
Table 15. Total and annual average of emissions of C02 per stratum per year (FREL) ....................... 42
Table 16. Uncertainty per stratum ......................................................................................................... 44
LIST OF FIGURES
Figure 1. Proportion of deforestation for each driver (data from Ceagre and Winrock International,
2016) ..................................................................................................................................................... 12
Figure 2. Image of the spatial sampling unit ......................................................................................... 26
Figure 3. LULC changes detection using Collect Earth Tool. (www.openforis.org). Forms designed
with Collect Tool. ................................................................................................................................. 27
Figure 4. A temporal analysis of LULC changes of one point from national 4km x 4 km grid sampling.
.............................................................................................................................................................. 28
Figure 5. Decision tree for the allocation of the IPCC Land Use category based on the cover of the
objects present in the sampling unit ...................................................................................................... 28
Figure 6. Deforestation in Mozambique between 2003 and 2013 ........................................................ 30
Figure 7. Sampling locations of the NFI. The maps lacks the samples of Cabo Delgado and Gaza. ... 33
Figure 8. National Forest Inventory plot layout. ................................................................................... 35
Figure 9. Graphical representation of emission from deforestation per year ........................................ 43

6
ACRONYMS
AGB Aboveground Biomass
BGB Belowground Biomass
CEAGRE Centre for Agricultural Studies and Natural Resource Management
CENACARTA National Center for Cartography and Remote Sensing
D&D Deforestation and Forest Degradation
DINAB National Directorate of Environment
DINAF National Directorate of Forests
DINAT National Directorate of Land
DOM Dead Organic Matter
FAO Food and Agriculture Organization of the United Nations
FNDS National Fund for Sustainable Development
FRA Global Forest Resource Assessment
FREL Forest Reference Emissions Level
GHG Greenhouse Gases
IPCC Intergovernmental Panel on Climate Change
LULC Land Use and Land Cover
LULUCF Land Use, Land Use Change and Forestry
MASA Ministry of Agriculture and Food Security
MIREME Ministry of Mineral Resources and Energy
MITADER Ministry of Land, Environment and Rural Development
NFI National Forest Inventory
NGO Non-governmental Organizations
REDD+ Reducing emissions emissions from deforestation and forest degradation,
and foster conservation, sustainable management of forests, and
enhancement of forest carbon stocks
SOC Soil Organic Carbon
UEM Eduardo Mondlane University
UNFCCC United Nations Framework Convention on Climate Change

7
1 INTRODUCTION
Mozambique is a country located in southeast Africa, bordered by the Indian Ocean in the
East, with boundaries in the North with Tanzania, Zambia in the Northwest, Malawi,
Zimbabwe and Swaziland in the west and South Africa in the South. The total extension is
823,588.75 Km2 in which 41% is covered by natural Forests and the total population estimated
in 28 million inhabitants.
Forests play an important role in the economy of the country, especially in the rural areas and
provide direct benefits to a large majority of the population as source of energy through the
extraction of firewood and charcoal, construction materials, logging for timber, non-timber
forest products (medicinal plants, fruits, etc.), source of nutrients for small scale agriculture,
social and cultural values.
The third National Forest inventory estimated that forests in Mozambique suffered high rates
of deforestation, estimated at 0.58% in 2007, corresponding to 220,000 ha/year.
Acknowledging this situation, and understanding its impact to the economy and to the
livelihood of rural population, the Government of Mozambique became part of the 47
Countries that benefited from funds from the Forest Carbon Partnership Facility (FCPF) to
develop the National REDD+ strategy with the aim of reducing emissions from deforestation
and forest degradation and enhancement of carbon stocks (REDD+). The process began in
2008 with the elaboration of the REDD+ readiness plan (R-PP), which was approved by the
Committee of Participants of the FCPF in March 2012. In 2016, the country received
additional funds from the FCPF to establish a National Forest Monitoring System (NFMS)
and the Forest Reference Emission Level (FREL) of greenhouse gas emissions (GHG) for
REDD+.
With the aim of consolidating the process of REDD+, Mozambique embraces the opportunity
to submit a proposal of FREL to the United Nations Framework Convention on Climate
Change (UNFCCC), responding to decision 1/CP.16, referring to the requests of developing
countries with intention to perform activities related to REDD+.
The objective of the country, in submitting this proposal, is on the perspective of building
capacity for the implementation at all levels, the National REDD+ Strategy recently approved

8
by the Government in December 2016 aiming to promote sustainable development, resilience
to climate change, integrated rural development focused in forest, agriculture and energy.
The reduction of emissions caused by deforestation and forest degradation (REDD+), an
initiative of the Signatory States to the UNFCCC, has its primary objective the promotion of
actions which result in the reduction of deforestation and forest degradation, as well as an
increase forest cover through forest plantations, restoration of degraded forests, conservation
of forest ecosystems and improvement of sustainable forest management practices.
This proposal was constructed using the best available information in the country, following
the IPCC guidance and guidelines, adopting the ''stepwise'' approach accepted by Decision
12/CP.17, paragraph 10.
As part of the actions related to REDD+, the Government of Mozambique is implementing
the Forest Investment Program of Mozambique (MozFIP) and the Zambézia Integrated
Landscape Management Program (ZILMP). MozFip was created in the framework of the
Climate Investment Funds (CIF), to support the efforts of REDD+ in Developing Countries.
The ZILMP was created with the aim of promoting sustainable development through the
conservation and management of forests with insertion on the efforts of REDD+ in nine (9)
districts of Zambézia Province, namely, Gilé, Ile, Pebane, Alto Molocué, Maganja da Costa,
Mocubela, Mulevala, Mocuba and Gurué. The Government of Mozambique is planning to use
the ZILMP as a pilot to test REDD+ and performance based payments. It is expected that it
will enter into an Emission Reduction Payment Agreement (ERPA) with the FCPF Carbon
Fund in 2018. Moreover, the Government of Mozambique is also planning a second sub-
national pilot REDD+ program around and within the Quirimbas National Park, in seven (7)
districts of Cabo Delgado Province, namely Macomia, Quissanga, Meluco, Montepuez,
Metuge, Ancuabe and Ibo, covering an area of 30,405 km2, with an annual deforestation
estimated in 5,522 hectares/year. There is a structure of implementation in place created by
MITADER, with initiatives to reduce the pressure on forests. These include working in
improved cook stoves and charcoal kilns, as well as introducing and disseminating sustainable
agriculture good practices, to improve the productivity and the value chain. The main
challenge is the involvement of the private sector in sustainable forest management and
expansion of these initiatives in all districts, to encompass a larger number of beneficiaries,
to reduce the current pressure in the Program Area, especially the Quirimbas National Park.

9
The Government is planning to submit this sub-national REDD+ program to the request for
proposals for Result Based Payments of the GCF.
2 NATIONAL CIRCUMSTANCES
This chapter on national circumstances provides information on the legal framework and
institutional arrangements, which comprises the description of the laws, regulations, Decrees,
Diplomas existent in the country that support the efforts for reducing emissions from
deforestation and forest degradation and identify the gaps and the actions in place towards a
solid legal framework. This includes a description of institutional arrangements for MRV
system and the potential gaps for its effective implementation. Furthermore, a description on
drivers of deforestation is provided, which includes information of the current deforestation,
identifies the main drivers of deforestation and forest degradation and its contribution to total
deforestation. To end with, this chapter provides information on plans and policies in terms
of what is intended to do in view of the current institutional and legal framework and the
drivers of deforestation. Plans are more operational and they will be applied in the coming 5
to 11 years from now and include the roadmap for the implementation and operationalization
of the countries Measurement, Reporting and Verification system1 (MRV).
2.1 Legal framework
In 1992, Mozambique adhered to the Rio convention to contribute to the sustainable use of
natural resources. As a result, an Environment law (Decree No. 20/97) was drawn up, which
defines the legal basis for the improved use and management of the environment and its
components, to achieve sustainable development. This law prohibits the pollution of air, water
and soil and practices that accelerate erosion, desertification and deforestation. Deforestation
is the main topic that deserves attention in the forest sector as it is the main threat to the
sustainability of forest natural resources. To enforce the legal framework, the Forest and
Wildlife Law (Decree No. 10/99) was approved in 1999 to ensure the protection, conservation,
development and rational use of forest and wildlife resources for economic, social and
ecological benefit of current and future generations of Mozambicans. The implementation of
the forest Law was then reinforced by its regulation (Decree 12/2002) which is focused on the
1 http://www.redd.org.mz/uploads/SaibaMais /ConsultasPublicas/MRV%20Road.pdf

10
management of forest activities, community engagement and law enforcement. After the Bali
Conference (COP 13), which recognized the contribution of REDD+ to climate change,
Mozambique started to find other ways to improve the management of its forests. In 2008,
Mozambique prepared the first Emissions Reduction Project Idea Note (ER-PIN) that created
conditions for preparing the legal and institutional grounds for REDD+. During this period,
the country produced the REDD+ Decree (Decree 12/2013) which establishes the institutional
arrangements in terms of MRV, establishes that the Government of Mozambique has the right
to validate, verify and issue Emission Reductions titles and provides procedures for licensing
REDD+ projects that wish to generate titles of Emission Reductions. As part of the REDD+
Readiness phase, the country produced the National REDD+ strategy in 2016. This strategy
significantly impacted the forest related laws, policies and National Programs. Currently the
forest sector is making reforms on the law, regulation, policy and strategy and the national
forest program.
In 2017, Mozambique ratified the Paris Agreement and agreed to the global target of keeping
global average temperatures well below 2°C. To achieve this, the country is in a process of
designing the National MRV system which comprises four Components: AFOLU, Transport,
Energy and Solid Residues. The MRV for REDD+ is part of the AFOLU, and is intended to
conduct the following activities:
• Monitor GHG from deforestation and forest degradation which includes the
monitoring of changes in land use and land cover, forest inventory, monitoring with
a network of permanent sampling plots and estimation of GHG emissions and
removals.
• Development of the National Platform for Sustainable Management of Natural
Resources, which comprises the REDD+ programs and projects, Safeguard
Information System (SIS), Grievance Redress Mechanism, benefit sharing and
transactions.
• GHG reporting at national and international level.
• Periodical evaluations of REDD+ programs and projects.
To achieve the intended activities, ongoing efforts are taken ahead by different institutions
within the Ministry of Land, Environment and Rural Development (MITADER), Ministry of
Agriculture and Food Security (MASA), Eduardo Mondlane University (UEM) and Ministry
of Natural Resources and Energy. Within MITADER, the institutions involved are the

11
National Directorate of Forests (DINAF), National Directorate of Land (DINAT), National
Directorate of Environment (DINAB), National Center for Cartography and Remote Sensing
(CENACARTA) and The National Fund for Sustainable Development (FNDS).
As part of the recent experience working on the production of the emission factors during the
fourth National Forest inventory the Roles of the institutions involved were:
• DINAF (MITADER) – Leader of the National Forest Inventory, Quality control and
Quality assurance
• FNDS (MITADER) – Coordinate the operations and logistics of the National Forest
inventory
• IIAM (MASA) – Supply technical staff for identification of species and field work
• FAEF (UEM) – Soil analysis, supporting on the production of the Report of the
National Forest Inventory, supplied allometric equations to estimate the carbon pools
• FCB (UEM) – Supplied technical staff for identification of species
• To produce the activity data, the following institutions were involved:
• DINAF (MITADER) – Provided conditions to train MRV unit team to learn the use
of Collect earth used to produce the activity data; provided the National 4x4 km
grid and did the Quality assurance of the activity data;
• FNDS (MITADER) – Produced the activity data
• CENACARTA (MITADER) – Did the assessment of process of production of data
With regards to the production of activity data and emission factors, the arrangements have
been agreed to, but not formalized. One of the challenges is the formalization of institutional
coordination, which requires policies on data sharing to be well defined and the institutions
strategic plans harmonized.

12
2.2 Causes of deforestation and degradation
A study conducted by CEAGRE and Winrock International (2016) analyzed seven drivers of
Deforestation and Degradation (D&D): commercial agriculture, shifting agriculture,
extraction of timber products, production of firewood and charcoal, urban expansion, mining
and livestock. This analysis considered that the seven drivers are interrelated in a multitude
of ways and together are responsible for most of the D&D that occurs in Mozambique.
The study found that shifting agriculture is the major cause of deforestation in Mozambique,
being responsible for 65% between 2000 and 2012. The other major causes identified were
urban expansion (12%), extraction of timber products (8%) and production of firewood and
charcoal (7%).
Figure 1. Proportion of deforestation for each driver (data from Ceagre and Winrock International, 2016)
On the other hand, the activity data analysis presented in this report showed that 86% of all
deforestation events were due to conversion to agriculture, 13.5% to conversions to grassland,
with the remaining conversions being responsible for less than 0.5%. Although the two
analyses have very different methodologies, they both agree that agriculture is the main driver
of deforestation. Additionally, if we interpret a conversion to grassland as resulting from
timber product extraction, production of firewood, charcoal and livestock, then the two studies
also show agreement, since these three drivers are responsible for 18% of deforestation in the

13
study by CEAGRE and Winrock International (2016). The largest difference between these
two analyses is in the role of urban expansion as a driver of deforestation. This could be
explained because in the activity data only direct conversions were measured, whereas urban
expansion can have multiple indirect effects of deforestation rates.
In the study by CEAGRE and Winrock International (2016), the main drivers vary per
Province, according to each Province’s economic, social and natural characteristics. In the
south of Mozambique (Maputo, Gaza and Inhambane Provinces), urban expansion has a much
greater impact on deforestation (23%) than in other regions of the country (7% in the north
and 11% in the centre). In the Northern Provinces (Cabo Delgado, Nampula and Niassa),
shifting agriculture has a greater impact on emissions (72%) than the centre (60%) or south
(59%) of the country. The type of forest can also have an impact on deforestation rate. For
example, mopane forests are more affected by charcoal production, timber exploration and
grazing, whereas miombo forests are more heavily impacted by agriculture.
This study predicted that the deforestation rate of Mozambique is expected to increase in the
next 10 years, due to population growth and urban growth. On the other hand, improvements
in the forest management process may lead to a significant reduction in illegal timber
exploration, which may result in reduced rates of D&D. The impact of the drivers of forest
degradation was assumed to have been captured in the estimation of deforestation, since the
analysis assumes that the drivers of deforestation and forest degradation are multiple and
complex and act in unison.
A first order estimation of emissions resulting from the three most important causes of forest
degradation (timber exploration, production of firewood and charcoal, and wildfires),
predicted that forest degradation is responsible for almost 30% of total emissions.
14
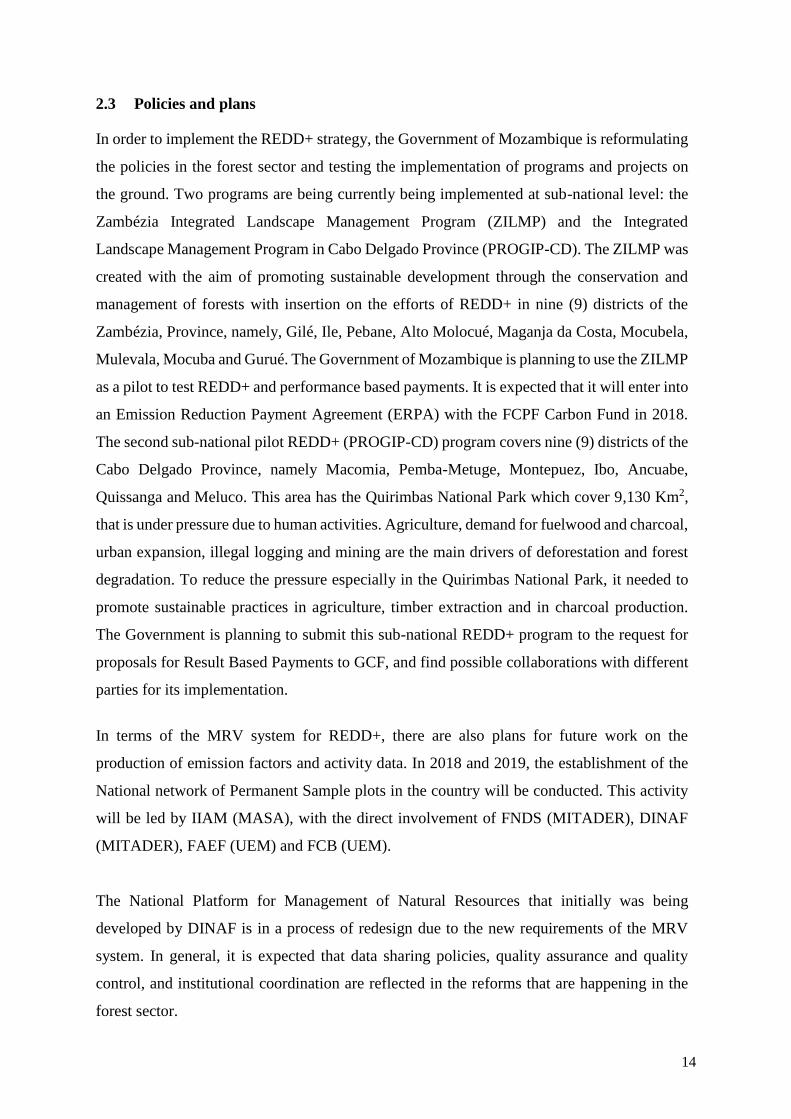
2.3 Policies and plans
In order to implement the REDD+ strategy, the Government of Mozambique is reformulating
the policies in the forest sector and testing the implementation of programs and projects on
the ground. Two programs are being currently being implemented at sub-national level: the
Zambézia Integrated Landscape Management Program (ZILMP) and the Integrated
Landscape Management Program in Cabo Delgado Province (PROGIP-CD). The ZILMP was
created with the aim of promoting sustainable development through the conservation and
management of forests with insertion on the efforts of REDD+ in nine (9) districts of the
Zambézia, Province, namely, Gilé, Ile, Pebane, Alto Molocué, Maganja da Costa, Mocubela,
Mulevala, Mocuba and Gurué. The Government of Mozambique is planning to use the ZILMP
as a pilot to test REDD+ and performance based payments. It is expected that it will enter into
an Emission Reduction Payment Agreement (ERPA) with the FCPF Carbon Fund in 2018.
The second sub-national pilot REDD+ (PROGIP-CD) program covers nine (9) districts of the
Cabo Delgado Province, namely Macomia, Pemba-Metuge, Montepuez, Ibo, Ancuabe,
Quissanga and Meluco. This area has the Quirimbas National Park which cover 9,130 Km2,
that is under pressure due to human activities. Agriculture, demand for fuelwood and charcoal,
urban expansion, illegal logging and mining are the main drivers of deforestation and forest
degradation. To reduce the pressure especially in the Quirimbas National Park, it needed to
promote sustainable practices in agriculture, timber extraction and in charcoal production.
The Government is planning to submit this sub-national REDD+ program to the request for
proposals for Result Based Payments to GCF, and find possible collaborations with different
parties for its implementation.
In terms of the MRV system for REDD+, there are also plans for future work on the
production of emission factors and activity data. In 2018 and 2019, the establishment of the
National network of Permanent Sample plots in the country will be conducted. This activity
will be led by IIAM (MASA), with the direct involvement of FNDS (MITADER), DINAF
(MITADER), FAEF (UEM) and FCB (UEM).
The National Platform for Management of Natural Resources that initially was being
developed by DINAF is in a process of redesign due to the new requirements of the MRV
system. In general, it is expected that data sharing policies, quality assurance and quality
control, and institutional coordination are reflected in the reforms that are happening in the
forest sector.

15
3 TRANSPARENT, COMPLETE, CONSISTENT AND ACCURATE
INFORMATION
3.1 Transparency
Both the activity data and the NFI results will be published in individual reports and in this
report. Once the National Platform for Management of Natural Resources is online, it will be
possible to access the results. The reviewers of the technical assessment under the UNFCCC
will have access to all relevant files.
To ensure transparency on the process, the guidelines are available on the web23.
Transparency is also guaranteed with the consultation with different stakeholders on the
process of defining the period, the selection of the allometric equations, dissemination of the
documents and information to the public for comments, consultation and use.
3.2 Completeness
The methodology used to calculate the activity data, emission factors and the FREL itself is
described in detail in this document (Section 8 and 9). The data used in the calculations is
available and thus the FREL can be reconstructed independently.
3.3 Consistency
The future GHG inventories will adhere to the definitions used in this FREL, thus ensuring
consistency between the two.
3.4 Accuracy
Regarding emission factors, data was collected by a well trained and certified team of forestry
engineers that conducted the field work and supervised by the QA/QC team and an
independent auditor. Data transfer was done in digital form and it was subject to QA by a
team not involved in the data collection. Processing was done in an automated way by a
researches with QA conducted by a team not involved in the processing.
2 http://www.redd.org.mz/uploads/SaibaMais/ConsultasPublicas/AD%20Accuracy%20Assessment.pdf 3 http://www.redd.org.mz/uploads/SaibaMais/ConsultasPublicas/Mozambique%20National%20Forest%20Inventory%20Guidelines.pdf

16
Regarding activity data, data was collected by a well-trained team of 5 forestry engineers who
worked for 200 days on the data collection. QC/QA procedures were in place in order to
ensure the consistent collection and transfer of data.
The consistency of the information of the emission factors and activity data are guaranteed by
the guidelines2, which provides procedures to collect the data. It also enforced by the
supervision and QA/QC) and external audit.
4 DEFINITIONS
4.1 Forest definition and operationalization
In Mozambique forests are defined as lands with trees with the potential to reach a height of
3 m at maturity, a canopy cover equal or greater than 30%, and that occupy at least 1 ha. This
includes temporarily cleared forest areas and areas where the continuity of land use would
exceed the thresholds of the definition of forest, or trees capable of reaching these limits in
situ (Falcao and Noa 20164 ).
Mozambique’s previous forest definition was land spanning more than 0.5 hectares with trees
higher than 5 meters and a canopy cover of more than 10 percent, or trees able to reach these
thresholds in situ. This definition was changed after a long consultation process that involved
the relevant public sector institutions, NGO, private operators and research institutions. The
area requirement was increased to facilitate the mapping using remote sensing techniques,
with medium resolution satellites. With regards to the canopy cover, it was considered that
the value of 10% leads to the inclusion of forested areas with low carbon stocks, lowers the
rate of deforestation, increases the monitoring costs and makes projects less attractive to
investors. The minimum height was reduced from 5 to 3 meters to include forests with shorter
trees, but with significant carbon stocks, such as mangrove and mopane forests.
Thus, the forest definition used in this FREL will differ from the definition presented in the
Forest Resources Assessment (FRA) 2015, which used the previous forest definition. It is
4
http://www.redd.org.mz/uploads/SaibaMais/ConsultasPublicas/Relatorio%20definicao%20de%20floresta%20V5_19.10.2016.pdf

17
expected that in the next FRA, the forest definition and the estimates will be updated with the
newly collected activity data. The country’s proposal to the CDM of the UNFCCC in 2012/13
was also different, having changed the minimum tree height from 3 to 5 meters, following the
definition proposed at the time by the National Directorate of Land and Forests5.
4.2 Land Use Land Cover classification system
The 2006 IPCC Guidelines considers the following land‐ use categories for greenhouse gas
inventory reporting: forest land, cropland, grassland, wetland, settlements and other land.
Mozambique uses a tiered land use land cover (LULC) classification system, nested within
the IPCC system.
The IPCC system was used as a basis in the National Forest Inventory (NFI), activity data and
in the LULC cartography that is being generated. However, the national system places
emphasis on the forest class, differentiating between different major forests types present in
the country. It includes two levels, considering level 1 as the IPCC system, level 2 which
distinguishes between closed and open canopies, as well as evergreen or deciduous forests. It
also includes a forest plantation class. At level 3 the forest types are further differentiated,
with the evergreen forests including mountainous forest, gallery forest, mangrove, coastal
forest and Mecrusse forest (dominated by Androstachys johnsonii). The deciduous forest
types are miombo (dominated by Brachystegia sp. and Julbernardia sp.) and mopane
(dominated by Colophospermum mopane).
A more detailed description of the LULC system is presented in Annex 1.
5 http://cdm.unfccc.int/DNA/index.html

18
Table 1. Land use and Land Cover classification system used in the production of the maps, activity data and
national forest inventory.
Level 1
IPCC
Level 2
National Classification
Level 3
National Classification
Crops Tree crops Tree crops
Field crops
Shrub Plantation (Tea)
Rainfed field crops
Irrigated field crops
Rice crop
Shifting cultivation with open to
closed forested areas
Shifting cultivation with open to
closed forested areas
Forests Forest Plantation Forest Plantation
Forest with shifting cultivation Forest with shifting cultivation
Broadleaved (Semi-) evergreen
closed forest
Coastal dense woody vegetation
Mangrove dense
Mecrusse dense
Gallery forest
Closed broadleaved (Semi-)
evergreen mountainous forest
Broadleaved (Semi-) deciduous
closed forest
Miombo dense
Mopane dense
Broadleaved (Semi-) evergreen
open forest
Coastal open woody vegetation
Mangrove open
Mecrusse open
Open broadleaved (Semi-)
evergreen mountainous forest
Broadleaved (Semi-) deciduous
open forest
Mopane open
Miombo open
Grassland Grasslands Grasslands
Thicket
Broadleaved (Semi-) evergreen
thicket
Broadleaved (Semi-) deciduous
thicket
Shrubland
Broadleaved (Semi-) evergreen
shrubland
Broadleaved (Semi-) deciduous
shrubland
Wetlands Aquatic or regularly flooded
shrublands
Aquatic or regularly flooded
shrublands
Aquatic or regularly flooded
herbaceous vegetation
Aquatic or regularly flooded
herbaceous vegetation
Artificial water bodies Artificial water bodies

19
Level 1
IPCC
Level 2
National Classification
Level 3
National Classification
Natural water bodies Natural water bodies
Salt lake Salt lake
Settlements Settlements Settlements
Other land Bare soils Bare soils
Bare rocks Bare rocks
Dunes Dunes
5 SCALE AND SCOPE
5.1 Scale
This scale of the presented FREL are all forests within Mozambique. However, Mozambique
wishes to report estimates at the Provincial level and at the level of the sub-national REDD
programs, as Mozambique wishes to implement REDD+ following a step-wise approach that
eventually lead to a national REDD+ program and seek REDD+ result based payments for
areas within Mozambique. This is important as the country does not have the capacity to
implement investment activities and implement the REDD+ framework (e.g. Safeguard
Information System) at full national scale at this time.
5.2 REDD+ activities
The five REDD+ activities are:
• Reducing emissions from Deforestation
• Reducing emissions from forest degradation
• Conservation of forest carbon stocks
• Sustainable forest management
• Enhancement of carbon stocks
Mozambique defines deforestation as the anthropogenic conversion of forest land to non-
forest land. Afforestation is the conversion from non-forest to forest, includes new forest
plantations as well as regrowth of natural forests on old cropland or grassland. Forest
degradation is defined as the long-term reduction of forest canopy cover or carbon stock,
which results in a reduction of the benefits obtained from the forest, including timber,
biodiversity and other goods and services. This reduction can result from timber exploration,

20
fires, cyclones and other causes, as long as the canopy cover remains above 30%.
Enhancement of forest carbon stocks is an activity that refers to the increase in carbon stocks
on forest land that remains forest land.
For the purposes of this FREL, the only activity included is reducing emissions from
deforestation. The main activities to reduce emissions from deforestation are sustainable
agriculture, Agroforestry, improved kilns for charcoal, improved cook stoves and land use
planning.
Although estimates of activity data for afforestation/reforestation are available, and activities
that enhance carbon stocks are being developed in the country (e.g. MozFIP and MozBIO)
this activity is not included in the meantime due to the lack of removal factors that would
allow to estimate GHG removals.
Although degradation is thought to be an important component of GHG emissions in
Mozambique’s forests (CEAGRE and Winrock International 2016), the country is still
developing the methodology to estimate emissions from forest degradation so this activity is
not included. This development will take place throughout 2018 and is expected to be
finalized by 2019. Nevertheless, there is no indication that measures intended to reduce
deforestation would result in leakage towards degradation. As a result, excluding forest
degradation in the current submission is conservative, i.e. underestimates GHG emissions
which in turn underestimates emission reductions.
Regarding conservation of forest carbon stocks, the main activities are establishment of
conservation areas in community areas, maintenance and protection of Reserves and Parks,
but it is assumed that the source of GHG emissions are included in deforestation and forest
degradation, so it is not selected as activity. Moreover, Sustainable forest management
includes as main activities monitoring the management plans, law enforcement QA/QC for
management plans of concessions, but in terms of GHG emissions it will be assumed as part
of deforestation and forest degradation.
The selection of the activities must be based on information on drivers of deforestation, as
well as based on regional and national priorities.

21
5.3 Carbon pools
This report includes information on aboveground biomass (AGB) and belowground biomass
(BGB) before and after conversion. The information on AGB before conversion is sourced
from the NFI for all forests except for mangrove, which was not covered by the NFI. For this
forest type, IPCC default values for Mangrove (Tier 1) have been used instead. Although Tier
2 values exist for Mozambique based on peer reviewed studies, the use of one or other value
would not have any impact as deforestation in Mangrove is so little. Information on BGB
before conversion was obtained from allometric equations, where available, or root to shoot
ratios (R: S). for more details see Table 7 in section 9.
The information on aboveground biomass (AGB) and belowground biomass (BGB) after
conversion was based in Tier 1 following the 2006 IPCC Guidelines.
The information on dead organic matter (DOM), including litter and dead wood, obtained
from the NFI is still being processed and so will not be included in this report. It is expected
to be included to the modified submission so this will be subject to future revisions.
The analysis of soil samples collected during the NFI is still ongoing and is expected to be
concluded during 2018. It is not expected to be finished in time for soil organic carbon (SOC)
to be added to the modified submission so this will be subject to future revisions.
5.4 Gases
Carbon Dioxide (CO2) is the only GHG included in Mozambique’s FREL. Methane (CH4) is
emitted from clearance and conversion of peat land and wetlands or from forest fires.
Considering that no peatlands and very few organic soils exist in Mozambique (concentrated
in Mangroves) and the little deforestation in wetlands, CH4 emissions from anaerobic
decomposition is considered null.
CH4 Emissions from forest fires, including N2O emissions, may be significant. A significant
portion of Mozambique burns annually, since it is a common practice during the clearing of
agricultural fields, hunting wild game and gathering of honey (Sitoe et al. 2012). However,
there currently is no validated information on burnt area for the country nor the emissions

22
resulting from those fires. The inclusion of emissions from fires is something that will be
studied and, if found to be significant, it will be included in subsequent FRELs.
6 REFERENCE PERIOD AND VALIDITY PERIOD
6.1 Reference period
The UNFCCC does not give any directives with regards to the reference period for the FREL.
However, both The Forest Carbon Partnership Facility (FCPF) and Green Climate Fund
(GCF) have specific guidelines. FCPF sets a minimum of 10 years and a maximum of 15
years, while GCF gives a better score for a reference period between 10 and 15 years but
allows the reference period to be set from 5 to 20 years.
The chosen period for the definition of the FREL is from 2003 to 2013. This was the period
chosen by the National Directorate of Forests, when they initiated a project to produce LULC
change maps for Gaza and Cabo Delgado Provinces. This period is also consistent with
previous periods of analysis of deforestation. The previous NFI was conducted in 2007, and
the period of analysis for the deforestation was from 1991 to 2002. Although activity data has
been collected for all years in the period from 2001 to 2016, only activity data for the period
2003-2013 was considered for the FREL.
6.2 FREL validity period
The FREL will be valid for 10 years. However, the FREL will be updated as new information
becomes available, such as activity data for forest degradation, data on other carbon pools,
data on fires and others. It is currently planned to conduct a reevaluation of the 4x4 km grid
at the mid-point of the FREL, corresponding to the period between 2013-2018.

23
7 METHODOLOGICAL CHOICES
7.1 Approach to set FREL
The FREL is based on a historical average during the defined reference period. Based on the
data collected, there is no trend observed in terms of deforestation (and enhancement of
carbon stocks), and it is expected that the national circumstances will not change significantly
with regard to the reference period. Therefore, the historical average is deemed as a good
proxy of future GHG emissions.
7.2 IPCC methods used
In accordance with the UNFCCC decisions, the FREL was developed following the rules and
methods proposed by the 2006 IPCC Good Practice Guidelines for National Greenhouse Gas
Inventories.
Annual GHG emissions or removals over the reference period in the region of interest (FREL)
are estimated as the sum of annual change in total carbon stocks over the reference period in
the Accounting Area (𝛥𝐶𝐵𝑡):
FREL =∑ 𝛥𝐶𝐵𝑡𝑇𝑡=1
𝑇
Where:
𝛥𝐶𝐵𝑡 Annual change in total carbon stocks at year t; and
T Number of years during the reference period; a dimensional
Following the 2006 IPCC Guidelines, the annual change in carbon stocks in biomass on
forestland converted to other land-use category (∆𝐶𝐵) would be estimated through the
following equation:
∆𝐶𝐵 = ∆𝐶𝐺 + ∆𝐶𝐶𝑂𝑁𝑉𝐸𝑅𝑆𝐼𝑂𝑁 − ∆𝐶𝐿 Equation 1
Where:
∆𝐶𝐵 Annual change of total carbon stocks during the reference period, in
tC per year.
∆𝐶𝐺 Annual increase in carbon stocks in biomass due to growth on land
converted to another land-use category, in tC per hectare and year;
∆𝐶𝐶𝑂𝑁𝑉𝐸𝑅𝑆𝐼𝑂𝑁 Initial change in carbon stocks in biomass on land converted to
other land-use category, in tC per hectare and year;

24
∆𝐶𝐿 Annual decrease in biomass carbon stocks due to losses from
harvesting, fuel wood gathering and disturbances on land converted
to other land-use category, in tC per hectare and year.
Following the recommendations set in chapter 2.2.1 of the GFOI Methods Guidance
Document for applying IPCC Guidelines and guidance in the context of REDD+6, the above
equation will be simplified and it will be assumed that:
• The annual change in carbon stocks in biomass (∆𝐶𝐵) is equal to the initial change in
carbon stocks (∆𝐶𝐶𝑂𝑁𝑉𝐸𝑅𝑆𝐼𝑂𝑁);
Considering equation 2.16 of the 2006 IPCC GL for estimating ∆𝐶𝐶𝑂𝑁𝑉𝐸𝑅𝑆𝐼𝑂𝑁 and
considering 2.8 b for the estimation of carbon stocks, the change of biomass stocks could be
expressed with the following equation.
∆𝐶𝐵 = ∑ (𝐵𝐵𝑒𝑓𝑜𝑟𝑒,𝑗 − 𝐵𝐴𝑓𝑡𝑒𝑟,𝑖)𝑥𝐶𝐹𝑥44
12×𝐴(𝑗, 𝑖)𝑗,𝑖 Equation 2
Where:
𝐴(𝑗, 𝑖) Area converted from forest type j to non-forest type i during the reference period, in
hectare per year. In this case, five possible conversions are possible:
• Broadleaved (Semi-) deciduous including Miombo to Non Forest;
• Broadleaved (Semi-) evergreen to Non-Forest;
• Mangrove to Non-Forest;
• Mecrusse to Non-Forest;
• Mopane to Non-Forest
𝐵𝐵𝑒𝑓𝑜𝑟𝑒,𝑗 Total biomass of forest type j before conversion, in tonne of dry matter per ha. This
is equal to the sum of aboveground biomass and below ground biomass of the
following five types of forest:
• Broadleaved (Semi-) deciduous including Miombo;
• Broadleaved (Semi-) evergreen;
• Mangrove;
• Mecrusse;
• Mopane;
𝐵𝐴𝑓𝑡𝑒𝑟,𝑖 Total biomass of non-forest type i after conversion, in tonnes dry matter per ha.
𝐶𝐹 Carbon fraction of dry matter in tC per ton dry matter. The value used is 0.47, based
on the IPCC 2006 GL
44 12⁄ Conversion of C to CO2
6 https://www.reddcompass.org/documents/184/0/MGD2.0_English/c2061b53-79c0-4606-859f-ccf6c8cc6a83
25
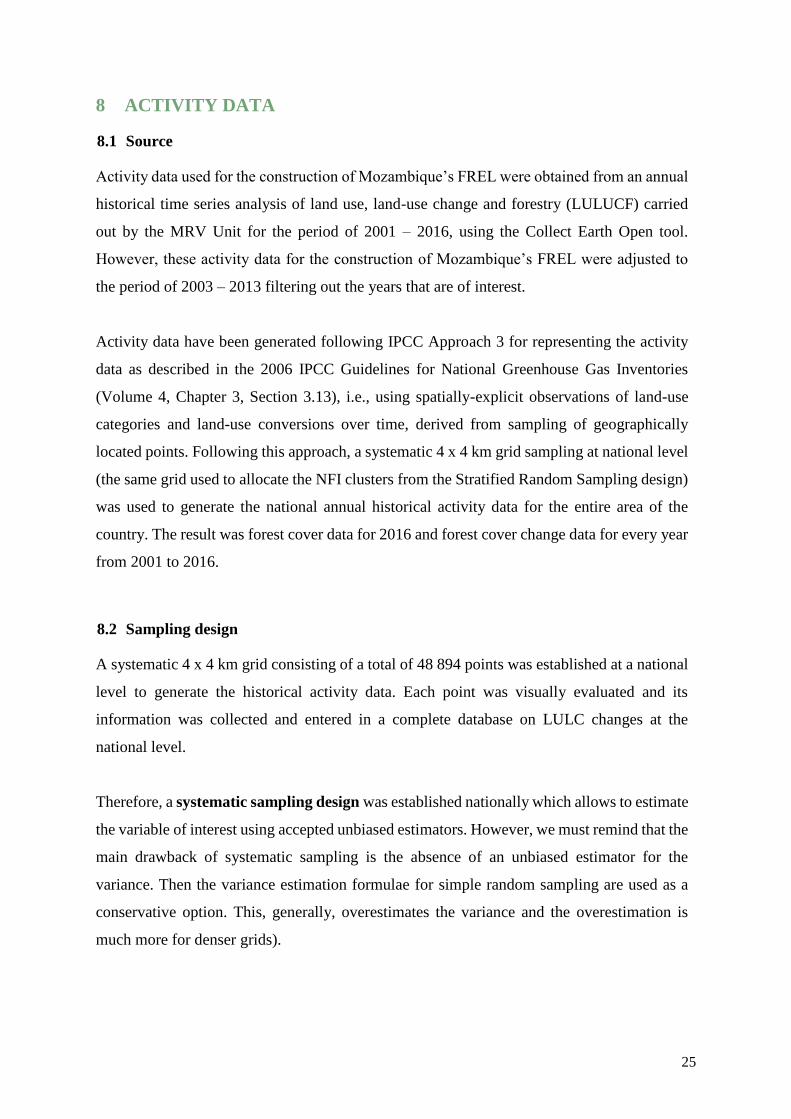
8 ACTIVITY DATA
8.1 Source
Activity data used for the construction of Mozambique’s FREL were obtained from an annual
historical time series analysis of land use, land-use change and forestry (LULUCF) carried
out by the MRV Unit for the period of 2001 – 2016, using the Collect Earth Open tool.
However, these activity data for the construction of Mozambique’s FREL were adjusted to
the period of 2003 – 2013 filtering out the years that are of interest.
Activity data have been generated following IPCC Approach 3 for representing the activity
data as described in the 2006 IPCC Guidelines for National Greenhouse Gas Inventories
(Volume 4, Chapter 3, Section 3.13), i.e., using spatially-explicit observations of land-use
categories and land-use conversions over time, derived from sampling of geographically
located points. Following this approach, a systematic 4 x 4 km grid sampling at national level
(the same grid used to allocate the NFI clusters from the Stratified Random Sampling design)
was used to generate the national annual historical activity data for the entire area of the
country. The result was forest cover data for 2016 and forest cover change data for every year
from 2001 to 2016.
8.2 Sampling design
A systematic 4 x 4 km grid consisting of a total of 48 894 points was established at a national
level to generate the historical activity data. Each point was visually evaluated and its
information was collected and entered in a complete database on LULC changes at the
national level.
Therefore, a systematic sampling design was established nationally which allows to estimate
the variable of interest using accepted unbiased estimators. However, we must remind that the
main drawback of systematic sampling is the absence of an unbiased estimator for the
variance. Then the variance estimation formulae for simple random sampling are used as a
conservative option. This, generally, overestimates the variance and the overestimation is
much more for denser grids).

26
8.3 Response design
8.3.1 Spatial sampling unit
The spatial sampling unit from each point was defined as a 100m x 100m plot (1 ha), where
an internal grid of 5 x 5 points (20m x 20m grid) is overlapped. Each point from the internal
grid has a weight coverage of 4%.
Figure 2. Image of the spatial sampling unit
8.3.2 Source of reference data
The sampling approach for national historical AD calculation based on the systematic 4 x 4
km grid sampling was conducted using Collect Earth (www.openforis.org). This tool takes
enables access to high resolution images in Google Earth and Bing Maps, as well as a medium
resolution image repository available through Earth Engine Explorer and Code Editor. The
tool provides a form designed to collect the LULC information on the points of the grid
(described in Annex 1) (Figure 3). The Earth Engine Code Editor facilitates the interpretation
of the vegetation type and the determination of LULC changes, by displaying the MOD13Q1
(NDVI 16-day Global Modis 250 m) graphic from 2001-2016, the most recent Sentinel-2
image, most recent Landsat-8 pan sharpened image and Landsat-7 pan sharpened image
(2000, 2004, 2008, 2012). Additionally, the Earth Engine (Explorer and Code Editor) ensures
the completeness of the series through RS products from medium resolution imagery
repositories from 2001 (Reflectance composites and vegetation indices, from Landsat 5-8).

27
Figure 3. LULC changes detection using Collect Earth Tool. (www.openforis.org). Forms designed with Collect
Tool.
8.3.3 Reference labelling protocol
The classification of each plot followed a set of hierarchical rules (Figure 5), where the
proportional cover of each element was determined, based on how many of the 25 points were
assigned to each element. In general, for most of the country there is at least 1 high resolution
image for the period of 2001-2016. This allowed the determination of current cover, with the
aid of the latest Sentinel-2 image. For some areas, images from earlier periods were available,
which facilitated the determination of previous land use. In cases where high resolution
images were not available and to pinpoint the year of change, annual and monthly Landsat
composites were used. The historical activity data was carried out considering the land use
and land cover classification system described in Table 1.

28
Figure 4. A temporal analysis of LULC changes of one point from national 4km x 4 km grid sampling.
A set of hierarchical rules were established and used to determine the land use category based
on a certain percentage and taking into account the forest definition as well. A single land use
class is easier to classify, but it becomes challenging when there is a combination of two or
more land use classes within the area of interest. Thus, this is where the hierarchical rules are
important to determine the land use. Any plot that has 30% of tree canopy is considered a
forest, according to the national forest definition, even if it has more than 20% of settlements,
agriculture or other land use, the forest has priority.
In the case the sampling unit was classified as forestland and different forest types were
present in the sample, a majority rule was used in this case, i.e. the largest forest class is the
winner.
Figure 5. Decision tree for the allocation of the IPCC Land Use category based on the cover of the objects
present in the sampling unit
Trees > 30%?
Forestland Infrastructure >
20%?
Crops> 20%?
Grassland > 20%?
Wetland > 20%?
Other > 20%?
YES NO
Settlement
Cropland
Grassland
Wetland
Other Lands
YES
YES
YES
YES
YES
NO
NO
NO
NO

29
8.4 Analysis and results
8.4.1 Analysis design
The estimation of the areas corresponding to land‐ use and land‐ use changes categories in
the framework of this systematic sampling approach (based on the visual assessment of the
nodes of a 4 x 4 km national grid) was based on assessments of area proportions. According
to 2006 IPCC Guidelines for National Greenhouse Gas Inventories (Volume 4, Chapter 3,
Section 3.33), the proportion of each land‐ use or land‐ use change category is calculated by
dividing the number of points located in the specific category by the total number of points,
and area estimates for each land‐ use or land‐ use change category are obtained by
multiplying the proportion of each category by the total area of interest.
Systematic sampling is generally more efficient than simple random sampling to estimate
areas. Systematic sampling is optimal if the autocorrelation is positive, decreasing and convex
but the main drawback of systematic sampling is the absence of an unbiased estimator for the
variance. Then the variance estimation formulae for simple random sampling are used (2006
IPCC Guidelines for National Greenhouse Gas Inventories, warns that it is an approximate
formula). This, generally, overestimates the variance (the overestimation is much more for
denser grids), so we can consider the application of this formula as a conservative option
(other options are variance estimators that compare each sample element with neighbors, pair
differences techniques, etc.).
The standard error (ha) of an area estimate is obtained as (2006 IPCC Guidelines for National
Greenhouse Gas Inventories, Volume 4, Chapter 3, Section 3.33):
𝑒 = 𝐴×√𝑝𝑖×(1 − 𝑝𝑖)
𝑛 − 1 Equation 3
Where:
𝐴 Region of interest, ha.
𝑝𝑖 Proportion of points on land use change category i, dimensionless.
𝑛 Number of sampling units, number.
The 95% confidence interval for Ai, the estimated area of land-use category i, will be given
approximately by ±2 times the standard error.

30
8.4.2 Results for activity data
Figure 6 shows forest losses in Mozambique for the period of 2003 - 2013. Annual areas of
forest loss estimated for each type of forest are shown in Tables 2 and 3. The annual areas of
forest loss estimated for each Province of Mozambique are shown in Annex 2. On average,
267,029 ha/year were deforested between 2003 and 2013. The 95% half width confidence
interval of the area of forest loss is ± 12,329 ha/year and the relative margin of error at 95%
confidence level is ± 4.6%.
Figure 6. Deforestation in Mozambique between 2003 and 2013
Table 2. Overview of the LULUCF between 2003 and 2013 per forest stratum and forest type
Forest stratum Deforestation (2003 - 2013)
ha ha*yr-1 C.I. (ha*yr-1) Error (%)
Broadleaved (Semi-) deciduous forest
including Miombo 2 277 941 207 086 ± 10 910 ± 5.27
Miombo open 1 657 554 150 687 ± 9 352 ± 6.21
Miombo dense 441 785 40 162 ± 4 836 ± 12.04
Forest with shifting cultivation 178 602 16 237 ± 3 101 ± 19.10
Broadleaved (Semi-) evergreen forest 561 665 51 060 ± 5 466 ± 10.71
Open broadleaved (Semi-) evergreen
mountainous forest 121 430 11 039 ± 2 545 ± 23.05
Closed broadleaved (Semi-)
evergreen mountainous forest 93 000 8 455 ± 2 225 ± 26.31
Coastal open woody vegetation 11 916 1 083 ± 794 ± 73.30
Coastal dense woody vegetation 16 655 1 514 ± 949 ± 62.68
Gallery forest 318 663 28 969 ± 4 129 ± 14.25
Mangrove 8 572 779 ± 671 ± 86.12

31
Forest stratum Deforestation (2003 - 2013)
ha ha*yr-1 C.I. (ha*yr-1) Error (%)
Mangrove open 3 432 312 ± 424 ± 136.06
Mangrove dense 5 140 467 ± 520 ± 111.24
Mopane 80 435 7 312 ± 2 057 ± 28.13
Mopane open 75 302 6 846 ± 1 990 ± 29.07
Mopane dense 5 133 467 ± 520 ± 111.41
Mecrusse 8 709 792 ± 671 ± 84.76
Mecrusse open 5 255 478 ± 520 ± 108.82
Mecrusse dense 3 454 314 ± 424 ± 135.16
All forest strata 2 937 322 267 029 ± 12 329 ± 4.62
C.I. – Confidence Interval
Table 3. Land Use, Land Use Change and Forestry between 2003 and 2013
LULUCF categories Area (ha) Standard Error
(ha) C. I. (ha)
Error
(%)
Forest land remaining Forest Land* 34 292 728 183 741 ± 360 133 ± 1.05
Non-Forest Land converted to Forest
Land** 124 393 14 479 ± 28 379 ± 22.81
Forest Land converted to Non-Forest
Land 2 937 322 69 193 ± 135 619 ± 4.62
Non-Forest Land remaining Non-Forest
Land 45 004 433 185 503 ± 363 587 ± 0.81
Total 82 358 875
C.I. – Confidence Interval
* Includes forest plantations
** Includes conversion of non-forest land to forest plantations

32
9 EMISSION FACTORS
9.1 Source
The National Forest Inventory (NFI) is an indispensable tool for generating statistical
information about the forest resources of a country. Its data are used to support decision-
making on sustainable forest management based on scientific evidence, as well as support
from government, private sector, civil society and academia, for a sustainable forestry policy.
Mozambique conducted a National Forest Inventory (NFI) from 2015 to 2017. The NFI
consisted of two provincial inventories, conducted in the Provinces of Gaza (2015) and Cabo
Delgado (2016), as well as a national scale inventory on the remaining eight Provinces of the
country (2016-2017). The inventory of the eight Provinces was divided in two phases. The
first phase took place in 2016 covering the Provinces of Maputo, Nampula and Inhambane.
The second phase took place in 2017 covering the Provinces of Tete, Manica, Sofala,
Zambézia and Niassa. There are 55 sampling units that were not measured in the Province of
Zambezia and are expected to be measured in 2018.
9.2 Sampling design
The sampling design was initially conceived as a stratified sampling design. The criterion of
stratification used in the sampling design was the strata of the agro-ecological zones map of
Mozambique but knowing that the stratification would be replaced by a new stratification
once new data on forest area would be available. The sample size was estimated based on the
Coefficients of Variation (CVs) given by the third national forest inventory. The sample size
was 620 units, which were increased by 10% giving a total of 681 units.
Table 4 Number of sampling units in NFI.
N Strata Area (ha) N/ha AB/ha Vt/ha Cv Supplementary
Clusters
1 Semi-deciduous dense
forest (+Miombo dense) 7 547 903 88.2 6.4 60.9 57 140
2 Mopane 2 183 139 77.4 2.8 20.9 50 108
3 Semi-evergreen forest
(+Gallery Forest) 1 662 652 91.0 5.2 47.9 50 107
4 Mecrusse 526 349 58.5 3.1 26.3 40.6 73
5 Semi-evergreen
mountainous forest 884 858 58.3 4.0 39.2 38.4 64
6
Semi-deciduous open
forest (+Miombo open +
Tree savanna)
29 725 985 81.9 4.3 33.3 71.9 99

33
N Strata Area (ha) N/ha AB/ha Vt/ha Cv Supplementary
Clusters
7 Semi-evergreen open
forest 2 421 296 73.6 3.4 24.8 68.3 90
Total 44 952 183 681
Later on the random locations were selected out from seven strata of the agro-ecological zones
map of Mozambique. The sample locations were later displaced to the closest point of the
national 4x4 grid so as to allow geographical overlap between the national grid used to obtain
the land cover information and the ground data.
The provincial inventories of Cabo Delgado and Gaza followed a similar approach as shown
above. The combination of all sampling units give a total of 855 sampling units distributed
across all Provinces as shown below (in Table 5).
Figure 7. Forest strata and sampling locations of the NFI (FSDIM: Semi-deciduous forest including miombo.
FSSV: Semi-evergreen forest.)
!!!!!!
!!!!!!!!!!!
!!!!!!
!!!!!!!!!!!!!!!!!!!
!!!!!!!!!!!!
!!!!!!!!!!!!!!
!!!!!!!!!!!
!!!!!!!!!!!!!!!!!!
!!!!!!!!!
!!!!!!!!
!!!!!!!!!!
!!!!!!!!!!
!!!!!!!
!!!!!!!!!!!!!
!!!!!!!!!!!!
!!!!!!!!!!!
!!!!!!!!!!!!
!!!!!!!!!
!!!!!!!!!!!
!!!!!!!
!!!!!!!!!!!
!!!!!!!!!!!!
!!!!!!!!!!
!!!!!!!
!!!!
!!!!!!!!!
!!!!!!!!
!!!!!!!!!!!!!
!!!!!!!!!!!!!
!!!!!!!!
!!!!!!!!!!!!!!!!!!!!!!!!!!!!
!!!!!!!!!!!!
!!!!!!!!!!!!!
!!!!!!!!!!!!!!!!!
!!!!!!!!!
!!!!!!!!!!
!!!!!!!!!
!!!!!!!!!!
!!!!!!!!!!!!
!!!!!!!!!!!!
!!!!!!!!!!!!!!!!!!!!!
!!!!!!!!
!!!!!!!!!!!!!!
!!!!!!!!!!
!!!!!!!!!!!!!!!!!!!!!!!!!!
!!!!!!!!
!!!!!!!!!!!
!!!!!!!!!
!!!!!!!!!
!!!!!!!!!!!
!!!!!!!
!!!!!!!!!!!!
!!!!!!!!!!!!!!!!!!
!!!!!!!!!!
!!!!!!!!!!!!!
!!!!!!!!
!!!!!!
!!!!!!!!!!!!
!!!!!!!!
!!!!!!!!!!!!!!!!
!!!!!!!!
!!!!!!!!
!!!!!!!
!!!
!!!!!!!
!!!!!!!!!!!!!!
!!!!!!!
!!!!!!!!!
!!!!
!!!!!!!!!!
!!!!!!!
!!!!!!!!!
!!!!!!!!
!!!!!!!
!!!!!
!!!!!!
!!!!!!!!
!!!!!!!!!!!
!!!!!!
!!!
!!!!!!!!
!!!!!!!
!!!!!!
!!!!!!!
!!!!!!!!!
!!!!!!!!
!!!!!!!!!!!
!!!!!
!!!!!!!!!!!!!!!!
!!!
!!!
!!!!!!!!!
!!!!!!!
!!!!!!!!!
!!!!!
!!!!!!!
!!
!!!!!!!!!!!!!!
!!!!!!!!!!
!!!!!!!!!
!!!
!!!!!!!
!!!!!!!!!!
!!!!!!!!!!!!!!!
!!!!!!!
!!!
!!!!!!
!!!!!!!!
!!!!!!!!!!
!!!!!!
!!!!
!!
!!!!!!!!!
!!
!!!!!!!!
!!
!!!!
!!!!!
!!!
!!!!!!!!
!!
!!!!!
!!!!!!
!!!!!
!!
!!!!
!!!!!
!!!!
!!
!!!
!!
!!!!
!
!!
!!!!
!
!!!!
!!!!
!!!
!
!
!!!
!!
!
!!!!
!!
!
!!!!!!
!!!!!!
!!!
!
!!
!!!!!
!!!! !!!
!!! !!
!!
!
!
!!
!!!!!!!!!
!!
!!!!!
!!
!
!!
!!
!!
!!!!
!!!!!
!!!!!
!!!
!!!
!!!!!!!!!!!!
!!
!!!!!!!!!
!!!!!
!!!
!!!!!
!!!!!!!!
!!!!!
!!!
!!!!
!!!!!
!
!
!!!!
!!!!!
!!!
!!!!!
!!!!!!
!!! !!
!!!!
!
!!
!!!!
!!!!
!!!!!!
!!!!!
!!!
!
!
!!!
!!!!!
!!!!!
!
!!!
!!!!!
!!
!!!!!
!!!!!!!
!!!!
!
!!!!!!!!
!!!!!
!!!!!!
!!
!!!!
!!!!!
!!!!
!!!!!!
!!!!!
!!!!!!!!!!
!!
!!
!!!!
!!!
!!!!
!
!!!!
!!
!!
!
!!
!
!!!!
!!!!!
!!!
!
!!!!
!!!
!!!!!!!
!!!
!!!
!!
!!!!
!
!
!!
!
!!!!
!
!
!!
!
!
!
!!
!!
!!
!!
!! ! !!!
!
!
!
!
!
!
! !
!!!
!
!
!
!
!
!
!!
!
! !!! !
!!
!! !
!
!
!! !! !
!!
!
!
!
!!! !
! !!!!!!
! !!
!!
!!!
!!!!
!
!!
!!!!
!! !
! !!
!!!
!
!
!!!
! !
! !!!!
!!
!
!!! !!! !!! !!! !! ! !! !!!!
! !!!
!! !!! !! !
!!! !!! !! !! !
!
!! !!
!!!! !
!
!!
!
!!! !!!
!
!! !
!! !
!!!
! !! !!
!
!
! !
!!
!
!! !!
!!! !! ! !!! ! !!!
!! ! !! !! ! !!!! !
!! !!!
!!!!
!! ! !! !!!!! ! !
! !!!!! !! !! ! ! !!!! !!! ! ! !!!
! !!!!! !
! !!!! !! ! !!! !!
!!
! !!! !
!! !!!! !
!!
!!! !! !!!!
!!! !!!
! !!!
!!!
!!! !
!! !
!! !!!
!!!! !! !! !! !
!!!
!!!
!!!!!!
! !! ! !
! !!! ! !!
!!!!!!! !!! !!! !! !
!!!!
!!! !! ! !! !! ! ! !!
! !!! ! !! !!! !!!!! ! !! !!!
!! !! ! !!!!! !!! !! !! !! ! !
!! !!! !!!! !!! !
!
!
!
!!
!
!
! !!! !!
!!!
!
!!
! !!! ! !!!! !!!!
!
! !!
!! !
!! !!! ! !
!!! ! !! !!!!! !
!
!!!! !! ! ! !!! !! ! !!
40°0'0"E
40°0'0"E
35°0'0"E
35°0'0"E
30°0'0"E
30°0'0"E
15°0'0"S 15°0'0"S
20°0'0"S 20°0'0"S
25°0'0"S 25°0'0"S
Legend
! Inventory clusters
Forest strata
FSDIM
FSSV
Mecrusse
Mopane
Outros
®
0 360 720180 Km

34
Table 5. Distribution of the Number of samples of NFI per Province
Province Sample size
Maputo 12
Gaza 129
Inhambane 128
Manica 57
Sofala 66
Tete 70
Zambézia 102
Nampula 19
Cabo Delgado 161
Niassa 111
Total 855
9.3 Data collection
Each sampling unit was composed by a cluster of four plots located following the scheme shown in
Figure 8. Each plot includes a number of quadrants. The trees with DBH greater than or equal to 5 cm
were measured in the subplot (Block A) and the equal or greater than 10 cm were measured in the
other blocks. The standing trees whose centers are within the plot were measured and recorded.
Different protocols were followed to collect data on other carbon pools. The complete protocol of data
collection is publicly available7.
7
http://www.redd.org.mz/uploads/SaibaMais/ConsultasPublicas/Mozambique%20National%20Forest%20Inventory%20Guidelines.pdf.

35
Figure 8. National Forest Inventory plot layout.

36
9.4 Estimation
Within each plot, trees with DBH ≥ 10 cm were measured for DBH and height. Trees with
DBH between 5 and 10 cm were measured for DBH and height in the left bottom subplot of
each plot. Above and belowground biomass was estimated using the equations indicated in
the Table 6 (most of them country-specific). The carbon content was assumed to be 47% of
dry biomass (IPCC, 2006).
Table 6. Models used to estimate biomass of each stratum and species.
Stratum/Species AGB BGB
Mopane Ŷ = 0.03325 × d1.848 × h1.241
(JICA, 2017)
Ŷ = 0.09572 × d1.7969 × h0.3797
(JICA, 2017)
Mecrusse Ŷ = 1.1544 + 0.0398 × d2h
(Magalhães, 2015a)
Ŷ = 0.0185 × d2.1990 × h0.4699
(Magalhães, 2015b)
Broadleaved
(Semi-) deciduous
forest including
Miombo
Ŷ = 0.0763 × d2.2046 × h0.4918
(Mugasha et al., 2013)
Ŷ = 0.1766 × d1.7844 × h0.3434
(Mugasha et al., 2013)
Broadleaved
(Semi-) evergreen
forest incluing
Gallery
Ŷ = exp(-2.289 + 2.649ln(d)
-0.021(ln(d))2) (IPCC 2003)
R/S = 0.28
(Mokany et al., 2006)
M. stuhlmannii Ŷ = 5.7332 × d1.4567
(Mate et al., 2014)
Ŷ = 0.1766 × d1.7844 × h0.3434
(Mugasha et al., 2013)
Pterocarpus
angolensis
Ŷ = 0.2201 × d2.1574
(Mate et al., 2014)
Ŷ = 0.1766 × d1.7844 × h0.3434
(Mugasha et al. 2013)
Afzelia quanzensis Ŷ = 3.1256 × d1.5833
(Mate et al., 2014)
Ŷ = 0.1766 × d1.7844 × h0.3434
(Mugasha et al., 2013)
Where:
AGB Aboveground biomass,
BGB Belowground biomass,
d Diameter at breast height (DBH),
R/S Root:shoot ratio.
Note that for Miombo and Mecrusse species occurring in Mopane stratum, models by
Mugasha et al. (2013) and Magalhães (2015a and 2015b) were used to estimate biomass;
however for other non-mopane species the model by IPCC (2003) was applied. The same
principle was applied for tree species of a specific stratum occurring in another stratum (e.g.
Mecrusse and Mopane species occurring in Miombo, Miombo and Mopane species occurring
in Mecrusse).

37
9.5 Analysis and results
9.5.1 Analysis
Although the sampling design was conceived as a stratified random sampling, this was based
on the stratification provided by the agro-ecological zoning which was not accurate so it was
foreseen to replace the stratification by a novel one using latest available data which is more
accurate. Therefore, a post-stratified design is applied for the analysis where the stratification
is given by the proportions of each forest type provided by the national grid. The provinces
of Gaza and Cabo Delgado were not considered as separate strata.
Moreover, although the cluster was conceived as the sampling unit, it was observed that a
significant number of clusters had theirs plots lying in different strata. Therefore, the plots
were considered to be independent and all the computation was carried out using the plots as
sampling units instead of clusters. Table 7 shows the number of plots allocated to each
stratum, along with the area of each stratum.
Table 7. Area, proportion and sample size per stratum.
Stratum Area (ha) Proportion of
total area (ph)
Number of
plots (nh)
Mopane forest 3 148 377 0.098 401
Mecrusse forest 902 568 0.028 282
Semi-deciduous forest (+
Miombo) 21 151 847 0.657 1 973
Semi-evergreen forest (+ Gallery) 6 999 749 0.217 764
Total 32 202 544* 1 3 420
*It doesn't include mangroves, forest with shifting cultivation and forest plantations; including these forests the
total forest area of the country is estimated to be approximately 34 171 686 ha.
Therefore, the average proportion of the variable of interest in the reference period will be
estimated through the stratified random estimator of the mean (𝜇𝑆𝑇𝑅)
𝜇𝑆𝑇𝑅 =∑𝑊ℎ𝜇ℎ
𝐻
ℎ
Equation 4
Where:
𝑊ℎ Weight per stratum h, dimensionless.
𝜇ℎ Sample estimates within stratum h which is equal to𝜇ℎ =1
𝑛ℎ∑ 𝑦ℎ𝑘𝑛ℎ𝑘=1
where 𝑦ℎ𝑘 is the ith sample observation in the hth stratum

38
The 95% relative margin of error would be estimated with the following equations which
correspond to the variance estimator of a stratified sampling design. This formula has been
used instead that of a post-stratified estimator:
𝐸𝑟𝑟𝑜𝑟95% = 2 ∙ √𝑉𝑎𝑟^ (𝜇𝑆𝑇𝑅)
Equation 5
Where:
𝑉𝑎𝑟^ (𝜇𝑆𝑇𝑅) Variance of the stratified estimate.
𝜇ℎ Sample estimates within stratum h which is equal to𝜇ℎ =1
𝑛ℎ∑ 𝑦ℎ𝑘𝑛ℎ𝑘=1
where 𝑦ℎ𝑘 is the ith sample observation in the hth stratum
The variance of the stratified estimate is estimated as follows:
𝑉𝑎𝑟^ (𝜇𝑆𝑇𝑅) =∑𝑊ℎ2𝑥𝜎ℎ
2
𝐻
ℎ
Where:
𝑊ℎ Weight of stratum h;
𝜎ℎ2 Sample variance estimates within stratum h which is equal
to𝜎ℎ2 =
1
𝑛ℎ−1∑ 𝜇ℎ ∗ (1 − 𝜇ℎ)𝑛ℎ𝑘=1 where 𝜇ℎ is the sample estimates within
stratum h.
Calculations may be found in the spreadsheet that is provided together with this submission.

39
9.5.2 Results
Results are provided in the following tables.
Table 8. Above-ground biomass (AGB), above-ground carbon (AGC) and carbon dioxide equivalent or emission
factor for AGB (CO2eq (A))
Stratum AGB [t ha – 1] (IC) AGC [t ha – 1] (IC) CO2eq(A) [t ha – 1] (IC)
Mopane 44.51
(40.65 – 48.36)
20.92
(19.11 – 22.73)
76.71
(66.87 – 83.34)
Mecrusse 78.65
(73.18 – 84.12)
36.97
(34.39 – 39.54)
135.54
(126.11 – 144.97)
Semi-deciduous forest
including Miombo
62.24
(59.51 – 64.97)
29.25
(27.97 – 30.54)
107.26
(102.56 – 111.96)
Semi-evergreen forest
including gallery
forest
99.89
(93.98 – 105.81)
46.95
(44.17 – 49.73)
171.26
(161.96 – 182.35)
Population 69.15
(66.91 – 71.39)
32.50
(31.45 – 33.55)
119.17
(105.31 – 123.03)
Table 9. Below ground biomass (BGB), below ground carbon (BGC) and carbon dioxide equivalent or emission
factor for BGB (CO2eq (B))
Stratum BGB [t ha – 1] (IC) BGC [t ha – 1] (IC) CO2eq(B) [t ha – 1] (IC)
Mopane 13.89
(12.83 – 14.95)
6.53
(6.03 – 7.02)
23.93
(22.11 – 25.76)
Mecrusse 20.58
(19.21 – 21.96)
9.67
(9.03 – 10.32)
35.47
(33.11 – 37.84)
Semi-deciduous forest
including Miombo
24.82
(23.88 – 25.75)
11.66
(11.23 – 12.10)
42.77
(41.16 – 44.37)
Semi-evergreen forest
including gallery
forest
29.19
(27.53 – 30.86)
13.72
(12.94 – 14.50)
50.31
(47.44 – 53.18)
Population 24.58
(23.86 – 25.30)
11.55
(11.21 – 11.89)
42.36
(41.12 – 43.60)

40
Table 10. Total tree biomass (TB = AGB + BGB), total tree carbon (TC = AGC + BGC) and carbon dioxide equivalent or
emission factor for TB (CO2eq (T))
Stratum TB [t ha – 1] (IC) TC [t ha – 1] (IC) CO2eq(T) [t ha – 1] (IC)
Mopane 58.40
(53.50 – 63.29)
27.45
(25.14 – 29.75)
100.64
(99.20 – 109.08)
Mecrusse 99.23
(92.40 – 106.07)
46.64
(43.43 – 49.85)
171.01
(159.24 – 182.79)
Semi-deciduous forest
including Miombo
87.05
(83.40 – 90.70)
40.92
(39.20 – 42.63)
150.02
(143.74 – 156.31)
Semi-evergreen forest
including gallery
forest
129.09
(121.52 – 136.65)
60.67
(57.11 – 64.23)
222.46
(209.42 – 235.50)
Population 93.73
(90.78 – 96.68)
44.05
(42.67 – 45.44)
161.53
(156.44 – 166.61)
In addition to forest strata mentioned above, this FREL includes mangrove stratum. For this
stratum there isn't sufficient information available on above- and below-ground biomass, so
were applied the default values of IPCC Guidelines for national greenhouse gas inventories
as shown in Table 11. In the future, these values should be replaced with the country specific
values.
Table 11. Above- and below-ground biomass in mangroves
Domain Region Above-
ground
biomass
(tDM.ha-
1)
Ratio of below-ground biomass to
above-ground biomass
Source
tonne root d.m.
(tonne shoot d.m.)-1
tDM.ha-1
Tropical Tropical Dry 92 0.29 26.68 IPCC (2013)
Table 12. Standard error and sampling error of estimates
Error Stratum AGB/AGC/
CO2eq(A)
BGB/BGC
/CO2eq(B)
TB/TC/CO
2eq(T)
Standard
Error (%)
Mopane 4.42 3.88 4.28
Mecrusse 3.55 3.41 3.51
Semi-deciduous forest including
Miombo 2.24 1.92 2.14
Semi-evergreen forest including
gallery forest 3.02 2.91 2.99
Population 1.66 1.50 1.61
Mopane 8.65 7.61 8.39

41
Error Stratum AGB/AGC/
CO2eq(A)
BGB/BGC
/CO2eq(B)
TB/TC/CO
2eq(T)
Sampling
Error (%)
Mecrusse 6.96 6.68 6.88
Semi-deciduous forest including
Miombo 4.39 3.76 4.19
Semi-evergreen forest including
gallery forest 5.92 5.70 5.86
Population 3.25 2.93 3.15
For biomass stocks present on non-forestlands after conversion from forestlands was applied
the IPCC default values, as can been in the table below.
Table 13. Default biomass stocks present on forest land converted to cropland or grassland
Forestland
converted to
Above-ground biomass
(tDM.ha-1)
Ratio of below-ground biomass to
above-ground biomass Source
tonne root d.m. (tonne
shoot d.m.)-1 tDM.ha-1
Cropland 10 - - IPCC
(2006) (Annual)
Grassland 2.3 2.8 6.44

42
10 FOREST REFERENCE LEVEL
10.1 National circumstances
Mozambique recorded very high deforestation (detailed in Annex 2) between 2003 and 2013,
with 0.79% of the forest area being lost annually, which corresponds to 267 029 hectares per
year.
10.2 Calculation
Mozambique’s FREL has been estimated as the average annual GHG emissions from
deforestation of the historical reference period of 2003-2013, aggregating the class of forest
in stratum. Calculation methods are provided in section 7.2 and the calculations are provided
in the spreadsheet that is provided together with this submission.
10.3 Proposed FREL
According to the table below (Table 15 and Figure 9), the annual and total of the period
emissions are in the order of 38,956,426 tCO2e and 428,520,683 tCO2e, respectively. In the
table below, we present the FREL proposal for Mozambique for REDD+ activity
(deforestation).
Table 14. Total and annual average of emissions of C02 per stratum per year (FREL)
Stratum Total (tCO2) tCO2e/year
Broadleaved (Semi-) deciduous including Miombo 303 295 577 27 572 325
Broadleaved (Semi-) evergreen 115 479 142 10 498 104
Mangrove 1 675 766 152 342
Mopane 6 727 125 611 557
Mecrusse 1 343 072 122 097
Total 428 520 683 38 956 426

43
Figure 9. Graphical representation of emission from deforestation per year
10.4 Analysis of uncertainty
Sampling uncertainty was estimated for both activity data and emission factors as shown
in sections 9.4 and 10.5. Uncertainties were propagated using the Tier 1 method of the
2006 IPCC GL, i.e. propagation of uncertainties. The following equations were used for
addition or multiplication.
For addition or subtraction:
𝑈𝑡𝑜𝑡𝑎𝑙 =√(𝑈1. 𝑥1)2 + (𝑈2. 𝑥2)2 +⋯+ (𝑈𝑛. 𝑥𝑛)2
|𝑥1 + 𝑥2 +⋯+ 𝑥𝑛| Equation 6
Where:
𝑈𝑖 Percentage uncertainty associated with each of the parameters
𝑋𝑖 The value of the parameter
𝑈𝑡𝑜𝑡𝑎𝑙 The percentage uncertainty in the sum of parameters
For multiplication:
𝑈𝑡𝑜𝑡𝑎𝑙 = √𝑈12 + 𝑈2
2 +⋯+ 𝑈𝑛2
Where:
𝑈𝑖 Percentage uncertainty associated with each of the parameters
𝑋𝑖 The value of the parameter
𝑈𝑡𝑜𝑡𝑎𝑙 The percentage uncertainty in the multiplication of parameters
Using these equations and the uncertainties reported previously, the uncertainty of the
total emissions for deforestation is a 95% confidence interval of ±7% as shown in table
16.

44
Table 15. Uncertainty per stratum
Stratum Uncertainty from emission
Broadleaved (Semi-) deciduous including Miombo 9%
Broadleaved (Semi-) evergreen 12%
Mangrove 86%
Mecrusse 85%
Mopane 30%
TOTAL 7%
10.5 Capacity building needs
The Government of Mozambique is as a result of the implementation of the National
REDD+ strategy engaging different institutions in measuring and monitoring deforestation
and forest degradation. There are some gaps identified that needs urgently to be addressed
which are:
• Institutional coordination
• Development of methodologies and guidelines for monitoring GHG’s
• Improvement of methodologies to estimate carbon
• Improvement of methodologies for quality control and quality assurance
• Inclusion of additional carbon pool in the estimation of carbon stocks
Institutional coordination is the main challenge for the M&MRV system for REDD+ as
those with mandate in monitoring and measuring the carbon from REDD+ are not
communicating effectively. It has been identified that some them are carrying the same
activities that could be simplified if only one could do while others could do other
activities. The main challenge is in the improvement of communication between them to
reduce duplication of efforts. This intent will be achieved through memorandums of
understanding, workshops for data sharing, production of papers, and harmonization of
methodologies between institutions involved on the MRV system.

45
10.6 Areas of improvement
The following areas of improvement have been identified and will be addressed in the
coming years:
• Forest degradation: It is expected that Mozambique will develop the
methodology to calculate emissions from forest degradation throughout 2018. The
country will develop an automated method to produce yearly forest biomass,
biomass change and degradation maps for the periods 2007-2010 and 2015-2016,
using the freely available ALOS PALSAR (1 and 2) mosaics. This will allow us
to produce a benchmark for forest biomass and degradation estimates baseline.
• Carbon pools: SOC and DOM data collected during the NFI is still being
processed. Once it is finalized, the FREL can be updated with these values.
• Allometric equations: We expect that the research institutions of Mozambique
will continue developing and improving the allometric equations for different
forest strata and species. Thus, updates to this FREL will include new equations
developed, especially in the case where a generic equation was used.
• Emission factors: The 4th National Forest Inventory produced the emission
factors used in this FRELs. It is expected that the National Permanent Sampling
Plot Network will allow the updating of emission factors for different strata.
• Emissions from fires: Fires are very ubiquitous in Mozambique, and thus it is
important to include information on the emissions resulting from fires. Although
the MODIS sensor offers easy to use fire products, there is a limitation of
insufficient validation data for these products. We plan on conducting a validation
process to determine the suitability of these products for the purpose of calculating
emissions from fires in Mozambique.

46
11 REFERENCES
CEAGRE, & Winrock International. 2016. Estudo sobre causas directas e indirectas do
desmatamento e degradação florestal em Moçambique - Relatório final. In (p. 36 p).
Maputo, Mozambique.
IPCC. 2006. IPCC Guidelines for National Greenhouse Gas Inventories (eds. Eggleston,
H.S. et al.). Institute for Global Environmental Strategies (IGES), Hayama, Japan.
IPCC. 2013. 2013 Supplement to the 2006 IPCC guideline for national greenhouse gas
inventories: Wetlands. IGES. Hayama, Japan.
Magalhães T.M. 2015a. Live above- and belowground biomass of a Mozambican
evergreen forest: a comparison of estimates based on regression equations and biomass
expansion factors. Forest ecosystems 2:28.
Magalhães T.M. 2015b. Allometric equations for estimating belowground biomass of
Androstachys johnsonii Prain. Carbon Balance and Management 10:16.
Mate R.S., Johansson T. 2014. Biomass Equations for Tropical Forest Tree Species in
Mozambique. Forests 5: 535-556.
Mokany K., Raison J.R., Prokushkin A.S. 2006. Critical analysis of root: shoot ratios in
terrestrial biomes. Global Change Biology 12: 84-96.
Sitoe, A., Salomão, A., & Wertz-Kanounnikoff, S. 2012. The context of REDD+ in
Mozambique: Drivers, agents and institutions. Bogor, Indonesia: Center for International
Forestry Research (CIFOR)

47
ANNEX

48
Annex 1. LULC classification system
The 2006 IPCC Guidelines considers the following land‐ use categories for greenhouse
gas inventory reporting:
• Forest Land: This category includes all land with woody vegetation consistent
with thresholds used to define Forest Land in the national greenhouse gas
inventory. It also includes systems with a vegetation structure that currently fall
below, but in situ could potentially reach the threshold values used by a country
to define the Forest Land category.
• Cropland: This category includes cropped land, including rice fields, and
agroforestry systems where the vegetation structure falls below the thresholds
used for the Forest Land category.
• Grassland: This category includes rangelands and pasture land that are not
considered Cropland. It also includes systems with woody vegetation and other
non‐ grass vegetation such as herbs and brushes that fall below the threshold
values used in the Forest Land category. The category also includes all grassland
from wild lands to recreational areas as well as agricultural and silvi‐ pastoral
systems, consistent with national definitions.
• Wetlands: This category includes areas of peat extraction and land that is covered
or saturated by water for all or part of the year (e.g., peatlands) and that does not
fall into the Forest Land, Cropland, Grassland or Settlements categories. It
includes reservoirs as a managed sub‐ division and natural rivers and lakes as
unmanaged sub‐ divisions.
• Settlements: This category includes all developed land, including transportation
infrastructure and human settlements of any size, unless they are already included
under other categories. This should be consistent with national definitions.
• Other Land: This category includes bare soil, rock, ice, and all land areas that do
not fall into any of the other five categories
And the following land‐ use conversions:
FF = Forest Land Remaining Forest Land, LF = Land Converted to Forest Land
GG = Grassland Remaining Grassland, LG = Land Converted to Grassland
CC = Cropland Remaining Cropland, LC = Land Converted to Cropland

49
WW = Wetlands Remaining Wetlands, LW = Land Converted to Wetlands
SS = Settlements Remaining Settlements, LS = Land Converted to Settlements
OO = Other Land Remaining Other Land, LO = Land Converted to Other Land
Where detailed data about the origin of land converted to a category is available, countries
can specify the land‐ use conversion activity we should define and measure (eg.
monitoring and measuring deforestation involves considering: (i) FC: Forest Land to
Cropland, (ii) FG: Forest land to Grassland, (iii) FW: Forest Land to Wetland, (iv) FS:
Forest Land to Settlements and FO: Forest land to Others), but when applying these land‐
use category conversions, countries should classify land under end land use category to
prevent double counting. If a country's national land‐ use classification system does not
match categories (i) to (vi) as described above, the land‐ use classifications should be
combined or disaggregated in order to represent the categories presented here.
The classification system, consistent with the national FREL and the GHG inventory,
should be composed of non‐ overlapping LULC classes and forest strata, with an
independent class for forest systems where cyclical changes in forest cover are present, to
be in compliance with both methodological frameworks (FCPF CF and VCS JNR).
The LULC classes used in Mozambique (level 2) and national subclasses (level 3) and
their correspondence with the IPCC classes (level 1) are shown in table below.

50
1A. Land use and Land Cover classification system used in the production of the maps, activity data and national forest inventory.
Level 1 Level 2 Level 3
Class Description Class Description Class Description
Forests 1 ha area with more
than 30% canopy
cover of trees with at
least 3 m in height
Forest Plantation Forest plantations with exotic
species, including pines and
eucalyptus.
Forest with shifting
cultivation
Forest area which contains at
least 10% cover of crops.
Broadleaved (Semi-
) evergreen closed
forest
(Semi-) evergreen forest with
at least 70% canopy cover.
Coastal dense
woody vegetation
Evergreen forests found
close to the coast.
Mangrove dense Forest type that occurs in
the coastal intertidal zone.
Mecrusse dense Evergreen forest type
characterised by dense
stands of Androstachys
johnsonii
Gallery forest Forest type found along
rivers or in wetlands.
Closed broadleaved
(Semi-) evergreen
mountainous forest
Evergreen forests found
above 300 m altitude.
Broadleaved (Semi-
) deciduous closed
forest
(Semi-) deciduous forest
with at least 70% canopy
cover.
Miombo dense Deciduous forest type
characterised by the
dominance of
Brachystegia and
Julbernardia species.
Mopane dense Deciduous forest type
characterised by the
dominance of
Colophospermum mopane

51
Level 1 Level 2 Level 3
Class Description Class Description Class Description
Broadleaved (Semi-
) evergreen open
forest
(Semi-) evergreen forest with
less than 70% canopy cover.
Coastal open
woody vegetation
Evergreen forests found
close to the coast.
Mangrove open Forest type that occurs in
the coastal intertidal zone.
Mecrusse open Evergreen forest type
characterised by dense
stands of Androstachys
johnsonii
Open broadleaved
(Semi-) evergreen
mountainous forest
Evergreen forests found
above 300 m altitude.
Broadleaved (Semi-
) deciduous open
forest
(Semi-) deciduous forest
with less than 70% canopy
cover.
Mopane open Deciduous forest type
characterised by the
dominance of
Colophospermum mopane
Miombo open Deciduous forest type
characterised by the
dominance of
Brachystegia and
Julbernardia species.
Crops 1 ha area with more
than 20% cover of
any type of planted
crop, but less than
30% cover of forest
or 20% cover of
infrastructure.
Tree crops Planted tree crops, including
coconut, mango and cashew
trees
Field crops Field crops with less than
20% cover of tree crops.
Shrub plantation Including tea, banana and
cane.
Rainfed crops Including shifting
agriculture.
Irrigated crops Including commercial
agriculture

52
Level 1 Level 2 Level 3
Class Description Class Description Class Description
Rice crops
Shifting cultivation
with open to closed
forested areas
Planted crop area with more
than 10% forest cover.
Grassland 1 ha area dominated
by grasses and
shrubs or woodlands
with less than 30%
tree cover. Also less
than 20% cover of
crops or
infrastructure.
Grasslands Area dominated by grasses,
with less than 20% cover of
trees or shrubs
Thicket Area with more than 20%
cover of shrubs or trees.
Broadleaved (Semi-
) evergreen thicket
Area with more than 20%
cover of shrubs or trees.
Broadleaved (Semi-
) deciduous thicket
Shrubland Area with more than 20%
cover of shrubs or trees.
Broadleaved (Semi-
) evergreen
shrubland
Broadleaved (Semi-
) deciduous
shrubland
Wetlands 1 ha area
permanently flooded
or temporarily
flooded with or
without shrubby or
herbaceous
vegetation.
Aquatic or
regularly flooded
shrublands
Aquatic or regularly flooded
with more than 20% cover of
shrubs or trees
Aquatic or
regularly flooded
shrublands
Aquatic or
regularly flooded
herbaceous
vegetation
Aquatic or regularly flooded
area dominated by grasses,
with less than 20% cover of
trees or shrubs
Aquatic or
regularly flooded
herbaceous
vegetation
Artificial water
bodies
Artificial water body with
less than 20% cover of trees,
shrubs or grasses.
Artificial water
bodies

53
Level 1 Level 2 Level 3
Class Description Class Description Class Description
Natural water
bodies
Natural water body with less
than 20% cover of trees,
shrubs or grasses.
Natural water
bodies
Salt lake Salt lake
Settlements 1 ha area with at
least 20% cover of
infrastructure
(houses, roads, etc),
but less than 30%
forest canopy cover.
Other land Bare area with less
than 20% cover of
grasses, shrubs,
trees, wetland, crops
or infrastructure
Bare soils Bare area consisting of soil Bare soils
Bare rocks Bare area consisting of rocks Bare rocks
Dunes Bare area consisting of sand
dunes
Dunes

54
Annex 2. Activity data detailed results
2A. Historic of deforestation per Province
Province Years
Total (ha) ha/yr 2003 2004 2005 2006 2007 2008 2009 2010 2011 2012 2013
Cabo Delgado 16 476 9 886 13 181 21 419 29 658 16 476 14 829 13 181 18 124 9 886 3 295 166 412 15 128
Gaza 7 018 12 282 3 509 15 791 3 509 1 755 1 755 10 527 7 018 3 509 3 509 70 183 6 380
Inhambane 10 475 6 983 15 712 8 729 3 492 1 746 3 492 1 746 5 237 3 492 3 492 64 593 5 872
Manica 39 183 51 108 64 737 35 776 22 147 49 404 42 590 39 183 28 961 11 925 25 554 410 568 37 324
Maputo 3 561 - 7 122 - - 1 780 - - 1 780 - 1 780 16 024 1 457
Maputo City - - - - - - - - - - - - -
Nampula 63 487 115 279 75 182 53 463 75 182 80 194 60 146 76 853 86 877 76 853 50 121 813 637 73 967
Niassa 19 063 17 474 31 772 23 829 23 829 36 537 36 537 82 606 30 183 50 835 31 772 384 437 34 949
Sofala 34 173 44 425 47 843 30 756 32 465 32 465 15 378 35 882 10 252 37 591 6 835 328 064 29 824
Tete 15 024 10 016 11 686 5 008 6 678 15 024 16 694 33 388 21 702 15 024 16 694 166 938 15 176
Zambézia 25 737 20 590 53 191 56 622 42 896 54 907 77 212 72 065 37 748 44 612 30 885 516 466 46 951
Annual deforestation 234 198 288 044 323 934 251 393 239 854 290 289 268 632 365 431 247 884 253 726 173 937 2 937 322 267 029

55
2B. Historic deforestation per stratum
Stratum Years Total
(ha) ha/yr
2003 2004 2005 2006 2007 2008 2009 2010 2011 2012 2013
Broadleaved (Semi-)
deciduous forest
including Miombo
192 108 235 354 242 940 200 388 192 401 213 758 206 592 268 354 190 519 198 476 137 050 2 277 941 207 086
Broadleaved (Semi-)
evergreen forest 38 633 38 874 74 239 35 283 40 605 76 531 60 370 68 104 45 389 50 123 33 514 561 665 51 060
Mangrove - 1 716 - - 1 716 - - 5 140 - - - 8 572 779
Mecrusse 1 755 - - 5 246 1 709 - - - - - - 8 709 792
Mopane 1 704 12 100 6 754 10 476 3 424 - 1 669 23 831 11 975 5 128 3 373 80 435 7 312
Annual deforestation 234 198 288 044 323 934 251 393 239 854 290 289 268 632 365 431 247 884 253 726 173 937 2 937 322 267 029

56
2C. Historic emissions from deforestation by province
Province Years Total
(tCO2e) tCO2e/yr
2003 2004 2005 2006 2007 2008 2009 2010 2011 2012 2013
Cabo Delgado 2 325 279 1 320 002 1 754 039 2 869 544 3 956 427 2 437 437 2 222 207 2 003 399 2 688 217 1 435 737 556 929 23 569 219 2 142 656
Gaza 972 637 1 415 277 469 824 1 704 374 383 164 360 063 233 007 964 745 672 050 383 164 593 070 8 151 377 741 034
Inhambane 1 398 610 927 352 2 011 690 1 236 209 463 676 231 838 463 676 231 838 699 305 467 467 463 676 8 595 335 781 394
Manica 5 859 536 7 820 700 10 596 804 4 920 995 3 318 595 7 435 572 6 769 950 5 489 439 4 135 708 1 622 893 3 806 596 61 776 788 5 616 072
Maputo 472 876 - 953 485 - - 369 231 - - 240 304 - 365 365 2 401 262 218 297
Maputo City - - - - - - - - - - - - -
Nampula 8 555 701 15 711 940 10 955 683 7 605 567 10 486 259 11 496 684 8 958 846 10 836 369 12 875 357 11 448 313 7 634 877 116 565 596 10 596 872
Niassa 2 991 710 2 554 123 4 825 283 3 624 602 3 397 978 4 907 358 5 563 081 12 594 422 4 252 182 7 458 305 4 571 283 56 740 327 5 158 212
Sofala 5 299 161 6 445 082 7 485 644 4 721 607 5 348 130 6 185 839 2 537 126 5 994 087 1 612 640 6 041 024 911 354 52 581 692 4 780 154
Tete 2 247 890 1 493 108 1 308 124 665 080 925 209 2 357 902 2 134 483 3 785 129 2 641 909 1 916 414 2 255 370 21 730 617 1 975 511
Zambézia 3 794 420 2 967 006 7 820 429 8 287 331 6 572 595 8 428 496 11 127 306 10 821 557 5 882 738 6 440 064 4 266 527 76 408 469 6 946 224