msc remote sensing 2006-7 principles of remote sensing 6: ground segment, pre-processing &...
TRANSCRIPT

MSc Remote Sensing 2006-7Principles of Remote Sensing 6: ground segment, pre-processing & scanning
Dr. Hassan J. Eghbali

• Last week– orbits and swaths– Temporal & angular sampling/resolution + radiometric
resolution
• This week– data size, storage & transmission– pre-processing stages (transform raw data to “products”)– sensor scanning mechanisms
Recap
Dr. Hassan J. Eghbali

• Size of digital image data easy (ish) to calculate– size = (nRows * nColumns * nBands * nBitsPerPixel) bits– in bytes = size / nBitsPerByte– typical file has header information (giving rows, cols, bands, date etc.)
Data volume?
(0,0)nColumns
nRow
s
(r,c)
nBands(0,0)
nColumns
nRow
s
(r,c)
nBands
Time
Dr. Hassan J. Eghbali

• Several ways to arrange data in binary image file
– Band sequential (BSQ)– Band interleaved by line
(BIL)– Band interleaved by pixel
(BIP)
Aside
From http://www.profc.udec.cl/~gabriel/tutoriales/rsnote/cp6/cp6-4.htm Dr. Hassan J. Eghbali

• Landsat ETM+ image? Bands 1-5, 7 (vis/NIR)– size of raw binary data (no header info) in bytes?
– 6000 rows (or lines) * 6600 cols (or samples) * 6 bands * 1 byte per pixel = 237600000 bytes ~ 237MB
• actually 226.59 MB as 1 MB 1x106 bytes, 1MB actually 220 bytes = 1048576 bytes
• see http://www.matisse.net/mcgi-bin/bits.cgi
– Landsat 7 has 375GB on-board storage (~1500 images)
Data volume: examples
Details from http://ltpwww.gsfc.nasa.gov/IAS/handbook/handbook_htmls/chapter6/chapter6.htm
Dr. Hassan J. Eghbali
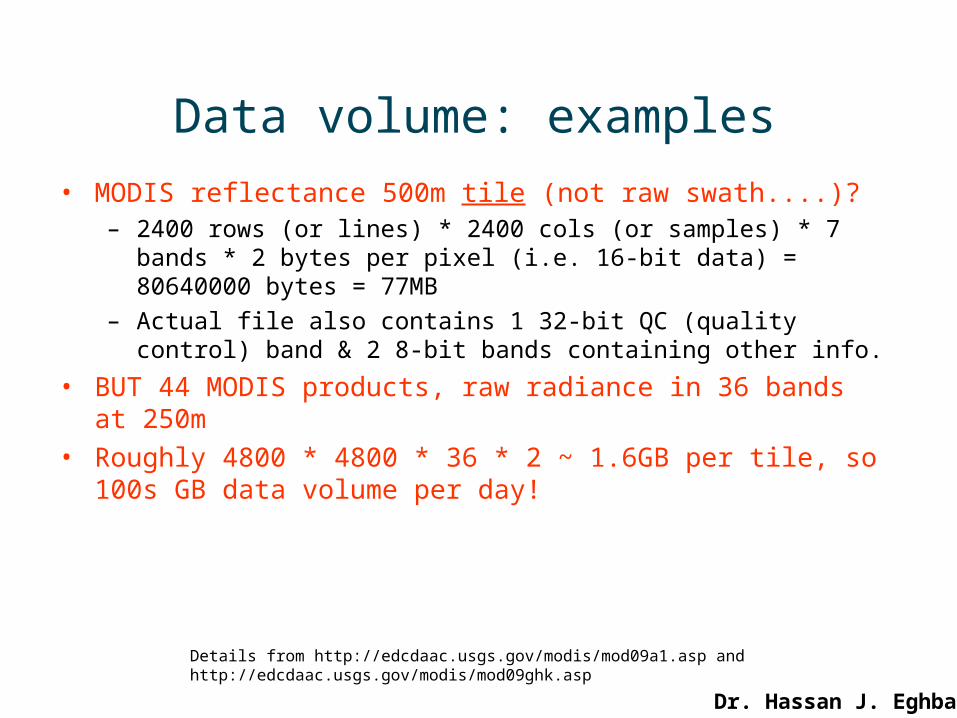
• MODIS reflectance 500m tile (not raw swath....)?– 2400 rows (or lines) * 2400 cols (or samples) * 7 bands * 2 bytes per
pixel (i.e. 16-bit data) = 80640000 bytes = 77MB
– Actual file also contains 1 32-bit QC (quality control) band & 2 8-bit bands containing other info.
• BUT 44 MODIS products, raw radiance in 36 bands at 250m• Roughly 4800 * 4800 * 36 * 2 ~ 1.6GB per tile, so 100s GB data
volume per day!
Data volume: examples
Details from http://edcdaac.usgs.gov/modis/mod09a1.asp and http://edcdaac.usgs.gov/modis/mod09ghk.asp
Dr. Hassan J. Eghbali

• Ground segment– receiving stations capture digital data transmitted by satellite
• A: direct if Ground Receiving Station (GRS) visible• B: storage on board for later transmission• C: broadcast to another satellite (typically geostationary telecomms) known
as Tracking and Data Relay Satellite System (TDRSS)
Transmission, storage and processing
From http://www.ccrs.nrcan.gc.ca/ccrs/learn/tutorials/fundam/chapter2/chapter2_15_e.html
Dr. Hassan J. Eghbali

• Ground receiving station– dish to receive raw data (typically broadcast in wave)
– data storage and archiving facilities
– possibly processing occurs at station (maybe later)
– dissemination to end users
Transmission, storage and processing
From http://www.ccrs.nrcan.gc.ca/ccrs/learn/tutorials/fundam/chapter2/chapter2_15_e.html
Dr. Hassan J. Eghbali

• Ground receiving station, Kiruna, Sweden
Transmission, storage and processing
From http://www.esa.int/SPECIALS/ESOC/SEMZEEW4QWD_1.html#subhead1
Dr. Hassan J. Eghbali
Transmission, storage and processing
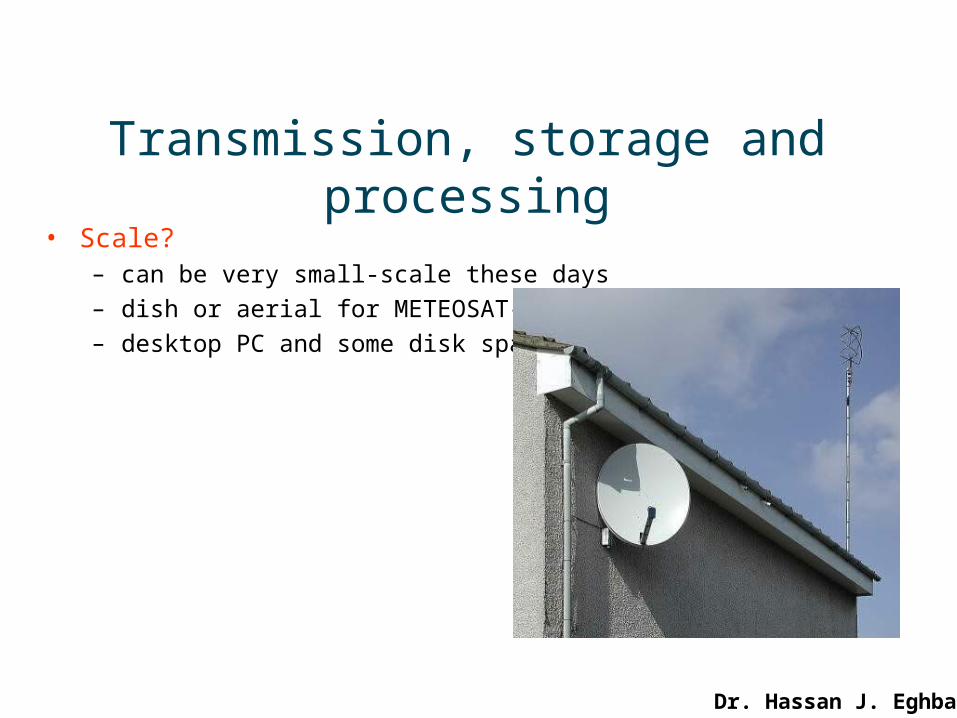
• Scale?– can be very small-scale these days
– dish or aerial for METEOSAT-type data
– desktop PC and some disk space
Dr. Hassan J. Eghbali

• MODIS DB– ideal for smaller organisations,
developing nations etc.– Only need 3m dish and some hardware
• Pre-processing stage can be VERY complex!
• Before you let users loose....
E.g. MODIS direct broadcast (DB)
From http://daac.gsfc.nasa.gov/DAAC_DOCS/direct_broadcast/
Dr. Hassan J. Eghbali

(Pre)Processing chain
• Task of turning raw top-of-atmosphere (TOA) radiance values (raw DN) into useful information
• geophysical variables, products etc. DERIVED from radiance– Can be very complex, time- (and space) consuming
– BUT pre-processing determines quality of final products• e.g. reflectance, albedo, surface temperature, NDVI, leaf area index (LAI),
suspended organic matter (SOM) content etc. etc.
– typically require ancillary information, models etc.
– combined into algorithm for turning raw data into information
Dr. Hassan J. Eghbali

(Pre?) Processing chain• Typically:
– radiometric calibration– radiometric correction– atmospheric correction– geometric correction/registration
Dr. Hassan J. Eghbali

Radiometric calibration• Account for sensor response
– cannot assume sensor response is linear
– account for non-linearities via pre-launch and/or in-orbit calibration• On-board black body (A/ATSR), stable targets (AVHRR), inter-sensor
comparisons etc.
DNout
DNin
Dr. Hassan J. Eghbali

Processing chain
• Typically:– radiometric calibration– radiometric correction– atmospheric correction– geometric correction/registration
Dr. Hassan J. Eghbali

Radiometric correction
• Remove radiometric artifacts– dropped lines
• detectors in CCD may have failed
– fix by interpolating DNs either side?
– Automate?
• Topographic effects?
CHRIS-PROBA image over Harwood Forest, Northumberland, UK, 9/5/2004
See http://www.chris-proba.org.uk
Dr. Hassan J. Eghbali

Radiometric correction
• Remove radiometric artifacts– striping
• deterioration of detectors with time (& non-linearities)
• Filter in Fourier domain to remove periodic striping
From http://visibleearth.nasa.gov/cgi-bin/viewrecord?7386
Dr. Hassan J. Eghbali

Processing chain
• Typically:– radiometric calibration– radiometric correction– atmospheric correction– geometric correction/registration
Dr. Hassan J. Eghbali

Remember? Interactions with the atmosphere
•Notice that target reflectance is a function of
•Atmospheric irradiance (path radiance: R1)
•Reflectance outside target scattered into path (R2)
•Diffuse atmospheric irradiance (scattered onto target: R3)
•Multiple-scattered surface-atmosphere interactions (R4)
From: http://www.geog.ucl.ac.uk/~mdisney/phd.bak/final_version/final_pdf/chapter2a.pdf
R1
target
R2
target
R3
target
R4
target
Dr. Hassan J. Eghbali

Atmospheric correction: simple
• So....need to remove impact of atmosphere on signal i.e. turn raw TOA DN into at-ground reflectance
• Simple methods?– Convert DN to apparent radiance Lapp – sensor dynamic range
– Convert Lapp to apparent reflectance (knowing response of sensor)
– Convert to intrinsic surface property - at-ground reflectance in this case, by accounting for atmosphere
Dr. Hassan J. Eghbali

Atmospheric correction: simple• Simple methods
– e.g. empirical line correction (ELC) method– Use target of “known”, low and high reflectance targets in one channel e.g. non-
turbid water & desert, or dense dark vegetation & snow– Assuming linear detector response, radiance, L = gain * DN + offset
– e.g. L = DN(Lmax - Lmin)/255 + Lmin
DN
Radiance, L
Target DN values
Regression line L = G*DN + O (+)
Offset assumed to be atmospheric path radiance (plus dark current signal)
Lmax
Lmin
Dr. Hassan J. Eghbali

Atmospheric correction: simple
• Drawbacks– require assumptions of:
• Lambertian surface (ignore angular effects)
• Large, homogeneous area (ignore adjacency effects)
• Stability (ignore temporal effects)
– Also, per-band not per pixel so assumes • atmospheric effects invariant across image
• illumination invariant across image
• ok for narrow swath (e.g. airborne) but no good for wide swath
Dr. Hassan J. Eghbali

Example: airborne data
Airborne Thematic Mapper (ATM) data over Harwood Forest, Northumberland, UK, 13/7/2003
Compact Airborne Spectrographic Imager (CASI) data over Harwood Forest, Northumberland, UK, 13/7/2003
See: http://www.nerc.ac.uk/arsf
Haze due to scan angle of instruments
Dr. Hassan J. Eghbali

Atmospheric correction: complex• Atmospheric radiative transfer modelling
– use detailed scattering models of atmosphere including gas and aerosols
• Second Simulation of Satellite Signal in Solar Spectrum (6s)
• MODTRAN/LOWTRAN
• SMAC etc.
http://www-loa.univ-lille1.fr/Msixs/msixs_gb.html
http://geosci.uchicago.edu/~archer/cgimodels/radiation.html
Dr. Hassan J. Eghbali

Atmospheric correction: complex
• Radiative transfer models such as 6S require:– Geometrical conditions (view/illum. angles)
– Atmospheric model for gaseous components (Rayleigh scattering)• H2O, O3, aerosol optical depth, (opacity)
– Aerosol model (type and concentration) (Mie scattering)• Dust, soot, salt etc.
– Spectral condition• bands and bandwidths
– Ground reflectance (type and spectral variation)• surface BRDF (default is to assume Lambertian….)
• If no info. use default values (Standard Atmosphere)
From: http://www.geog.ucl.ac.uk/~mdisney/phd.bak/final_version/final_pdf/chapter2a.pdfDr. Hassan J. Eghbali

Atmospheric correction
• Can measure from ground and/or use multi-angle viewing to obtain different path lengths through atmos e.g. MISR, CHRIS– infer optical depth and
path radiance AND aerosols
– so use data themselves to infer atmos. scattering
From:http://visibleearth.nasa.gov/cgi-bin/viewrecord?129Dr. Hassan J. Eghbali
Atmospheric correction: summary
• Convert TOA radiance to at-ground reflectance• VERY important to get right (can totally dominate signal)• Simple methods
– e.g. ELC but rough and ready and require many assumptions
• Complex methods– e.g. 6S but require much ancillary assumptions
– BUT can use multi-angle measurements to correct
– i.e. treat atmosphere as PART of surface parameter retrieval problem• different view angles give different PATH LENGTH
Dr. Hassan J. Eghbali

Processing chain
• Typically:– radiometric calibration– radiometric correction– atmospheric correction– geometric correction/registration
Dr. Hassan J. Eghbali
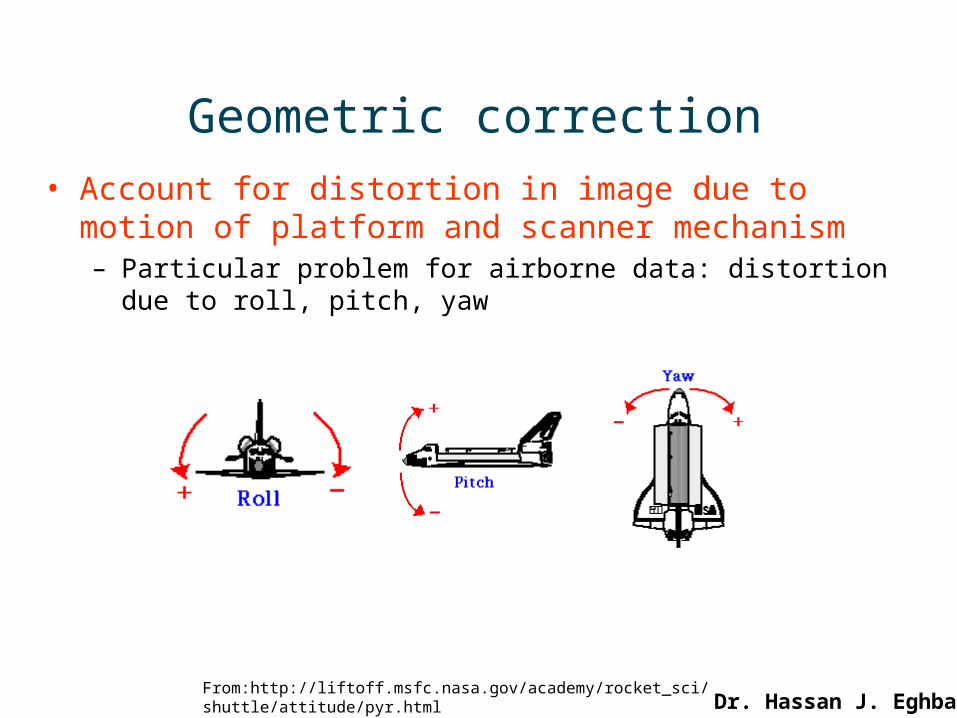
Geometric correction• Account for distortion in image due to motion of platform
and scanner mechanism– Particular problem for airborne data: distortion due to roll, pitch,
yaw
From:http://liftoff.msfc.nasa.gov/academy/rocket_sci/shuttle/attitude/pyr.htmlDr. Hassan J. Eghbali

Geometric correction• Airborne data over Barton Bendish,
Norfolk, 1997• Resample using ground control points
– various warping and resampling methods– nearest neighbour, bilinear or bicubic
interpolation....– Resample to new grid (map)
Dr. Hassan J. Eghbali
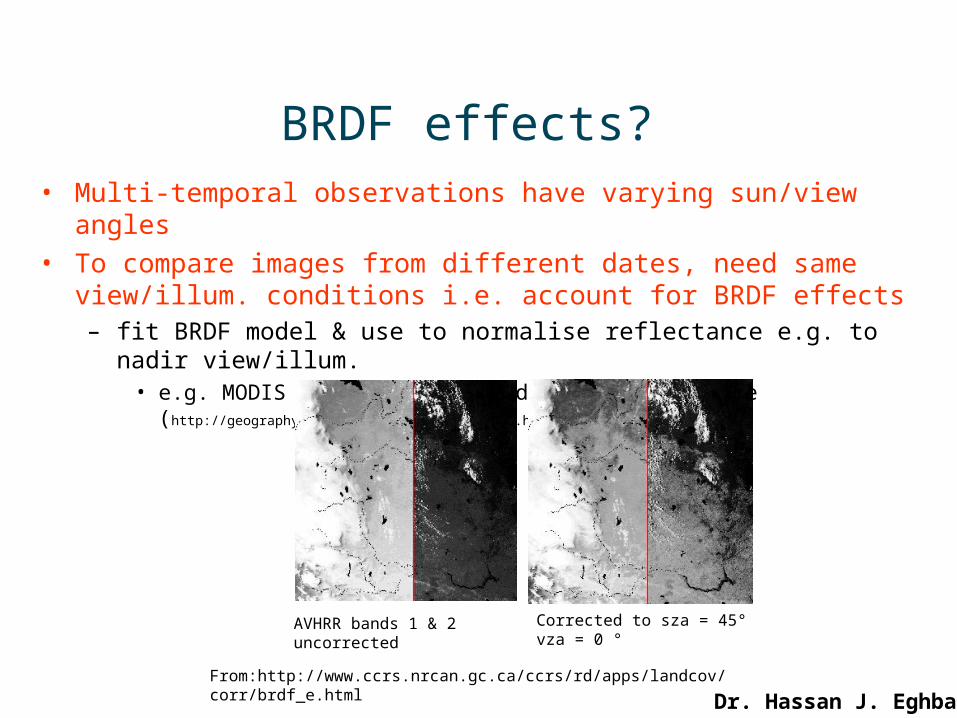
BRDF effects?• Multi-temporal observations have varying sun/view angles • To compare images from different dates, need same view/illum.
conditions i.e. account for BRDF effects– fit BRDF model & use to normalise reflectance e.g. to nadir view/illum.
• e.g. MODIS NBAR nadir BRDF-adjusted reflectance (http://geography.bu.edu/brdf/userguide/nbar.html)
AVHRR bands 1 & 2 uncorrected
From:http://www.ccrs.nrcan.gc.ca/ccrs/rd/apps/landcov/corr/brdf_e.html
Corrected to sza = 45° vza = 0 °
Dr. Hassan J. Eghbali

BRDF effects?
• Field measurements of BRDF: goniometer e.g. European Goniometric Facility (EGO) at JRC, & FIGO in CH– http://www.geo.unizh.ch/rsl/research/SpectroLab/goniometry/index.shtml
Movable sensor head: alter view zen. angle
Azimuthal rail: alter view azimuth angle
Dr. Hassan J. Eghbali

Pre-processing: summary
• Convert raw DN to useful information– calibrate instrument response and remove radiometric blunders
– remove atmospheric effects
– remove BRDF effects?
– resample onto grid
• Results in more fundamental property e.g. surface reflectance, emissivity etc.– NOW apply scientific algorithm to convert reflectance to LAI, fAPAR,
albedo, ocean colour etc. etc. etc.
Dr. Hassan J. Eghbali

Sensor scanning characteristics
• Range of scanning mechanisms to build up images• Different applications, different image characteristics and
pros/cons for each type– scanning mechanisms: electromechanical
• discrete detectors• whiskbroom scanners• pushbroom scanners
– digital frame cameras
Dr. Hassan J. Eghbali

Discrete detectors• Mirror can rotate or scan
– individual detectors record signal in different bands
– How do we split signal into separate bands?
• Dichroic mirror or prism
Adapted from Jensen, 2000, p. 184
Lens
Scan mirror
Sensor path
Separate bands
Dichroic mirrors
Dr. Hassan J. Eghbali

Scanning mechanisms: across track
• 3 main types of electromechanical (detectors, optics plus mechanical scanning) mechanisms– across track or “whiskbroom”
scanner (mechanical)
– linear detectors array (electronic)
– beam splitter / dichroic / prism / filters splits incoming signal into separate wavelength regions
From Jensen, J. (2000) Remote sensing: and Earth resource perspective, p. 184
Sensor motion
Dichroic lens/prism
Dr. Hassan J. Eghbali

Scanning mechanisms: across track
• Whiskbroom scanner– Mirror either rotates fully, or oscillates
– Oscillation can have delays at either end of scan (vibration?)
– Restricted “dwell time” requires tradeoff with no. of bands to give acceptable SNR
– motion of platform and mirror causes image distortion
• Diameter of IFOV on surface H– H = flying height; = nominal angular IFOV in
radians
– e.g. For 2.5 mrad IFOV, H = 3000m, D = 2.5x10-
3x3000 = 7.5m
– Typically .5 to 5 mrad - tradeoff of spatial resolution v SNR
IFOV sweeps surface
Adapted from Lillesand, Kiefer and Chipman, 2004 p. 332
Dr. Hassan J. Eghbali

Scanning mechanisms: along track• Pushbroom scanner
– pixels recorded line by line, using forward motion of sensor
– less distortion across track but overlap to avoid gaps
– No moving parts so less to go wrong and longer “dwell time”
– BUT needs v. good calibration to avoid striping– Ground-sampled distance (GSD) in x-track direction
fixed by CCD element size– GSD along-track fixed by detector sampling interval
(T) used for AD conversion
From: http://ceos.cnes.fr:8100/cdrom/ceos1/irsd/pages/datacq4.htm & J. Jensen (2000)
Sensor motion
Sensor motion
Dr. Hassan J. Eghbali

Scanning mechanisms
From: http://ceos.cnes.fr:8100/cdrom/ceos1/irsd/pages/datacq4.htm & Jensen (2000)
Sensor motion
• Central perspective / digital frame camera area arrays– Multitple CCD arrays
– Silicon (vis/NIR), HgCdTe (SWIR/LWIR)?
– Similar image distortion to film camera• distortion increases radially away from focal
point
Dr. Hassan J. Eghbali

Aside: CCD
• Charge Couple Device
From http://www.na.astro.it/datoz-bin/corsi?l1a
Dr. Hassan J. Eghbali

Aside: CCD
•http://electronics.howstuffworks.com/digital-camera2.htm
•http://www.oceanoptics.com/Products/howccddetectorworks.asp
•Photons arrive (through optics and filters) and generate free electrons CCD elements (few x106 on a CCD)
•More photons == more electrons collected
•Charge coupling: CCD design allows all packets of charged electrons to be moved one row at a time by varying voltage of adjacent rows across CCD - cascade effect
•i.e. Count is done at one point (lower corner)
Dr. Hassan J. Eghbali

Aside: CCD
• Si (Silicon) CCD– vis/NIR up to ~ 1.1m
• InGaAs (Indium Gallium Arsenide)– IR (~0.9 - 1.6 m)
• InSb (Indium Antimonide)– mid-IR ~3.5 - 4m
• HgCdTe (Mercury Cadmium Telluride)– IR (~10 - 12 m)
Dr. Hassan J. Eghbali
Summary• Ground receiving
– transfer data from sensor to ground station (storage v. transmission?)– can be small-scale these days e.g. MSG, MODIS DB etc.
• Pre-processing chain– atmospheric, geometric correction, radiometric correction and calibration
• can obtain raw data (level 0 product), some pre-processing (level 1) or fully processed to reflectance, radiance etc. (level 1b/2/3 etc.)
– then REAL work begins!
• Scanning mechanisms– various depending on application– have pros/cons - usual tradeoff of reliability, spatial res. V SNR and geometric
distortions (see Lillesand, Kiefer, Chipman section 5.9)
Dr. Hassan J. Eghbali