multi-criteria decision analysis tools for prioritising
TRANSCRIPT

Multi-Criteria Decision Analysis Tools for PrioritisingEmerging or Re-Emerging Infectious Diseases Associatedwith Climate Change in CanadaRuth Cox1*, Javier Sanchez1, Crawford W. Revie1
1 Atlantic Veterinary College, University of Prince Edward Island, Charlottetown, Prince Edward Island, Canada
Abstract
Global climate change is known to result in the emergence or re-emergence of some infectious diseases. Reliable methodsto identify the infectious diseases of humans and animals and that are most likely to be influenced by climate are thereforerequired. Since different priorities will affect the decision to address a particular pathogen threat, decision makers need astandardised method of prioritisation. Ranking methods and Multi-Criteria Decision approaches provide such a standardisedmethod and were employed here to design two different pathogen prioritisation tools. The opinion of 64 experts waselicited to assess the importance of 40 criteria that could be used to prioritise emerging infectious diseases of humans andanimals in Canada. A weight was calculated for each criterion according to the expert opinion. Attributes were defined foreach criterion as a transparent and repeatable method of measurement. Two different Multi-Criteria Decision Analysis toolswere tested, both of which used an additive aggregation approach. These were an Excel spreadsheet tool and a tooldeveloped in software ‘M-MACBETH’. The tools were trialed on nine ‘test’ pathogens. Two different methods of criteriaweighting were compared, one using fixed weighting values, the other using probability distributions to account foruncertainty and variation in expert opinion. The ranking of the nine pathogens varied according to the weighting methodthat was used. In both tools, using both weighting methods, the diseases that tended to rank the highest were West Nilevirus, Giardiasis and Chagas, while Coccidioidomycosis tended to rank the lowest. Both tools are a simple and user friendlyapproach to prioritising pathogens according to climate change by including explicit scoring of 40 criteria andincorporating weighting methods based on expert opinion. They provide a dynamic interactive method that can help toidentify pathogens for which a full risk assessment should be pursued.
Citation: Cox R, Sanchez J, Revie CW (2013) Multi-Criteria Decision Analysis Tools for Prioritising Emerging or Re-Emerging Infectious Diseases Associated withClimate Change in Canada. PLoS ONE 8(8): e68338. doi:10.1371/journal.pone.0068338
Editor: D. William Cameron, University of Ottawa, Canada
Received January 10, 2013; Accepted May 28, 2013; Published August 7, 2013
Copyright: � 2013 Cox et al. This is an open-access article distributed under the terms of the Creative Commons Attribution License, which permits unrestricteduse, distribution, and reproduction in any medium, provided the original author and source are credited.
Funding: Funding for this research was provided by the Public Health Agency of Canada (www.publichealth.gc.ca), grant number: 4500217733. The fundersprovided advice about potential study participants. The funders had no role in study design, data collection and analysis, decision to publish, or preparation of themanuscript.
Competing Interests: The authors have declared that no competing interests exist.
* E-mail: [email protected]
Introduction
Global climate change is impacting the incidence and distribu-
tion of infectious diseases [1]. Canada and the arctic regions are
likely to experience greater rates of change than many other
regions of the world due to northern latitude and large landmass
[2,3]. There will likely be warmer temperatures, more rainfall,
more frequent droughts, and extreme weather events such as
hurricanes and tornadoes [4,5]. These changes in climate are
predicted to cause some pathogens to appear in a population
(‘emerge’) or cause an existing pathogen to rapidly increase in
incidence or geographic range (‘re-emerge’) [6].
Decision makers need to identify the diseases that are most likely
to emerge or re-emerge (referred to as ‘emerging’ in the remainder
of this paper) in response to climate change as an aid to focusing
disease prevention and control measures. This kind of decision
making process needs to consider a large number of characteristics
(or criteria) of a pathogen or a disease that account for the features
of the epidemiological triad, namely the agent, the host and the
environment. Objective and transparent methods are therefore
required to address this multi-dimensional problem, so that
intelligence from a number of sources and the influence of
stakeholders with different agendas can be synthesised and so that
future actions can be justified.
Considerable research has been carried out to identify the key
characteristics of potential emerging infectious diseases and
attempts have been made to prioritise these pathogens in terms
of their risk of emergence or impact in some countries [7,8]. In
Canada current methods of prioritising potential disease risks are
often based on subjective ‘horizon scanning activities’, a non-
systematic approach of evaluation, based on personal opinion.
However, recent work by the authors identified a number of
criteria that can be used to prioritise emerging pathogens in the
Canadian context and highlighted that a more standardised
approach is required [9].
The objective of our work is to design and test a standardised
method to prioritise infectious diseases of humans and animals that
may emerge in Canada in response to climate change. To do this
we consider both the likelihood of emergence and the impact of a
disease if the pathogen were to emerge. There are a number of
methods that can be used to standardise decision making, one such
method that we used here is Multi-Criteria Decision Analysis
PLOS ONE | www.plosone.org 1 August 2013 | Volume 8 | Issue 8 | e68338

(MCDA). MCDA was chosen because it provides a systematic way
to integrate information from a range of sources and a structured
method of comparing and ranking alternative decisions [10].
There are a range of MCDA approaches (for review see [10–12]),
and here we tested two alternatives.
The first was a simple approach using an additive aggregation
model [12], and used a spreadsheet as a platform. This approach
has proven useful for priority setting in health policy in the
Netherlands and for assessing food safety and disease risks in
salmon farming in the UK [13,14]. It was chosen because it
allowed us to incorporate a transparent and easily altered scoring
system and to integrate uncertainty in the method of criteria
weighting. The second tool employed an MCDA approach called
‘MACBETH’ (‘Measuring Attractiveness by a Categorical Based
Evaluation Technique’), which also uses an additive aggregation
approach. MACBETH was chosen for its ability to establish
quantitative measurement scales based on qualitative judgements.
That is, it only required the user to describe the difference between
the two pathogens qualitatively (pathogen x is more important
than pathogen y for this criteria). While the MACBETH approach
has been used in decision analysis in other subject areas, for
example in career choice [15], the method has only very recently
been applied to disease prioritisation [16,17]. We chose two
different approaches because the features described above were
not available in a single platform. Both tools aim to standardise the
multi-dimensional, and in some cases, subjective nature of decision
making in an explicit and transparent way. Our purpose was not
to explicitly compare the two methods, but to use them to assess
whether MCDA is a useful approach to this type of problem.
Methods
Ethics statementThe study protocol, including the written consent of all
participants, was approved by the University of Prince Edward
Island Research Ethics Board (REB Reference #6003938).
Development of both decision tools involved the following steps:
N Identification of criteria that can be used to prioritise
pathogens.
N Assignment of attributes to each criterion.
N Expert elicitation to evaluate criteria and criteria attributes
N MCDA tool design.
N Criteria weighting.
N Assignment of values to criteria attributes.
N Calculation of total score for a pathogen.
Identification of criteria that can be used to prioritisepathogens
We identified 40 criteria that might be used to prioritise
potential emerging pathogens in Canada. Criteria were identified
from published literature, discussion with experts from universities
and government agencies, and where possible were informed by
previous disease prioritisation studies [9].
For simplicity, criteria were divided into five groups:
Group A: Disease epidemiology (12 criteria, named A1 to A12).
Groups B: Ability to monitor, treat and control disease (5
criteria, B1 to B5).
Group C: Influence of climate change in Canada (12 criteria,
C1 to C12).
Group D: Burden of disease (8 criteria, D1 to D8).
Group E: Economic and social impact (3 criteria, E1 to E3).
The criteria in groups A, B and C measure the likelihood of
pathogen emergence in Canada, while groups D and E measure
pathogen impact. Our study focuses on the likelihood of pathogen
emergence in response to climate change, however criteria related
to pathogen impact were also included since they are a necessary
part of prioritisation [9].
Assignment of attributes to each criterionIn order to standardise the pathogen prioritisation process
attributes were assigned to each criterion (Figure 1). The attributes
were based on published literature and aimed to be as quantitative
as possible. Attributes for some criteria are self-explanatory; we
therefore only provide explanation where detail about source
information is necessary. Numbers in brackets, e.g. (A1), refer to
the criteria that are being described.
Group A: Disease epidemiology. The current incidence of
human and animal disease (A4 and A5) and the trend of human
and animal disease incidence (A6 and A7) focused on a 5 year time
scale to assess how recent changes might be relevant in disease
emergence. Attributes for (A4) and (A5) were described per
100,000 humans or animals in line with disease incidence
reporting by the Public Health Agency of Canada (PHAC) [18].
The aim of criteria A8 was to establish the number of possible
entry routes of a pathogen to Canada, following [19,20].
Attributes for criterion (A9) were derived from the Koppen
Climate Classification System, which categorizes regions into four
main types (tropical, dry, temperate or continental) based on
annual and monthly averages of temperature and precipitation
[21]. Pathogens that can tolerate a temperate or continental
climate (the climate of the majority of inhabited Canada) were
considered a higher risk for emergence than pathogens that are
endemic to dry or tropical regions. It is possible to select more than
one attribute for this criterion, because pathogens that can tolerate
a range of climates are more of a risk than those that can only
tolerate one type of climate.
The aim of criterion (A10) was to differentiate between
pathogens that are geographically close to Canada and those that
are more distant. The attributes considered both pathogen
endemicity and the potential method of introduction to Canada.
The highest risk pathogens were those with the closest proximity
i.e. those that are endemic to Canada or the USA or that were
reported in these countries in the last 12 months. High risk
methods of pathogen introduction to countries including Canada
have been identified as via human immigration, import of animals
or animal products [20] and via wild bird migration [22,23]. The
countries that were the highest risk for introduction of pathogens
via animal or animal product imports to Canada (USA, China,
Thailand, Italy and New Zealand) were those that exported the
most animal and animal products into Canada between 2004 and
2009 [24]. Countries that were the greatest risk for human
introduction of a pathogen (Mexico, UK, France, Cuba and
Dominican Republic, Germany, Japan and Australia) were those
where most visitors to Canada arrived from or were the most
visited overseas countries in 2009 [25]. The regions where bird
migration was considered the highest risk were Mexico, Central or
South America and the Russian Federation, since bird migration is
generally a north and south movement [26]. The modes of
transmission described in (A11) were identified based on [1] and
following discussion with experts at PHAC.
Group B: Ability to monitor, treat and control
disease. The attributes for (B1) to (B5) were designed following
other prioritisation work [7,8,27] and discussion with medical and
veterinary researchers. The minimum and maximum attributes
represent the best and worst case scenarios, intermediate attributes
Prioritisation of Emerging Diseases
PLOS ONE | www.plosone.org 2 August 2013 | Volume 8 | Issue 8 | e68338
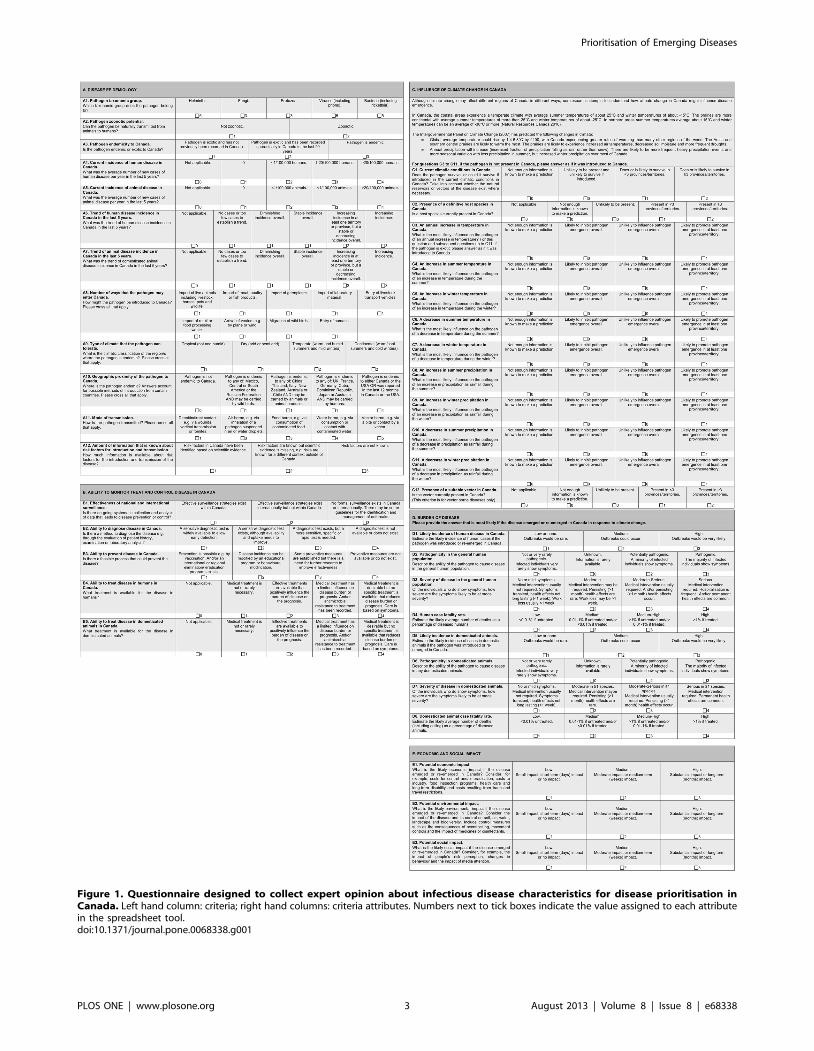
Figure 1. Questionnaire designed to collect expert opinion about infectious disease characteristics for disease prioritisation inCanada. Left hand column: criteria; right hand columns: criteria attributes. Numbers next to tick boxes indicate the value assigned to each attributein the spreadsheet tool.doi:10.1371/journal.pone.0068338.g001
Prioritisation of Emerging Diseases
PLOS ONE | www.plosone.org 3 August 2013 | Volume 8 | Issue 8 | e68338
describe scenarios in which current procedures could be improved.
‘Not applicable’ attributes were provided for criteria B4 and B5,
because if a disease only occurs in the human population, then
treatment in the animal population is not relevant (and vice versa)
and the ‘not applicable’ attribute can be selected.
Group C: Influence of climate change. In Canada
specifically, predictions of temperature and precipitation changes
are well documented, and experts were provided with an estimate
of the magnitude of changes (introductory segment of Section C,
Figure 1). The attributes for criteria (C3) to (C11) quantified
pathogen emergence in simple terms and accounted for both
temporal and/or spatial changes. Although climate change may
affect different regions of Canada in different ways, information
about the variation in climate in different geographical regions of
Canada was captured simplistically by assessing whether a
pathogen might emerge in at least one province or territory.
Group D: Burden of disease. Section D included criteria
about disease incidence (D1 and D5), pathogenicity (D2 and D6),
severity (D3 and D7) and fatality (D4 and D8) in the human and
domesticated animal populations respectively. The domesticated
animal population was specified since estimation of burden in
wildlife populations was beyond the scope of this research. These
criteria referred to the likely impact if a pathogen were to emerge
in Canada. Attributes for criteria were defined by incorporating
aspects of other prioritisation exercises [7,8,27,28]. The case
fatality rate attributes (D4 and D8) were defined both descriptively
(low, medium, high) and quantitatively, e.g. a medium fatality rate
corresponds to a fatality of 0.01 to 1% if untreated, and/or
,0.01% if treated. Percentages were chosen after consulting
annual average fatality rates of a number of diseases, and
reviewing other assessments [29,30].
Group E: Economic, environmental and economic
impact. The attributes for economic, social and environmental
impact were simple (3-tiered), in order to gain a sense of the
potential impact without including detailed definitions. Definitions
were based on previous prioritisation exercises [7,20,31]. Eco-
nomic impact included costs for control, costs to industry and costs
relating to healthcare. Environmental impact related to the impact
of the disease and the impact of its control. Social impact was
included in order to assess how much society cares about the
impact of a disease. These definitions were wide ranging and it was
therefore most appropriate to measure them on a scale from low to
high.
Expert elicitation to evaluate criteria and criteriaattributes
We used expert opinion as an aid to designing the prioritisation
tools. There were two phases to the expert elicitation. In phase one
experts were asked to participate in criteria selection, in phase two
they were asked to evaluate the criteria attributes and definitions.
They were asked to comment on criteria and to suggest alterations
or additional criteria if necessary. Experts were from academic,
government and independent backgrounds and were defined as
individuals whose past or present field contains the subject under
study i.e. infectious disease epidemiology and/or climate change,
following [32,33]. They were identified through literature and
internet searching and via recommendations from other experts as
described by the authors [9].
Phase one: elicitation of expert opinion about
criteria. Phase one has been described in detail in a previous
publication [9]. In summary, experts were presented with the list
of criteria (Figure 1), however the attributes for the criteria were
excluded at that time. For criteria groups A, B and C they were
asked ‘is this criterion likely to influence the probability of an
infectious disease emerging in Canada?’. Participant were asked to
select one answer from: ‘don’t know’, ‘not likely’, quite likely,
‘likely’, ‘very likely’ or ‘extremely likely’. For groups D and E they
were asked ‘how important is this criterion for prioritising
infectious disease in terms of their impact if they did emerge in
Canada?’. One answer could be selected from the attributes: ‘don’t
know’, ‘not important’, ‘quite important’, ‘important’, ‘very
important’ or ‘extremely important’. The phrases were ordered
on a five-tiered Likert scale according to their meaning and
numerical values were not attached. Experts therefore chose a
description relative to the other options on the scale.
We wanted to assess the influence of the climate criteria on
different pathogen types, because some types are more likely to be
influenced by climate than others. We therefore defined four
pathogen types based on their mode of transmission and experts
were asked to indicate the likely influence of the criteria in group C
on each pathogen type: vector-borne, food and water-borne, air-
borne and direct/indirect contact pathogens. The results from
phase one were used to determine which criteria should be
included in a prioritisation tool and also to calculate a weight for
each criterion (see ‘criteria weighting’ below).
The experts were also asked to rate their level of expertise about
14 pathogens (Table 1) as either low (limited background
knowledge), medium (contributed to some work in this area) or
high (e.g. published research or led research projects in this area).
These pathogens had been chosen to test the prioritisation tools
and were selected as representative examples of types of pathogen
or disease (Table 1) according to characteristics such as taxonomic
group, zoonotic potential, mode of transmission (direct/indirect
contact, air-borne, food and water-borne and vector-borne),
endemicity (endemic or exotic), evidence for being influenced by
climate [1], and notifiable status in Canada in 2010 [34,35];
notifiable diseases being those that are of ‘significant importance to
human or animal health or to the Canadian economy’ [35].
Phase two: Elicitation of expert opinion about criteria
attributes. All of the experts who completed criteria weighting
(phase one) were then invited to evaluate the criteria attributes.
For this, they were sent an electronic questionnaire designed in
Microsoft Word 2007 via email. The questionnaire presented the
list of 40 criteria plus the criteria attributes (Figure 1) and experts
were asked to answer the questionnaire for one pathogen about
which they were particularly knowledgeable. This pathogen was
selected by the authors according to the participant’s judgement of
their expertise from phase one. The aim of this phase was to assess
whether the criteria attributes were appropriate, rather than to
collect information about pathogens, and experts were therefore
invited to suggest improvements where necessary.
MCDA tool design and pathogen prioritisationThe structure of each MCDA tool and the pathogen
prioritisation will be described for each tool.
Excel spreadsheet tool for pathogen prioritisationSpreadsheet tool structure. A spreadsheet tool was devel-
oped in Excel (H, Microsoft, Redmond, WA, USA). In summary,
the criteria were listed and the criteria attributes were implement-
ed as predefined drop-down selection boxes (Figure 2). Criteria
were weighted and attributes were assigned values so that
completion of the spreadsheet calculated a score for a pathogen.
Criteria weighting. A weight was calculated for each
criterion using the expert opinion collected during phase one of
the expert elicitation. Two different weighting methods were
tested. For weighting method 1, the definitions of likelihood’
(‘don’t know’, ‘not likely’, ‘quite likely’, ‘likely’, ‘very likely’ or
Prioritisation of Emerging Diseases
PLOS ONE | www.plosone.org 4 August 2013 | Volume 8 | Issue 8 | e68338
‘extremely likely’) were assigned values of 0, 0.1, 0.3, 0.5, 0.7 and
0.9. The same values were assigned to the definitions of
importance (‘don’t know’, ‘not important’, ‘quite important’,
‘important’, ‘very important’, ‘extremely important’). Criteria
weight was calculated as the mean value of all experts. The ‘don’t
know’ responses were included in the calculation because they
indicate the amount of uncertainty of the experts. A detailed
description of weighting using this method can be found in [9].
The experts weighted the influence of the climate criteria for
four different pathogen types (vector-borne, food and water-borne,
air-borne and direct or indirect contact pathogens). Four different
weights were therefore calculated for each climate criteria – one
for each pathogen type.
Weighting method 2 accounted for the variation in expert
opinion. Instead of using a single point estimate, weight was
modelled as a probability distribution. A single random value for
weight was generated from the discrete distribution of likelihood
using the Excel add-on ‘ModelRisk’ (http://www.vosesoftware.
com/). Likelihood definitions (ranging from ‘not likely’ to
‘extremely likely’), were converted to a continuous distribution
between 0.01 and 1. This was done by converting a weight of ‘not
likely’ to a random value of between 0.01 and 0.19, a weight of
‘quite likely’ to a random value between 0.2 and 0.39 etc., in a
manner similar to that adopted in [36]. A total of 10,000 iterations
were used to capture the weight distribution for each criterion.
Assignment of values to criteria attributes. Selecting an
attribute for a criterion from the dropdown menu in the
spreadsheet generated a predefined quantitative value (Figure 1).
For most criteria the attributes could be placed in a naturally
ascending order and assigned a value on a linear scale. For
example, the four attributes for criterion (A4), (Current incidence
of disease in Canada), were: 0, ,1/100,000 humans, 1–20/
100,000 humans, .20/100,000 humans. By placing these in
ascending order, a value of 1, 2, 3 or 4 was assigned to each
attribute respectively; a higher risk therefore generating a higher
value. Some attributes were assigned a value of 0, when the
attribute was ‘not applicable’ or ‘not enough information is known
to make a prediction’ or when there was no perceived risk.
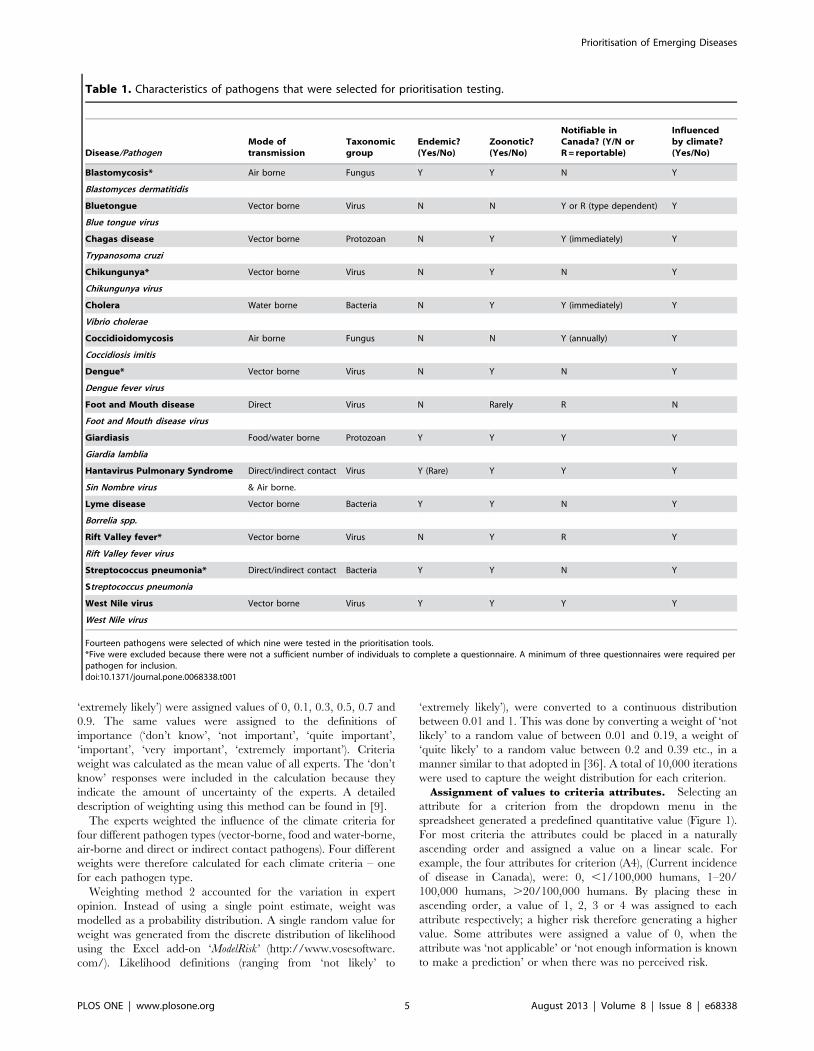
Table 1. Characteristics of pathogens that were selected for prioritisation testing.
Disease/PathogenMode oftransmission
Taxonomicgroup
Endemic?(Yes/No)
Zoonotic?(Yes/No)
Notifiable inCanada? (Y/N orR = reportable)
Influencedby climate?(Yes/No)
Blastomycosis* Air borne Fungus Y Y N Y
Blastomyces dermatitidis
Bluetongue Vector borne Virus N N Y or R (type dependent) Y
Blue tongue virus
Chagas disease Vector borne Protozoan N Y Y (immediately) Y
Trypanosoma cruzi
Chikungunya* Vector borne Virus N Y N Y
Chikungunya virus
Cholera Water borne Bacteria N Y Y (immediately) Y
Vibrio cholerae
Coccidioidomycosis Air borne Fungus N N Y (annually) Y
Coccidiosis imitis
Dengue* Vector borne Virus N Y N Y
Dengue fever virus
Foot and Mouth disease Direct Virus N Rarely R N
Foot and Mouth disease virus
Giardiasis Food/water borne Protozoan Y Y Y Y
Giardia lamblia
Hantavirus Pulmonary Syndrome Direct/indirect contact Virus Y (Rare) Y Y Y
Sin Nombre virus & Air borne.
Lyme disease Vector borne Bacteria Y Y N Y
Borrelia spp.
Rift Valley fever* Vector borne Virus N Y R Y
Rift Valley fever virus
Streptococcus pneumonia* Direct/indirect contact Bacteria Y Y N Y
Streptococcus pneumonia
West Nile virus Vector borne Virus Y Y Y Y
West Nile virus
Fourteen pathogens were selected of which nine were tested in the prioritisation tools.*Five were excluded because there were not a sufficient number of individuals to complete a questionnaire. A minimum of three questionnaires were required perpathogen for inclusion.doi:10.1371/journal.pone.0068338.t001
Prioritisation of Emerging Diseases
PLOS ONE | www.plosone.org 5 August 2013 | Volume 8 | Issue 8 | e68338

There were two criteria where the attributes could not be
ranked intuitively. These criteria were (A1): ‘pathogen taxonomic
group’ and (A11): ‘mode of transmission’. In these cases, expert
opinion was used to rank the attributes and to assign a quantitative
value based on the modal ranking as described in [9]. In summary,
when experts were asked to rank five taxonomic groups according
to how likely they are to be influenced by climate (5 being most
likely and 1 being least likely), the modal ranking was: bacteria (5),
viruses (5), helminths (5), fungi (3) and protozoa (3). Similarly, the
modal ranking of the modes of transmission (A11) was: vector-
borne (5), water-borne (4), food-borne (3), air-borne (3) and direct/
indirect contact (1).
Attribute values were normalised according to the number of
possible attributes i.e. the value was divided by the number of
attributes available (known as ‘absolute normalisation’ [37]). This
was done so that the relative attractiveness of each attribute was
equal following [15].
Calculation of total score for a pathogen. The spreadsheet
tool was trialed on nine different ‘test’ pathogens. Information
about each pathogen was entered into the spreadsheet via the pre-
defined drop-down menus. The answers that experts provided
during phase two of expert elicitation were used to answer each
criterion. If different experts provided different answers for the
same pathogen then the modal answer was selected or if two
answers were equally common then the highest scoring attribute
(worst case scenario) was selected.
The tool calculated the total score for a pathogen as a linear
weighted sum of scores. This approach is a simple and common
method [11,12,38], and is appropriate here because the attribute
values were of similar size and scale for each criterion. Thus the
score for a pathogen:
V aj
� �~Xn
i~1
wivi aj
� �ð1Þ
where V(aj) is the total score for a pathogen j, n is the total number
of criteria, wi is the weight assigned to criterion i, vi(aj) is the
normalised attribute value for criteria i, pathogen j. We also
calculated the linear sum of scores for each group of criteria using
the same weighted sum method. Using weighting method 2, the
score for each criterion was calculated as the mean of 10,000
iterations.
MACBETH tool for pathogen prioritisationMACBETH tool structure. The MACBETH tool was
developed in the software M-MACBETH (version 2.3.0, www.
m-macbeth.com, BANA consulting 2010). The criteria were
organised into the five criteria groups in a ‘value tree’ (Figure 3).
Criteria weighting. Criteria were weighted using weighting
method 1 (described for the spreadsheet tool). Weights of all
criteria were standardised to sum to 100 by dividing each weight
by the sum of all weights and multiplying by 100. Weights ranged
from 0.58 to 1.84.
Assignment of values to criteria attributes. A value was
assigned to each criterion attribute using an M-MACBETH
generated matrix. For example, the attributes for criteria A4, were
placed in order of severity (Figure 4) (.20/100,000 humans, 1–
20/100,000, ,1/100,000, 0, not applicable or unknown) and the
difference between each attribute was defined in the matrix
(Figure 5). In this case the difference between each attribute was
defined as ‘positive’ (meaning that attribute .20/100,000 is more
severe than 1–20/100,000, which is more severe than ,1/
Figure 2. Spreadsheet tool to assess the risk of emergence or re-emergence of infectious diseases associated with climate change.doi:10.1371/journal.pone.0068338.g002
Prioritisation of Emerging Diseases
PLOS ONE | www.plosone.org 6 August 2013 | Volume 8 | Issue 8 | e68338

100,000 and so on). The difference between each attribute was of
the same magnitude. If two attributes were considered to be equal
then the difference was defined as ‘No’ in the matrix.
Once completed, M-MACBETH used this qualitative informa-
tion to assign a value to each attribute on a scale from 0 to 100
(Figure 6). For criteria A4, therefore, the lowest reference attribute
(not applicable) was assigned 0. Since there was no difference
between ‘not applicable’, ‘unknown’ and ‘0 incidence’, these
attributes were all assigned a value of 0. The highest reference
attribute (.20/100,000 individuals) was assigned 100. The
attributes between these reference attributes were then assigned
values on a linear scale with equal distance between each value.
Therefore the second lowest attribute (,1/100,000 individuals)
was assigned a value of 33.33 and the next attribute (1–20/
100,000 individuals) was assigned a value of 66.67. Values were
equally spaced in this case because the differences between each
attribute were deemed to be of the same magnitude.
Calculation of total score for a pathogen. The MAC-
BETH tool was trialed on nine different ‘test’ pathogens.
Information about each pathogen was entered via pre-defined
drop-down menus. M-MACBETH calculated the score for each
criterion using an additive aggregation model. This was the same
fundamental approach as the spreadsheet tool (equation 1),
however there were differences in the way that the weight and
attribute values were calculated. Firstly in M-MACBETH, the
criteria weights were standardised to between 0 and 100.
Secondly, M-MACBETH assigned a value of between 0 and
100 to each attribute relative to the other attributes. It did this by
assessing the difference between each attribute in the attribute
matrix (Figures 5 and 6), (described in ‘assignment of values to
criteria attributes’).
Sensitivity analysisIn order to test the sensitivity of the spreadsheet and
MACBETH approaches, pathogen ranking was repeated using
‘reduced’ versions of each tool, which only included the top 10
weighted criteria and excluded all others. The top ten were
selected because such a model would represent a relatively quick
method to rank pathogens. In addition, to assess the importance of
criteria within each group, ‘intermediate’ tools were built by
excluding half of the criteria in one group at a time. The criteria
that were excluded were those that had the lowest weighting in the
group (6 criteria from group A, 3 from group B, 6 from C, 3 from
D and 2 from E in turn).
Results
Expert responseA total of 64 experts weighted the criteria and detailed
discussion of the expert response is presented in [9]. None of the
criteria were considered irrelevant to the prioritisation and so none
were excluded when the prioritisation tools were built. The five
criteria deemed most likely to influence pathogen emergence or
impact were ‘potential economic impact’ (E3), ‘severity of disease
in the human population’ (D3), ‘human case fatality rate’ (D4),
‘type of climate that the pathogen can tolerate’ (A9) and ‘likely
incidence of human disease in Canada’ (D1) [9].
Of the 64 experts who weighted the criteria, 47 completed
phase two in which they completed a questionnaire about a
specific pathogen (72% response rate). Pathogens were used as
‘test’ pathogens for the prioritisation tools if at least three experts
had completed a questionnaire. Nine pathogens were included as
‘test’ pathogens; five were excluded due to lack of expertise. The
Figure 3. Decision tree structure (showing some of the criteria) developed in the software M-MACBETH. Branches of the decision treewith a light blue branch are criteria, those with a yellow branch are attributes within one criterion.doi:10.1371/journal.pone.0068338.g003
Prioritisation of Emerging Diseases
PLOS ONE | www.plosone.org 7 August 2013 | Volume 8 | Issue 8 | e68338

number of questionnaires completed for the nine ‘test’ pathogen
varied between three and eight. During this phase experts
suggested some minor alterations to the attributes which were
incorporated into the prioritisation tools. These included clarifi-
cation of wording and the addition of a ‘not applicable’ attribute
for some criteria.
Pathogen prioritisation using the spreadsheet approachUsing the spreadsheet tool, the overall ranking of the nine
pathogens was the same for both weighting methods. The diseases
that ranked the highest overall were Giardiasis, Chagas disease
and West Nile virus (Table 2, columns 2 and 4; Figures 7A and B).
Bluetongue, Cholera and Coccidioidomycosis ranked the lowest.
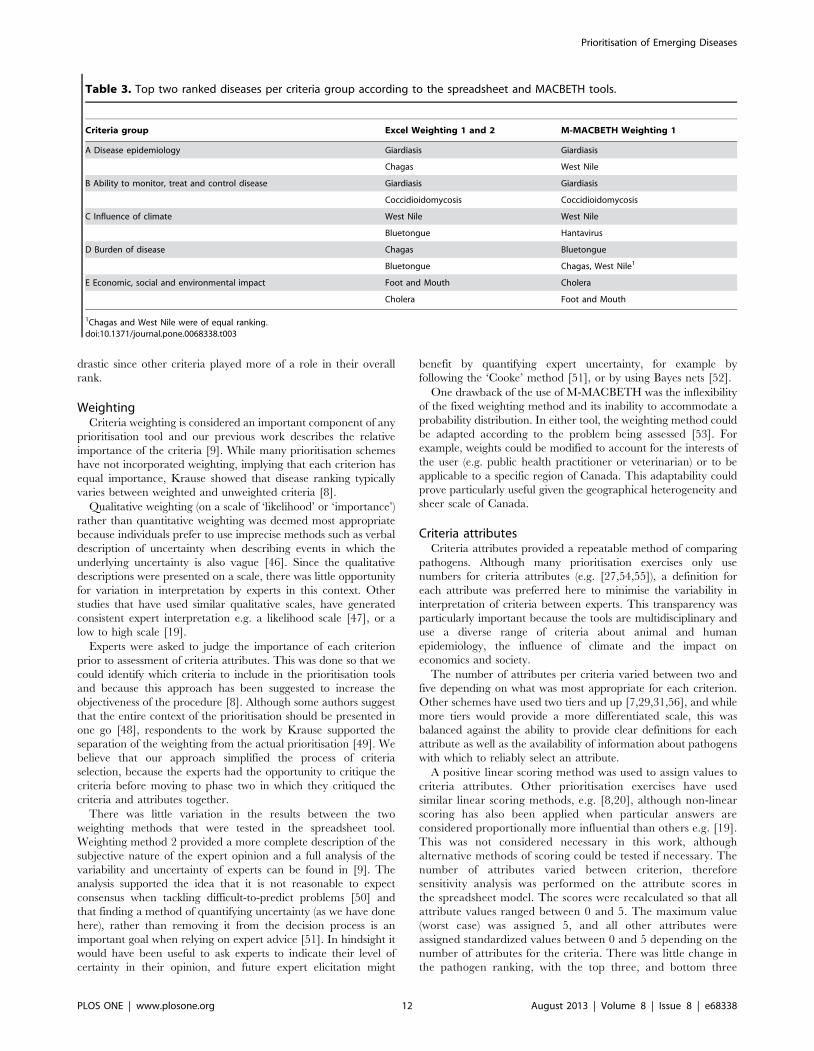
Within criteria groups, the highest ranking pathogens were similar
irrespective of weighting method (Table 3, column 2). Between
criteria groups, there was a difference in the high ranking diseases,
for example Giardiasis and Chagas disease ranked highly
according to disease epidemiology criteria, while West Nile virus
and Bluetongue ranked highly according to the influence of
climate.
Using a probability distribution to weight criteria accounted for
variation in expert opinion and also highlighted the expert’s
uncertainty for some pathogens. For example, there was more
uncertainty about Foot and Mouth disease than there was about
West Nile virus illustrated by the steeper slope of the cumulative
probability for West Nile virus (Figure 7B). This method also
highlighted uncertainty within groups of criteria (Figure 8A–E).
For example, there was more uncertainty about the influence of
Figure 4. Properties of criteria A4: ‘‘Current incidence of human disease in Canada’’, showing the 6 different attributes. Lower (blue)and upper (green) act as the scale’s arbitrary values of 0 and 100 respectively.doi:10.1371/journal.pone.0068338.g004
Figure 5. Matrix of attributes for criterion A4 indicating the difference between each attribute. The difference in value of two attributesis either ‘positive’ (i.e. one is greater than the other e.g. .20 is greater than 1–20) or where there is ‘no’ difference in value between two attributes. Inthis case there is no difference between answers of ‘0’, ‘not applicable’ or ‘unknown’.doi:10.1371/journal.pone.0068338.g005
Prioritisation of Emerging Diseases
PLOS ONE | www.plosone.org 8 August 2013 | Volume 8 | Issue 8 | e68338

climate on Giardiasis than on Chagas disease as illustrated by the
steeper cumulative probability of Chagas disease (Figure 8C).
‘Reduced’ and ‘Intermediate’ spreadsheet tool resultsWhen the prioritisation was repeated using the ‘reduced’ tool
containing ten criteria, there were only small changes in the
ranking of pathogens using either weighting method (Table 2,
columns 3 and 5 respectively). When the ‘intermediate’ tools were
built by excluding half of the criteria with the lowest weightings in
one group at a time, there was some change in pathogen ranking,
however in all tools the top three pathogens remained in the top
three rankings, while the two lowest ranking pathogens remained
in the lowest ranks.
MACBETH pathogen rankingWest Nile virus ranked the highest of all the diseases and
Coccidioidomycosis ranked the lowest overall (Table 2, column 6).
Different diseases ranked highly within different criteria groups
(Table 3, column 3). For example Giardiasis and West Nile virus
ranked highly in disease epidemiology. Giardiasis and Coccidioi-
domycosis were considered the diseases that were the most difficult
to monitor, treat and control. Diseases most likely to be influenced
by climate were West Nile virus and Hantavirus (Table 3 and
Figure 9). Diseases deemed to have the greatest impact on the
human and animal population were Chagas disease, West Nile
virus and Bluetongue. Cholera and Foot and Mouth disease
ranked most highly according to economic, environmental and
social impact.
Pair-wise comparison of diseases could be conducted in the
MACBETH tool via difference profiles. For example, the difference
profile of Lyme disease compared to Chagas disease (Figure 10)
highlighted that Lyme disease and Chagas disease tended to be
similar in their response to climate (for seven of the twelve climate
criteria), while Chagas disease was likely to have a higher economic,
social and environmental impact than Lyme disease.
‘Reduced’ and ‘Intermediate’ MACBETH tool resultsWhen the prioritisation was repeated using the ‘reduced’ tool
that contained the ten most highly weighted criteria, West Nile
virus ranked highest and Coccidioidomycosis lowest, as in the
complete model (Table 2, column 7). Pathogens that changed rank
the most were Cholera which increased in rank to second place,
while Giardiasis decreased from second to sixth place.
When the ‘intermediate’ models were built (excluding half of the
criteria with the lowest weightings in one group at a time), results
were similar to the spreadsheet ‘intermediate’ tools in which there
were small changes in pathogen ranking and in all cases the top
three pathogens remained in the top three rankings, while the two
lowest ranking pathogens remained in the lowest ranks.
Comparison of the results of the spreadsheet andMACBETH tool
The spreadsheet and the MACBETH tool produced compara-
ble results overall (Table 2). In both tools, the high ranking diseases
tended to be Giardiasis, Chagas disease and West Nile virus, while
Figure 6. M-MACBETH derived scores as they were allocated to criterion attributes in the matrix.doi:10.1371/journal.pone.0068338.g006
Prioritisation of Emerging Diseases
PLOS ONE | www.plosone.org 9 August 2013 | Volume 8 | Issue 8 | e68338
Coccidioidomycosis and Cholera ranked lowest. The only disease
that was notably different was Foot and Mouth disease which
ranked consistently higher in the spreadsheet tool than in the
MACBETH tool. Within criteria groups (Table 3), the only
notable difference was in the top ranking diseases within ‘disease
epidemiology’. Here Giardiasis ranked highly in both tools, but
Chagas disease which ranked second in the spreadsheet tool
ranked only sixth in the MACBETH tool.
Discussion
Score and rankingTwo different tools were used to rank pathogens based on a
total of 40 different criteria. The high ranking diseases (Giardiasis,
West Nile virus and Chagas disease) tended to be the same across
all tools and weighting methods. Division of criteria into groups
proved valuable for determining why pathogens ranked in a
particular order. This was especially useful given that our focus
was on pathogens that might emerge in response to climate
change.
Giardiasis and West Nile virus scored highly for disease
epidemiology because they are endemic to Canada (a high risk
for re-emergence in these tools), because their current incidence is
relatively high in Canada and because they tolerate a variety of
climates. Giardiasis and Chagas disease also scored highly because
they can be transmitted in a number of ways (direct or indirect
contact, food-borne and water-borne; direct or indirect contact,
food-borne and vector-borne respectively). The high rank of
Chagas disease was also due to the high number of potential routes
of introduction to Canada.
Giardiasis and Coccidioidomycosis ranked particularly highly in
criteria group B indicating that their surveillance, treatment and
control were considered less effective than for most of the other
diseases. Conversely the surveillance and diagnosis of the low
ranking diseases such as Bluetongue and Foot and Mouth disease
were considered relatively effective.
As expected, the diseases that were deemed most influenced by
the climate criteria alone were the vector-borne diseases West Nile
virus and Bluetongue. These diseases ranked highly due to their
modes of transmission and because their emergence was likely to
be promoted by increases in summer and winter temperatures and
precipitation. The only criteria that were thought to inhibit
emergence or where not enough information was available to
make a prediction were decreases in summer and winter
temperature or precipitation. Not surprisingly our results are
in accord with the scientific evidence about the influence of
climate on West Nile virus and Bluetongue and whose
emergence in the US and Europe respectively has been
attributed to the spread of the vector species [39,40]. Other
diseases that also ranked relatively highly for this criteria group
included Chagas disease, because the experts thought that
emergence would be promoted by increases in temperature and
in precipitation, although it is unlikely that the vector is present
in Canada. While the relatively high ranking of Chagas was
somewhat surprising, literature searches revealed that Chagas
disease has recently become of concern for emergence in the US
and Canada [41,42] and that a higher risk is associated with
increasing temperatures [41].
Diseases that were deemed least influenced by climate were
Foot and Mouth disease, Coccidioidomycosis and Cholera. Foot
and Mouth disease was included as a ‘test’ disease because, as a
virus that is spread via direct contact, it is unlikely to be
influenced by climate and our experts concurred. Coccidioido-
mycosis, an air-borne fungus, was considered unlikely to be
influenced by climate or inhibited by most of the climatic
changes. Cholera also generated a low score in this section,
although the notable level of uncertainty shown by the experts
for at least eight of the criteria undoubtedly contributed to its
low rank. This uncertainty reflects the lack of knowledge about
the direct influence of climate on Cholera [43]. Although the
indirect effects of climate on the emergence of Cholera [44], as
well as other diseases [45] have been documented, we did not
attempt to capture information about the indirect effects of
climate change (e.g. land use, wildlife migration), nor the effects
of ‘extreme’ events (e.g. flooding) on disease emergence due to
their unpredictability.
Chagas disease, Cholera and West Nile virus ranked the
highest for burden of disease because they are pathogenic, cause
severe symptoms and high fatality in humans and/or animals.
Those with a substantial economic, environmental and social
impact if they were to emerge were Foot and Mouth disease and
Cholera. In comparison, a disease such as Hantavirus was
considered to have a low or medium impact even though it is
serious in severity and has a high fatality rate. Its low economic,
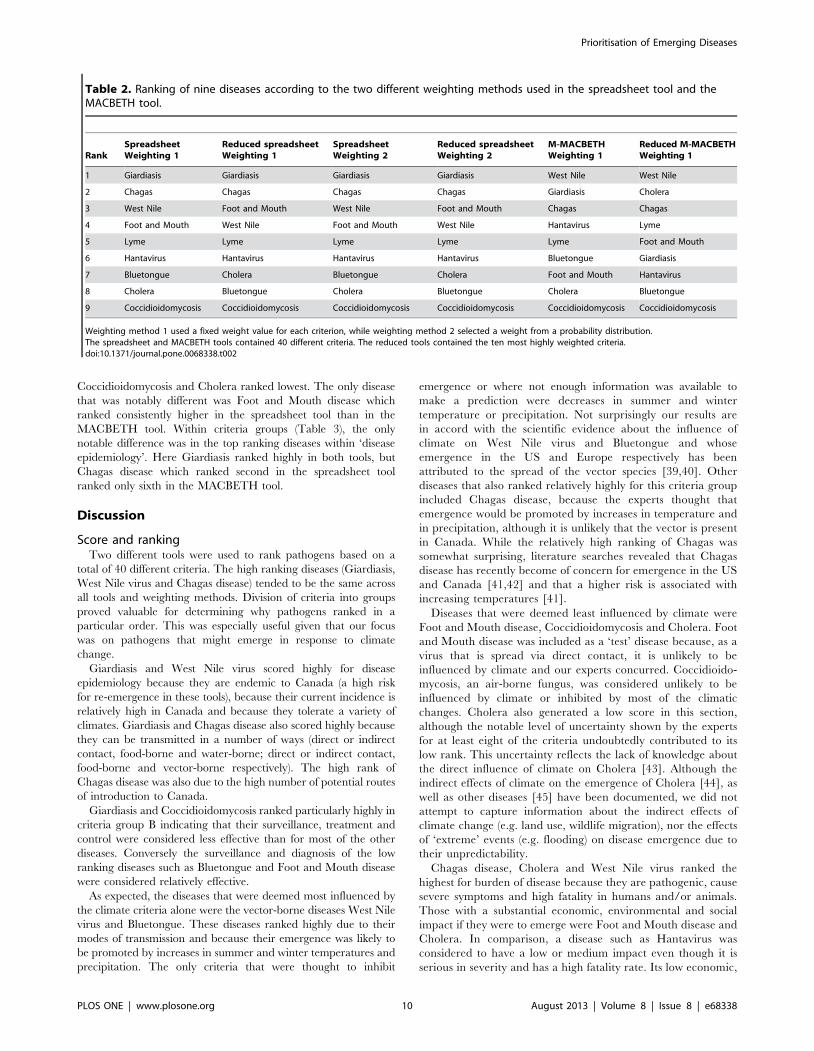
Table 2. Ranking of nine diseases according to the two different weighting methods used in the spreadsheet tool and theMACBETH tool.
RankSpreadsheetWeighting 1
Reduced spreadsheetWeighting 1
SpreadsheetWeighting 2
Reduced spreadsheetWeighting 2
M-MACBETHWeighting 1
Reduced M-MACBETHWeighting 1
1 Giardiasis Giardiasis Giardiasis Giardiasis West Nile West Nile
2 Chagas Chagas Chagas Chagas Giardiasis Cholera
3 West Nile Foot and Mouth West Nile Foot and Mouth Chagas Chagas
4 Foot and Mouth West Nile Foot and Mouth West Nile Hantavirus Lyme
5 Lyme Lyme Lyme Lyme Lyme Foot and Mouth
6 Hantavirus Hantavirus Hantavirus Hantavirus Bluetongue Giardiasis
7 Bluetongue Cholera Bluetongue Cholera Foot and Mouth Hantavirus
8 Cholera Bluetongue Cholera Bluetongue Cholera Bluetongue
9 Coccidioidomycosis Coccidioidomycosis Coccidioidomycosis Coccidioidomycosis Coccidioidomycosis Coccidioidomycosis
Weighting method 1 used a fixed weight value for each criterion, while weighting method 2 selected a weight from a probability distribution.The spreadsheet and MACBETH tools contained 40 different criteria. The reduced tools contained the ten most highly weighted criteria.doi:10.1371/journal.pone.0068338.t002
Prioritisation of Emerging Diseases
PLOS ONE | www.plosone.org 10 August 2013 | Volume 8 | Issue 8 | e68338

low environmental and moderate social impact likely reflects
that it does not spread between humans (it is spread to humans
by rodents) and would therefore affect a small number of
individuals in the population compared to a human to human
transmissible disease.
There were only small changes in the ranking of diseases
between the spreadsheet and MACBETH tools. The most notable
difference was the drop in rank of Foot and Mouth disease overall,
and the drop in rank of Chagas disease within the ‘disease
epidemiology’ group. We attribute these differences to the
weighting method, since the weights in M-MACBETH were
required to be standardised to sum to 100. This resulted in less
distinction between criteria. The other difference was in the
method of assigning values to criteria attributes, with M-
MACBETH assigning values of 0 and 100. In the case of Foot
and Mouth disease, the overall score was mainly due to its disease
epidemiology (group A) and its economic, social and environmen-
tal impact (group E). Group A contains the greatest number of
criteria, and group E contains the most highly weighted criteria.
Since weighting in M-MACBETH tended to be more evenly
spread than in the spreadsheet tool we attributed the drop in rank
to this ‘equalizing’ of weights, which had most influence on group
A and group E. In the case of Chagas disease, the drop in rank
within group A may also be attributed to the ‘equalizing’ of
weights. Within group A, Chagas gained high scores for the
highest weighted criteria and low scores for the lowest weighted
criteria. A degree of ‘equalizing’ of the weights resulted in the
observed drop in rank. Changes to other pathogens were less
Figure 7. Disease ranking calculated in the spreadsheet tool for nine diseases. A: Criteria were weighted using a fixed mean value based onexpert opinion (weighting method 1). The maximum score possible for any disease was 23.7. B: Criteria were weighted using a probability distributionrepresenting the range of expert opinion (weighting method 2). Cumulative probability distribution shows the total score over 10,000 iterations for eachdisease. The maximum score of a disease was a mean of 23.5 (standard deviation 62.37, 95th percentile = 27.2 after 10,000 iterations).doi:10.1371/journal.pone.0068338.g007
Prioritisation of Emerging Diseases
PLOS ONE | www.plosone.org 11 August 2013 | Volume 8 | Issue 8 | e68338
drastic since other criteria played more of a role in their overall
rank.
WeightingCriteria weighting is considered an important component of any
prioritisation tool and our previous work describes the relative
importance of the criteria [9]. While many prioritisation schemes
have not incorporated weighting, implying that each criterion has
equal importance, Krause showed that disease ranking typically
varies between weighted and unweighted criteria [8].
Qualitative weighting (on a scale of ‘likelihood’ or ‘importance’)
rather than quantitative weighting was deemed most appropriate
because individuals prefer to use imprecise methods such as verbal
description of uncertainty when describing events in which the
underlying uncertainty is also vague [46]. Since the qualitative
descriptions were presented on a scale, there was little opportunity
for variation in interpretation by experts in this context. Other
studies that have used similar qualitative scales, have generated
consistent expert interpretation e.g. a likelihood scale [47], or a
low to high scale [19].
Experts were asked to judge the importance of each criterion
prior to assessment of criteria attributes. This was done so that we
could identify which criteria to include in the prioritisation tools
and because this approach has been suggested to increase the
objectiveness of the procedure [8]. Although some authors suggest
that the entire context of the prioritisation should be presented in
one go [48], respondents to the work by Krause supported the
separation of the weighting from the actual prioritisation [49]. We
believe that our approach simplified the process of criteria
selection, because the experts had the opportunity to critique the
criteria before moving to phase two in which they critiqued the
criteria and attributes together.
There was little variation in the results between the two
weighting methods that were tested in the spreadsheet tool.
Weighting method 2 provided a more complete description of the
subjective nature of the expert opinion and a full analysis of the
variability and uncertainty of experts can be found in [9]. The
analysis supported the idea that it is not reasonable to expect
consensus when tackling difficult-to-predict problems [50] and
that finding a method of quantifying uncertainty (as we have done
here), rather than removing it from the decision process is an
important goal when relying on expert advice [51]. In hindsight it
would have been useful to ask experts to indicate their level of
certainty in their opinion, and future expert elicitation might
benefit by quantifying expert uncertainty, for example by
following the ‘Cooke’ method [51], or by using Bayes nets [52].
One drawback of the use of M-MACBETH was the inflexibility
of the fixed weighting method and its inability to accommodate a
probability distribution. In either tool, the weighting method could
be adapted according to the problem being assessed [53]. For
example, weights could be modified to account for the interests of
the user (e.g. public health practitioner or veterinarian) or to be
applicable to a specific region of Canada. This adaptability could
prove particularly useful given the geographical heterogeneity and
sheer scale of Canada.
Criteria attributesCriteria attributes provided a repeatable method of comparing
pathogens. Although many prioritisation exercises only use
numbers for criteria attributes (e.g. [27,54,55]), a definition for
each attribute was preferred here to minimise the variability in
interpretation of criteria between experts. This transparency was
particularly important because the tools are multidisciplinary and
use a diverse range of criteria about animal and human
epidemiology, the influence of climate and the impact on
economics and society.
The number of attributes per criteria varied between two and
five depending on what was most appropriate for each criterion.
Other schemes have used two tiers and up [7,29,31,56], and while
more tiers would provide a more differentiated scale, this was
balanced against the ability to provide clear definitions for each
attribute as well as the availability of information about pathogens
with which to reliably select an attribute.
A positive linear scoring method was used to assign values to
criteria attributes. Other prioritisation exercises have used
similar linear scoring methods, e.g. [8,20], although non-linear
scoring has also been applied when particular answers are
considered proportionally more influential than others e.g. [19].
This was not considered necessary in this work, although
alternative methods of scoring could be tested if necessary. The
number of attributes varied between criterion, therefore
sensitivity analysis was performed on the attribute scores in
the spreadsheet model. The scores were recalculated so that all
attribute values ranged between 0 and 5. The maximum value
(worst case) was assigned 5, and all other attributes were
assigned standardized values between 0 and 5 depending on the
number of attributes for the criteria. There was little change in
the pathogen ranking, with the top three, and bottom three
Table 3. Top two ranked diseases per criteria group according to the spreadsheet and MACBETH tools.
Criteria group Excel Weighting 1 and 2 M-MACBETH Weighting 1
A Disease epidemiology Giardiasis Giardiasis
Chagas West Nile
B Ability to monitor, treat and control disease Giardiasis Giardiasis
Coccidioidomycosis Coccidioidomycosis
C Influence of climate West Nile West Nile
Bluetongue Hantavirus
D Burden of disease Chagas Bluetongue
Bluetongue Chagas, West Nile1
E Economic, social and environmental impact Foot and Mouth Cholera
Cholera Foot and Mouth
1Chagas and West Nile were of equal ranking.doi:10.1371/journal.pone.0068338.t003
Prioritisation of Emerging Diseases
PLOS ONE | www.plosone.org 12 August 2013 | Volume 8 | Issue 8 | e68338

pathogens remaining in those positions, for the overall score, for
both weighting method 1 and 2.
There were two criteria where a linear scale was not appropriate
because the attributes could not be placed into a natural ascending
order (pathogen taxonomic group and mode of transmission) and
in these cases the experts’ modal rank was considered the most
appropriate value. An alternative method to account for the
apparent bimodal opinion of experts might be to use negative
values. This method has been demonstrated in a prioritisation
scheme for infectious diseases in Germany, where values of either
21, 0 or 1 are allocated to each criterion (low importance, lack of
knowledge or opinion and high importance respectively) [29]. One
other important point to note about our scoring system is that
some attributes generated a value of zero, in particular when the
attribute was ‘not applicable’ (e.g. attribute 1 of criteria B4 and B5)
or when the attribute was not a perceived risk (e.g. attribute 1 of
criteria A4 and A5). The first three attributes for criteria C3 to
C12 were assigned 0 because all of them (lack of information
(attribute 1), inhibition of pathogen emergence (attribute 2) or no
influence on pathogen emergence (attribute 3)) were deemed low
risk for this study. This meant that the score of a pathogen would
only increase if it is influenced by climate, while at the same time
documenting that an attribute had been assessed even if it
generated a score of 0. Finally, ‘unknown’ attributes also generated
Figure 8. Disease ranking by criteria grouping calculated in the spreadsheet tool for nine diseases. Criteria were weighted using aprobability distribution representative of expert opinion. Cumulative probability distribution shows the score for each disease during 10,000iterations. Legends show pathogen ranking.doi:10.1371/journal.pone.0068338.g008
Prioritisation of Emerging Diseases
PLOS ONE | www.plosone.org 13 August 2013 | Volume 8 | Issue 8 | e68338

a value of 0 (e.g. attribute 1 of criteria A6), however if a decision
maker preferred to highlight pathogens about which little is
known, then a value of 0 could be replaced with a higher value.
Reliability and improvementThe prioritisation tools proved to be a standardised method to
collate information about a pathogen or disease and previous
work has shown that MCDA can allow a more complete
understanding of the consequences associated with choices [15].
The tools will of course be limited by the reliability and
availability of information about pathogens. It is therefore
important not only to consider the final outcome, but to
consider the process embodied within the tools. A benchmark
against which to compare the model results is not possible since
there is no absolute measure of potential disease emergence.
However, results have been compared to current literature and
have been presented to stakeholders and interested parties for
discussion and feedback. Suggestions from stakeholders and
from the expert group were incorporated during tool design.
One suggestion from experts and from literature [57] was to
prioritise likelihood of emergence and impact in two separate
assessments. However our prioritisation assessed both because
similar studies have demonstrated the importance of assessing
impact at the same time as risk [7,20,31], because discussion with
the authors of these publications stressed the need for them to be
included, because economic and social impact have a considerable
influence on policy making [58] and because the impact criteria
were amongst the most highly weighted by the experts. If a user
required a prioritisation based on only a sub-set of the criteria,
then they could adopt the relevant criteria for the process.
Figure 9. Total score compared to the ‘influence of climate’ score for each of nine diseases in the MACBETH tool. West Nile virus wasthe highest ranking disease overall and the disease most likely to be influenced by climate.doi:10.1371/journal.pone.0068338.g009
Figure 10. Difference profile of Lyme disease compared to Chagas disease. Bars indicate the difference in the score of two diseases for eachcriterion. A score of 0 (i.e. no bar) indicates that the two diseases scored the same. A green bar indicates that Lyme scored higher than Chagas, whileorange bars indicate that Chagas scored higher than Lyme.doi:10.1371/journal.pone.0068338.g010
Prioritisation of Emerging Diseases
PLOS ONE | www.plosone.org 14 August 2013 | Volume 8 | Issue 8 | e68338

Sensitivity analysisThe ‘reduced’ spreadsheet and MACBETH tools included only
10 criteria that focused on current climatic conditions, mode of
transmission, severity and fatality in the human population and
excluded many criteria related to climate and treatment or
control. The ranking of diseases in the spreadsheet tool did not
vary noticeably from the full model, suggesting that these criteria
played an influential role in the full model.
In comparison, the pathogen ranking did change in the
MACBETH tool. We attribute the differences to the method of
weighting and scoring. In the ‘reduced’ MACBETH tool it was
necessary to standardise the weights of the ten criteria so that they
summed to 100. As a result there was more differentiation between
criteria weights than in the full model. Cholera increased in rank
from eighth to second because the tool focused on transmission
and impact on the human population – the highest risk criteria for
this disease. These criteria were assigned a relatively high weight in
the ‘reduced’ model. Giardiasis and Hantavirus dropped in rank.
In the tool containing all criteria, the ranking of these diseases
resulted mostly from their disease epidemiology and inability to
monitor, treat and control. These criteria were given a relatively
low weight or were excluded altogether in this ‘reduced’ tool.
When only a small number of low ranking criteria were
excluded in the ‘intermediate’ spreadsheet and MACBETH tools
(the lowest ranking criteria were excluded from each criteria group
in turn) there was little change in the overall ranking of pathogens.
These results, as well as results from the ‘reduced’ models suggest
that it might be possible to build a robust tool with fewer criteria
than are currently included. While such a tool would be
advantageous for a rapid pathogen prioritisation, the criteria
would need to be selected carefully to incorporate characteristics
of concern, while acknowledging those that had been excluded.
Further work to assess a broader set of pathogens would be a
logical next step. In the UK work is on-going to develop the
‘ENHanCEd Infectious Diseases’ (EID2) database [59], (a database
detailing all pathogens that are known to infect humans), which, in
the future, might be used to generate the raw data for an extensive
prioritisation. As well as pathogen ranking, the resulting pathogen
scores could be translated into practical recommendations; e.g. a
low score indicating pathogens of minimal concern, with higher
scores above a certain threshold indicating evaluation is needed,
more data is required or a risk assessment is recommended. This
approach has been employed in other risk evaluations [31,57].
Comparison of Excel and M-MACBETH platforms todevelop an MCDA tool
M-MACBETH was selected for its ability to establish
quantitative measurement scales based on qualitative judge-
ment. However, we found that we were able to assign our own
quantitative values for criteria weights and criteria attributes
based on literature and expert input. It was therefore not
necessary to use these capabilities to their full extent and we do
not include further details about matrix building; details of the
mathematical foundations of MACBETH can be found
elsewhere [15,60].
One advantage of M-MACBETH is that it offers a variety of
visually attractive ways to compare pathogens (e.g. XY maps
and difference profiles). The M-MACBETH program, however,
incurs a cost and may require user training. Excel, in
comparison, is a widely-used program, and although the
criteria, weighting and scoring are predefined, they may be
altered easily as necessary. Modifications could be made for
example, to focus on particular types of pathogens or could be
applied to scenarios in other regions of the world. Further
development of the Excel tool through the use of custom code
could incorporate some of the features of M-MACBETH, for
example, the ability to graphically compare the ranking of
multiple pathogens.
Conclusion
The tools developed here provided a user friendly approach
to aid pathogen prioritisation. In particular they were useful for
synthesising information about a large number of criteria, they
helped provide structure for prioritisation exercises, and they
acted as a record of decision making. They can be used to
provide a rapid and simple assessment of pathogens by a user
who does not require expert knowledge of each pathogen and
they can be used to highlight gaps in knowledge. The tools are
a novel method of prioritising infectious pathogens according
to their probability of emergence in response to climate
change. They can incorporate both expert opinion and
empirical data into a pathogen ranking system and can be
used to identify pathogens that should be investigated more
fully.
Acknowledgments
The authors would like to acknowledge the discussion and advice offered
by Matthew Baylis, Alex Demarsh, Gerard Krause, Marie McIntyre, Nick
Ogden, Nick Previsich, Helen Roberts and the manuscript referees.
Author Contributions
Conceived and designed the experiments: RC JS CWR. Performed the
experiments: RC JS CWR. Analyzed the data: RC JS CWR. Contributed
reagents/materials/analysis tools: RC JS CWR. Wrote the paper: RC JS
CWR.
References
1. Greer A, Ng V, Fisman D (2008) Climate change and infectious diseases in
North America: the road ahead. CMAJ 178: 715–722. 10.1503/cmaj.081325.
2. Lemmen D, Warren F (2007) Cl imate change impacts and
adaptation: a Canadian perspective. Ottawa: Climate Change Impacts and
Adaptation Directorate, Natural Resources Canada. 201 p.
3. Furgal C, Seguin J (2006) Climate change, health, and vulnerability in Canadian
northern Aboriginal communities. Environ Health Perspect 114: 1964–1970.
4. Oreskes N (2004) The scientific consensus on climate change. Science 306:
1686–1687.
5. Intergovernmental Panel on Climate Change (2007) Climate change 2007:
impacts, adaptation and vulnerability. Contribution of Working Group II to the
fourth assessment report of the Intergovernmental Panel on Climate Change.
Cambridge: Cambridge University Press. 976 p.
6. Morse SS (1995) Factors in the emergence of infectious diseases. Emerg Infect
Dis 1: 7–15.
7. Department for Environment, Food and Rural Affairs (2010) Documentation for
the D2R2 database (Disease briefing, Decision support, Risk analysis and
Ranking database), used for allocation of government resources to deal with
animal related threats. London: Department for Environment, Food and Rural
Affairs. 8 p.
8. Krause G, Working Group on Prioritisation at the Robert Koch Institute (2008)
Prioritisation of infectious diseases in public health-call for comments. Euro
Surveill 13: 18996.
9. Cox R, Revie CW, Sanchez JS (2012) The use of expert opinion to assess the risk
of emergence or re-emergence of infectious diseases in Canada associated with
climate change. PloS One 7: e41590.
10. Linkov I, Satterstrom FK, Kiker G, Batchelor C, Bridges T, et al. (2006) From
comparative risk assessment to multi-criteria decision analysis and adaptive
management: recent developments and applications. Environ Int 32: 1072–
1093. 10.1016/j.envint.2006.06.013.
11. Huang IB, Keisler J, Linkov I (2011) Multi-criteria decision analysis in
environmental sciences: ten years of applications and trends. Sci Total Environ
409: 3578–3594. 10.1016/j.scitotenv.2011.06.022.
Prioritisation of Emerging Diseases
PLOS ONE | www.plosone.org 15 August 2013 | Volume 8 | Issue 8 | e68338

12. Belton V, Stewart TJ (2002) Multiple criteria decision analysis: An integrated
approach. Massachussets: Kluwer Academic Publishers. 381 p.13. Bots PWG, Hulshof JAM (2000) Designing multi-criteria analysis processes for
priority setting in health policy. J Multi-Crit Decis Anal 9: 56–75.
14. Soon JM, Davies WP, Chadd SA, Baines RN (2012) A Delphi-based approachto developing and validating a farm food safety risk assessment tool by experts.
Expert Syst Appl 39: 8325–8336.15. Bana e Costa CA, Chagas MP (2004) A career choice problem: an example of
how to use Macbeth to build a quantitative value model based on qualitative
value judgements. Eur J Oper Res 153: 323–331.16. Del Rio Vilas VJ, Voller F, Montibeller G, Franco LA, Sribhashyam S, et al.
(2013) An integrated process and management tool for ranking multipleemerging threats to animal health. Prev Vet Med 108: 94–102. 10.1016/
j.prevetmed.2012.08.007.17. Brosig J, Traulsen I, Krieter J (2012) Multi-Criteria evaluation of classical swine
fever control strategies using Choquet integral. In: Brosig J. Alternative classical
swine fever control strategies - a simulation study. PhD Thesis. Keil: Institute ofAnimal Breeding and Husbandry, Christian Albrechts University. pp. 1–97.
18. Public Health Agency of Canada (2010) Notifiable diseases on line: incidence bynotifiable disease. Available: http://dsol-smed.phac-aspc.gc.ca/dsol-smed/ndis/
c_dis-eng.php. Accessed 2010 Aug.
19. Gale P, Brouwer A, Ramnial V, Kelly L, Kosmider R, et al. (2010) Assessing theimpact of climate change on vector-borne viruses in the EU through the
elicitation of expert opinion. Epidemiol Infect 138: 214–225. 10.1017/S0950268809990367.
20. Roberts H (2010) Effects of climate change on animal health and welfare in theUK. Zoonoses and Climate Change Conference. University of Liverpool, UK, 1
July 2010.
21. Peel MC, Finlayson BL, McMahon TA (2007) Updated world map of theKoppen-Geiger climate classification. Hydrol Earth Syst Sci 11: 1633–1644.
22. Ogden NH, Lindsay LR, Hanincova K, Barker IK, Bigras-Poulin M, et al.(2008) Role of migratory birds in introduction and range expansion of Ixodes
scapularis ticks and of Borrelia burgdorferi and Anaplasma phagocytophilum in Canada.
Appl Environ Microbiol 74: 1780–1790. 10.1128/AEM.01982-07.23. Hubalek Z (2004) An annotated checklist of pathogenic microorganisms
associated with migratory birds. J Wildl Dis 40: 639–659.24. Industry Canada (2010) Trade data online. Available: http://www.ic.gc.ca/eic/
site/tdo-dcd.nsf/eng/Home. Accessed 2010 Aug.25. Statistics Canada (2009) Travel and tourism. In: Canada Yearbook 2009.
Ottawa, Ontario: Minister of Industry, Statistics Canada. pp. 385–394.
26. Birdnature (2010) North American migration flyways. Available: http://www.birdnature.com/flyways.html. Accessed 2010 Jun.
27. Doherty JA (2000) Establishing priorities for national communicable diseasesurveillance. Can J Infect Dis 11: 21–24.
28. Murray CJ (1994) Quantifying the burden of disease: the technical basis for
disability-adjusted life years. Bull World Health Organ 72: 429–445.29. Krause G, Working Group on Prioritization at Robert Koch Institute (2008)
How can infectious diseases be prioritized in public health? A standardizedprioritization scheme for discussion. EMBO Rep 9 Suppl 1: S22–7. 10.1038/
embor.2008.76.30. World Health Organisation (2006) Setting priorities in communicable disease
surveillance. Available: http://www.who.int/csr/resources/publications/
surveillance/WHO_CDS_EPR_LYO_2006_3.pdf. Accessed 2010 Jun.31. Morgan D, Kirkbride H, Hewitt K, Said B, Walsh AL (2009) Assessing the risk
from emerging infections. Epidemiol Infect 137: 1521–1530. 10.1017/S0950268809990227.
32. Van der Fels-Klerx HJ, Cooke RM, Nauta MN, Goossens LH, Havelaar AH
(2005) A structured expert judgement study for a model of Campylobactertransmission during broiler chicken processing. Risk Anal 25: 109–124.
33. O’Hagan A, Buck C, Daneshkhah A, Eiser J, Garthwaite P, et al (2006)Uncertain Judgements. Eliciting experts’ probabilities. Chichester, UK: John
Wiley & Sons, Ltd. 321 p.
34. Public Health Agency of Canada (2010) National notifiable diseases: notifiablediseases on line. Available: http://dsol-smed.phac-aspc.gc.ca/dsol-smed/ndis/
list-eng.php. Accessed 2010 May.35. Canadian Food Inspection Agency (2011) Reportable diseases, immediately
notifiable and annually notifiable diseases. Available: http://www.inspection.gc.ca/english/anima/disemala/guidee.shtml. Accessed 2011 May.
36. McKendrick IJ, Gettinby G, Gu Y, Reid SWJ, Revie CW (2000) Using Bayesian
Belief Networks to aid differential diagnosis of tropical bovine diseases. Prev VetMed 47: 141–156.
37. Steele K, Carmel Y, Cross J, Wilcox C (2009) Uses and misuses of multicriteria
decision analysis (MCDA) in environmental decision making. Risk Anal 29: 26–
33. 10.1111/j.1539-6924.2008.01130.x.
38. Bouyssou D, Marchant T, Pirlot M, Tsoukias A, Vincke P (2006) Evaluation and
decision models with multiple criteria. Boston, MA: Springer Science+Business
Media, Inc. 445 p.
39. Guis H, Caminade C, Calvete C, Morse AP, Tran A, et al. (2012) Modelling the
effects of past and future climate on the risk of Bluetongue emergence in Europe.
J R Soc Interface 9: 339–350. 10.1098/rsif.2011.0255.
40. Soverow JE, Wellenius GA, Fisman DN, Mittleman MA (2009) Infectious
disease in a warming world: how weather influenced West Nile virus in the
United States (2001–2005). Environ Health Perspect 117: 1049–1052. 10.1289/
ehp.0800487.
41. Click Lambert R, Kolivras KN, Resler LM, Brewster CC, Paulson SL (2008)
The potential for emergence of Chagas disease in the United States. Geospat
Health 2 (2): 227–239.
42. Tanowitz HB, Weiss LM, Montgomery SS (2011) Chagas disease has now gone
global. PLoS Negl Trop Dis 5: e1136. 10.1371/journal.pntd.0001136.
43. Hasan NA, Choi SY, Eppinger M, Clark PW, Chen A, et al. (2012) Genomic
diversity of 2010 Haitian cholera outbreak strains. Proc Natl Acad Sci U S A
109: E2010–7. 10.1073/pnas.1207359109.
44. Rose JB, Epstein PR, Lipp EK, Sherman BH, Bernard SM, et al. (2001) Climate
variability and change in the United States: potential impacts on water- and
foodborne diseases caused by microbiologic agents. Environ Health Perspect 109
Suppl 2: 211–221.
45. Patz JA, Olson SH, Uejio CK, Gibbs HK (2008) Disease emergence from global
climate and land use change. Med Clin North Am 92: 1473–91, xii. 10.1016/
j.mcna.2008.07.007.
46. Olson MJ, Budescu DV (1997) Patterns of preference for numerical and verbal
probabilities. J Beh Dec Making 10: 117–131.
47. National Assessment Synthesis Team (2000) Climate change impacts on the
United States: The potential consequences of climate variability and change.
Washington, D.C.: 163 p.
48. Keeney RL, Raiffa H (1993) Decisions with multiple objectives. Preferences and
value trade offs. Cambridge: Cambridge University Press. 569 p.
49. Gilsdorf A, Krause G (2011) Authors reply: Prioritisation of infectious diseases in
public health: feedback on the prioritisation methodology, 15 July 2008 to 15
January 2009. Euro Surveill 16: 19912.
50. Aspinall W (2010) A route to more tractable expert advice. Nature 463: 294–
295. 10.1038/463294a; 10.1038/463294a.
51. Cooke RM (1991) Experts in uncertainty: opinion and subjective probability in
science. Oxford: Oxford University Press. 336 p.
52. Albert I, Donnet S, Guihenneuc-Joyaux C, Low-Choy S, Mengersen K, et al.
(2012) Combining expert opinions in prior elicitation. Bayesian Anal 7: 503–
532.
53. Figueira J, Greco S, Ehrgott M (2005) Multiple Criteria Decision Analysis. State
of the art surveys. New York, USA: Springer Science and Business Media LLC.
1045 p.
54. McKenzie J, Simpson H, Langstaff I (2007) Development of methodology to
prioritise wildlife pathogens for surveillance. Prev Vet Med 81: 194–210.
10.1016/j.prevetmed.2007.04.003.
55. Horby P, Rushdy A, Graham C, O’Mahony M, PHLS Overview of
Communicable Diseases Committee (2001) PHLS overview of communicable
diseases 1999. Commun Dis Public Health 4: 8–17.
56. Humblet MF, Vandeputte S, Albert A, Gosset C, Kirschvink N, et al. (2012)
Multidisciplinary and evidence-based method for prioritizing diseases of food-
producing animals and zoonoses. Emerg Infect Dis 18: e1. 10.3201/
eid1804.111151.
57. Pheloung PC, Williams PA, Halloy SR (1999) A weed risk assessment model for
use as a biosecurity tool evaluating plant introductions. J Environ Health 57:
239–251.
58. Anand P (2002) Decision-making when science is ambiguous. Science 295: 1839.
10.1126/science.1061744.
59. University of Liverpool (2011) ENHanCEd Infectious Diseases database (EID2).
Available: www.zoonosis.ac.uk/eid2. .
60. Bana e Costa CA (2005) On the mathematical foundation of Macbeth. In:
Figueira J, Greco S, Ehrgott M, editors. Multiple Criteria Decision Analysis.
State of the art surveys. New York, USA: Springer Science+Business Media,
LLC. pp. 409–442.
Prioritisation of Emerging Diseases
PLOS ONE | www.plosone.org 16 August 2013 | Volume 8 | Issue 8 | e68338