multi-stage pseudomorphic replacement of garnet during polymetamorphism: 2. algebraic analysis of...
TRANSCRIPT

J. metamorphic Geol., 1999, 17, 735–746
Multi-stage pseudomorphic replacement of garnet duringpolymetamorphism: 2. Algebraic analysis of mineral assemblagesB. CESARECNR Centro di Studio per la Geodinamica Alpina, and Dipartimento di Mineralogia e Petrologia – Universita di Padova,Corso Garibaldi 37, I-35137 Padova, Italy ([email protected] )
ABSTRACT Chemical relationships among four metapelites have been studied by investigation of mineral and bulkchemistry data and by singular value decomposition analysis of single and composite assemblage matrices.Bulk rock compositions cluster close together in an AFM diagram, all within the intersection spacedefined by the four sample assemblages. The similarity of bulk compositions normalized on a silica-free,anhydrous basis indicates that sample chemistries differ mainly as a result of inhomogeneous distributionof quartz layers. The existence of mass balance relationships among samples indicates that assemblagesalso overlap in the Si–Ti–Al–Fe–Mg–Mn–Ca–Na–K multisystem. Analysis of single and compositematrices helps in defining possible mass balances linking sample mineral facies to one another duringprogressive contact metamorphism. The assemblage in sample A can form as the result of the modelreaction
5.000 Ky+0.269 Grt+0.965 Bt+0.314 Pl=0.049 Ilm+1.115 Ms+0.849 Chl+0.306 St
and react to assemblage B via reaction
0.97 Chl+0.52 Grt+0.66 Ms+0.14 Ilm+1.26 Ky=0.42 St+0.63 Bt+0.22 Pl
coupled with the Ky�And transition. Assemblage B can transform into C by initial progress of
Ky+Ilm+Chl+Grt+Ms=And+St+Bt+Pl
followed by
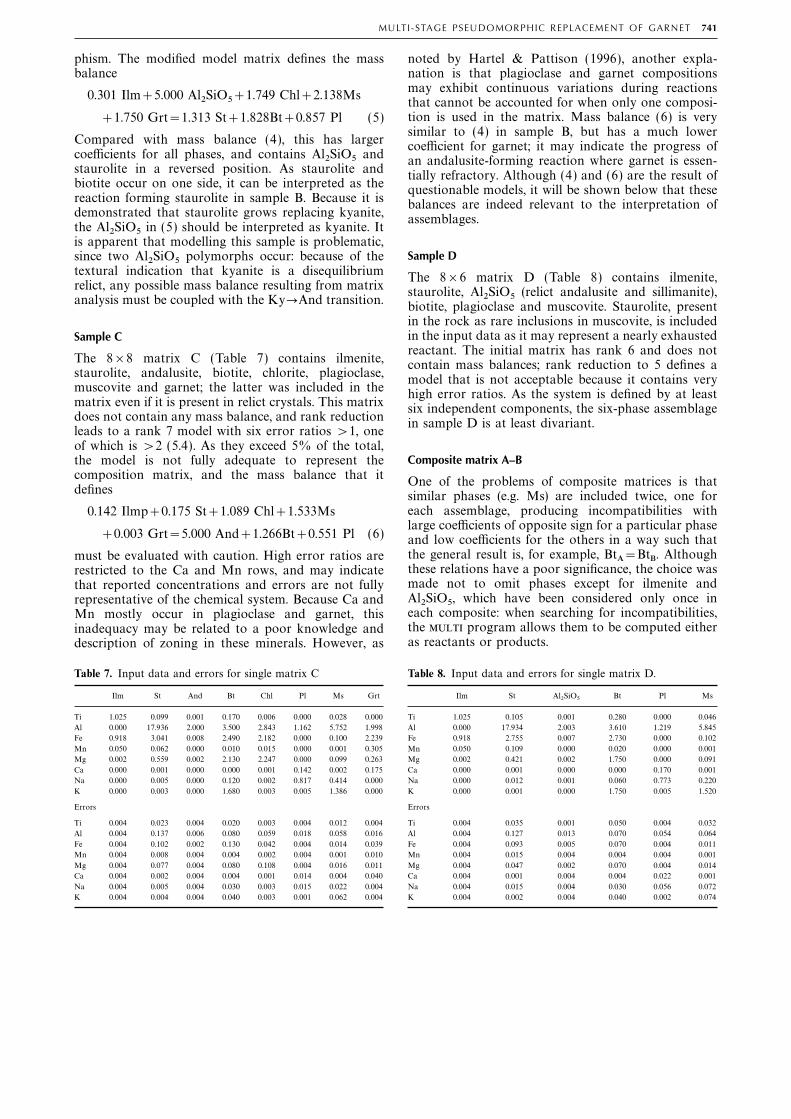
0.142 Ilm+0.175 St+1.089 Chl+1.533 Ms+0.003 Grt=5.000 And+1.266 Bt+0.551 Pl
Matrix analysis cannot satisfactorily model the C–D transition, because it predicts a net production ofstaurolite, which is in disagreement with petrographic evidence. All mass balances in the C–D compositematrix indicate net consumption of muscovite; this is integrated with the contrasting evidence of progradepseudomorphs of muscovite after staurolite, observed in the nodules of sample D, within a model involvingthe progress of ionic reaction cycles.
Key words: algebraic analysis; mass balance; metamorphic reaction; metapelite; SVD technique.
Incompatibility reactions correspond to crossing tie-INTRODUCTION
lines in the relevant compositional space (Fig. 1). Theserelationships can be investigated by graphical analysisComparison of rock samples along a metamorphic
traverse or within a single outcrop leads to the of phase diagrams, such as the AFM projection ofThompson (1957) for the model pelitic system.necessity of determining whether different mineral
assemblages are the result of changes in intensive However, in complex systems such as natural rocks,where extra components (e.g. MnO) may not beparameters of metamorphism (e.g. P, T , aH
2O) or could
have equilibrated at the same metamorphic conditions, negligible, the limitation of plots to two dimensionsmakes meaningful graphical representation impossible.due to variations in bulk composition. Such a determi-
nation may be made by analysing mass balance As pointed out by Greenwood (1967), algebraicanalysis can overcome this problem, because linearrelationships among a pair of assemblages: if a mass
balance exists, the assemblages did not equilibrate at dependencies between minerals in the whole multi-component system do represent incompatibilities.the same metamorphic conditions; otherwise assem-
blages reflect different bulk compositions and could Algebraic analysis was generally performed byregression techniques (Fletcher & Greenwood, 1979;have equilibrated (but not necessarily) at the same
conditions. These two situations are referred to as Pigage, 1982; Lang & Rice, 1985; Giaramita & Day,1991) until Fisher (1989) proposed an alternativeincompatible and compatible assemblages, respectively
(Fisher, 1990). technique based on singular value decomposition
735© Blackwell Science Inc., 0263-4929/99/$14.00Journal of Metamorphic Geology, Volume 17, Number 6, 1999

736 B. CESARE
A A
CBCB
a
1 2 1 2
b a b
compatible incompatible
Y
X
Z
Y
X
Z
Fig. 1. Graphical description of compatibility relationships between three-phase (X, Y, Z) assemblages (a and b) in a schematicthree-component (A–B–C) phase diagram. Compatible assemblages ( left) do not intersect, whereas incompatible assemblages (right)have a compositional intersection (shaded), and must be representative of two different mineral facies. All compositions in theshaded area (and only these) can develop both assemblages and thus can belong to both mineral facies.
Table 1. Mineral assemblages of the four metapelite samples.(SVD). SVD analysis of metamorphic assemblages isFib, fibrolite; Ser, sericite.becoming increasingly used (Powell, 1990; Gordon
et al., 1991; Lang, 1991; Hartel & Pattison, 1996). Sample
In this paper, along with discussion of chemicalA B C D
data, the SVD technique is applied to some metapelitesAnd X X Xfrom the Vedrette di Ries contact aureole, whichBt X X X Xcontain peculiar nodular textures interpreted asChl X X X
pseudomorphs after a primary garnet. The aim of this Fib X X X
Grt X X Xstudy is twofold, looking for incompatibilities amongIlm X X X Xthe samples (a) to test the assumption of a commonKy X X
protolith, and (b) if possible, to identify the mass Ms X X X X
Pl X X X Xbalances or chemical relationships existing withinQtz X X X X
single samples and among sample pairs, comparingSer X X X
St X X X Xthem with the inferences provided by the microstruc-tures. It will also be shown that integration betweenmicrostructural analysis and mass-balance inspectioncan lead to a deeper insight into reaction mechanisms, phic grade increases in samples according to the
sequence: A<B<C<D.such as ionic reaction cycles.Sample A, the most external, was slightly affected
by contact metamorphism, and contains abundantGEO-PETROGRAPHIC BACKGROUND
relicts (kyanite, garnet and fibrolite) of earlier paragen-eses, both Alpine and pre-Alpine in age. A smallDetails on the geological setting, location, mineral
assemblages and textures of the four metapelites amount of staurolite occurs as overgrowths on kyanite;the latter forms typical microgranular nodules. Thesestudied in this work (VR491, VR496, VR480 & VR466,
hereafter referred as A, B, C & D) can be found in a nodules, immersed in a sericite-rich matrix, representpseudomorphs after garnet.companion paper (Cesare, 1999) describing the meta-
morphic evolution of these rocks. The metapelites Sample B contains abundant staurolite, both in thenodules and in the matrix, where biotite recrystallizesoccur in the aureole of the Vedrette di Ries tonalite,
and belong to the Austroalpine basement of the eastern with random orientation. Andalusite porphyroblastsovergrow the foliation, and are mainly localized in theAlps. These rocks were involved in both pre-Alpine
and polyphase Alpine metamorphic cycles (Borsi et al., sericite-rich portions. Because biotite and stauroliteinclusions in andalusite are finer than outside andalus-1973); the latter terminated during the Oligocene with
emplacement of the Vedrette di Ries pluton (Bellieni ite, it is suggested that growth of andalusite andstaurolite, and coarsening of biotite-bearing matrix,et al., 1981) and the development of the contact effects
that are the main subject of this study. The samples were synchronous and occurred during contactmetamorphism.were collected in well-defined layers that crop out at
variable distance from the intrusion and belong to Sample C has a similar mineralogy to B, but chloriteand muscovite are less abundant, garnet occursdifferent metamorphic zones in the aureole; their
mineralogy is listed in Table 1. The contact metamor- as scarce relict inclusions, kyanite is lacking, and

MULTI-STAGE PSEUDOMORPHIC REPLACEMENT OF GARNET 737
lower Al (from 2.92 to 2.84); this is typical of progressivestaurolite, biotite and andalusite are more abundantmetamorphism (e.g. Pattison, 1987).and coarser.
Garnet is the only mineral phase with a well-developed zoning, asSample D contains nodules of decussate muscovite, can be deduced from the point analyses G1–G5 and the large
where relict inclusions of staurolite from former standard deviations reported in Table 2. The largest variationsinvolve Mn (from 0.04 to 0.32 atoms); in sample B this may alsoaggregates are occasionally preserved. Both andalusitereflect the presence of two garnet generations, the second (with lowand fibrolite are abundant, but the former showsMn content) forming either overgrowths on earlier porphyroclasts
dissolution textures, indicating that it is metastable.(analysis G4), or fine-grained rims around biotite in the matrix
The rock matrix is mainly composed of biotite–fibrolite (analysis G5).Ilmenite is close to stoichiometry in samples A and B, whereas itfolia alternating with quartz–plagioclase layers.
contains appreciable Mn (0.05 atoms) in sample D.Staurolite does not occur in the matrix, and muscoviteMuscovite analyses vary in their Ti content (from 0.01 to 0.09is mainly concentrated in the nodules.
atoms) and K/(K+Na) value (from 0.73 to 0.91). In samples A andBased on the peculiar features of these rocks, Cesare B, this reflects the presence of two mica generations: coarse muscovite
(1999) proposes that nodular textures represent stages (analyses M1 & M3) and sericite (analyses M2 & M4), which differmainly in their Ti content (up to 0.07 atoms in muscovite).in a sequence of pseudomorphs after garnet, andDifferences in composition also occur in sample D, where decussatesuggests that (i) the four metapelites share a commonmuscovite in nodules has lower Ti (0.04 atoms, analysis M5) than
protolith, possibly (re)folded during polymetamorph-muscovite in the matrix (0.09 atoms, analysis M6).
ism, prior to the emplacement of Vedrette di Ries Plagioclase shows a slight increase in anorthite from A (XAn=0.11) to D (XAn=0.18). Notable plagioclase zoning was not observed,tonalite, and (ii) that the AFM reactionsand in each sample the anorthite variation is restricted within ±0.03.
Staurolite does not show appreciable variations of XFe (0.84 toKy+Grt+Ms+Chl=St+And+Bt (1)0.87) with metamorphic grade, whereas an increase of Mn (from0.02–0.11 atoms) is observed. Staurolite has low Zn content in allandsamples except D, where up to 0.30 atoms are present, correspondingto a Zn/(Zn+Fe+Mg+Mn) ratio of 0.07. The Zn concentration is
St+And+Chl+Ms=Bt+Sil (2) in negative correlation with the modal abundance of staurolite inthe samples, as pointed out by Guidotti (1970). Owing to theincompleteness of information on all minerals (see discussion incould describe the mineralogical changes amongTuisku et al., 1987), the Zn component could not be considered insamples (A�C and C�D, respectively). In this model,the matrix analysis.the reactions, as well as the differentiation from the
Mineral compositions suggest that, with the exception of garnetcommon protolith, are believed to have occurred in sample B and to a lesser extent of muscovite in samples A, B andduring the Oligocene contact metamorphism. D, the four samples may represent a good approach to equilibrium
and can then be modelled by the SVD technique.Reactions (1) and (2) involve a different Al2SiO5polymorph on each side: kyanite is a relict of regionalmetamorphism, whereas andalusite and fibrolite BULK CHEMISTRYdevelop during progressive contact metamorphism. As
Whole rock XRF & AA data of the four metapelites are reported ina consequence, both reactions need also to account forTable 3. The greatest variation among samples involves SiO2an Al2SiO5 phase transition.(49.62–61.15 wt%), which in turn affects all the other oxides. Suchchanges are probably related to local variations in the abundanceof quartz layers within the samples. This hypothesis has been testedMINERAL CHEMISTRYby normalizing bulk compositions on a silica-free, anhydrous basis:i.e. by projecting from quartz and H2O, as on the AFM diagram.Chemical analyses of all mineral phases in the metapelites wereAs shown by the data in Table 4 and in particular by the values ofobtained using a Cameca SX50 electron microprobe at the InstituteAl2O3, the variations of oxides after normalization are much smallerof Mineralogy and Petrology of the ETH (Zurich), using a beamthan suggested by Table 3, generally within 10% relative.current of 20 nA and an accelerating voltage of 15 kV. A focused
In the AFM diagram of Fig. 2(a), bulk compositions projectbeam of c. 1 mm was used for all analyses, although this may havewithin a very restricted area within the intersection of all fieldsenhanced volatile loss on micas and plagioclase. Natural oxides anddefined by each sample assemblage. Although assemblages comprisesilicates were used as standards. Compositions reported in Table 2phases that are in clear disequilibrium (e.g. kyanite in A and B, orare averages of all spot analyses of each phase in a sample. Alsoandalusite in D), these phases have to be included in order toreported are single spot analyses of phases which show compositionalaccount for the full chemistry of the system. Garnet and staurolite,inhomogeneities, discussed below. Where not specified, the variationrespectively included in assemblages C and D, occur in negligibleof each element in each mineral can be deduced from the standardamount: omission of these phases would greatly decrease thedeviation values (1 s) in Table 2 and the error matrices of Tables 5–8.intersection volume of assemblages, but still all bulk compositionsAndalusite and kyanite have low Fe contents (<0.02 atoms), thatwould plot inside it (Fig. 2b).do not affect phase relationships; fibrolite in sample D could not be
analysed because of contamination from finely intergrown biotite.Biotite is very similar (average XFe=0.52–0.55, Ti=0.17±0.02
MATRIX ANALYSIS : SVD METHOD AND INPUTatoms) in samples A, B and C, with increases in sample D for Ti(0.28 atoms), Mn (0.18 atoms) and XFe (0.61). Within the same DATAsample, the only significant variation is represented by the changesof XFe within ±3% of the average value, as a function of the Linear dependencies between minerals in a single sample assemblage
represent crossing tie-lines in an appropriate phase diagram; theseco-existing ferromagnesian phase.Chlorite is homogeneous in each sample, with similar XFe in the relationships have several interpretations (Fisher, 1989), such as
disequilibrium in the assemblage, or equilibration under imposedrange 0.49±0.02. Samples B and C, which belong to the same zone(andalusite–staurolite) show, with decreasing distance from the external conditions. They may also indicate the process by which
the assemblage developed, for example, an univariant reaction. It isintrusion, higher Mn (like biotite), Si (from 2.56 to 2.64 atoms) and
738 B. CESARE
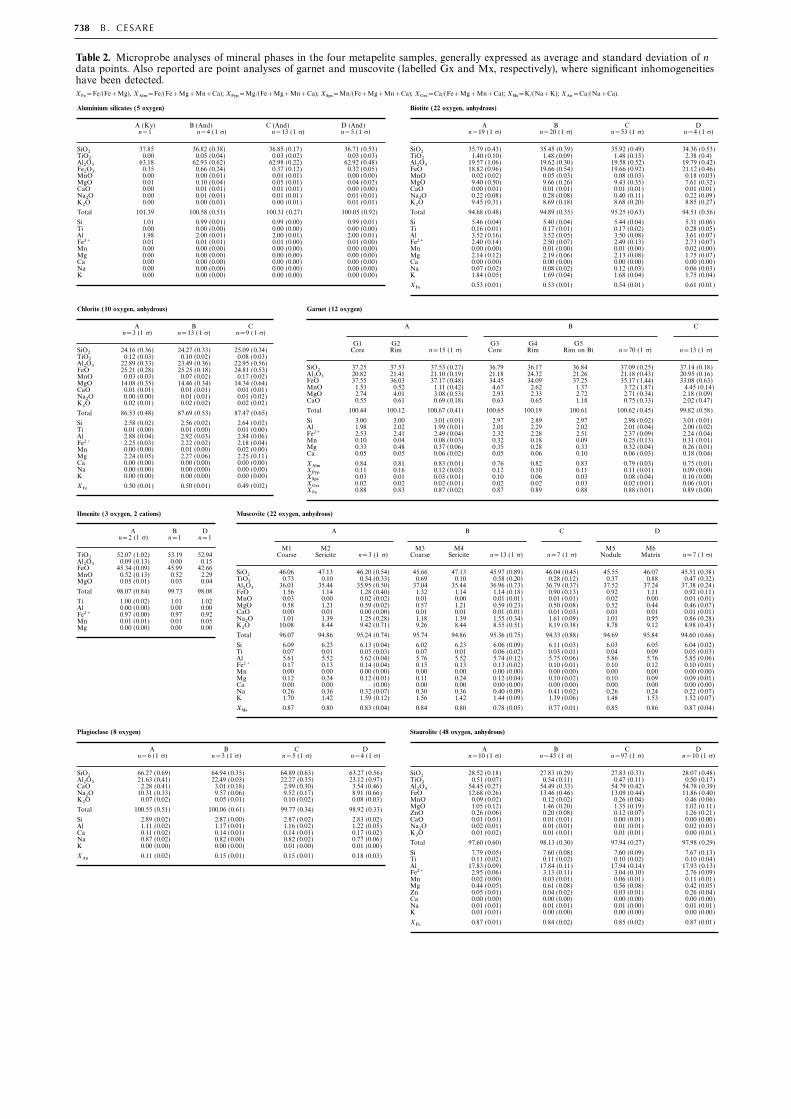
Table 2. Microprobe analyses of mineral phases in the four metapelite samples, generally expressed as average and standard deviation of ndata points. Also reported are point analyses of garnet and muscovite ( labelled Gx and Mx, respectively), where significant inhomogeneitieshave been detected.XFe=Fe/(Fe+Mg), XAlm=Fe/(Fe+Mg+Mn+Ca); XPyp=Mg/(Fe+Mg+Mn+Ca); XSps=Mn/(Fe+Mg+Mn+Ca); XGrs=Ca/(Fe+Mg+Mn+Ca); XMs=K/(Na+K); XAn=Ca/(Na+Ca).
Aluminium silicates (5 oxygen)
A (Ky) B (And) C (And) D (And)n=1 n=4 (1 s) n=13 (1 s) n=5 (1 s)
SiO2 37.85 36.82 (0.38) 36.85 (0.17) 36.71 (0.53)TiO2 0.00 0.05 (0.04) 0.03 (0.02) 0.03 (0.03)Al2O3 63.18 62.93 (0.62) 62.98 (0.22) 62.92 (0.48)Fe2O3 0.35 0.66 (0.24) 0.37 (0.12) 0.32 (0.05)MnO 0.00 0.00 (0.01) 0.01 (0.01) 0.00 (0.00)MgO 0.01 0.10 (0.04) 0.05 (0.01) 0.04 (0.02)CaO 0.00 0.01 (0.01) 0.01 (0.01) 0.00 (0.00)Na2O 0.00 0.01 (0.01) 0.01 (0.01) 0.01 (0.01)K2O 0.00 0.00 (0.01) 0.00 (0.01) 0.01 (0.01)
Total 101.39 100.58 (0.51) 100.31 (0.27) 100.05 (0.92)
Si 1.01 0.99 (0.01) 0.99 (0.00) 0.99 (0.01)Ti 0.00 0.00 (0.00) 0.00 (0.00) 0.00 (0.00)Al 1.98 2.00 (0.01) 2.00 (0.01) 2.00 (0.01)Fe3+ 0.01 0.01 (0.01) 0.01 (0.00) 0.01 (0.00)Mn 0.00 0.00 (0.00) 0.00 (0.00) 0.00 (0.00)Mg 0.00 0.00 (0.00) 0.00 (0.00) 0.00 (0.00)Ca 0.00 0.00 (0.00) 0.00 (0.00) 0.00 (0.00)Na 0.00 0.00 (0.00) 0.00 (0.00) 0.00 (0.00)K 0.00 0.00 (0.00) 0.00 (0.00) 0.00 (0.00)
Biotite (22 oxygen, anhydrous)
A B C Dn=19 (1 s) n=20 (1 s) n=53 (1 s) n=4 (1 s)
SiO2 35.79 (0.43) 35.45 (0.39) 35.92 (0.49) 34.36 (0.53)TiO2 1.40 (0.10) 1.48 (0.09) 1.48 (0.15) 2.38 (0.4)Al2O3 19.57 (1.06) 19.62 (0.30) 19.58 (0.52) 19.79 (0.42)FeO 18.82 (0.96) 19.66 (0.54) 19.66 (0.92) 21.12 (0.46)MnO 0.02 (0.02) 0.05 (0.03) 0.08 (0.03) 0.18 (0.03)MgO 9.40 (0.50) 9.66 (0.26) 9.43 (0.35) 7.61 (0.32)CaO 0.00 (0.01) 0.01 (0.01) 0.01 (0.01) 0.01 (0.01)Na2O 0.22 (0.08) 0.28 (0.08) 0.40 (0.11) 0.22 (0.09)K2O 9.45 (0.31) 8.69 (0.18) 8.68 (0.20) 8.85 (0.27)
Total 94.68 (0.48) 94.89 (0.35) 95.25 (0.63) 94.51 (0.56)
Si 5.46 (0.04) 5.40 (0.04) 5.44 (0.04) 5.31 (0.06)Ti 0.16 (0.01) 0.17 (0.01) 0.17 (0.02) 0.28 (0.05)Al 3.52 (0.16) 3.52 (0.05) 3.50 (0.08) 3.61 (0.07)Fe2+ 2.40 (0.14) 2.50 (0.07) 2.49 (0.13) 2.73 (0.07)Mn 0.00 (0.00) 0.01 (0.00) 0.01 (0.00) 0.02 (0.00)Mg 2.14 (0.12) 2.19 (0.06) 2.13 (0.08) 1.75 (0.07)Ca 0.00 (0.00) 0.00 (0.00) 0.00 (0.00) 0.00 (0.00)Na 0.07 (0.02) 0.08 (0.02) 0.12 (0.03) 0.06 (0.03)K 1.84 (0.05) 1.69 (0.04) 1.68 (0.04) 1.75 (0.04)
XFe 0.53 (0.01) 0.53 (0.01) 0.54 (0.01) 0.61 (0.01)
Chlorite (10 oxygen, anhydrous)
A B Cn=3 (1 s) n=13 (1 s) n=9 (1 s)
SiO2 24.16 (0.36) 24.27 (0.33) 25.09 (0.34)TiO2 0.12 (0.03) 0.10 (0.02) 0.08 (0.03)Al2O3 22.89 (0.33) 23.49 (0.36) 22.95 (0.56)FeO 25.21 (0.28) 25.25 (0.18) 24.81 (0.53)MnO 0.03 (0.03) 0.07 (0.02) 0.17 (0.02)MgO 14.08 (0.35) 14.46 (0.34) 14.34 (0.64)CaO 0.01 (0.01) 0.01 (0.01) 0.01 (0.01)Na2O 0.00 (0.00) 0.01 (0.01) 0.01 (0.02)K2O 0.02 (0.01) 0.02 (0.02) 0.02 (0.02)
Total 86.53 (0.48) 87.69 (0.53) 87.47 (0.65)
Si 2.58 (0.02) 2.56 (0.02) 2.64 (0.02)Ti 0.01 (0.00) 0.01 (0.00) 0.01 (0.00)Al 2.88 (0.04) 2.92 (0.03) 2.84 (0.06)Fe2+ 2.25 (0.03) 2.22 (0.02) 2.18 (0.04)Mn 0.00 (0.00) 0.01 (0.00) 0.02 (0.00)Mg 2.24 (0.05) 2.27 (0.06) 2.25 (0.11)Ca 0.00 (0.00) 0.00 (0.00) 0.00 (0.00)Na 0.00 (0.00) 0.00 (0.00) 0.00 (0.00)K 0.00 (0.00) 0.00 (0.00) 0.00 (0.00)
XFe 0.50 (0.01) 0.50 (0.01) 0.49 (0.02)
Garnet (12 oxygen)
A B C
G1 G2 G3 G4 G5Core Rim n=15 (1 s) Core Rim Rim on Bt n=70 (1 s) n=13 (1 s)
SiO2 37.25 37.53 37.53 (0.27) 36.79 36.17 36.84 37.09 (0.25) 37.14 (0.18)Al2O3 20.82 21.41 21.10 (0.19) 21.18 24.32 21.26 21.18 (0.43) 20.95 (0.16)FeO 37.55 36.03 37.17 (0.48) 34.45 34.09 37.25 35.17 (1.44) 33.08 (0.63)MnO 1.53 0.52 1.11 (0.42) 4.67 2.62 1.37 3.72 (1.87) 4.45 (0.14)MgO 2.74 4.01 3.08 (0.53) 2.93 2.33 2.72 2.71 (0.34) 2.18 (0.09)CaO 0.55 0.61 0.69 (0.18) 0.63 0.65 1.18 0.75 (0.33) 2.02 (0.47)
Total 100.44 100.12 100.67 (0.41) 100.65 100.19 100.61 100.62 (0.45) 99.82 (0.58)
Si 3.00 3.00 3.01 (0.01) 2.97 2.89 2.97 2.98 (0.02) 3.01 (0.01)Al 1.98 2.02 1.99 (0.01) 2.01 2.29 2.02 2.01 (0.04) 2.00 (0.02)Fe2+ 2.53 2.41 2.49 (0.04) 2.32 2.28 2.51 2.37 (0.09) 2.24 (0.04)Mn 0.10 0.04 0.08 (0.03) 0.32 0.18 0.09 0.25 (0.13) 0.31 (0.01)Mg 0.33 0.48 0.37 (0.06) 0.35 0.28 0.33 0.32 (0.04) 0.26 (0.01)Ca 0.05 0.05 0.06 (0.02) 0.05 0.06 0.10 0.06 (0.03) 0.18 (0.04)
XAlm 0.84 0.81 0.83 (0.01) 0.76 0.82 0.83 0.79 (0.03) 0.75 (0.01)XPyp 0.11 0.16 0.12 (0.02) 0.12 0.10 0.11 0.11 (0.01) 0.09 (0.00)XSps 0.03 0.01 0.03 (0.01) 0.10 0.06 0.03 0.08 (0.04) 0.10 (0.00)XGrs 0.02 0.02 0.02 (0.01) 0.02 0.02 0.03 0.02 (0.01) 0.06 (0.01)XFe 0.88 0.83 0.87 (0.02) 0.87 0.89 0.88 0.88 (0.01) 0.89 (0.00)
Ilmenite (3 oxygen, 2 cations)
A B Dn=2 (1 s) n=1 n=1
TiO2 52.07 (1.02) 53.19 52.94Al2O3 0.09 (0.13) 0.00 0.15FeO 45.34 (0.09) 45.99 42.66MnO 0.52 (0.13) 0.52 2.29MgO 0.05 (0.01) 0.03 0.04
Total 98.07 (0.84) 99.73 98.08
Ti 1.00 (0.02) 1.01 1.02Al 0.00 (0.00) 0.00 0.00Fe2+ 0.97 (0.00) 0.97 0.92Mn 0.01 (0.01) 0.01 0.05Mg 0.00 (0.00) 0.00 0.00
Muscovite (22 oxygen, anhydrous)
A B C D
M1 M2 M3 M4 M5 M6Coarse Sericite n=3 (1 s) Coarse Sericite n=13 (1 s) n=7 (1 s) Nodule Matrix n=7 (1 s)
SiO2 46.06 47.13 46.20 (0.54) 45.66 47.13 45.97 (0.89) 46.04 (0.45) 45.55 46.07 45.51 (0.38)TiO2 0.73 0.10 0.54 (0.33) 0.69 0.10 0.58 (0.20) 0.28 (0.12) 0.37 0.88 0.47 (0.32)Al2O3 36.01 35.44 35.95 (0.50) 37.04 35.44 36.96 (0.73) 36.79 (0.37) 37.52 37.24 37.38 (0.24)FeO 1.56 1.14 1.28 (0.40) 1.32 1.14 1.14 (0.18) 0.90 (0.13) 0.92 1.11 0.92 (0.11)MnO 0.03 0.00 0.02 (0.02) 0.01 0.00 0.01 (0.01) 0.01 (0.01) 0.02 0.00 0.01 (0.01)MgO 0.58 1.21 0.59 (0.02) 0.57 1.21 0.59 (0.23) 0.50 (0.08) 0.52 0.44 0.46 (0.07)CaO 0.00 0.01 0.00 (0.00) 0.01 0.01 0.01 (0.01) 0.01 (0.03) 0.01 0.01 0.01 (0.01)Na2O 1.01 1.39 1.25 (0.28) 1.18 1.39 1.55 (0.34) 1.61 (0.09) 1.01 0.95 0.86 (0.28)K2O 10.08 8.44 9.42 (0.71) 9.26 8.44 8.55 (0.51) 8.19 (0.38) 8.78 9.12 8.98 (0.43)
Total 96.07 94.86 95.24 (0.74) 95.74 94.86 95.36 (0.75) 94.33 (0.88) 94.69 95.84 94.60 (0.66)
Si 6.09 6.23 6.13 (0.04) 6.02 6.23 6.06 (0.09) 6.11 (0.03) 6.03 6.05 6.04 (0.02)Ti 0.07 0.01 0.05 (0.03) 0.07 0.01 0.06 (0.02) 0.03 (0.01) 0.04 0.09 0.05 (0.03)Al 5.61 5.52 5.62 (0.04) 5.76 5.52 5.74 (0.12) 5.75 (0.06) 5.86 5.76 5.85 (0.06)Fe2+ 0.17 0.13 0.14 (0.04) 0.15 0.13 0.13 (0.02) 0.10 (0.01) 0.10 0.12 0.10 (0.01)Mn 0.00 0.00 0.00 (0.00) 0.00 0.00 0.00 (0.00) 0.00 (0.00) 0.00 0.00 0.00 (0.00)Mg 0.12 0.24 0.12 (0.01) 0.11 0.24 0.12 (0.04) 0.10 (0.02) 0.10 0.09 0.09 (0.01)Ca 0.00 0.00 – (0.00) 0.00 0.00 0.00 (0.00) 0.00 (0.00) 0.00 0.00 0.00 (0.00)Na 0.26 0.36 0.32 (0.07) 0.30 0.36 0.40 (0.09) 0.41 (0.02) 0.26 0.24 0.22 (0.07)K 1.70 1.42 1.59 (0.12) 1.56 1.42 1.44 (0.09) 1.39 (0.06) 1.48 1.53 1.52 (0.07)
XMs 0.87 0.80 0.83 (0.04) 0.84 0.80 0.78 (0.05) 0.77 (0.01) 0.85 0.86 0.87 (0.04)
Plagioclase (8 oxygen)
A B C Dn=6 (1 s) n=3 (1 s) n=5 (1 s) n=4 (1 s)
SiO2 66.27 (0.69) 64.94 (0.35) 64.89 (0.63) 63.27 (0.56)Al2O3 21.63 (0.41) 22.49 (0.03) 22.27 (0.35) 23.12 (0.97)CaO 2.28 (0.41) 3.01 (0.18) 2.99 (0.30) 3.54 (0.46)Na2O 10.31 (0.33) 9.57 (0.06) 9.52 (0.17) 8.91 (0.66)K2O 0.07 (0.02) 0.05 (0.01) 0.10 (0.02) 0.08 (0.03)
Total 100.55 (0.51) 100.06 (0.61) 99.77 (0.34) 98.92 (0.33)
Si 2.89 (0.02) 2.87 (0.00) 2.87 (0.02) 2.83 (0.02)Al 1.11 (0.02) 1.17 (0.01) 1.16 (0.02) 1.22 (0.05)Ca 0.11 (0.02) 0.14 (0.01) 0.14 (0.01) 0.17 (0.02)Na 0.87 (0.02) 0.82 (0.00) 0.82 (0.02) 0.77 (0.06)K 0.00 (0.00) 0.00 (0.00) 0.01 (0.00) 0.01 (0.00)
XAn 0.11 (0.02) 0.15 (0.01) 0.15 (0.01) 0.18 (0.03)
Staurolite (48 oxygen, anhydrous)
A B C Dn=10 (1 s) n=45 (1 s) n=97 (1 s) n=10 (1 s)
SiO2 28.52 (0.18) 27.83 (0.29) 27.83 (0.33) 28.07 (0.48)TiO2 0.51 (0.07) 0.54 (0.11) 0.47 (0.11) 0.50 (0.17)Al2O3 54.45 (0.27) 54.49 (0.33) 54.79 (0.42) 54.78 (0.39)FeO 12.68 (0.26) 13.46 (0.46) 13.09 (0.44) 11.86 (0.40)MnO 0.09 (0.02) 0.12 (0.02) 0.26 (0.04) 0.46 (0.06)MgO 1.05 (0.12) 1.46 (0.20) 1.35 (0.19) 1.02 (0.11)ZnO 0.26 (0.06) 0.20 (0.08) 0.12 (0.07) 1.26 (0.21)CaO 0.01 (0.01) 0.01 (0.01) 0.00 (0.01) 0.00 (0.00)Na2O 0.02 (0.01) 0.01 (0.01) 0.01 (0.01) 0.02 (0.03)K2O 0.01 (0.02) 0.01 (0.01) 0.01 (0.01) 0.00 (0.01)
Total 97.60 (0.60) 98.13 (0.30) 97.94 (0.27) 97.98 (0.29)
Si 7.79 (0.05) 7.60 (0.08) 7.60 (0.09) 7.67 (0.13)Ti 0.11 (0.02) 0.11 (0.02) 0.10 (0.02) 0.10 (0.04)Al 17.83 (0.09) 17.84 (0.11) 17.94 (0.14) 17.93 (0.13)Fe2+ 2.95 (0.06) 3.13 (0.11) 3.04 (0.10) 2.76 (0.09)Mn 0.02 (0.00) 0.03 (0.01) 0.06 (0.01) 0.11 (0.01)Mg 0.44 (0.05) 0.61 (0.08) 0.56 (0.08) 0.42 (0.05)Zn 0.05 (0.01) 0.04 (0.02) 0.03 (0.01) 0.26 (0.04)Ca 0.00 (0.00) 0.00 (0.00) 0.00 (0.00) 0.00 (0.00)Na 0.01 (0.01) 0.01 (0.01) 0.01 (0.00) 0.01 (0.01)K 0.01 (0.01) 0.00 (0.00) 0.00 (0.00) 0.00 (0.00)
XFe 0.87 (0.01) 0.84 (0.02) 0.85 (0.02) 0.87 (0.01)

MULTI-STAGE PSEUDOMORPHIC REPLACEMENT OF GARNET 739
Table 3. Bulk rock compositions of the four metapelitesamples.
Sample
A B C D
SiO2 61.15 61.03 49.62 55.86
TiO2 0.96 0.82 1.32 1.22
Al2O3 19.94 18.63 26.53 23.34
FeOTotal 7.39 7.46 8.88 8.67
MnO 0.09 0.09 0.09 0.08
MgO 2.23 2.32 2.79 2.71
CaO 0.38 0.39 0.68 0.49
Na2O 0.77 1.12 1.31 0.45
K2O 3.92 3.37 4.71 3.82
P2O5 0.17 0.15 0.24 0.24
L.O.I. 2.37 3.02 3.23 2.79
Total 99.37 98.40 99.40 99.67
Table 4. Silica-free, anhydrous bulk compositions of metapelitesamples, re-cast to an arbitrary total of 45.00.
Sample
A B C D
TiO2 1.21 1.07 1.28 1.34
Al2O3 25.03 24.41 25.65 25.60
FeOTotal 9.28 9.77 8.58 9.51
MnO 0.11 0.12 0.09 0.09
MgO 2.80 3.04 2.70 2.97
CaO 0.48 0.51 0.66 0.54
Na2O 0.97 1.47 1.27 0.49
K2O 4.92 4.41 4.55 4.19
P2O5 0.21 0.20 0.23 0.26
Total 45.00 45.00 45.00 45.00
the aim of the first part of SVD analysis, where single matrices areexplored, to constrain the reactions leading to assemblage develop-ment by integration with careful textural and field information. Inthe second part, matrix analysis is applied to pairs of assemblages,because the existence of mass balances implies different equilibrationconditions that could be reflected by changes in the topology ofphase diagrams.
SVD-based matrix analysis of mineral assemblages was performedwith version 2.0 of the programs (, , ) writtenand described by Fisher (1989). For each sample, two input matrices,the composition and the error matrices, were first formed
A
D
C
B
A
F M
Bt
Grt Chl
(Ky, Sil, And)
St
A
F M
Bt
Grt Chl
(Ky, Sil, And)
St
AD
C
B
a)
b)
(Tables 5–8). Each matrix contains a number of columns equal to Fig. 2. (a) AFM phase diagram representing the four samplethe number of mineral phases in the assemblage (as in Table 1) and assemblages, drawn on the basis of average measured phaseeight rows corresponding to the analysed chemical components (Ti, compositions, as in Table 2. Dots represent projected bulkAl, Fe2+, Mn, Mg, Ca, Na, K). The composition matrix contains compositions of samples, as in Table 3. The shaded field is thethe averaged analyses, as cations per unit formula (see Table 2); intersection of all sample assemblages. (b) Same as (a),formulae of hydrous phases were calculated on an anhydrous basis, excluding garnet from sample C and staurolite from sample D.assuming that an H2O-bearing fluid phase was present duringmetamorphism to allow for H2O balancing; Fe was considered tobe Fe2+ in all minerals. In the matrices, the Si component row was to be considered separately and added to the possible results of
matrix analysis.omitted, as well as the quartz phase column, as a means offacilitating computation of rank. This omission is legal (Fisher, The error matrices contain the 1 s standard deviations of the
averages reported in each composition matrix; in addition to1989) because quartz is in excess in all assemblages. Ilmenite ispresent but could not be analysed in sample C, where it was assumed analytical uncertainties, errors account also for chemical variations
between and within grains. In the error matrices, when only oneto have the same composition as in sample D. Other assumptionsinvolve the Al2SiO5 polymorphs, two of which occur in the same analysis was available for a phase so that the standard deviation
was not available (e.g. ilmeniteD, plagioclaseA), the error has beensample: fibrolite and kyanite in A, kyanite and andalusite in B,andalusite and fibrolite in D. Because these phases are virtually set to a value of 0.004 as suggested by the program. The
same error of 0.004 has been attributed in the case of the elementidentical in composition, one can be omitted in each matrix. Thisdoes not affect the results of matrix analysis, because SVD programs not analysed (e.g. Na in garnet, see Table 2); this procedure avoids
a zero divide in the calculations. A few high errors are present: Mncan handle Al2SiO5 compositions as both reactant or product, andbecause the role of each polymorph was constrained by field and in garnet is due to the chemical zoning, like Ca and Na in plagioclase
from sample D; Mg in staurolite and K and Na in muscovite aretextural analysis. The only restriction of this approach is that thetransitions Ky�And and An�Sil cannot be investigated: these have due to both chemical dishomogeneities within the specimen and

740 B. CESARE
analytical problems such as Na loss. As a whole, error values are to a tie-line intersection (i.e. a univariant eight-phasesimilar to those used in the analyses of Lang & Rice (1985), Lang assemblage in a seven-component system), and indi-(1991) or Giaramita & Day (1991).
cates that the assemblage cannot have equilibrated atarbitrary external conditions. This relation also sug-
MATRIX ANALYSIS : SVD RESULTS gests that the early stage of staurolite growth duringcontact metamorphism, observed in this sample,
Sample A occurred by consumption of kyanite, biotite andgarnet, and production of muscovite and chlorite; this
After omission of Si and quartz, the 8×8 matrix Ais in agreement with the textural observations of
(Table 5) contains Ti, Al, Fe, Mn, Mg, Ca, Na and KCesare (1999).
as rows, and ilmenite, staurolite, kyanite, biotite,chlorite, garnet, plagioclase and muscovite as columns.The phase rule indicates that if the number of
Sample Bindependent compositional parameters is identical tothe number of analysed components, then the equilib- The 8×8 matrix B (Table 6) contains ilmenite,
staurolite, Al2SiO5 (kyanite or andalusite), biotite,rium of the eight phases is divariant. To verify thateach component imposes an additional dimension, the chlorite, garnet, plagioclase and muscovite; it has rank
eight and does not contain any mass balance. Thematrix rank was reduced and a new model matrix ofrank 7 was obtained. Matrix rank can be reduced to matrix of reduced rank (7) contains six error ratios
>1, two of which much larger than two (7.4 & 5.9); itany value lower than the initial, but the adequacy ofthe resulting model to represent the initial composition must be considered a first-order model of the composi-
tional matrix. This model defines the mass balancematrix has to be evaluated. The program doesthis by calculating first the residuals between the model
0.133 Ilm+0.100 St+1.329 Chl+1.768 Ms+0.107 Grtand the analytical compositions, and then the errorratios between the residuals and the uncertainties of =5.000 Al2SiO5+1.511Bt+0.631 Pl (4)the error matrix. These ratios provide an estimate of
which would suggest an expanded form of the AFMthe adequacy of the fit: as outlined by Fisher (1989) the
reaction St+Chl=Bt+And. Note that the stoichio-model matrix is adequate when at least 95% of them
metric coefficient for staurolite is low, such thatare <1 and none is much larger than 2. In the rank 7
staurolite contributes <10 wt% of the total Al and Femodel matrix of sample A, all the error ratios are
involved in the mass balance.<2.1, and only three (all relevant to the Ca component)Large residuals and error ratios are related to the
are >1; thus, the model represents an adequate fit tohigh Mn (0.25) of averaged garnet composition used
the initial matrix. Rank reduction to six leads to ain the input matrix; in fact, if low-Mn garnet rim
model with seven error ratios >1, three of which are(analysis G5 in Table 2) is used in the input matrix,>3; this model was not considered acceptable.the modified rank 7 model is acceptable as it gives
The rank 7 model defines the mass balance:only three error ratios >1 (5.9, 1.8 & 1.1). This
5.000 Ky+0.269 Grt+0.965 Bt+0.314 Pl suggests that the high Mn cores of garnet porphyro-clasts are not in equilibrium with the assemblage,=0.049 Ilm+1.115 Ms+0.849 Chl+0.306 St (3)whereas their rims and the small crystals aroundbiotite may be stable during the contact metamor-This linear dependency among minerals is equivalent
Table 5. Input data and errors for single matrix A. Table 6. Input data and errors for single matrix B.
Ilm St Ky/And Bt Chl Grt Pl MsIlm St Ky Bt Chl Grt Pl Ms
Ti 1.004 0.107 0.000 0.160 0.008 0.000 0.000 0.054 Ti 1.012 0.113 0.001 0.170 0.008 0.000 0.000 0.057
Al 0.000 17.840 1.995 3.520 2.915 2.009 1.170 5.740Al 0.003 17.826 1.982 3.520 2.902 1.991 1.106 5.616
Fe 0.972 2.946 0.007 2.400 2.267 2.490 0.000 0.142 Fe 0.974 3.127 0.013 2.500 2.223 2.367 0.000 0.126
Mn 0.010 0.028 0.000 0.010 0.006 0.253 0.000 0.001Mn 0.011 0.022 0.000 0.000 0.004 0.075 0.000 0.002
Mg 0.002 0.436 0.001 2.140 2.223 0.367 0.000 0.117 Mg 0.000 0.606 0.004 2.190 2.268 0.325 0.000 0.117
Ca 0.000 0.002 0.000 0.000 0.001 0.065 0.142 0.001Ca 0.000 0.002 0.000 0.000 0.002 0.059 0.095 0.000
Na 0.000 0.010 0.000 0.070 0.000 0.000 0.867 0.322 Na 0.000 0.006 0.000 0.080 0.001 0.000 0.819 0.395
K 0.000 0.003 0.000 1.690 0.003 0.000 0.003 1.438K 0.000 0.005 0.000 1.840 0.001 0.000 0.003 1.592
ErrorsErrors
Ti 0.004 0.023 0.001 0.010 0.002 0.004 0.004 0.019Ti 0.020 0.016 0.004 0.010 0.001 0.004 0.004 0.033
Al 0.004 0.089 0.004 0.160 0.039 0.013 0.023 0.039 Al 0.004 0.109 0.013 0.050 0.034 0.036 0.006 0.118
Fe 0.004 0.107 0.005 0.070 0.020 0.094 0.004 0.021Fe 0.004 0.061 0.004 0.140 0.020 0.042 0.004 0.044
Mn 0.014 0.005 0.004 0.001 0.002 0.029 0.004 0.002 Mn 0.004 0.005 0.004 0.004 0.002 0.128 0.004 0.001
Mg 0.004 0.084 0.002 0.060 0.057 0.040 0.004 0.044Mg 0.004 0.049 0.004 0.120 0.055 0.061 0.004 0.005
Ca 0.004 0.002 0.004 0.001 0.001 0.015 0.019 0.001 Ca 0.004 0.002 0.004 0.004 0.001 0.029 0.007 0.001
Na 0.004 0.006 0.004 0.020 0.002 0.004 0.001 0.085Na 0.004 0.008 0.004 0.020 0.001 0.004 0.025 0.071
K 0.004 0.008 0.004 0.050 0.001 0.004 0.001 0.122 K 0.004 0.003 0.004 0.040 0.002 0.004 0.001 0.087
MULTI-STAGE PSEUDOMORPHIC REPLACEMENT OF GARNET 741
phism. The modified model matrix defines the mass noted by Hartel & Pattison (1996), another expla-nation is that plagioclase and garnet compositionsbalancemay exhibit continuous variations during reactions
0.301 Ilm+5.000 Al2SiO5+1.749 Chl+2.138Msthat cannot be accounted for when only one composi-tion is used in the matrix. Mass balance (6) is very+1.750 Grt=1.313 St+1.828Bt+0.857 Pl (5)similar to (4) in sample B, but has a much lower
Compared with mass balance (4), this has largercoefficient for garnet; it may indicate the progress of
coefficients for all phases, and contains Al2SiO5 andan andalusite-forming reaction where garnet is essen-
staurolite in a reversed position. As staurolite andtially refractory. Although (4) and (6) are the result of
biotite occur on one side, it can be interpreted as thequestionable models, it will be shown below that these
reaction forming staurolite in sample B. Because it isbalances are indeed relevant to the interpretation of
demonstrated that staurolite grows replacing kyanite,assemblages.
the Al2SiO5 in (5) should be interpreted as kyanite. Itis apparent that modelling this sample is problematic,
Sample Dsince two Al2SiO5 polymorphs occur: because of thetextural indication that kyanite is a disequilibrium
The 8×6 matrix D (Table 8) contains ilmenite,relict, any possible mass balance resulting from matrix
staurolite, Al2SiO5 (relict andalusite and sillimanite),analysis must be coupled with the Ky�And transition.
biotite, plagioclase and muscovite. Staurolite, presentin the rock as rare inclusions in muscovite, is includedin the input data as it may represent a nearly exhaustedSample Creactant. The initial matrix has rank 6 and does not
The 8×8 matrix C (Table 7) contains ilmenite,contain mass balances; rank reduction to 5 defines a
staurolite, andalusite, biotite, chlorite, plagioclase,model that is not acceptable because it contains very
muscovite and garnet; the latter was included in thehigh error ratios. As the system is defined by at least
matrix even if it is present in relict crystals. This matrixsix independent components, the six-phase assemblage
does not contain any mass balance, and rank reductionin sample D is at least divariant.
leads to a rank 7 model with six error ratios >1, oneof which is >2 (5.4). As they exceed 5% of the total,
Composite matrix A–Bthe model is not fully adequate to represent thecomposition matrix, and the mass balance that it
One of the problems of composite matrices is thatdefines
similar phases (e.g. Ms) are included twice, one foreach assemblage, producing incompatibilities with0.142 Ilmp+0.175 St+1.089 Chl+1.533Mslarge coefficients of opposite sign for a particular phase
+0.003 Grt=5.000 And+1.266Bt+0.551 Pl (6) and low coefficients for the others in a way such thatthe general result is, for example, BtA=BtB. Althoughmust be evaluated with caution. High error ratios arethese relations have a poor significance, the choice wasrestricted to the Ca and Mn rows, and may indicatemade not to omit phases except for ilmenite andthat reported concentrations and errors are not fullyAl2SiO5, which have been considered only once inrepresentative of the chemical system. Because Ca andeach composite: when searching for incompatibilities,Mn mostly occur in plagioclase and garnet, thisthe program allows them to be computed eitherinadequacy may be related to a poor knowledge andas reactants or products.description of zoning in these minerals. However, as
Table 8. Input data and errors for single matrix D.Table 7. Input data and errors for single matrix C
Ilm St And Bt Chl Pl Ms Grt Ilm St Al2SiO5 Bt Pl Ms
Ti 1.025 0.105 0.001 0.280 0.000 0.046Ti 1.025 0.099 0.001 0.170 0.006 0.000 0.028 0.000
Al 0.000 17.936 2.000 3.500 2.843 1.162 5.752 1.998 Al 0.000 17.934 2.003 3.610 1.219 5.845
Fe 0.918 2.755 0.007 2.730 0.000 0.102Fe 0.918 3.041 0.008 2.490 2.182 0.000 0.100 2.239
Mn 0.050 0.062 0.000 0.010 0.015 0.000 0.001 0.305 Mn 0.050 0.109 0.000 0.020 0.000 0.001
Mg 0.002 0.421 0.002 1.750 0.000 0.091Mg 0.002 0.559 0.002 2.130 2.247 0.000 0.099 0.263
Ca 0.000 0.001 0.000 0.000 0.001 0.142 0.002 0.175 Ca 0.000 0.001 0.000 0.000 0.170 0.001
Na 0.000 0.012 0.001 0.060 0.773 0.220Na 0.000 0.005 0.000 0.120 0.002 0.817 0.414 0.000
K 0.000 0.003 0.000 1.680 0.003 0.005 1.386 0.000 K 0.000 0.001 0.000 1.750 0.005 1.520
Errors Errors
Ti 0.004 0.023 0.004 0.020 0.003 0.004 0.012 0.004 Ti 0.004 0.035 0.001 0.050 0.004 0.032
Al 0.004 0.127 0.013 0.070 0.054 0.064Al 0.004 0.137 0.006 0.080 0.059 0.018 0.058 0.016
Fe 0.004 0.102 0.002 0.130 0.042 0.004 0.014 0.039 Fe 0.004 0.093 0.005 0.070 0.004 0.011
Mn 0.004 0.015 0.004 0.004 0.004 0.001Mn 0.004 0.008 0.004 0.004 0.002 0.004 0.001 0.010
Mg 0.004 0.077 0.004 0.080 0.108 0.004 0.016 0.011 Mg 0.004 0.047 0.002 0.070 0.004 0.014
Ca 0.004 0.001 0.004 0.004 0.022 0.001Ca 0.004 0.002 0.004 0.004 0.001 0.014 0.004 0.040
Na 0.004 0.005 0.004 0.030 0.003 0.015 0.022 0.004 Na 0.004 0.015 0.004 0.030 0.056 0.072
K 0.004 0.002 0.004 0.040 0.002 0.074K 0.004 0.004 0.004 0.040 0.003 0.001 0.062 0.004

742 B. CESARE
The 8×14 A–B matrix has rank 8 and contains, have GrtA>GrtB and ilmenite in A. One iswithout rank reduction, 2002 mass balances; 2002 is
4.579 St+0.967 Chl+0.520 Grt+0.664 Ms+0.141 Ilmthe result of:
+1.256 Ky=5.000 St+0.633 Bt+0.224 Pl (8)m!
(R!(m−R)!), which has the net result
0.97 Chl+0.52 Grt+0.66 Ms+0.14 Ilm+1.26 Kywhere m and R are phases and rank of matrix. Eachmass balance involves by definition (R+1) phases, less =0.42 St+0.63 Bt+0.22 Pl (8a)than the full composite assemblage, and represents
and is similar in form (with different coefficients) tothe linear combination of only (m−R) independentincompatibility (5) of matrix B.relations, in the present case nine and six, respectively.
Because of this combination process, groups of incom-patibilites may show similar form and similar Composite matrix B–Ccoefficients, in turn involving different phases, generally
The 8×14 B–C composite contains 2002 mass bal-with low coefficients. As they may represent sub-ances, of which 119 are incompatibilities. As most ofreactions in the transition between samples, thesethem represent mass balances such as PlB=PlC orincompatibilities can be combined to achieve anMsB=MsC, only those that contain andalusite withintegrated mass balance that more closely approxi-fairly large coefficient (>0.7) and BtB<BtC have beenmates the actual reaction (Hartel & Pattison, 1996).considered, because petrographic study indicates thatAllowing ilmenite to participate on either side ofthese two minerals increase in amount in sample C.mass balance, and imposing Al2SiO5 as andalusite inOf the 26 incompatibilities so found, all have StB≥StC,B, 13 incompatibilities are found. Consequently, A andChlB≥ChlC, GrtB≥GrtC and MsB>MsC; plagioclase isB intersect in composition space, and must havegenerally absent, or has a very low coefficient (≤0.1).equilibrated under different external conditions. AllIlmenite can occur both in B or C. One group ofincompatibilities have a similar form, with BtA<BtB,incompatibilities is ilmenite- and plagioclase-free, andMsA>MsB, ChlA>ChlB, StA≥StB, GrtA≥GrtB; ilmen-can be represented by the relation (B on the left side)ite is always present in A, and plagioclase is generally
absent or present with small coefficients in either A or0.158 St+4.265 Bt+0.475 Chl+0.069 Grt+2.836 MsB. One of them (assemblage A on the left side) is
=3.047 And+5.000 Bt+0.023 Grt+2.084 Ms (9)0.195 St+1.414 Chl+0.015 Grt+5.000 Ms
which has a net result+0.194 Ilm=3.057 And+0.150St
0.16 St+0.47 Chl+0.05 Grt+0.75Ms+1.499 Bt+3.775 Ms (7)
=3.05 And+0.73 Bt (9a)Lang (1991) reduced such relations to ‘net massbalances’ by eliminating phases with similar composi- and is similar to (5a). A second group of similartions on opposite sides of the mass balance relation relations has the model form:(Bt, St, Ms). This procedure is not strictly rigorous,
0.164 St+4.426 Bt+0.562 Chl+0.639 Ms+0.039 Ilmbecause the phases are similar but not identical, andthus any information about exchange reactions is lost. =2.839 And+5.000 Bt+0.216 Chl+0.009 Pl (10)However, such net balances may be useful as they aremore similar to the usual notation of continuous which has a net resultreactions, providing easier monitoring of reactants,
0.16 St+0.35 Chl+0.64 Ms+0.04 Ilmproducts and modal changes. In the case of massbalance (7), a reduction of this type leads to the net =2.84 And+0.57 Bt+0.01 Pl (10a)result
All these balances have similar net coefficients for0.04 St+1.41 Chl+0.01 Grt+1.23 Ms biotite, chlorite and muscovite, small (<0.2) coefficients
for staurolite and garnet, even smaller (<0.1) for+0.19 Ilm=3.06 And+1.50 Bt (7a)plagioclase and ilmenite, and would correspond to theunivariant tie-line break St+Chl=And+Bt in theAll the other net balances have similar coefficients for
chlorite, andalusite, muscovite and biotite, with small, AFM system. They are similar to (9a) and also to (6)in the single matrix C, but have a much lowervariable coefficients for staurolite, garnet and plagio-
clase. None of the incompatibilities in the composite coefficient for plagioclase; as noted earlier, this differ-ence may be related to the use of only one plagioclasematrix A–B contain both Al2SiO5 in B and StA<StB.
On the other hand, if kyanite (abundant in A) is composition in the single matrices, whereas the com-posites contain two of them and may better describemodelled as the Al2SiO5 polymorph, 21 StB-forming
(StA<StB) incompatibilities are found, and all of them continuous chemical variations. Nine incompatibilities

MULTI-STAGE PSEUDOMORPHIC REPLACEMENT OF GARNET 743
contain ilmenite in C, such asDISCUSSION
0.081 St+0.300 Chl+0.006 Grt+0.025 Pl+5.000 Ms The approach undertaken in this study differs fromthat of other analyses (e.g. Giaramita & Day, 1991;=0.096 Ilm+1.300 And+0.398 Bt+4.706 Ms (11)Lang, 1991), where within-outcrop variations were
which has a net result investigated to understand whether differences inassemblages could relate to changes in bulk composi-0.08 St+0.30 Chl+0.01 Grt+0.03 Pl+0.29 Mstion or in metamorphic conditions. In the present case,
=0.10 Ilm+1.30 And+0.40 Bt (11a) the four samples are distributed along a 1 km traverse,and differ either weakly or significantly in contact
Compared to incompatibilities where ilmenite occursmetamorphic grade. It is apparent that their external
in B, these have lower coeefficients for andalusite,conditions of equilibration (i.e. temperature) were
biotite, chlorite and muscovite, and involve a lowerdifferent and are responsible, at least in part, for the
amount of mass.changes in mineral assemblages. Exploration of massbalances is used here to analyse the compositional and
Composite matrix C–D reaction relationships among samples.
The 8×12 composite matrix C–D contains 220 massbalances, eight of which are incompatibilities. Four of Bulk composition relationshipsthem do not contain Al2SiO5 and have a very similar
Based on the microstructures observed in samplesform, with ilmenite in C, MsC>MsD, StC<StD, A–D, interpreted as stages in a sequence of pseudo-BtC<BtD, and PlC<PlD. One is (C on the left side)
morphs after garnet, and on the fact that these texturesonly occur in the rock layers where the samples were0.448 Ilm+4.512 St+0.855 Chl+2.051 Ms+0.837 Grtcollected, Cesare (1999) proposed that the samples
=5.000 St+1.574 Bt+0.912 Pl+0.062 Ms (12) belong to a common rock type. The similarity ofnormalized oxide values is an argument in favourThe net result of this incompatibility can be expressedof such hypothesis: in fact, from a graphical point ofasview, it can be observed that in the model KFMASH
0.45 Ilm+1.99 Ms+0.86 Chl+0.84 Grt system (Fig. 2) all bulk compositions nearly overlap inthe small intersection volume common to all assem-=0.49 St+1.57 Bt+0.91 Pl (12a)blages. Exploration of bulk composition relationships
where the coefficients refer to the particular case of in the full multi-component system has also been(12), and differ only slightly in the other mass balances. approached by matrix analysis. Because the existenceTwo incompatibilities contain Al2SiO5 on the D side, of incompatibilities in the composites implies intersec-such as tion of assemblages, the samples belong to different
mineral facies. However, this does not tell us much0.581 Ilm+4.915 St+2.562 Bt+0.832 Grt+1.557 Ms about bulk composition relationships, which can lie
anywhere within the space defined by their assemblages,=5.000 St+1.816 Sil+3.695 Bt+0.899 Pl (13)and still be very different; likewise in the compatibility
which has the net form situation. What incompatibilities tell is that assem-blages may be similar (or even equal), i.e. lie in the0.58 Ilm+0.83 Grt+1.56 Msintersection of assemblage spaces. To verify whether
=1.82 Sil+0.09 St+1.13 Bt+0.90 Pl (13a) bulk compositions lie in the intersection volume in thefull Ca–Na–Mn–Ti–KFMASH system, one should
Two other incompatibilities contain Al2SiO5 on the Ccompare each assemblage with the remaining three
side, such asbulk compositions (i.e. analyse the 12 compositematrices assemblagesample=i+bulksample≠i) and always0.105 Ilm+2.338 St+5.000 And+2.482 Pl+0.566 Grtfind incompatibilities. It turns out that no incompati-
+0.166 Ms=2.965 St+0.133 Bt+2.671 Pl (14) bilities exist among assemblages and compositions ofother samples (e.g. assemblageA+bulkB), implying thatwhich has the net formthe samples do not lie in the intersection of assemblages
0.11 Ilm+5.00 And+0.57 Grt+0.17 Ms in the full multi-component system. However, it wasalso found that no incompatibilities exist between=0.63 St+0.13 Bt+0.19 Pl (14a)assemblage C and its own bulk composition, whichwould suggest that the bulk composition lies outsideAll these relations indicate that C and D intersect in
composition space, but do not help to constrain the the space defined by the assemblage. As this isimpossible, the most plausible reason is that theevolution between assemblages. In fact, all contain
StC<StD and would imply a net increase of staurolite measured compositions are not fully representative ofthe chemical variations of phases (because of zonedin sample D, the opposite of textural evidence.

744 B. CESARE
minerals such as garnet and plagioclase), and that the that it represents more than a simple mass balanceequation, and can be accepted as a good approximationestimated errors are not able to correct for this
incompleteness. Another explanation is that the rocks to the reaction occurring in sample C.The absence of mass balances in the single matrixare not homogeneous.
Thus it can be concluded that the study samples are D indicates that no reaction relationships exist, becausethe assemblage occupies a divariant field in composi-not identical, but are very similar, at least as far as the
model pelitic system is considered, and that non-AFM tional space. With regard to the composite C–D, allthe incompatibilities would suggest consumption ofcomponents account for the departure of bulk composi-
tions from the compositional volume defined by muscovite and ilmenite (±Chl±Grt), and growth ofbiotite, plagioclase and staurolite. As the latter indi-intersection of AFM assemblages. Among the non-
AFM components, Na2O has the largest relative cation is not consistent with petrographic evidence ofstaurolite dissolution, these incompatibilities (or anyvariations (Table 3), with sample D showing a very
low value. A possible explanation, other than a primary combination of them) cannot represent the transitionbetween samples C and D. Thus, reaction (2) inferreddifference, for the low Na2O content of D may be syn-
metamorphic Na depletion by base-cation leaching from the basis of textural evidence could not be verifiedby matrix analysis.(Vernon, 1987). This is supported by the occurrence
of dissolution textures involving quartz and plagioclasealong high-strain zones abutting fibrolite-rich folia Andalusite–staurolite relationships in samples B and C(Cesare, 1999). In this case, the low Na2O content ofsample D would represent an inherited characteristic A problem arising from textural analysis of sample B
was whether andalusite and staurolite could havethat does not reflect the primary compositionalrelationships among samples. grown at the same time, in contrast with the theoretical
behaviour of the model pelitic system (e.g. Thompson,1976) which predicts that staurolite should be reactant
Reaction relationshipsfor the growth of biotite and andalusite. Mass balancesin the single matrices B and C, and incompatibilites inReaction relationships can be approached by matrix
analysis of both single and composite matrices: mass the composite B–C have two general forms: on onehand the kyanite-consuming, staurolite-producingbalances identified in single matrices can indicate either
disequilibrium relationships or univariant reactions; reaction (5); on the other hand the andalusite-producing, staurolite-consuming reactions (4), (6), (9)on the other hand, incompatibilities in a composite
matrix may represent the actual reactions changing or (10). Because the B–C matrix could not accountfor the Ky�And transition, for a reaction to beone facies assemblage into the other. As noted by
Greenwood (1967), ‘reactions so deduced are ordinarily meaningful both Al2SiO5 polymorphs have to bepresent, one on each side. Combining the two types ofnot stable reactions, and are likely to include in one
step a number of stable and metastable steps’. incompatibilities reveals interesting information on thebehaviour of staurolite in these rocks. If (4) and (5)Nonetheless, the importance of mass balances deter-
mined by matrix analysis is not diminished, as these are added together, the resulting relation has the netformare able to describe the chemical changes occurring in
the transition from two metamorphic facies, disre-Ky+Ilm+Chl+Grt+Ms=And+St+Bt+Plgarding how the conditions defining them (P, T ,
chemical potentials) have changed. Thus, combining (15)information from single and composite matrices canhelp to reconstruct how the different assemblages and indicates that the staurolite produced by the
kyanite-consuming reaction is more than the staurolitedeveloped and whether they may have derived fromone another. This approach is also helpful in verifying required by andalusite production. Such a combined
mass balance confirms the possibility that staurolitethe validity of mass balances such as (4) and (6) thatresulted from uncertain models. and andalusite grew at the same time in sample B, and
the textural observations of Cesare (1999) who pro-Samples A and B contain phases (Ky & Grt) thatare in clear textural disequilibrium. The incompatibilit- posed the AFM reaction (1) as the transition between
A and C. Because at least one metastable phase (Ky)ies in the single matrices reflect this situation and thefact that kyanite and garnet are reactant in staurolite- is involved, these relations do not represent equilibrium
reactions nor the final stage of equilibration of theforming reactions such as (3) and (5). Mass balances(4) and (6) in the single matrices B and C provide And–St–Bt assemblage. The latter can be evaluated by
analysis of incompatibilities in the single matrix C,information on andalusite formation, indicating expan-sion of the AFM relationship St+Chl=Bt+And to a where kyanite does not occur. Relationships such as
(6) indicate that, after kyanite disappearance, andalus-more complex 10-component system. In the case ofmatrix C, incompatibility (6) was shown to result from ite growth occurs via staurolite consumption, e.g. that
in the final stages of equilibration, staurolite is aa questionable model. However, its similarity to (9)and (10) in the composite B–C supports the conclusion reactant.

MULTI-STAGE PSEUDOMORPHIC REPLACEMENT OF GARNET 745
or all phases in the composite, and in closer approxi-Ionic reaction cycles during development of assemblage D
mation to the observed textures. However, thesemethods will not result in the definition of a uniqueBased on the modal changes observed between C and
D, namely on the consumption of staurolite and reaction, which can only be retrieved if samples sharea common, known, bulk composition.chlorite, decrease of muscovite, and increase of biotite
and sillimanite, reaction (2) was proposed as a possiblemodel for the prograde evolution from C to D. This
ACKNOWLEDGEMENTSreaction is in contrast with the textural evidence ofmuscovite growth after staurolite in the nodules of Many thanks to G. Fisher for providing the matrix
analysis programs, reading the manuscript and dis-sample D. Such seeming inconsistency could beexplained if (2) or any other reaction linking the two cussing the general aspects of assemblage investigation,
and to M. Ballevre, J. Connolly and M. Guiraud forsamples occurred via an ionic reaction mechanism(Carmichael, 1969), in which simultaneous sub- their comments. Thorough reviews by D. Pattison and
C. DeBuhr pointed out some important conceptualreactions take place in the different domains of therock. In this perspective, muscovite is consumed in the errors and are particularly acknowledged. The patient
editorial handling by D. Robinson was also very muchmatrix, whereas is produced in the nodules, in such away that the net balance is consumption. appreciated. Financial support from MURST and
CNR. Support for microprobe analysis at the IMP-All the incompatibilities found in the compositematrix C–D contain MsC>MsD, and support the ETH, Zurich.occurrence of a muscovite-consuming net reaction suchas (2). This implies that even if this phase grows in the REFERENCESnodules of sample D, a larger amount must have
Bellieni, G., Peccerillo, A. & Poli, G., 1981. The Vedrette di Riesdissolved in the adjacent matrix. It can be concluded(Rieserferner) plutonic complex: petrological and geochemicalthat matrix analysis of assemblages agrees withdata bearing on its genesis. Contributions to Mineralogy and
microstructural evidence for redistribution of minerals Petrology, 78, 145–156.in the rock in a manner that compares to the reaction Borsi, S., Del Moro, A., Sassi, F. & Zirpoli, G., 1973.
Metamorphic evolution of the Austridic rocks to the south ofmechanism proposed by Carmichael (1969). In thisthe Tauern window (Eastern Alps). Radiometric and geo-way, prograde pseudomorphs of muscovite afterpetrologic data. Memorie della Societa Geologica Italiana,
staurolite can occur even in the case of net consumption 12, 549–571.of both phases. Carmichael, D. M., 1969. On the mechanism of prograde
metamorphic reactions in quartz-bearing pelitic rocks.Contributions to Mineralogy and Petrology, 20, 244–267.
Cesare, B., 1999. Multi-stage pseudomorphic replacement ofCONCLUSIONSgarnet during polymetamorphism: microstructures and their
This work highlights both the effectiveness and the interpretation. Journal of Metamorphic Geology, 19, 727–737.Fisher, G. W., 1989. Matrix analysis of metamorphic minerallimits of the matrix analysis approach in modelling
assemblages and reactions. Contributions to Mineralogy andmineral reactions. As calculated mass balances containPetrology, 102, 69–77.
by definition R+1 phases, a unique solution to the Fisher, G. W., 1990. The exploration of reaction space. In: Fluid–problem of calculating a balanced univariant reaction Mineral Interactions: a T ribute to H.P. Eugster (eds Spencer,
R. J. & Chou, I.-m.). Geochemical Society Special Publications,can only be obtained with matrices where R=m−1.2, 133–139.This condition is easier to obtain with single matrices,
Fletcher, C. J. N. & Greenwood, H. J., 1979. Metamorphismas in samples A, B and C, although single matrices and structure of Penfold Creek area, near Quesnel Lake,may suffer from the problem of fully describing the British Columbia. Journal of Petrology, 20, 743–794.
Giaramita, M. J. & Day, H. W., 1991. Buffering of H2O inchemical features of the system and phases, especiallystaurolite–aluminium silicate–biotite–garnet–chlorite assem-when dealing with zoned minerals. Incomplete infor-blages. Journal of Metamorphic Geology, 9, 363–378.
mation on chemical composition of phases may result Gordon, T. M., Ghent, E. D. & Stout, M. Z., 1991. Algebraicin questionable models and unreliable mass balances analysis of the biotite–sillimanite isograd in the File Lake
area, Manitoba. Canadian Mineralogist, 29, 673–686.that can be corrected by use of alternative methodsGreenwood, H. J., 1967. The N-dimensional tie-line problem.such incorporation of exchange vectors (e.g. Hartel &
Geochimica et Cosmochimica Acta, 31, 465–490.Pattison, 1996). Composite matrices generally have an Guidotti, C. V., 1970. The mineralogy and petrology of theexcess number of phases, so that the incompatibilities transition from the lower to upper sillimanite zone in the
Oquossoc area, Maine. Journal of Petrology, 11, 277–336.do not relate all phases from each sample and in mostHartel, T. H. D. & Pattison, D. R. M., 1996. Genesis of thecases provide only information on the possible intersec-
Kapuskasing (Ontario) migmatitic mafic granulites by dehy-tion in composition space. In this case, inspection of dration melting of amphibolite: the importance of quartzmass balances for systematic patterns (e.g. the coherent to reaction progress. Journal of Metamorphic Geology, 14,
591–611.behaviour of staurolite, chlorite, garnet and muscoviteLang, H. L., 1991. Quantitative interpretation of within-outcropin the composite B–C) can provide qualitative infor-
variation in metamorphic assemblage in staurolite-kyanite-mation on the first-order general form of reaction(s).grade metapelites, Baltimore, Maryland. Canadian
Furthermore various forms of combination of incom- Mineralogist, 29, 655–671.Lang, H. M. & Rice, J. M., 1985. Regression modelling ofpatibilities may result in mass balances relating most

746 B. CESARE
metamorphic reactions in metapelites, Snow Peak, northern Thompson, A. B., 1976. Mineral reactions in pelitic rocks: I.Prediction of P–T –X (Fe–Mg) phase relations. AmericanIdaho. Journal of Petrology, 26, 857–887.
Pattison, D. R. M., 1987. Variations in Mg/(Mg+Fe), F, and Journal of Science, 276, 401–424.Tuisku, P., Ruostesuo, P. & Hakkinen, A., 1987. The metamor-(Fe,Mg)Si=2 Al in pelitic minerals in the Ballachulish thermal
aureole, Scotland. American Mineralogist, 72, 255–272. phic behaviour and petrogenetic significance of zinc inamphibolite facies, staurolite-bearing mica schists,Pigage, L. C., 1982. Linear regression analysis of sillimanite-
forming reactions at Azure Lake, British Columbia. Canadian Puolankajarvi Formation, Central Finland. Geochimica etCosmochimica Acta, 51, 1639–1650.Mineralogist, 20, 349–378.
Powell, R., 1990. Matrix analysis of metamorphic mineral Vernon, R. H., 1987. Growth and concentration of fibroussillimanite related to heterogeneous deformation inassemblages and reactions: alternatives and extensions.
Contributions to Mineralogy and Petrology, 106, 61–65. K-feldspar–sillimanite metapelites. Journal of MetamorphicGeology, 5, 57–68.Thompson, J. B., 1957. The graphical analysis of mineral
assemblages in pelitic schists. American Mineralogist, 42,842–858. Received 26 November 1997; revision accepted 7 June 1999.